At a glance
VPS (Video Preference Score) predicts which of two videos better matches a prompt and uses those probabilities to reconstruct generator rankings. It learns from public model Elo scores and social-video engagement, rather than new sample-level human labels. Arena-only training gives stronger held-out ranking reconstruction; adding real videos produces the stronger generator-training reward. The reported +51 Elo is a predicted-score improvement, supported by separate VideoScore2 evaluation and mixed VBench results.
Introduction
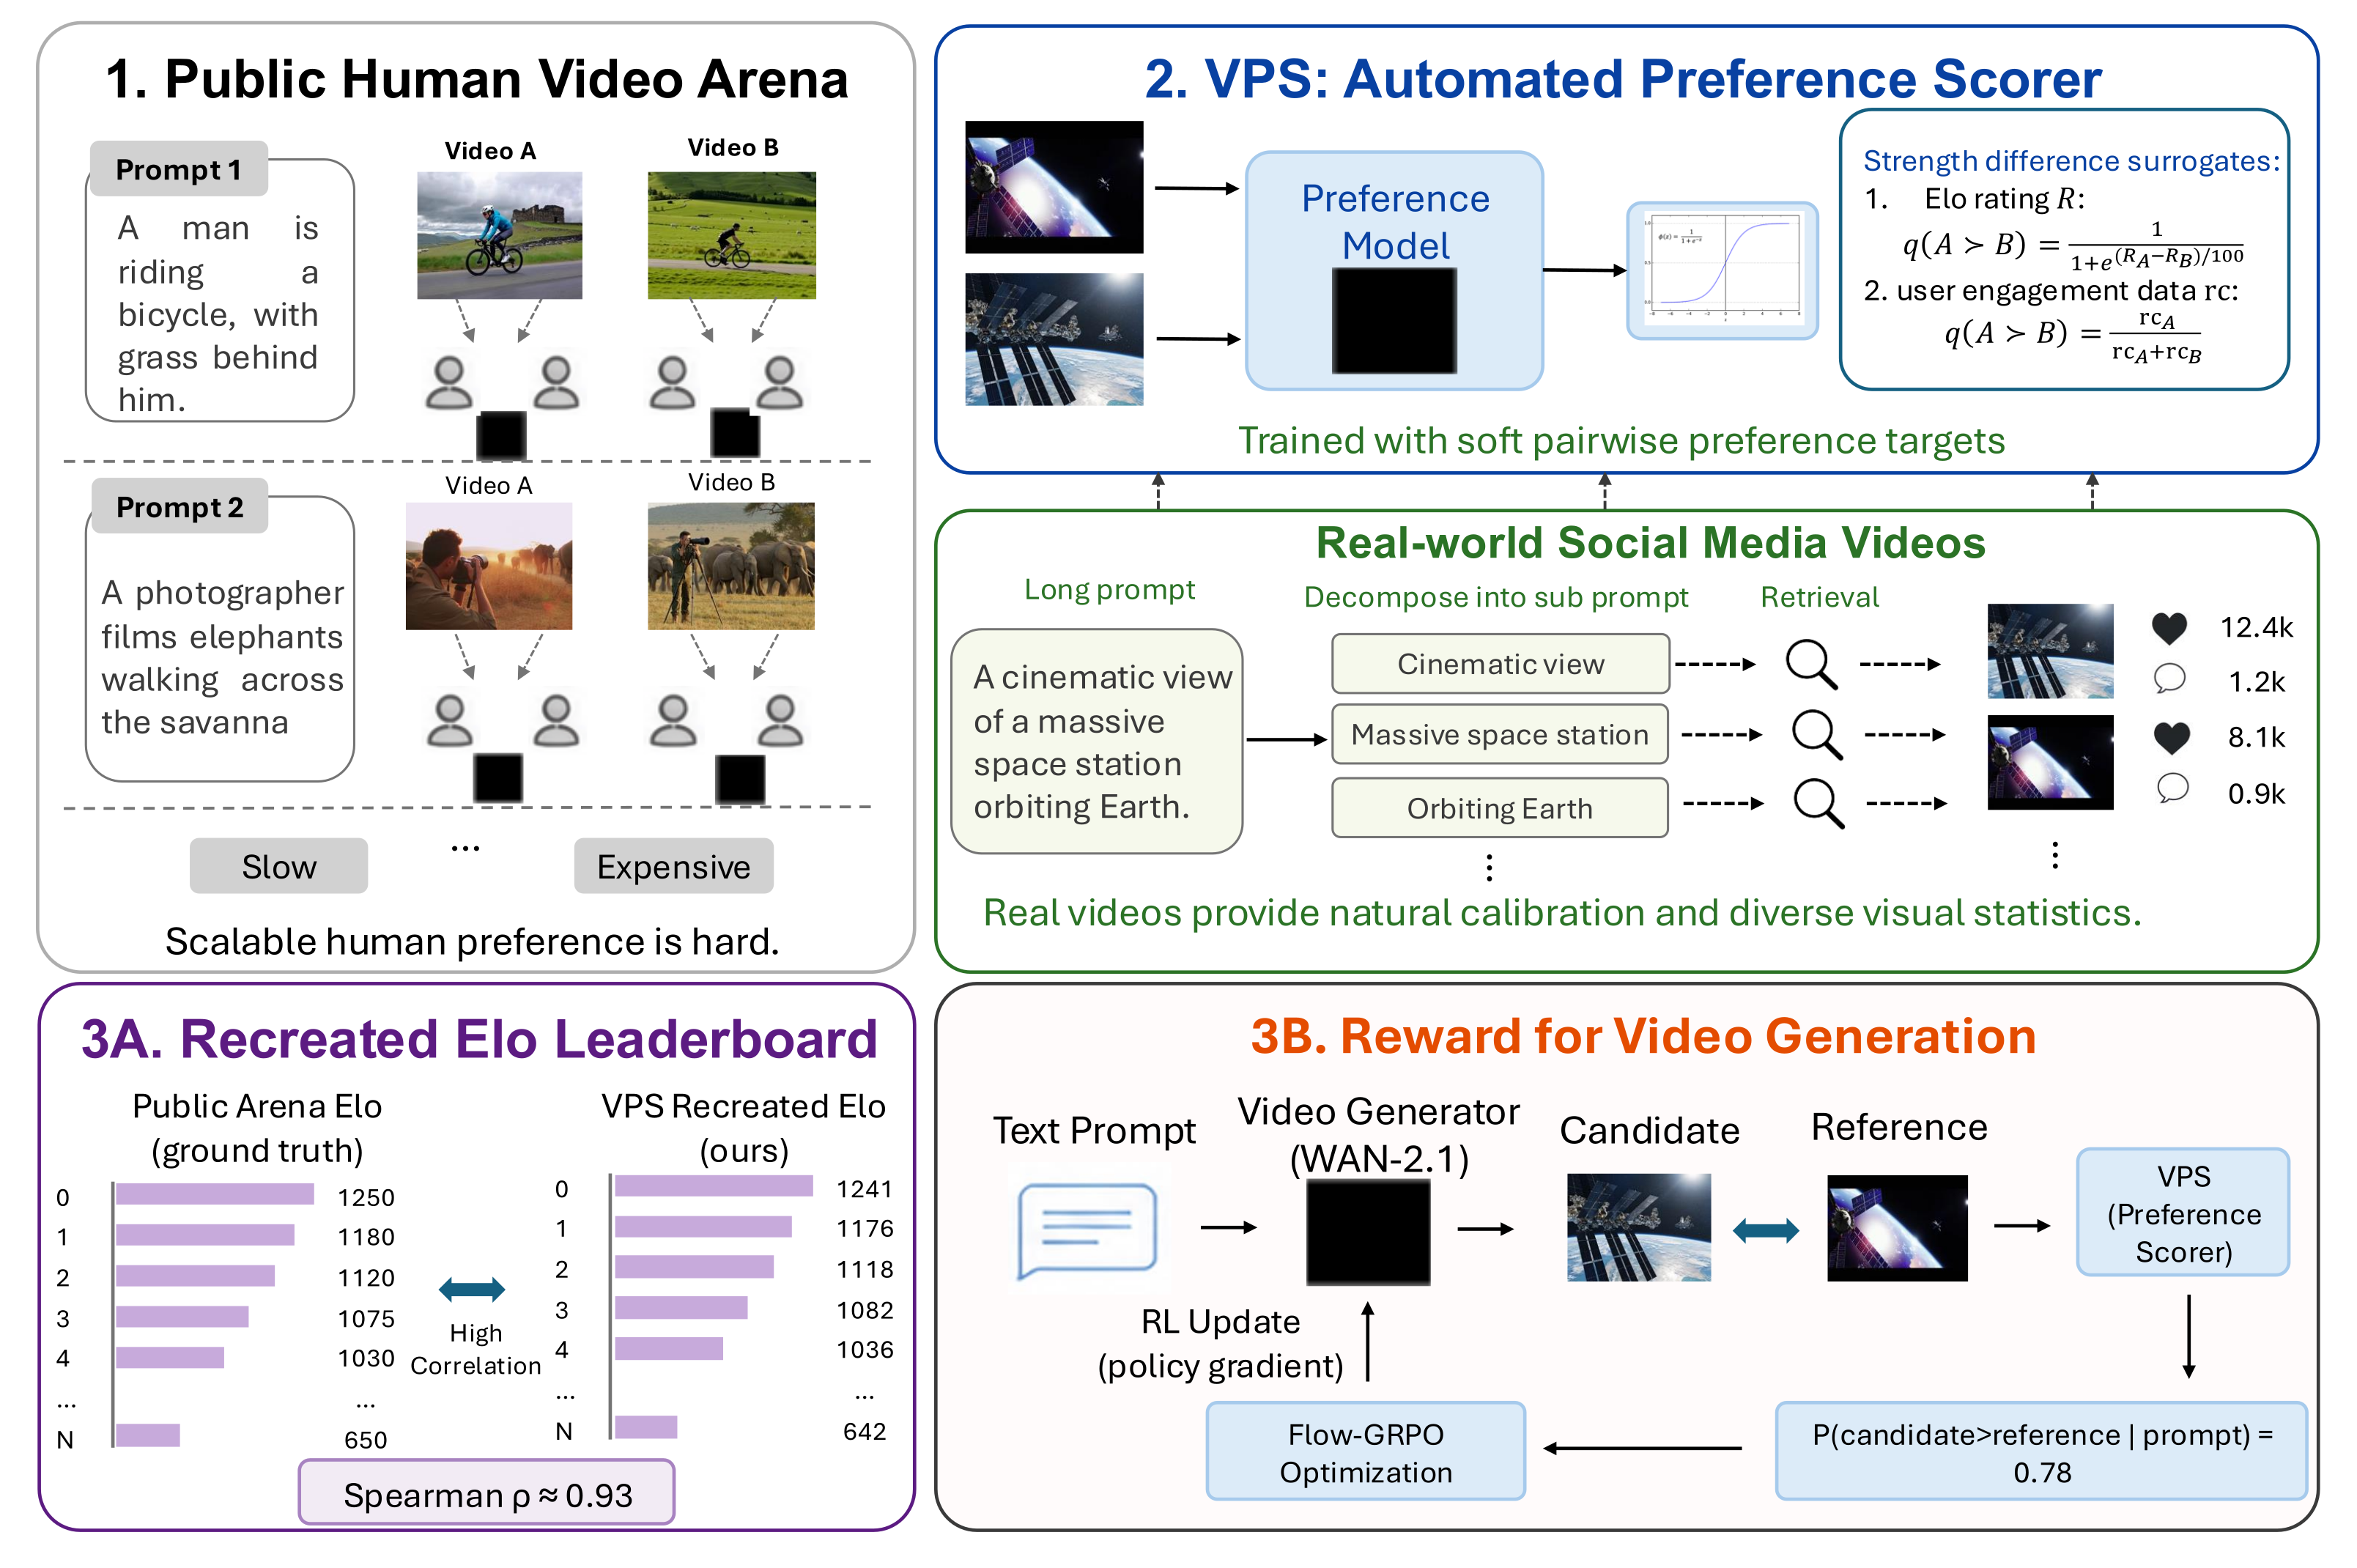
The paper asks whether computational pairwise comparisons can reproduce a public video arena without collecting another large human-vote sample. Fixed metrics capture selected quality dimensions, while human ratings depend on study population and interface. VPS combines generated and retrieved real videos to learn a prompt-conditioned comparison function, then applies it both to leaderboard reconstruction and generator fine-tuning. Figure 1 is a schematic: its illustrative correlation of approximately 0.93 is not the held-out result reported in Table 3.
Related Work
Distributional measures such as FVD need sufficient samples and depend on encoder quality and content bias; alignment or aesthetic metrics cover narrower dimensions. Multi-metric benchmarks broaden coverage but add complexity. Prior human-preference evaluators include pointwise VideoScore and fine-grained VisionReward; VPS instead learns a direct pairwise probability matching arena comparisons. Its supervision is weaker than independently labeled sample preferences. See FVD [26], VideoScore [10], and VisionReward [36].
Data Collection
The dataset combines generated–generated, real–real, and real–generated comparisons. Existing public rankings supply scalable supervision, while retrieved social videos add natural motion, camera behavior, and visual variety beyond the available generators.
Prompts
Prompts cover short VBench-style scenes/actions and longer Artificial Analysis descriptions containing multiple entities, attributes, temporal relations, and style constraints. The latter motivate decomposition during retrieval.
Generated videos from video arenas
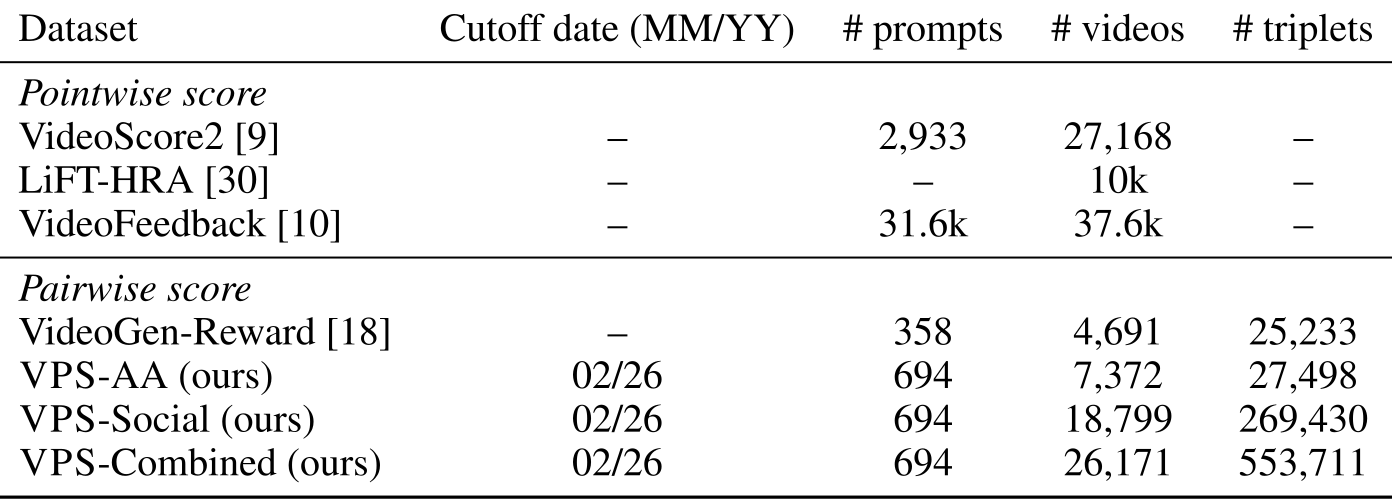
The Artificial Analysis collection contains 7,372 generated videos for 694 prompts, giving 27,498 within-prompt pairs. Each video retains its generating model and public Elo score. A model’s higher Elo makes its sample more likely to win the training comparison; it does not establish the quality of every individual sample.
Real-world videos from social media
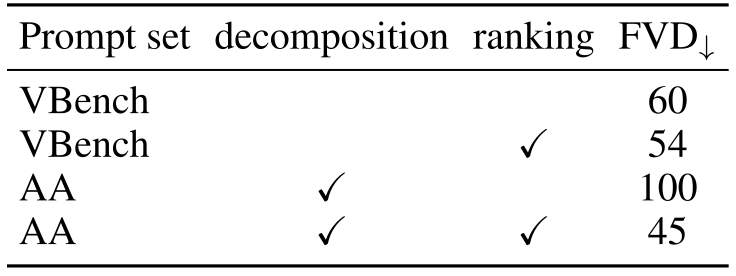
The retrieval interface returns videos, engagement metadata, and a relevant segment timestamp. Short prompts can be queried directly. Long prompts are decomposed into semantic components; candidates are pooled, rewarded for matching multiple subqueries, and tie-broken by retrieval rank. Table 1 reports FVD 60→54 for short prompts and 100→45 for the long-prompt retrieval comparison. FVD against generated videos is a proxy for retrieval quality, not a direct human relevance judgment. The original aggregation expression is retained below.
Equation

Data split & statistics
Default train/validation/test partitions are prompt-disjoint; a separate model-disjoint experiment tests withheld generators. The February 2026 snapshot has 18,799 social videos and 269,430 social pairs. Combining sources yields 26,171 videos and 553,711 total pairwise examples over the same 694 prompts. Pair counts include cross-source comparisons and should not be interpreted as independent human annotations.
Learning Automated Video Preference Score
Given a prompt and an ordered video pair, VPS outputs the estimated probability that the first video wins. The method separates target construction, learned comparison features, leaderboard reconstruction, and reward use.
Preference target construction
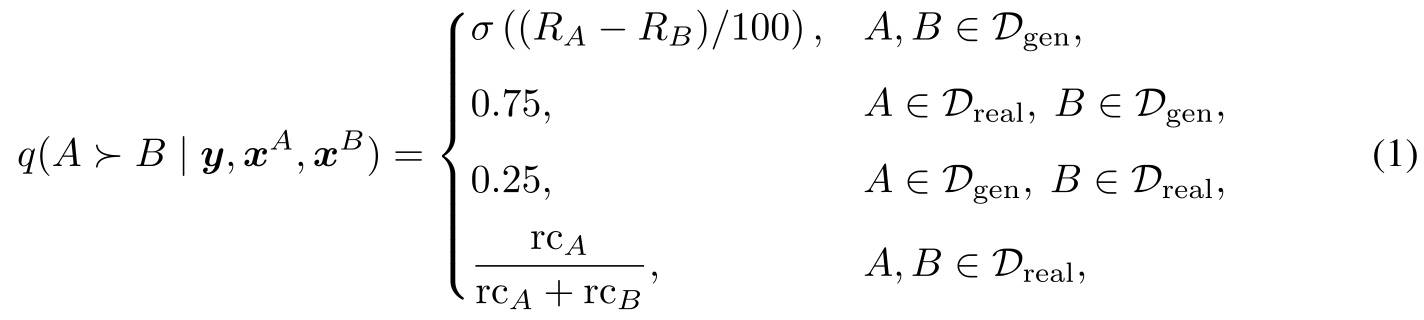
Generated–generated targets are sigmoid(Elo gap/100), following a Bradley–Terry comparison model [2]. Real–real targets normalize engagement counts within the pair, with 0.5 for two zero counts. Mixed pairs give the real video a fixed 0.75 winning probability, approximately a 110-point gap in this parameterization. This prior permits retrieval mistakes instead of forcing every real clip to win. Popularity and recommendation effects confound engagement, and model-level ranking confounds sample quality. Equation 1 gives the operative definition; the schematic formula in Figure 1 has a reversed exponent sign.
Equation
Preference model
Metric baselines concatenate normalized alignment, perceptual, quality, and rating features, then fit linear or MLP predictors. VPS uses 3,584-dimensional Qwen2.5-VL-7B video embeddings and a 384-dimensional MiniLM prompt embedding, followed by a multilayer comparison head. Ordered inputs retain which video is first. Soft binary cross-entropy trains the predictor; combined-data training weights arena pairs 10× to offset the much larger social/cross-source pool. AdamW uses learning rate and weight decay 10⁻⁵, batch size 256, dropout 0.35, validation-based early stopping and learning-rate reduction, with up to 1,000 epochs.
Equations



Evaluation: recreating arena leaderboards
Predicted pairwise probabilities are converted to scaled log-odds gaps. Least squares fits model scores whose differences match those gaps, then an affine calibration aligns scores to the public leaderboard. Evaluation uses rank correlations and rank-based comparisons over held-out arena pairs. The recovered scale is calibrated to the reference ranking; it is not an independently measured human Elo scale.
Equations



Application: VPS as a reward model
A generated video is compared with one cached, prompt-matched sample from the base WAN-2.1 generator. Its predicted win probability becomes a scalar reward, avoiding a large comparison pool and keeping the reference fixed within each prompt. Flow-GRPO [17] fine-tunes WAN-2.1 [27] using this external reward plus KL regularization against the reference policy.
Equation

Experiments and Findings
Experiments test leaderboard reconstruction, transfer across leaderboards and held-out models, and generator improvement. These are distinct evaluation settings; a score’s strongest arena correlation need not produce its strongest training reward.
Comparison of VPS with Existing metrics
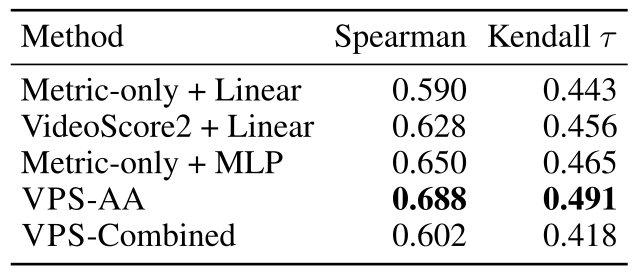
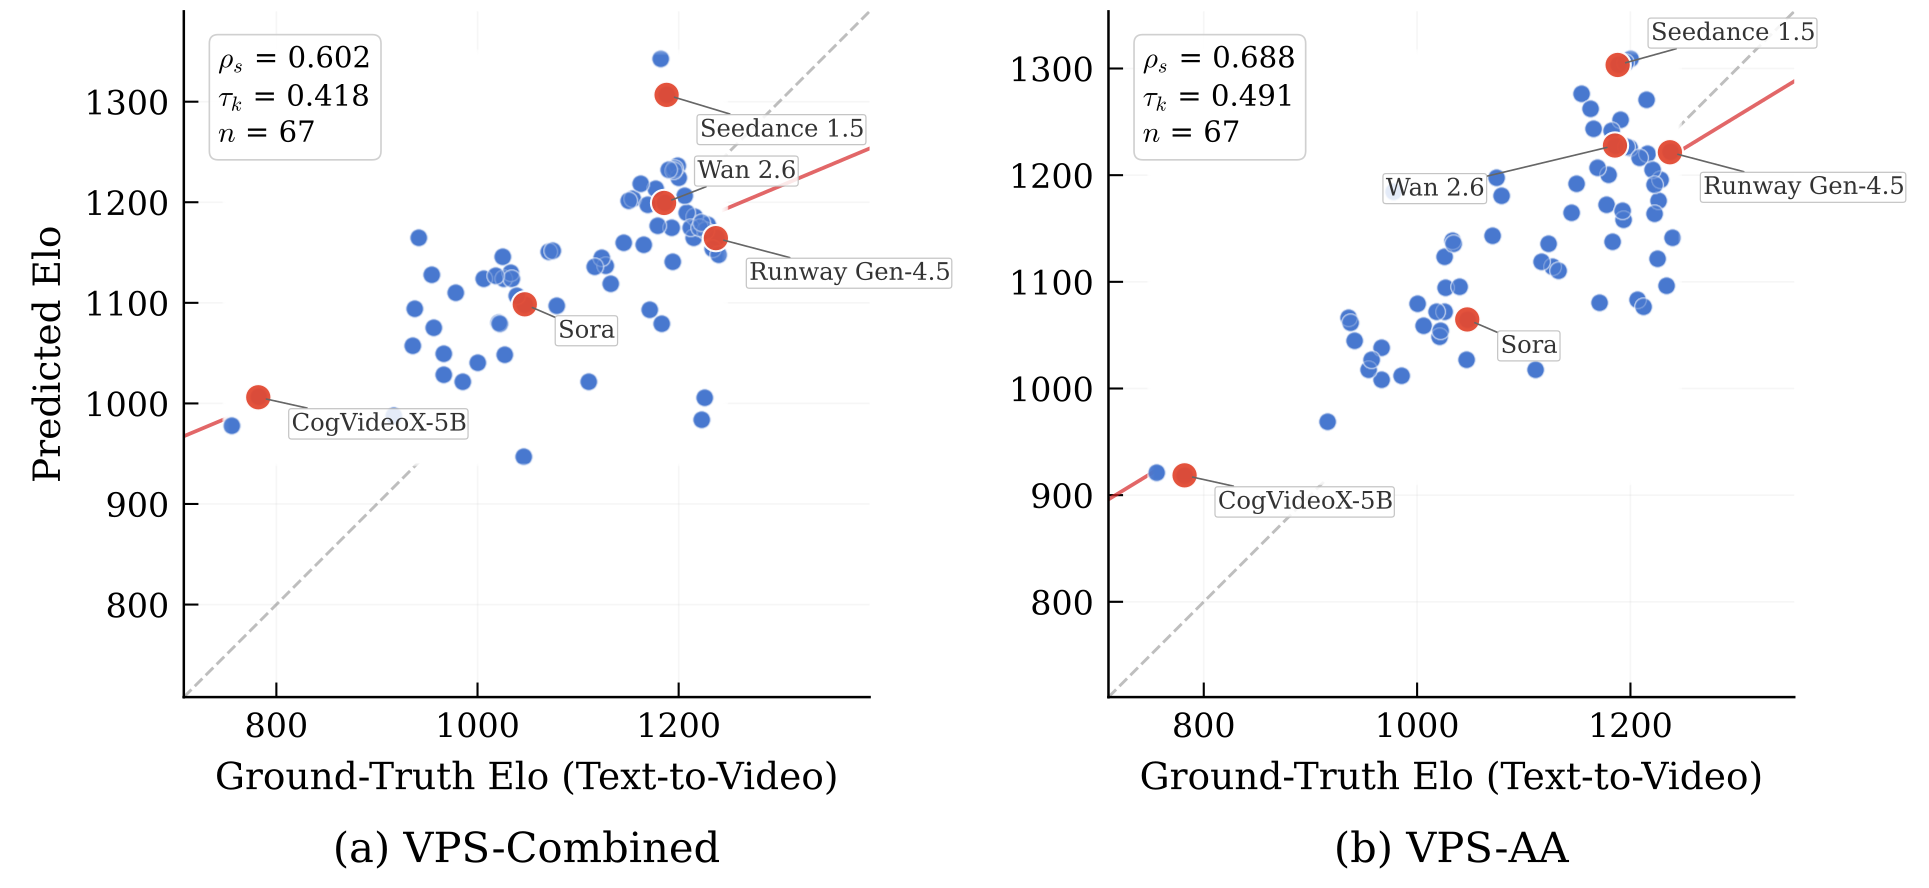
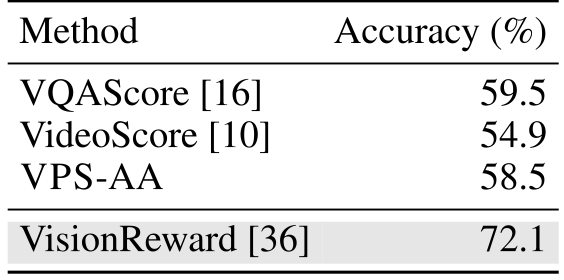
On held-out Artificial Analysis text-to-video comparisons, VPS-AA achieves Spearman 0.688 and Kendall 0.491, above the metric MLP’s 0.650/0.465. VPS-Combined falls to 0.602/0.418. On independent MonetBench sample comparisons, zero-shot VPS-AA reaches 58.5% accuracy, versus VQAScore 59.5% and VideoScore 54.9%. VisionReward’s 72.1% is an in-distribution reference, so it is a different transfer setting. Ranking recovery and sample-level preference prediction should therefore be read separately.
VPS recreates video arena and generalizes across leaderboards and models
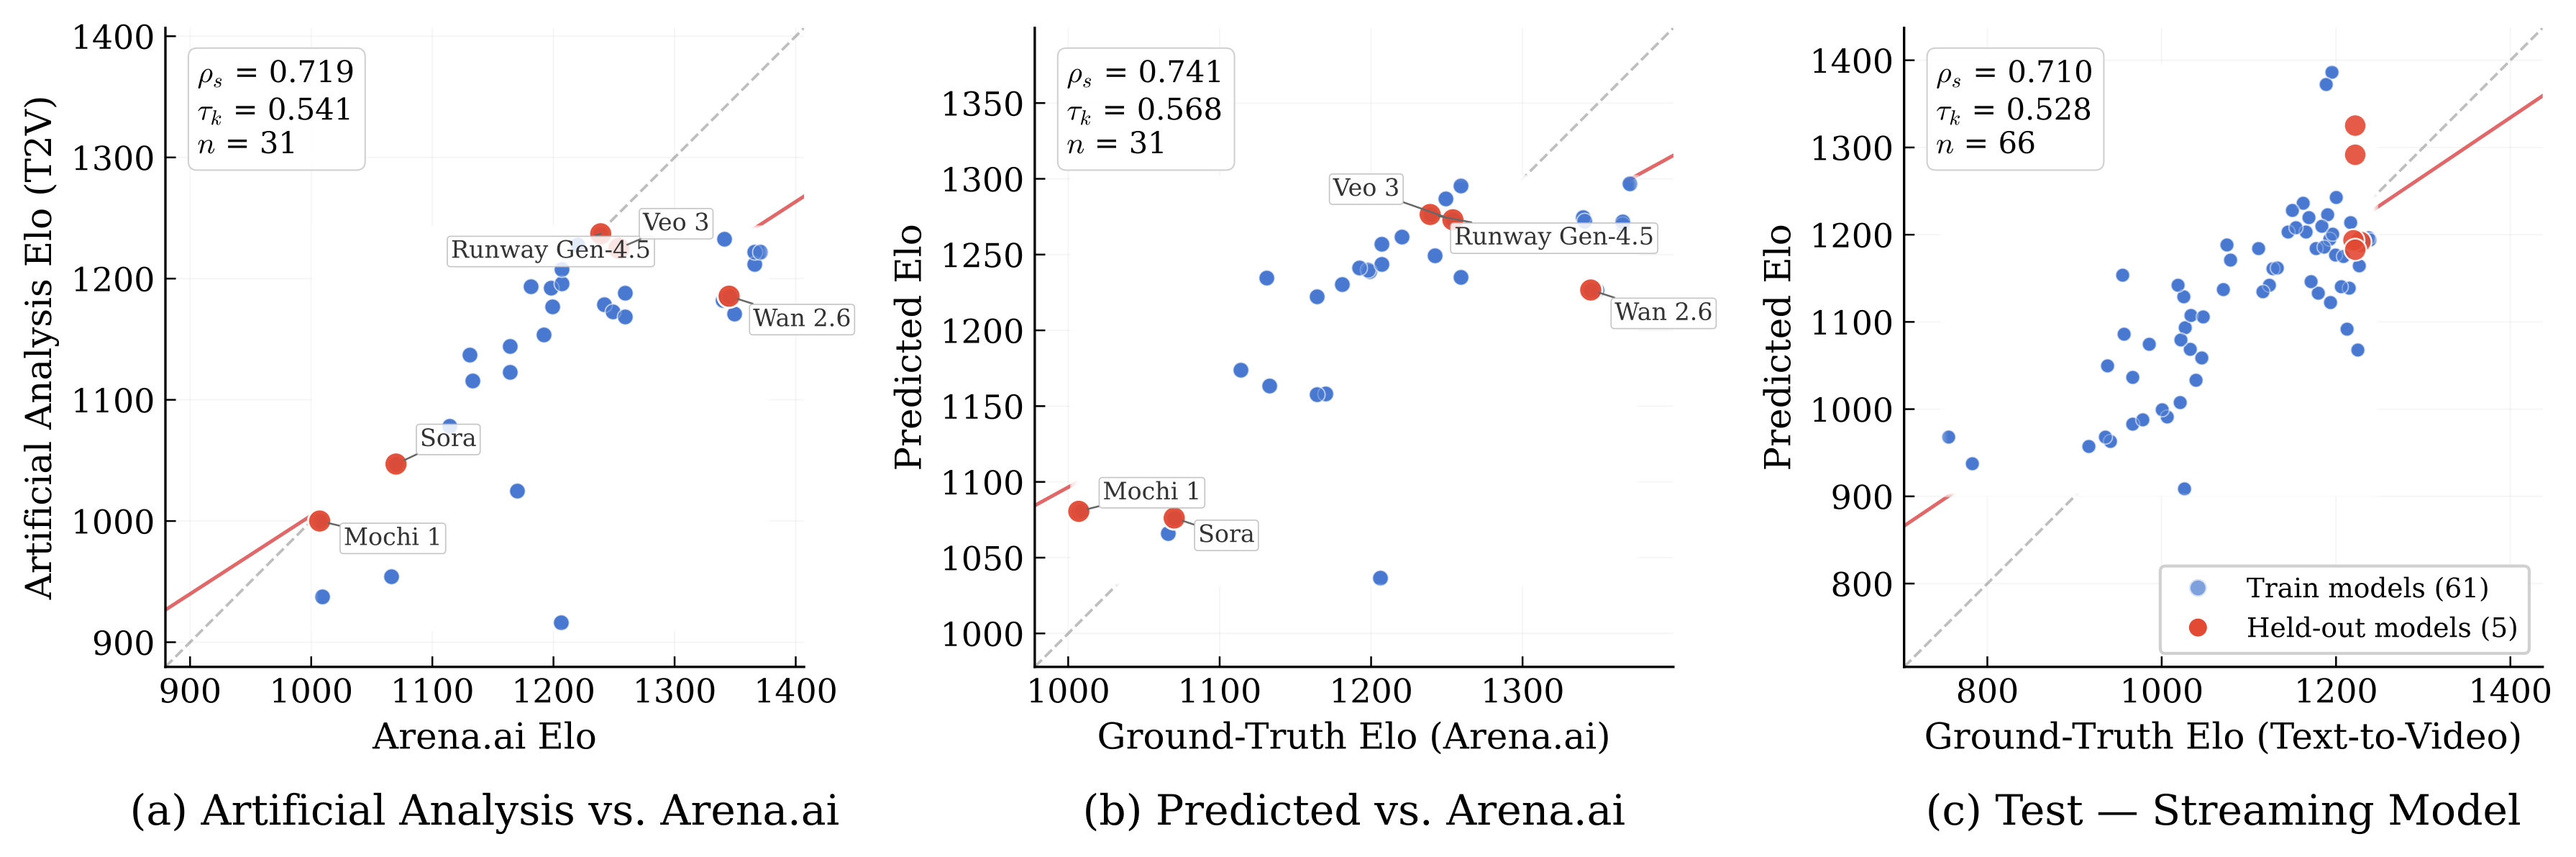
Across the 31 models shared by Artificial Analysis and Arena AI, VPS-Combined reaches Spearman 0.741 and Kendall 0.568 against Arena AI; the two original leaderboards correlate at 0.719/0.541. In the streaming-model experiment, five strong generators are withheld while 61 are training models. The reported 0.710/0.528 correlation is over all 66 plotted models, not just the five withheld ones. Withheld generators land near the top, but the scorer exaggerates some performance gaps.
VPS provides a useful reward signal for video generation
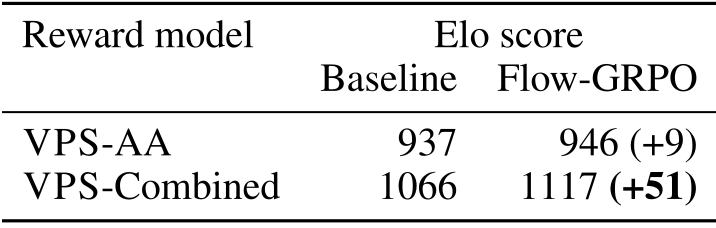
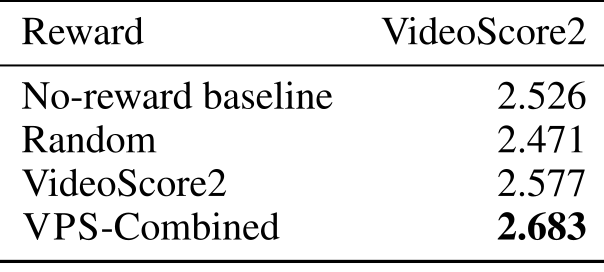
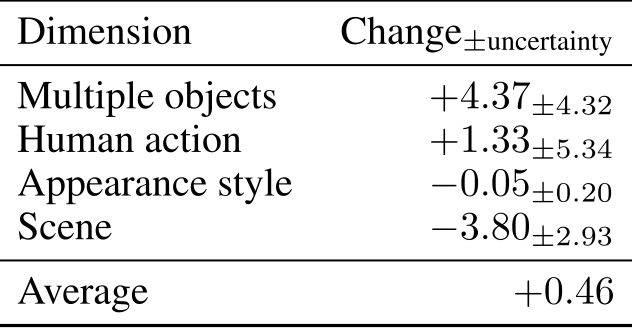
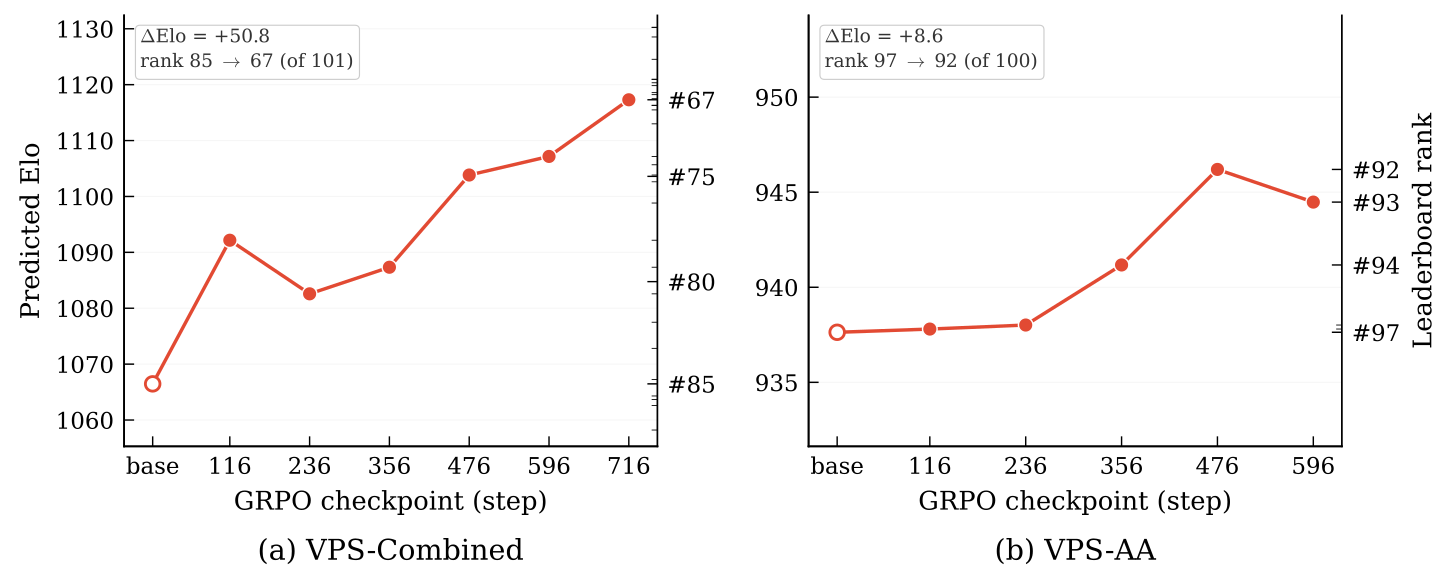
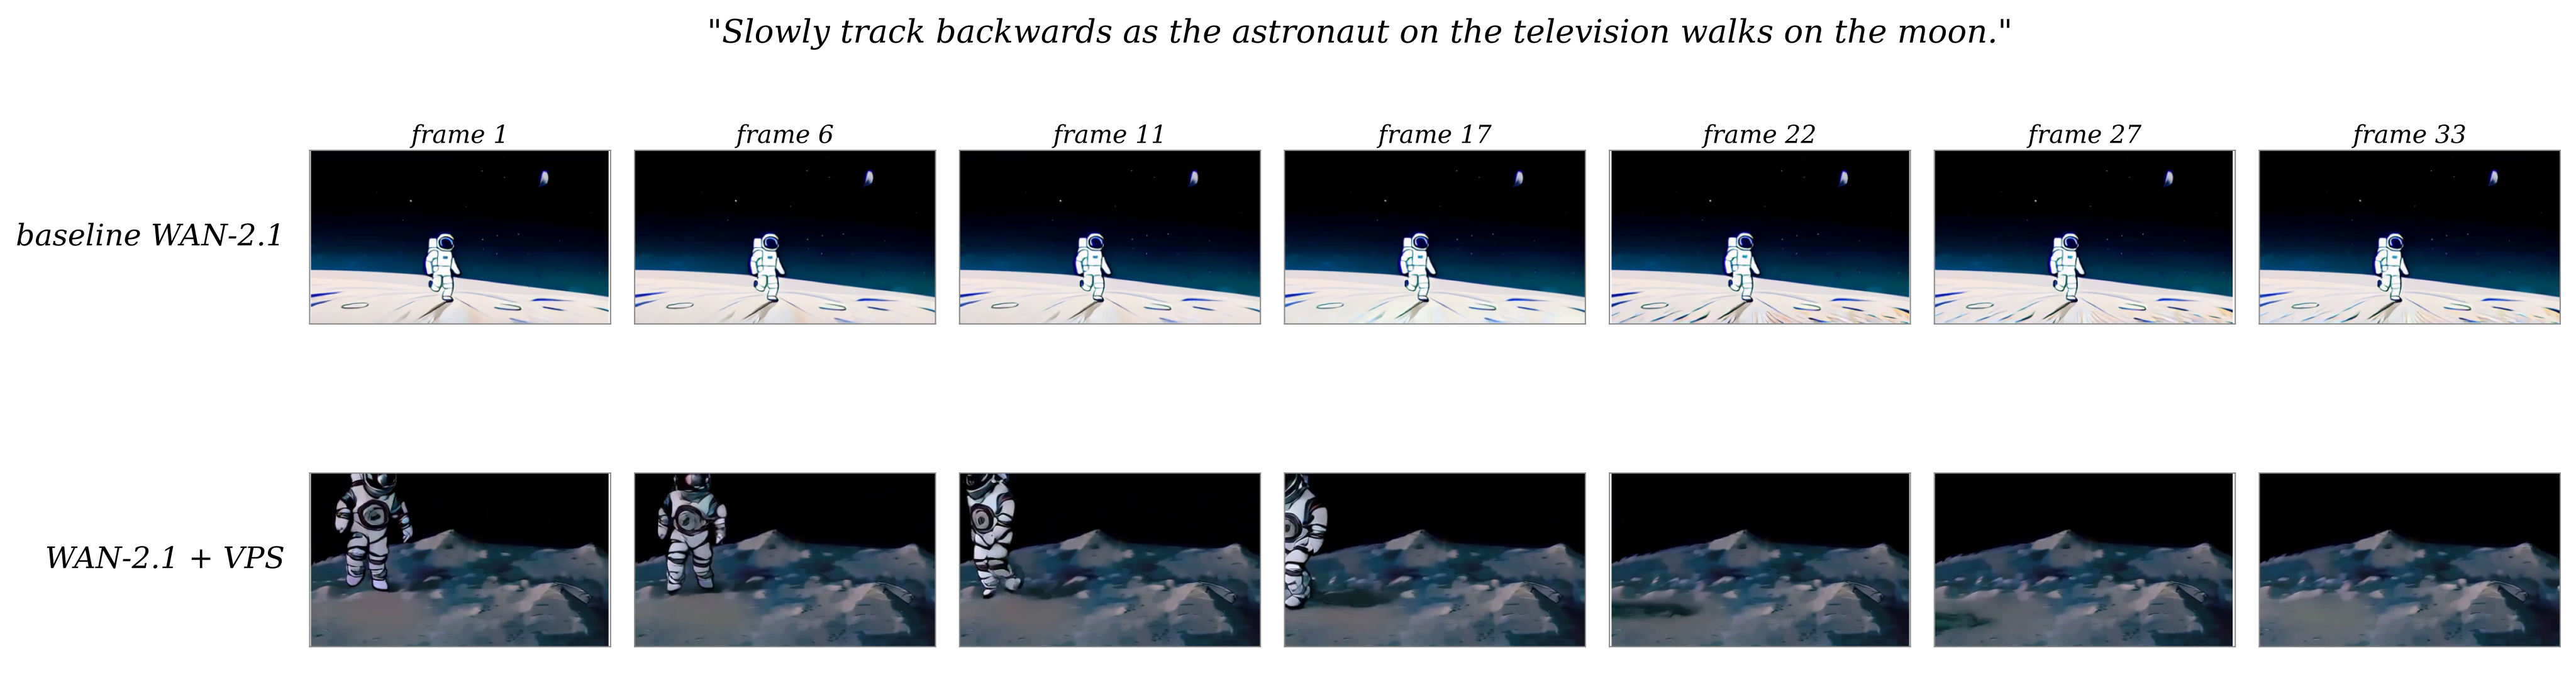
VPS-AA rewards move predicted Elo 937→946 (+9); VPS-Combined moves 1066→1117 (+51). Those baselines use different learned scorers and are not directly comparable as a shared human rating scale. Independent VideoScore2 evaluation gives 2.683 for VPS-Combined fine-tuning versus 2.526 for the base generator, 2.471 for random rewards, and 2.577 for VideoScore2 rewards. The four reported VBench dimensions average +0.46: multiple objects improves +4.37, while scene quality falls −3.80. Human action and appearance style change +1.33 and −0.05. The authors describe Table 7 uncertainties as 95% confidence intervals; the main Elo/correlation comparisons lack reported run variability. Qualitative examples illustrate motion and prompt alignment, not a new human-vote study.
Conclusions
VPS demonstrates that weak pairwise targets can support approximate ranking reconstruction and useful video-generation rewards. Real footage adds a benefit for reinforcement fine-tuning even where arena-only reconstruction worsens. The evidence supports an efficient evaluation proxy with transfer limits and dimension-specific regressions.
Acknowledgements
The authors acknowledge Stanford HAI compute and research support, Google Research funding, and TarsTech API support.
Limitations
Model Elo and social engagement are noisy proxies, so the results do not establish engagement as sufficient for true human-preference alignment. Exact ordering among top models is less reliable than global ranking, especially when leaders are closely matched. Trends, influencers, and recommendation algorithms may introduce systematic social biases.
Societal Impacts
The impact discussion separates cheaper, reproducible evaluation and model feedback from the risks of importing social-platform biases into generated video.
Potential Positive Societal Impacts
Automated scoring could lower evaluation costs for smaller groups, provide repeatable comparisons, and make visual-quality/prompt-alignment feedback easier to use. These are anticipated benefits of the computational evaluator, not measured deployment outcomes.
Potential Negative Societal Impacts & Risks
Optimizing engagement-derived rewards may favor sensational or biased visual styles and reduce representation diversity. Engagement is influenced by platform recommendation and popularity, so a high response count cannot be equated with objective realism.
Safeguards
The authors report automated filtering of explicit or highly graphic retrieved content. They state that data and pretrained rewards will be gated by an academic-affiliation Data Use Agreement prohibiting optimization for explicit, deceptive, or non-consensual media. This is the paper’s release policy, not a verification of the current download gate.
Additional Evaluation
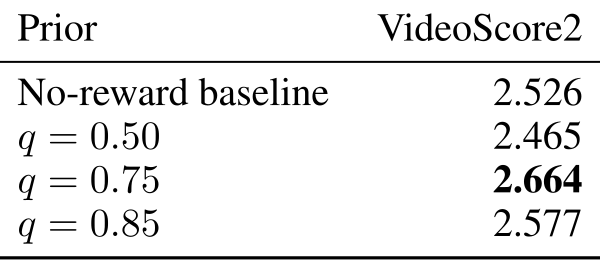
The real-over-generated prior sweep reports VideoScore2 2.465 at q=0.50, 2.664 at q=0.75, and 2.577 at q=0.85, versus baseline 2.526. The moderate 0.75 prior is best among these three settings; removing the prior underperforms baseline. Its 2.664 value belongs to this sensitivity experiment and differs from the main reward comparison’s 2.683.
Distribution of User Engagements
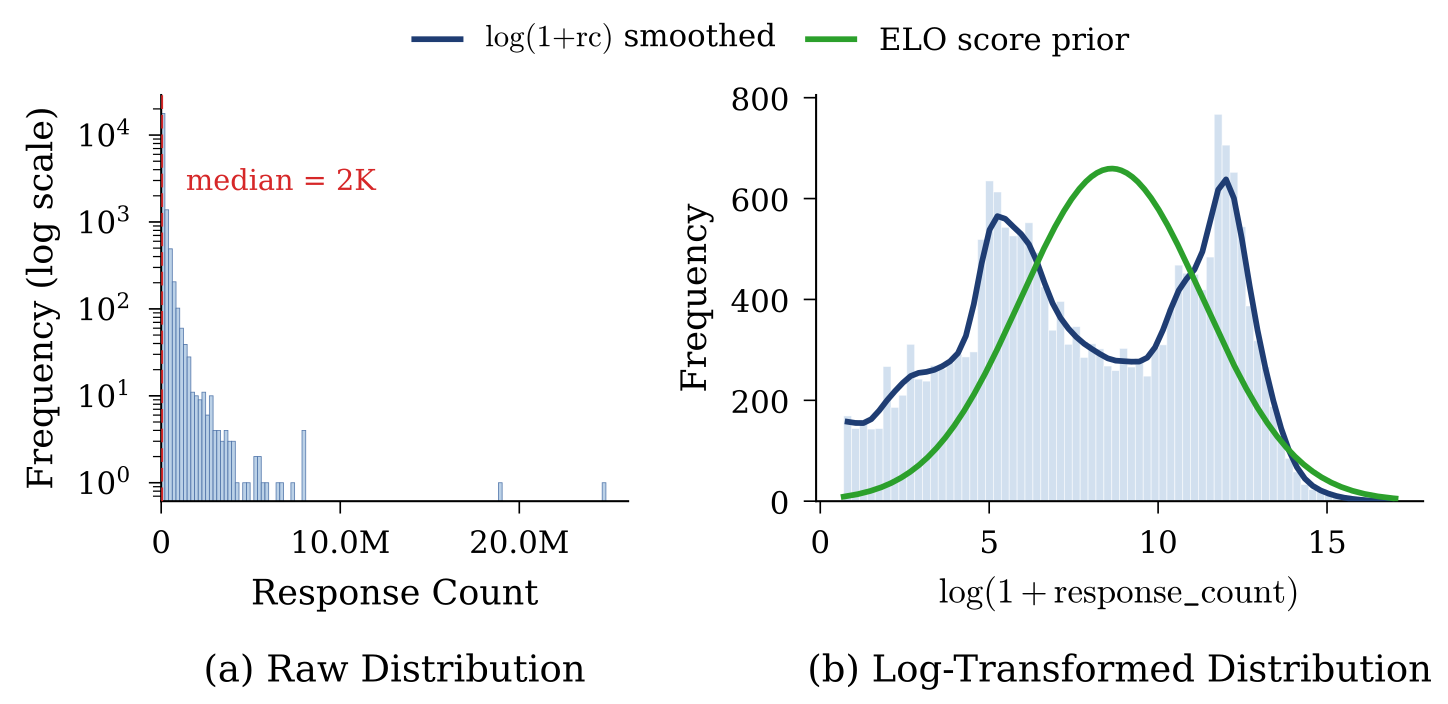
Raw response counts are strongly long-tailed, with a median around 2,000 in Figure 6. Log transformation produces a more Gaussian-looking distribution. Training nevertheless uses the normalized raw-count ratio for real–real pair targets, not an Elo inferred from logged counts.
Example Training Pairs
The dolphin examples instantiate all three supervision types: model Elo 1215 versus 1200 gives probability 0.537; social counts 196 versus 1,099 give 0.151; a generated clip versus a real clip receives the fixed 0.250 target. All original example frames and prompts remain below.

More Qualitative Results
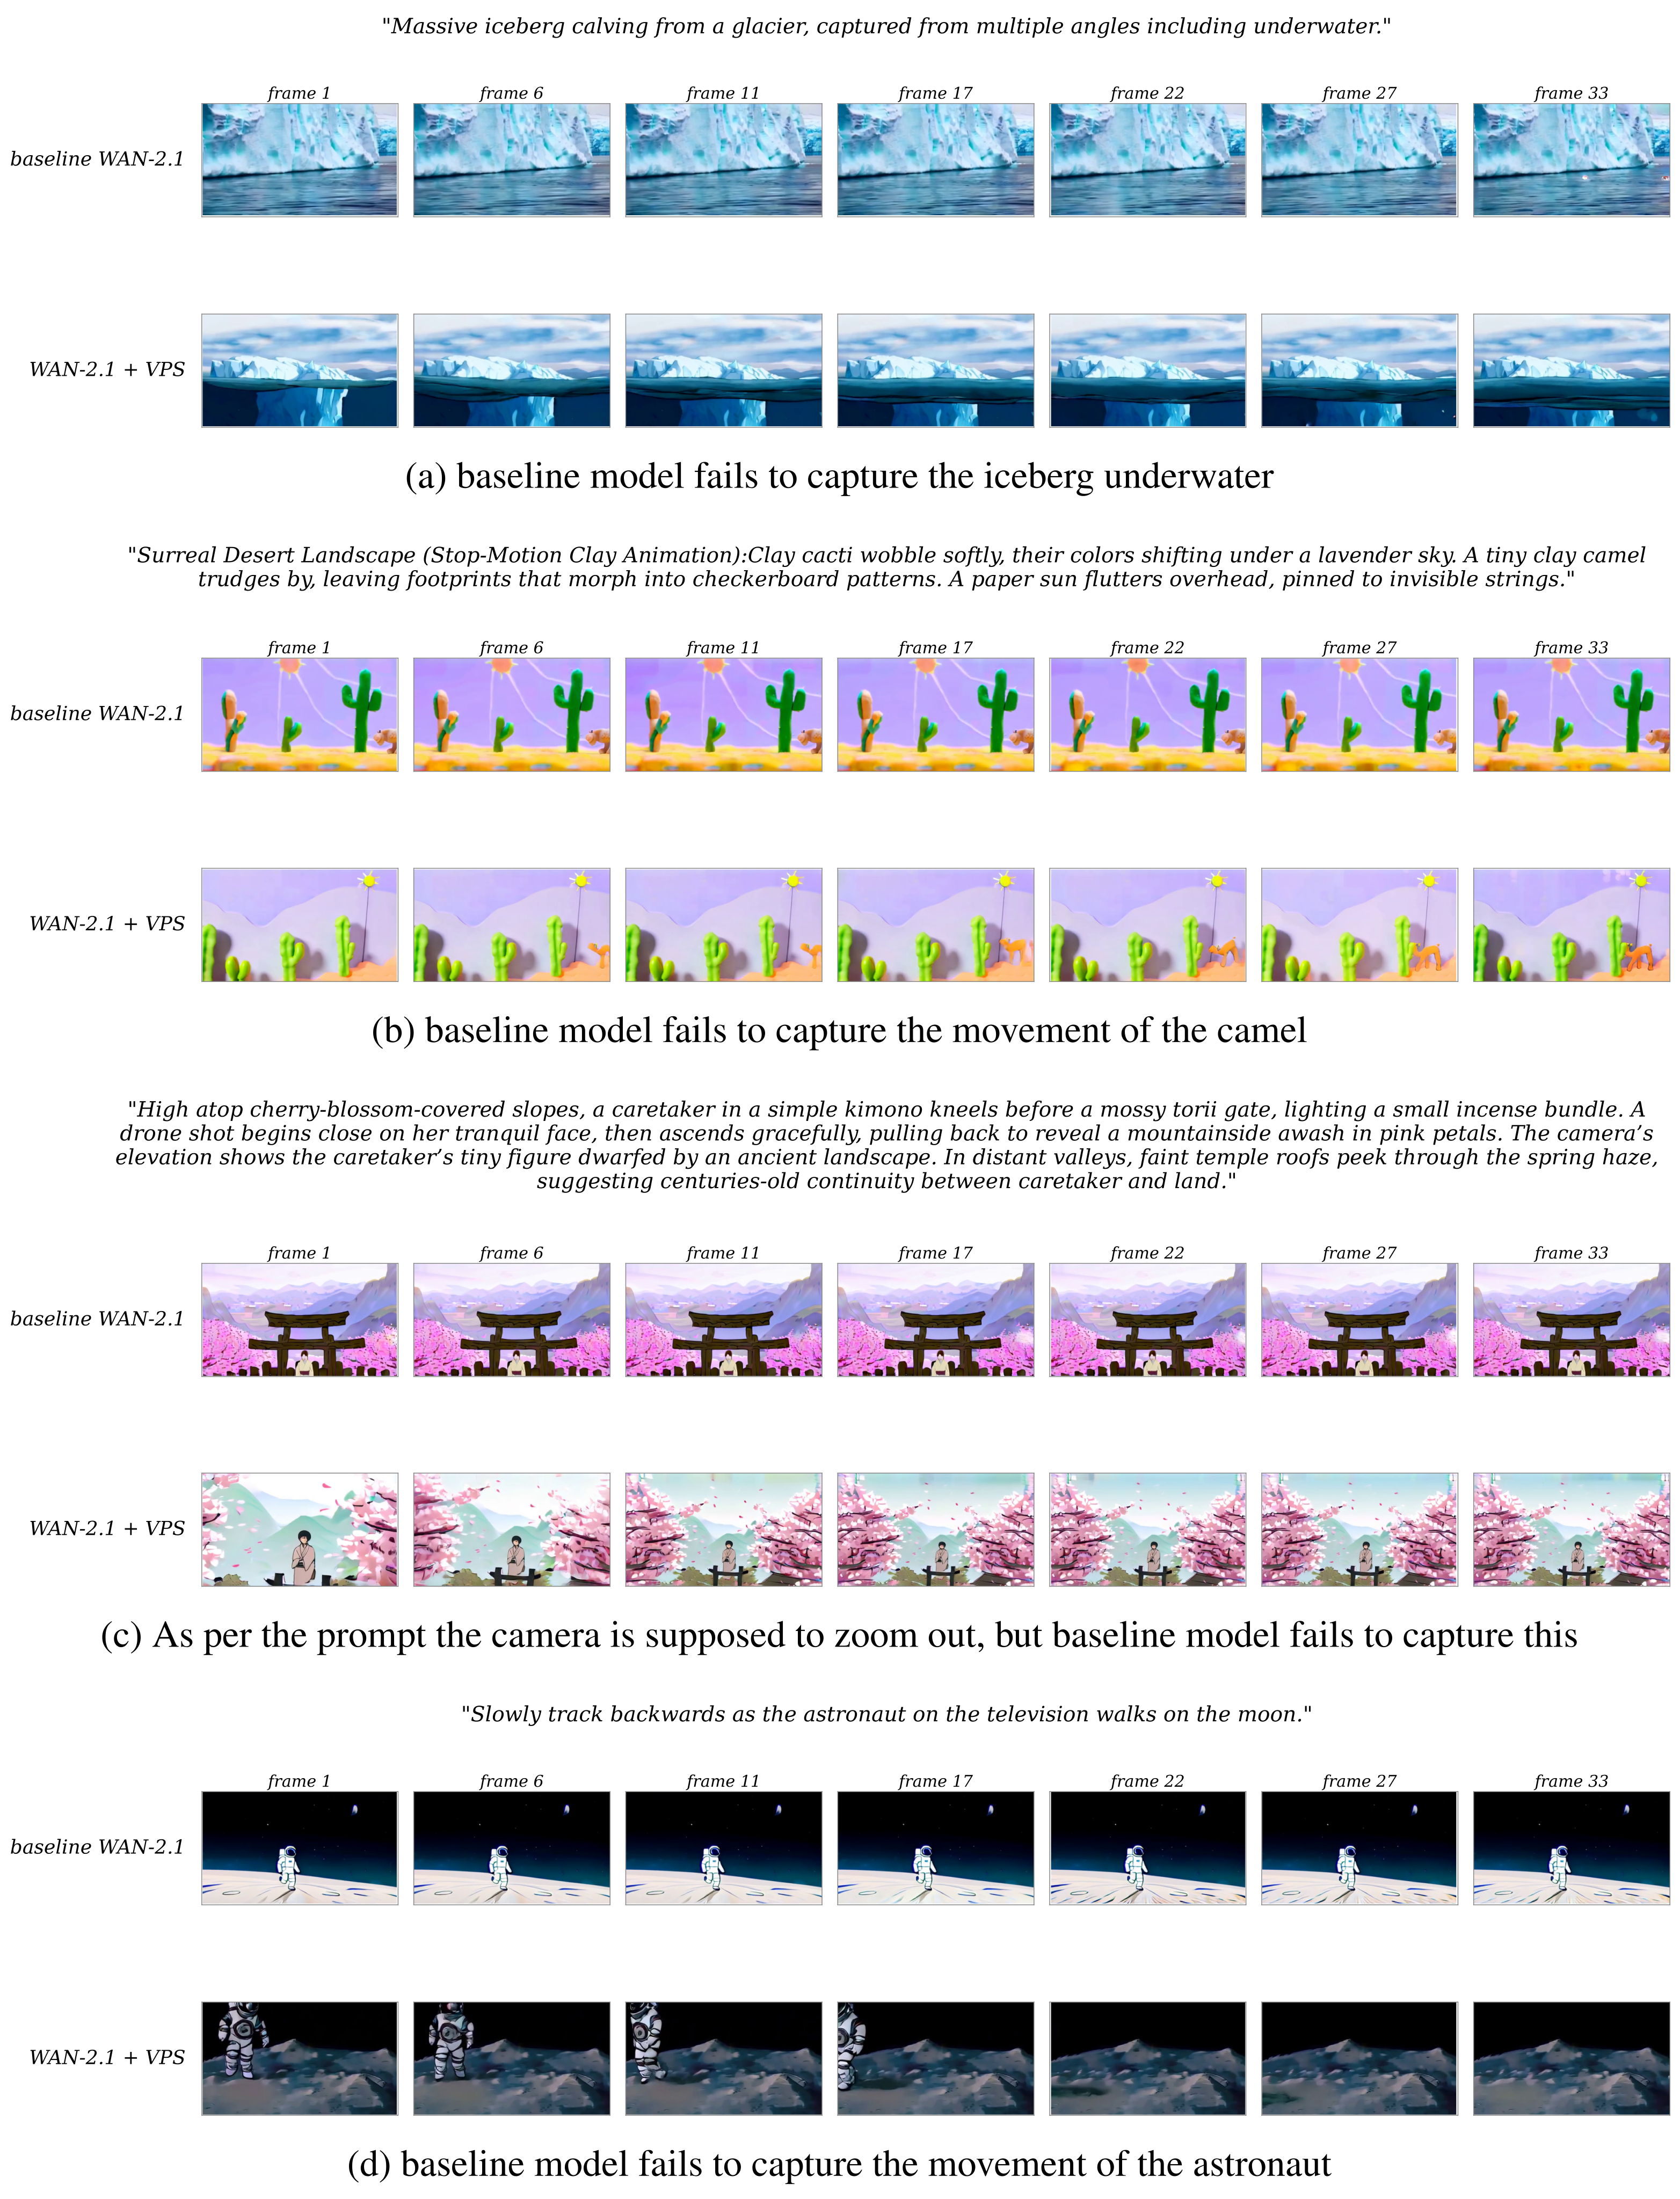
Four frame-sequence comparisons illustrate underwater iceberg views, camel movement, camera pullback over a temple landscape, and astronaut motion. They are selected qualitative examples; the full panels and prompt text are preserved for direct inspection.
Compute Resource
The preference model takes about 15 minutes on an internal NVIDIA L40s cluster. Each Flow-GRPO run uses two H100 GPUs for three days, reported as approximately 150 GPU-hours. The paper says preliminary/failed runs add little compute; it does not give a full project-wide budget.
Licenses for existing assets
Reported licenses are MIT for Flow-GRPO and VideoScore2; Apache 2.0 for VBench, SigLIP, and InternVideo2; BSD-2-Clause for LPIPS; and S-Lab License 1.0 for DOVER. This appendix lists existing code/model assets; it does not enumerate every scraped platform’s terms.
NeurIPS Paper Checklist
The authors affirm claims, limitations, reproducibility, code/data availability, experimental details, compute disclosure, ethics, impacts, safeguards, licensing, and new-asset documentation. They identify theory and new crowdsourcing as inapplicable, report an institutional determination that IRB review was unnecessary, and say language models were used for manuscript polishing. The checklist answers “No” on error bars although Table 7 separately presents uncertainties described as confidence intervals; main ranking and Elo findings still lack run-variation estimates. Submission-time links point to the VPS dataset and anonymous code. The original institutional response is retained below.
