At a glance
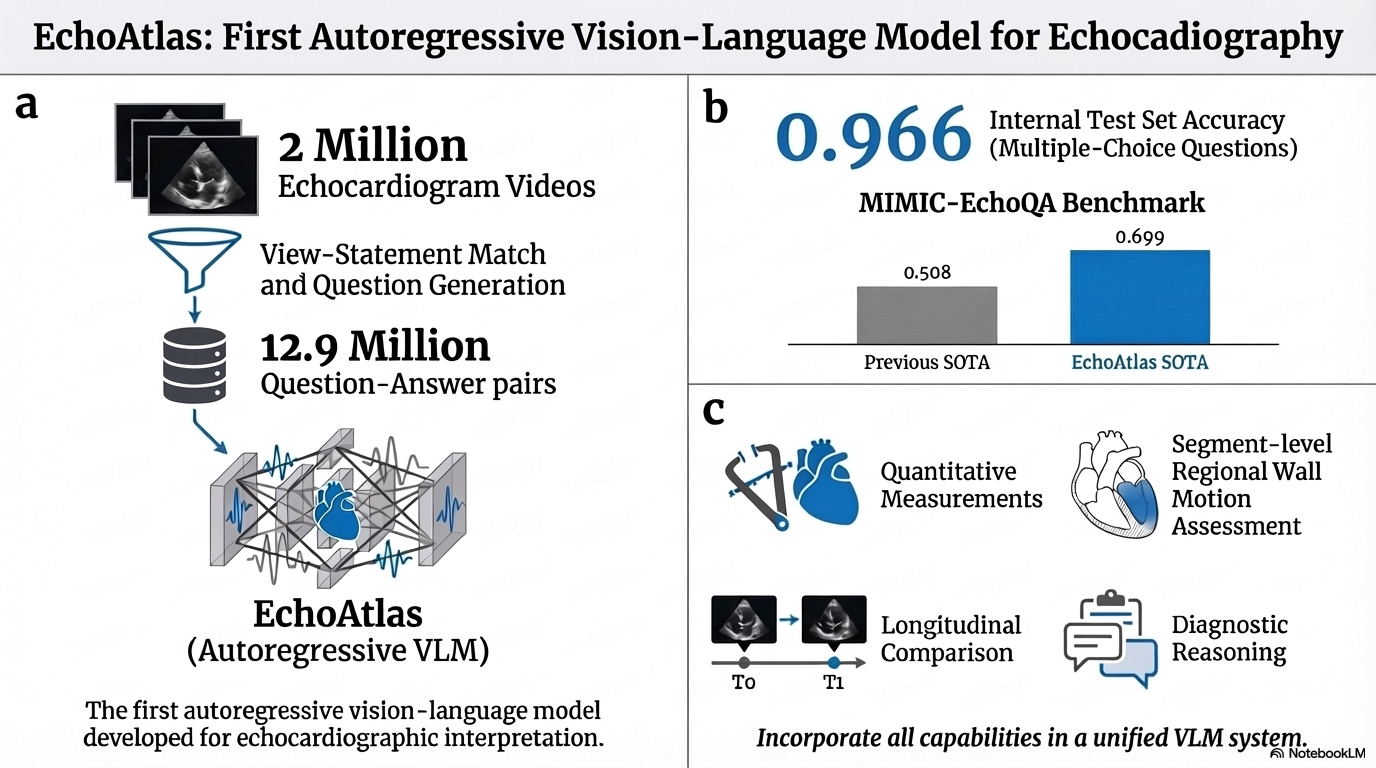
EchoAtlas adapts Qwen2.5-VL-7B to conversational echocardiography using report-derived supervision paired with multiple ultrasound views. Tasks include questions, numerical estimates, regional wall motion, longitudinal comparison, structured reporting, and diagnostic explanations.
The dataset contains 12.88 million question–answer pairs from 62,726 patients. Internal multiple-choice accuracy is 0.966; external single-video accuracy is 435/622, or 0.699. These retrospective results support domain adaptation, while performance varies substantially by measurement, task format, and disease. This edition follows the complete 46-page medRxiv preprint posted 17 March 2026, including every figure, table and original prompt.
Introduction
Clinical echocardiography requires integrating anatomy, motion, Doppler information, and complementary views. Specialized predictors can estimate selected quantities, but conversational interpretation also requires flexible questions and descriptions [1] [2] [4] [11].
EchoAtlas uses an autoregressive model that conditions on videos and questions. This differs from EchoPrime’s retrieval-based reporting and EchoCLIP-style representation learning [5] [10]. The paper evaluates these approaches in specific formats; it does not establish a universal superiority of one architecture.
Results: conversational interpretation
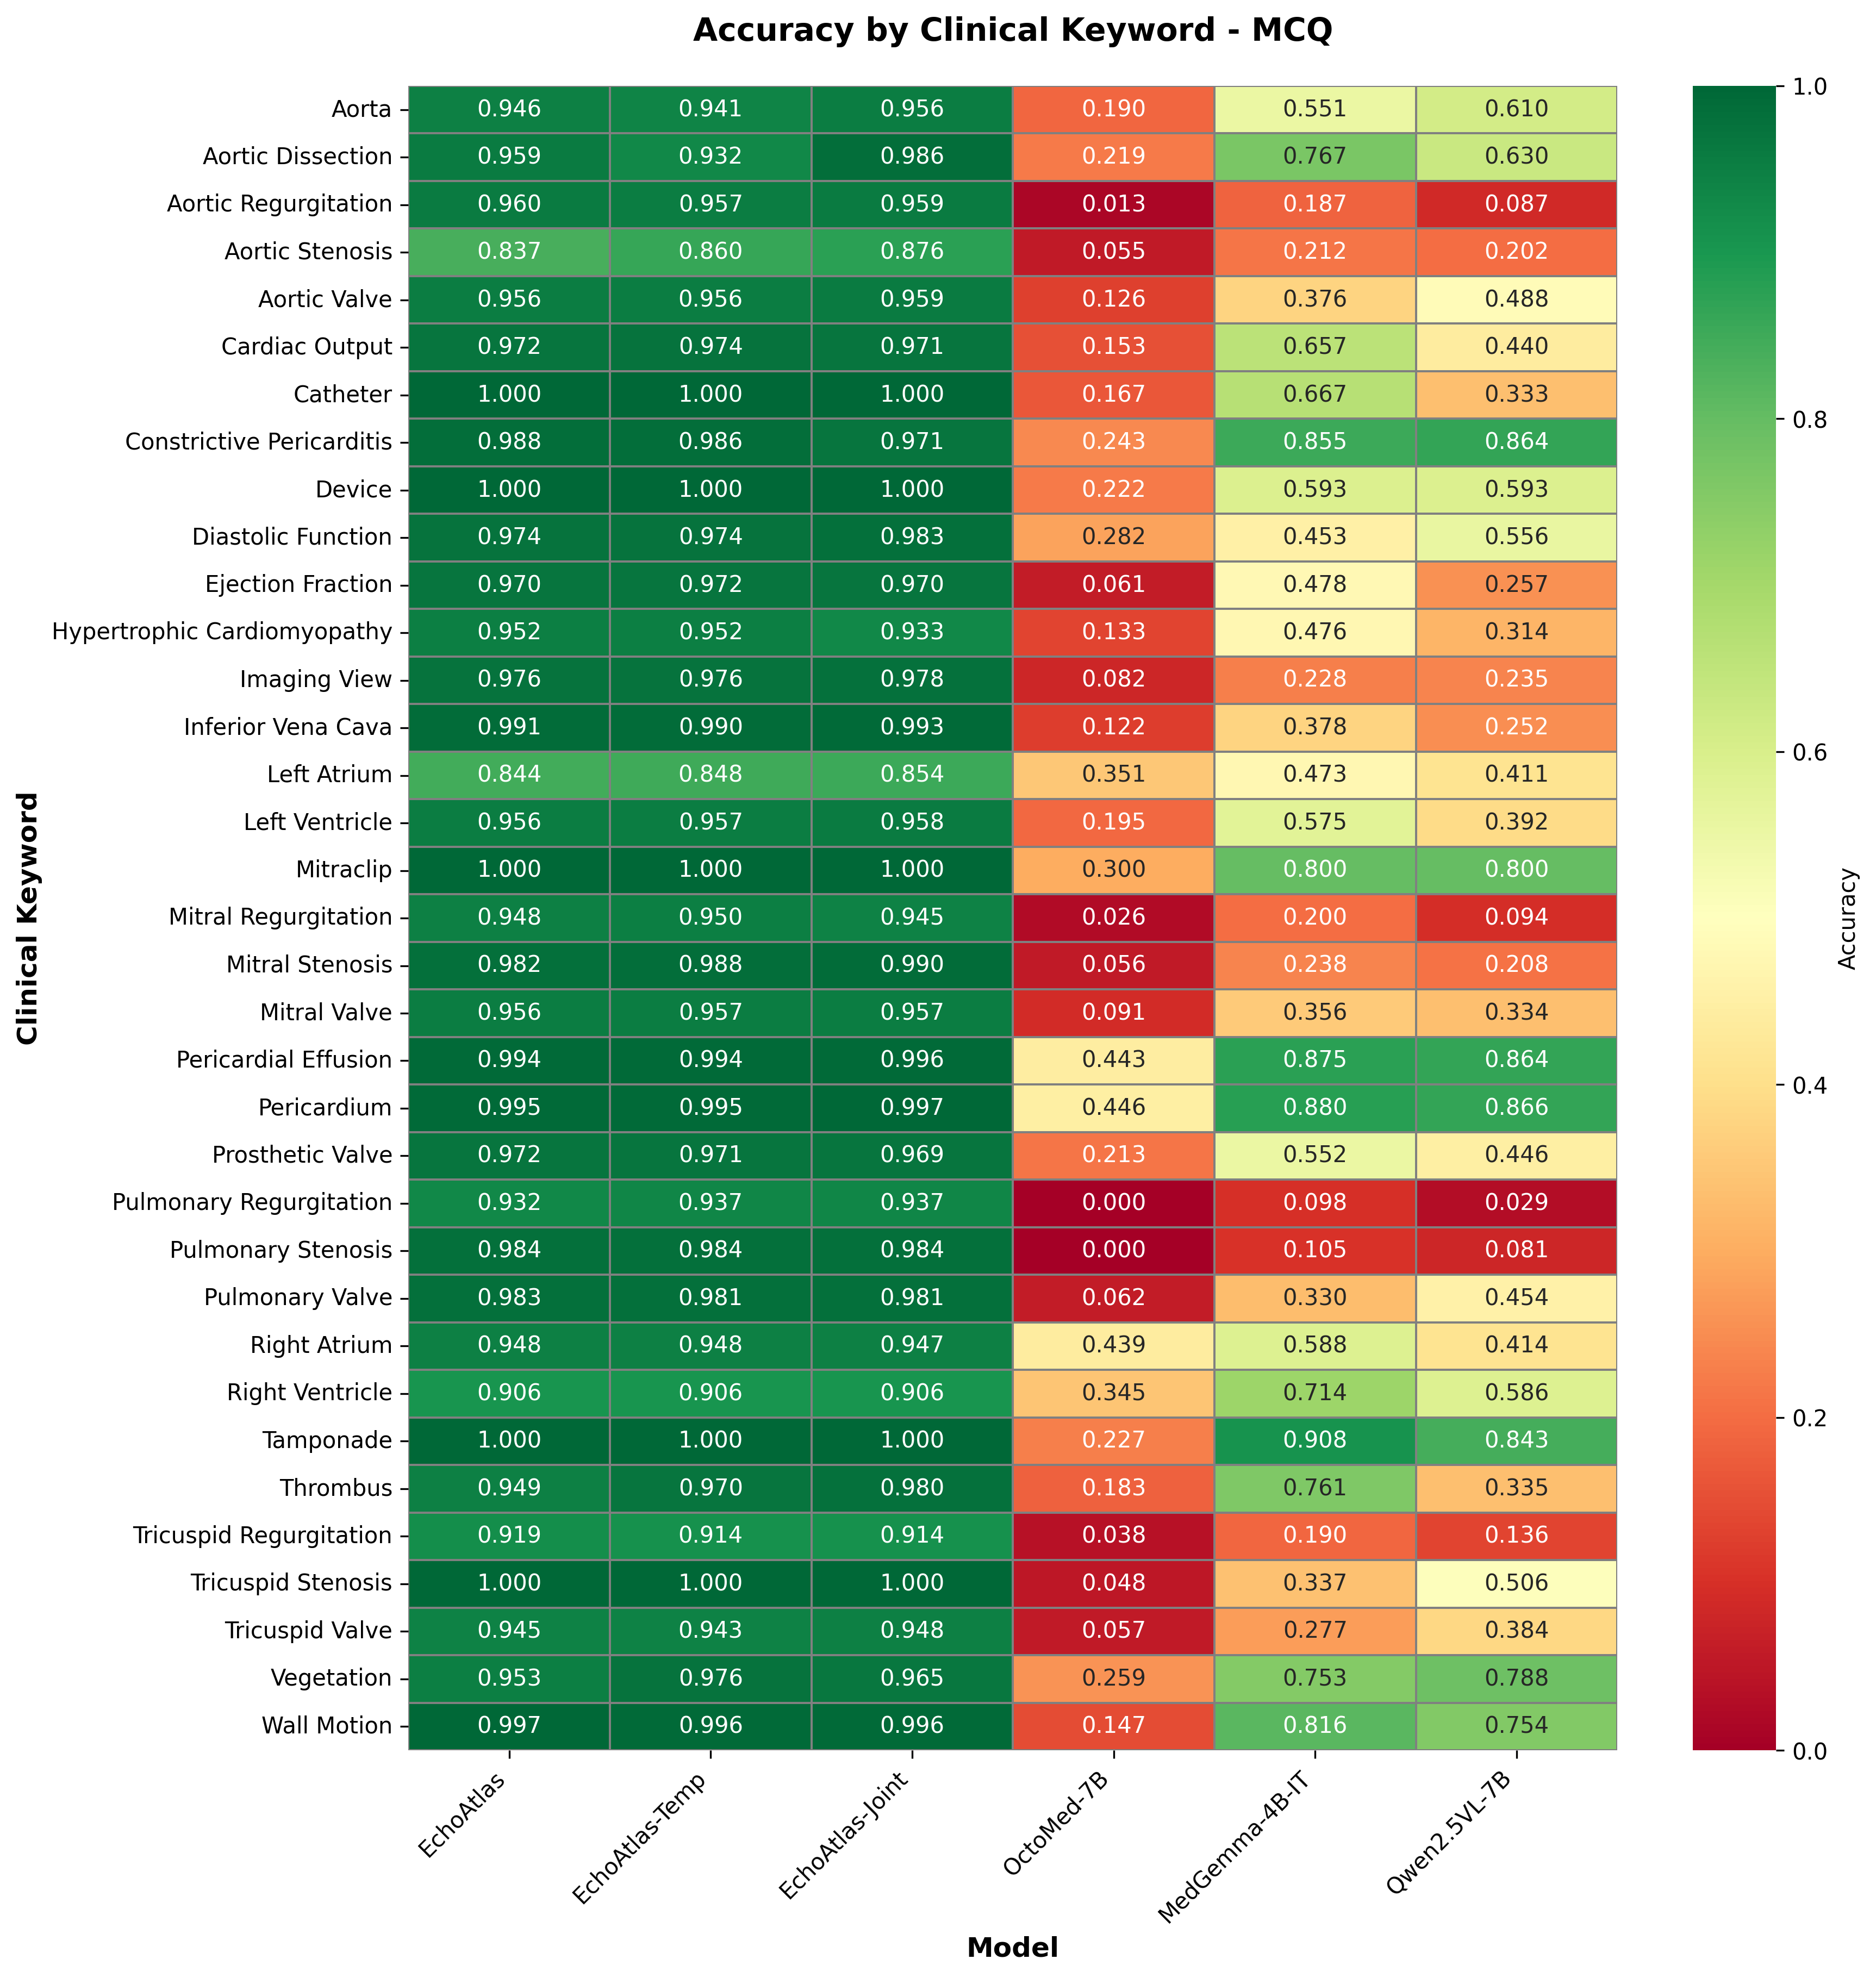
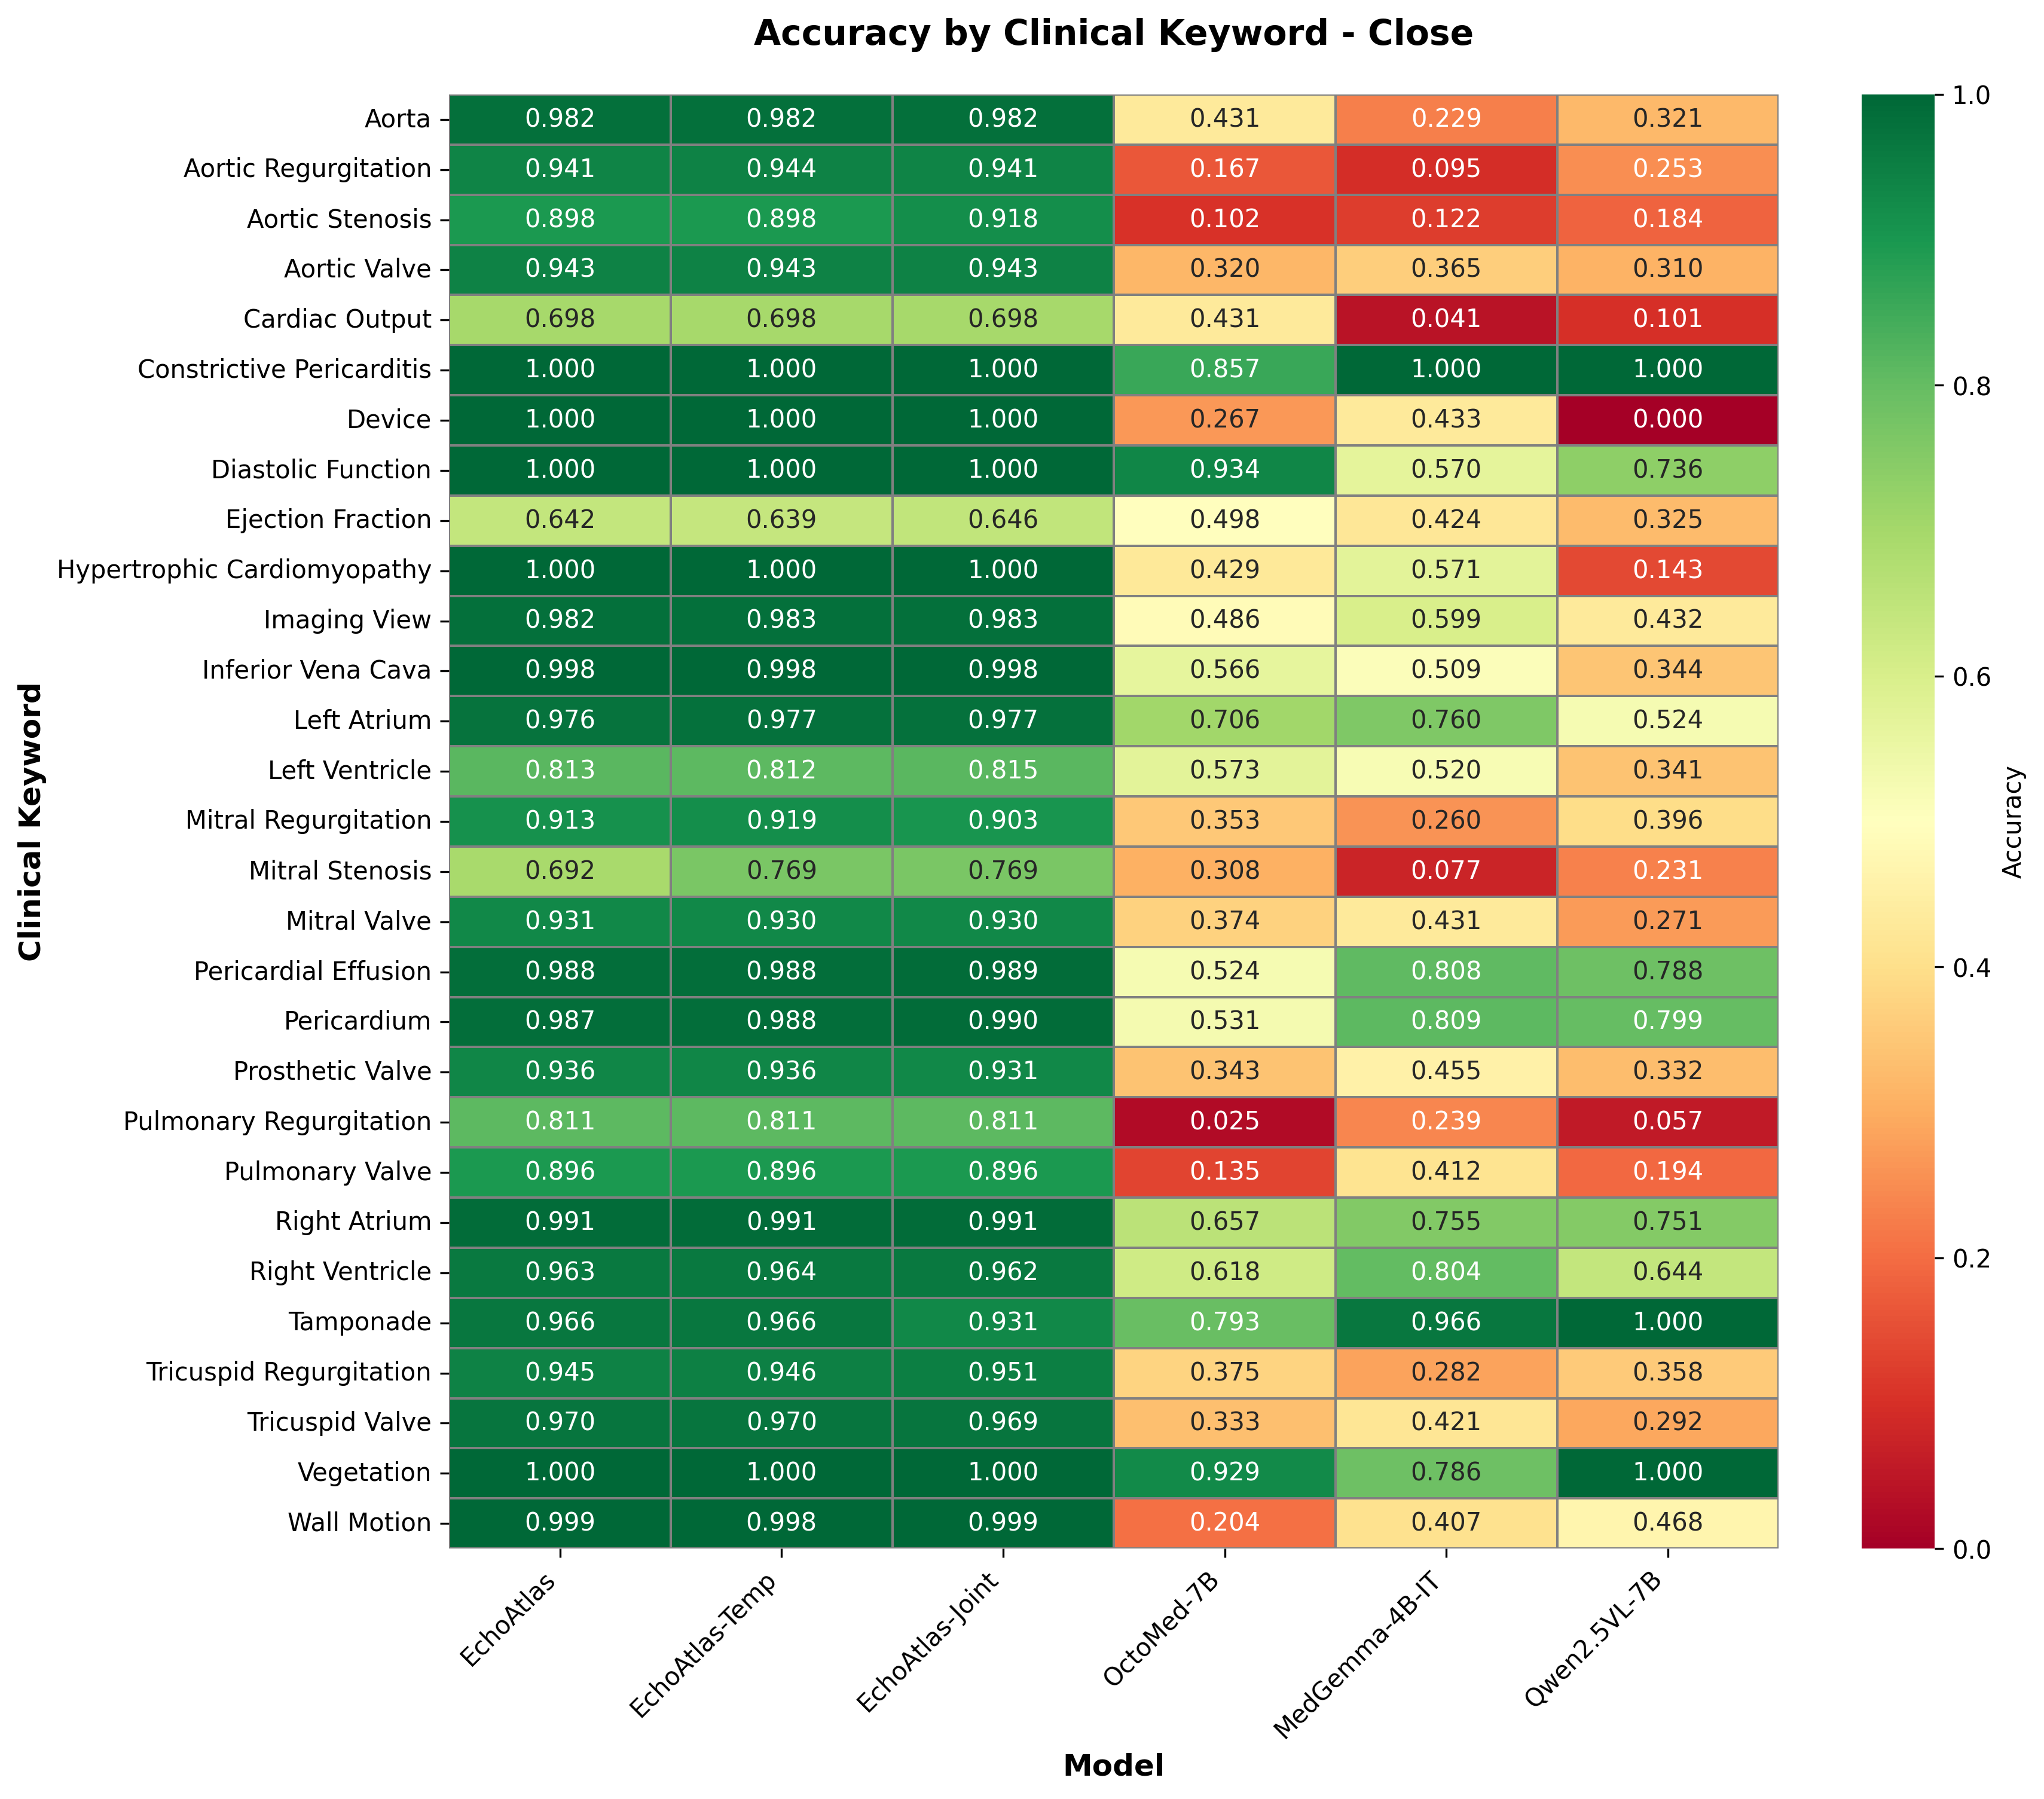
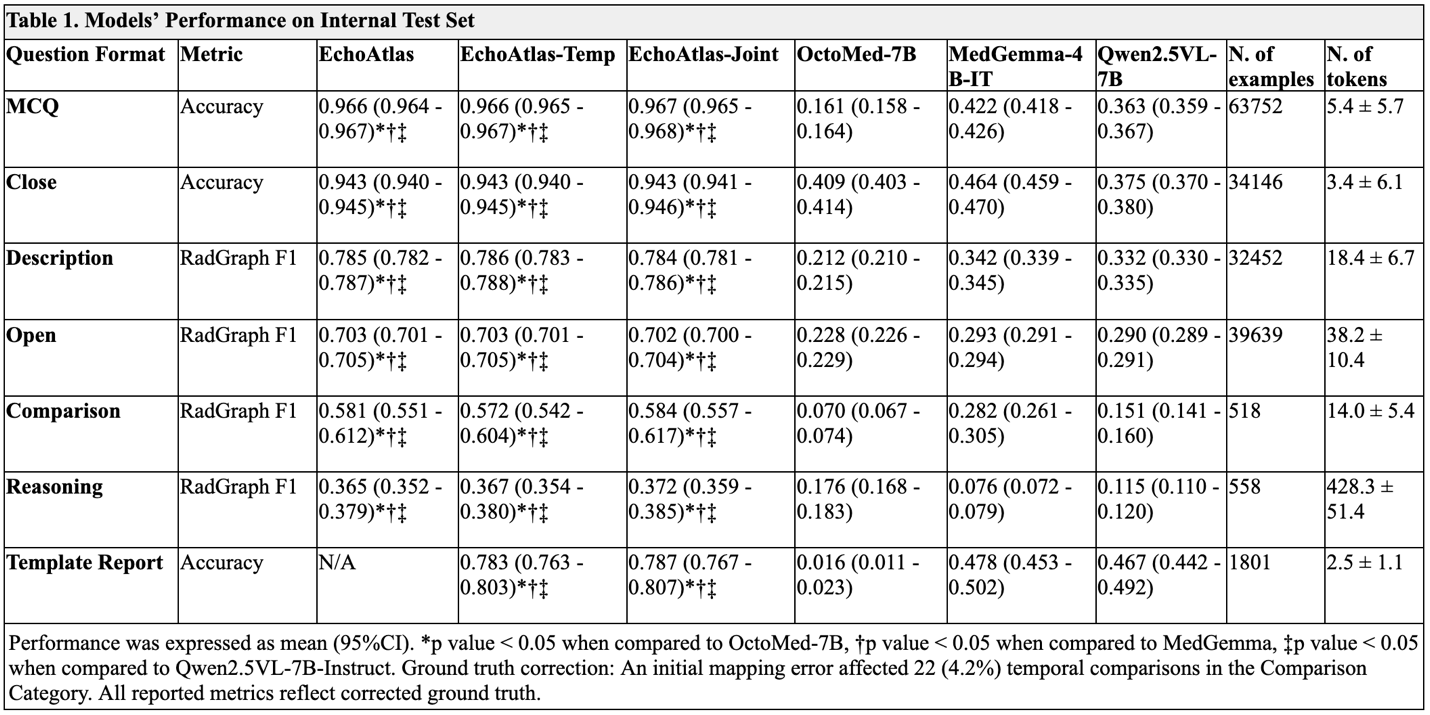
Table 1 reports 0.966 accuracy on 63,752 multiple-choice questions and 0.943 on 34,146 closed-ended questions. Baseline multiple-choice accuracies are 0.161 for OctoMed, 0.422 for MedGemma and 0.363 for base Qwen. Domain training produces a large improvement under this internal protocol.
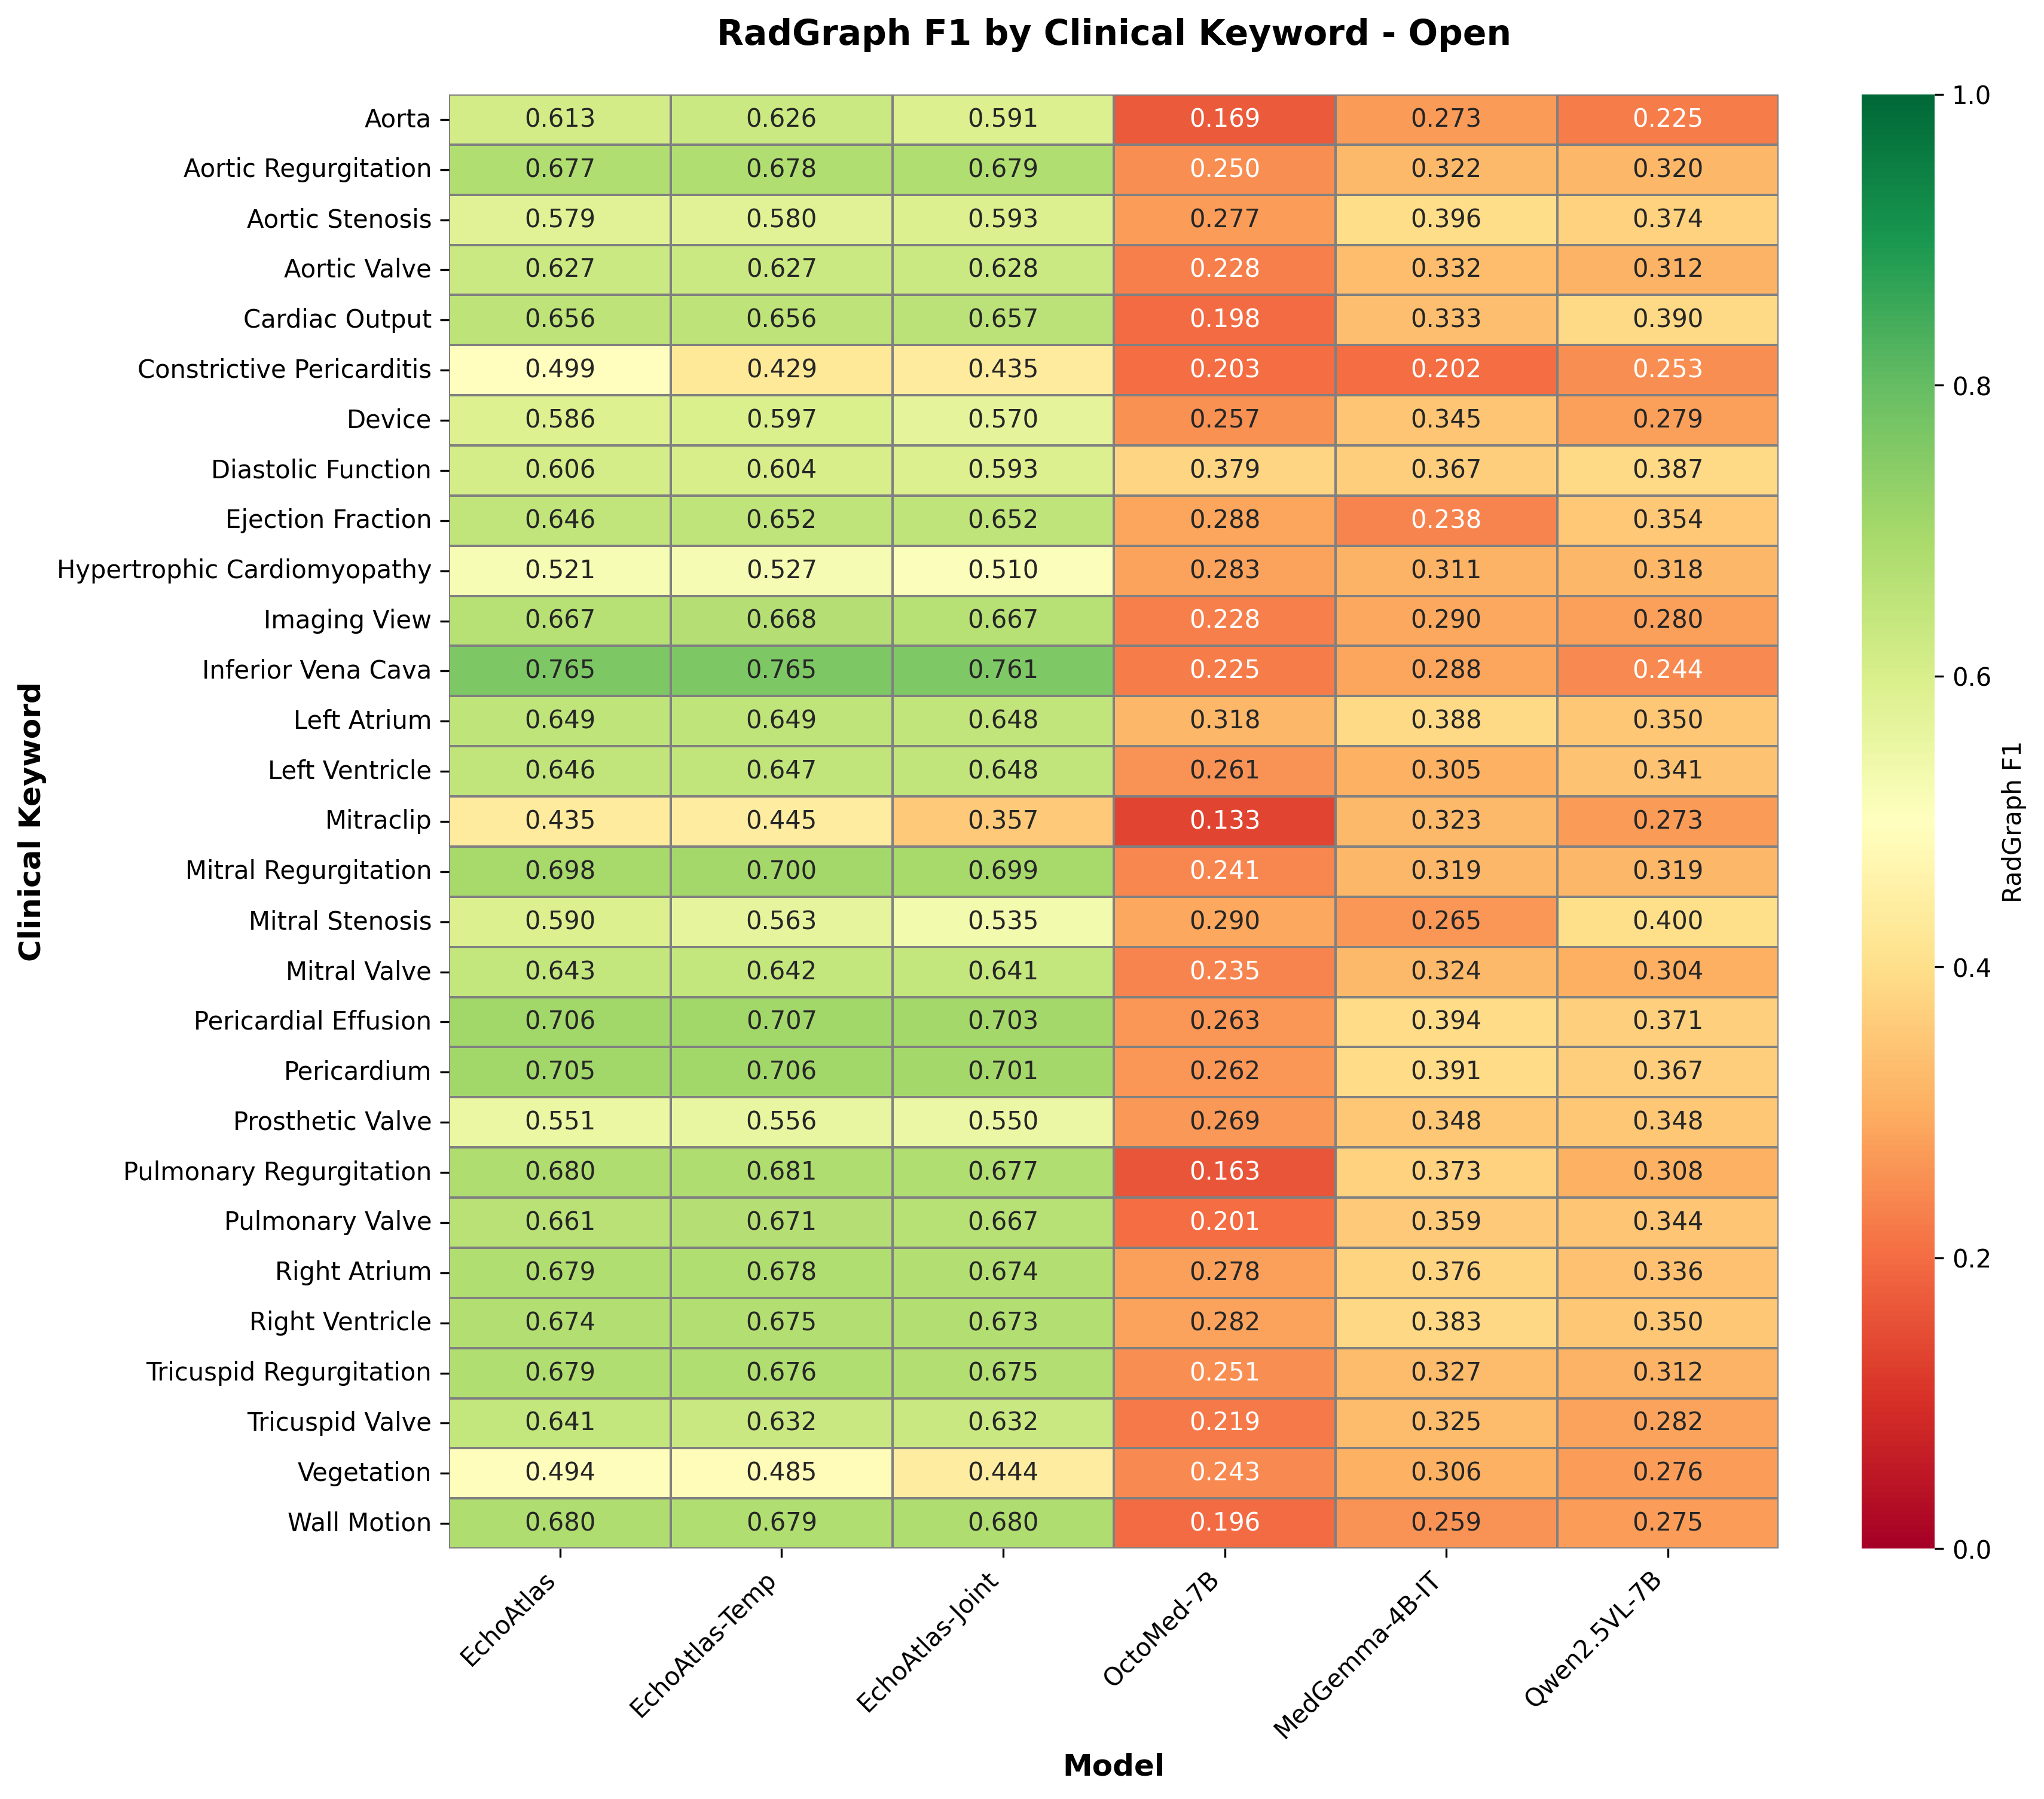
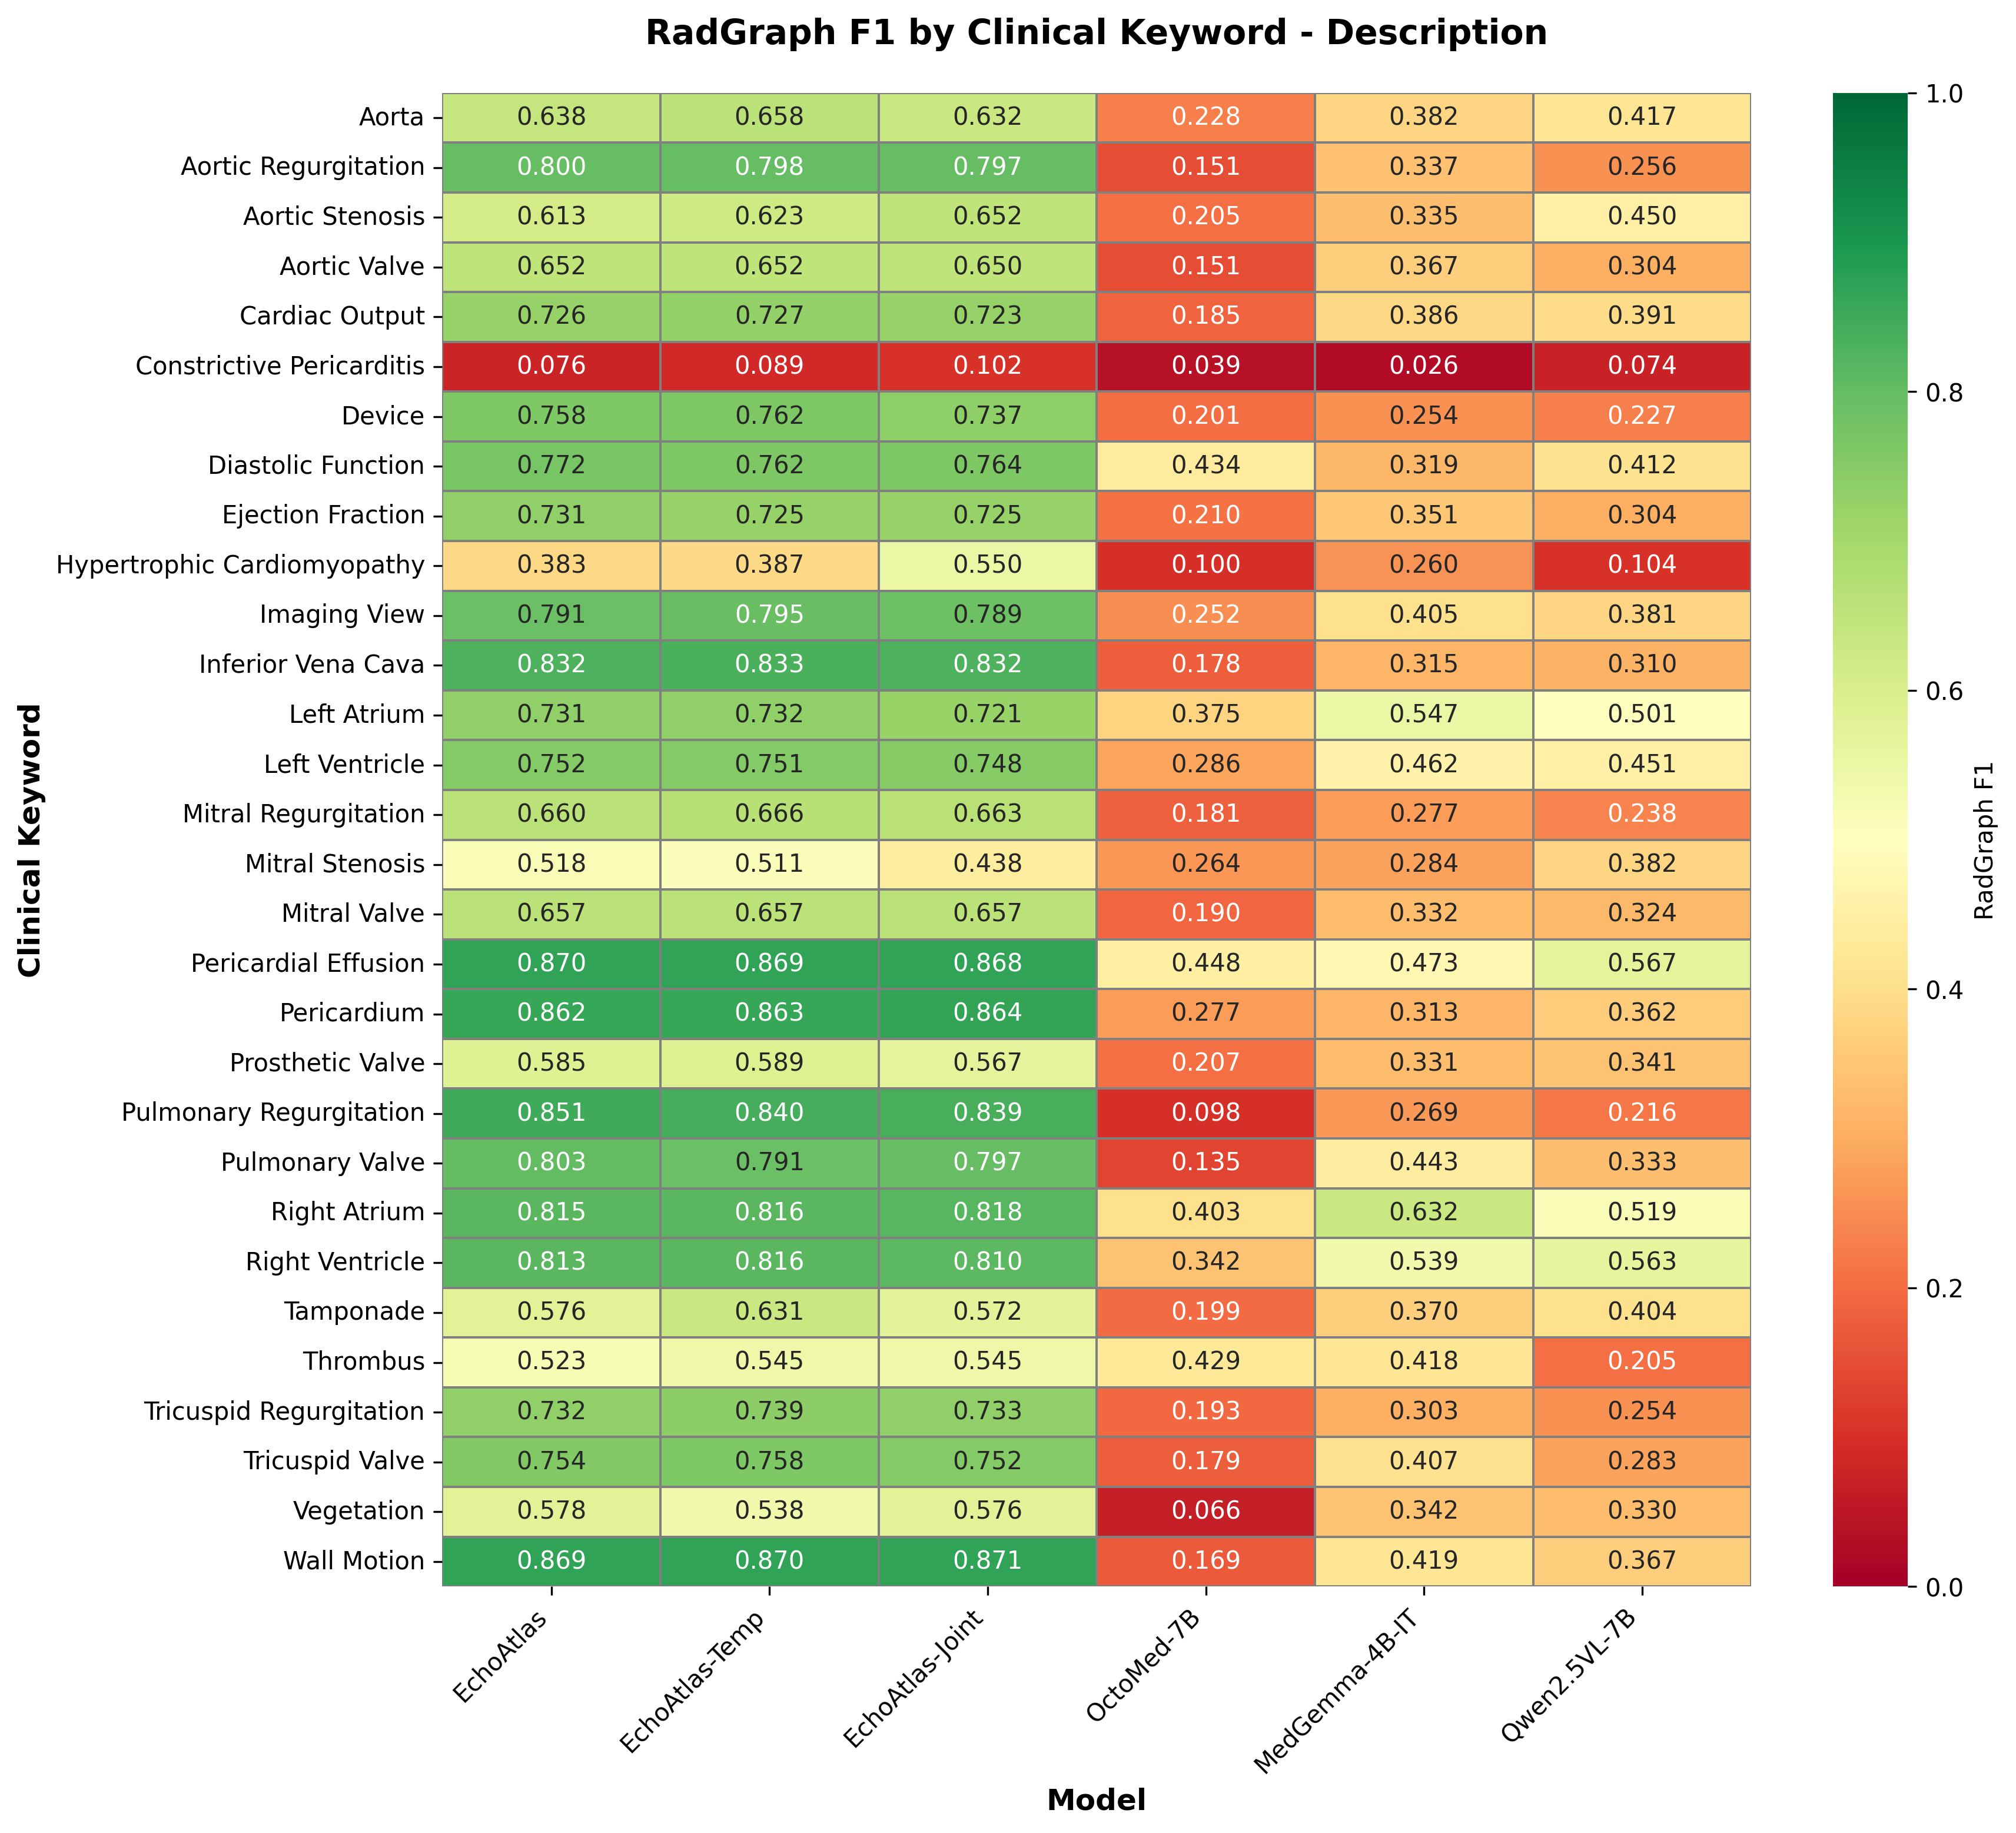
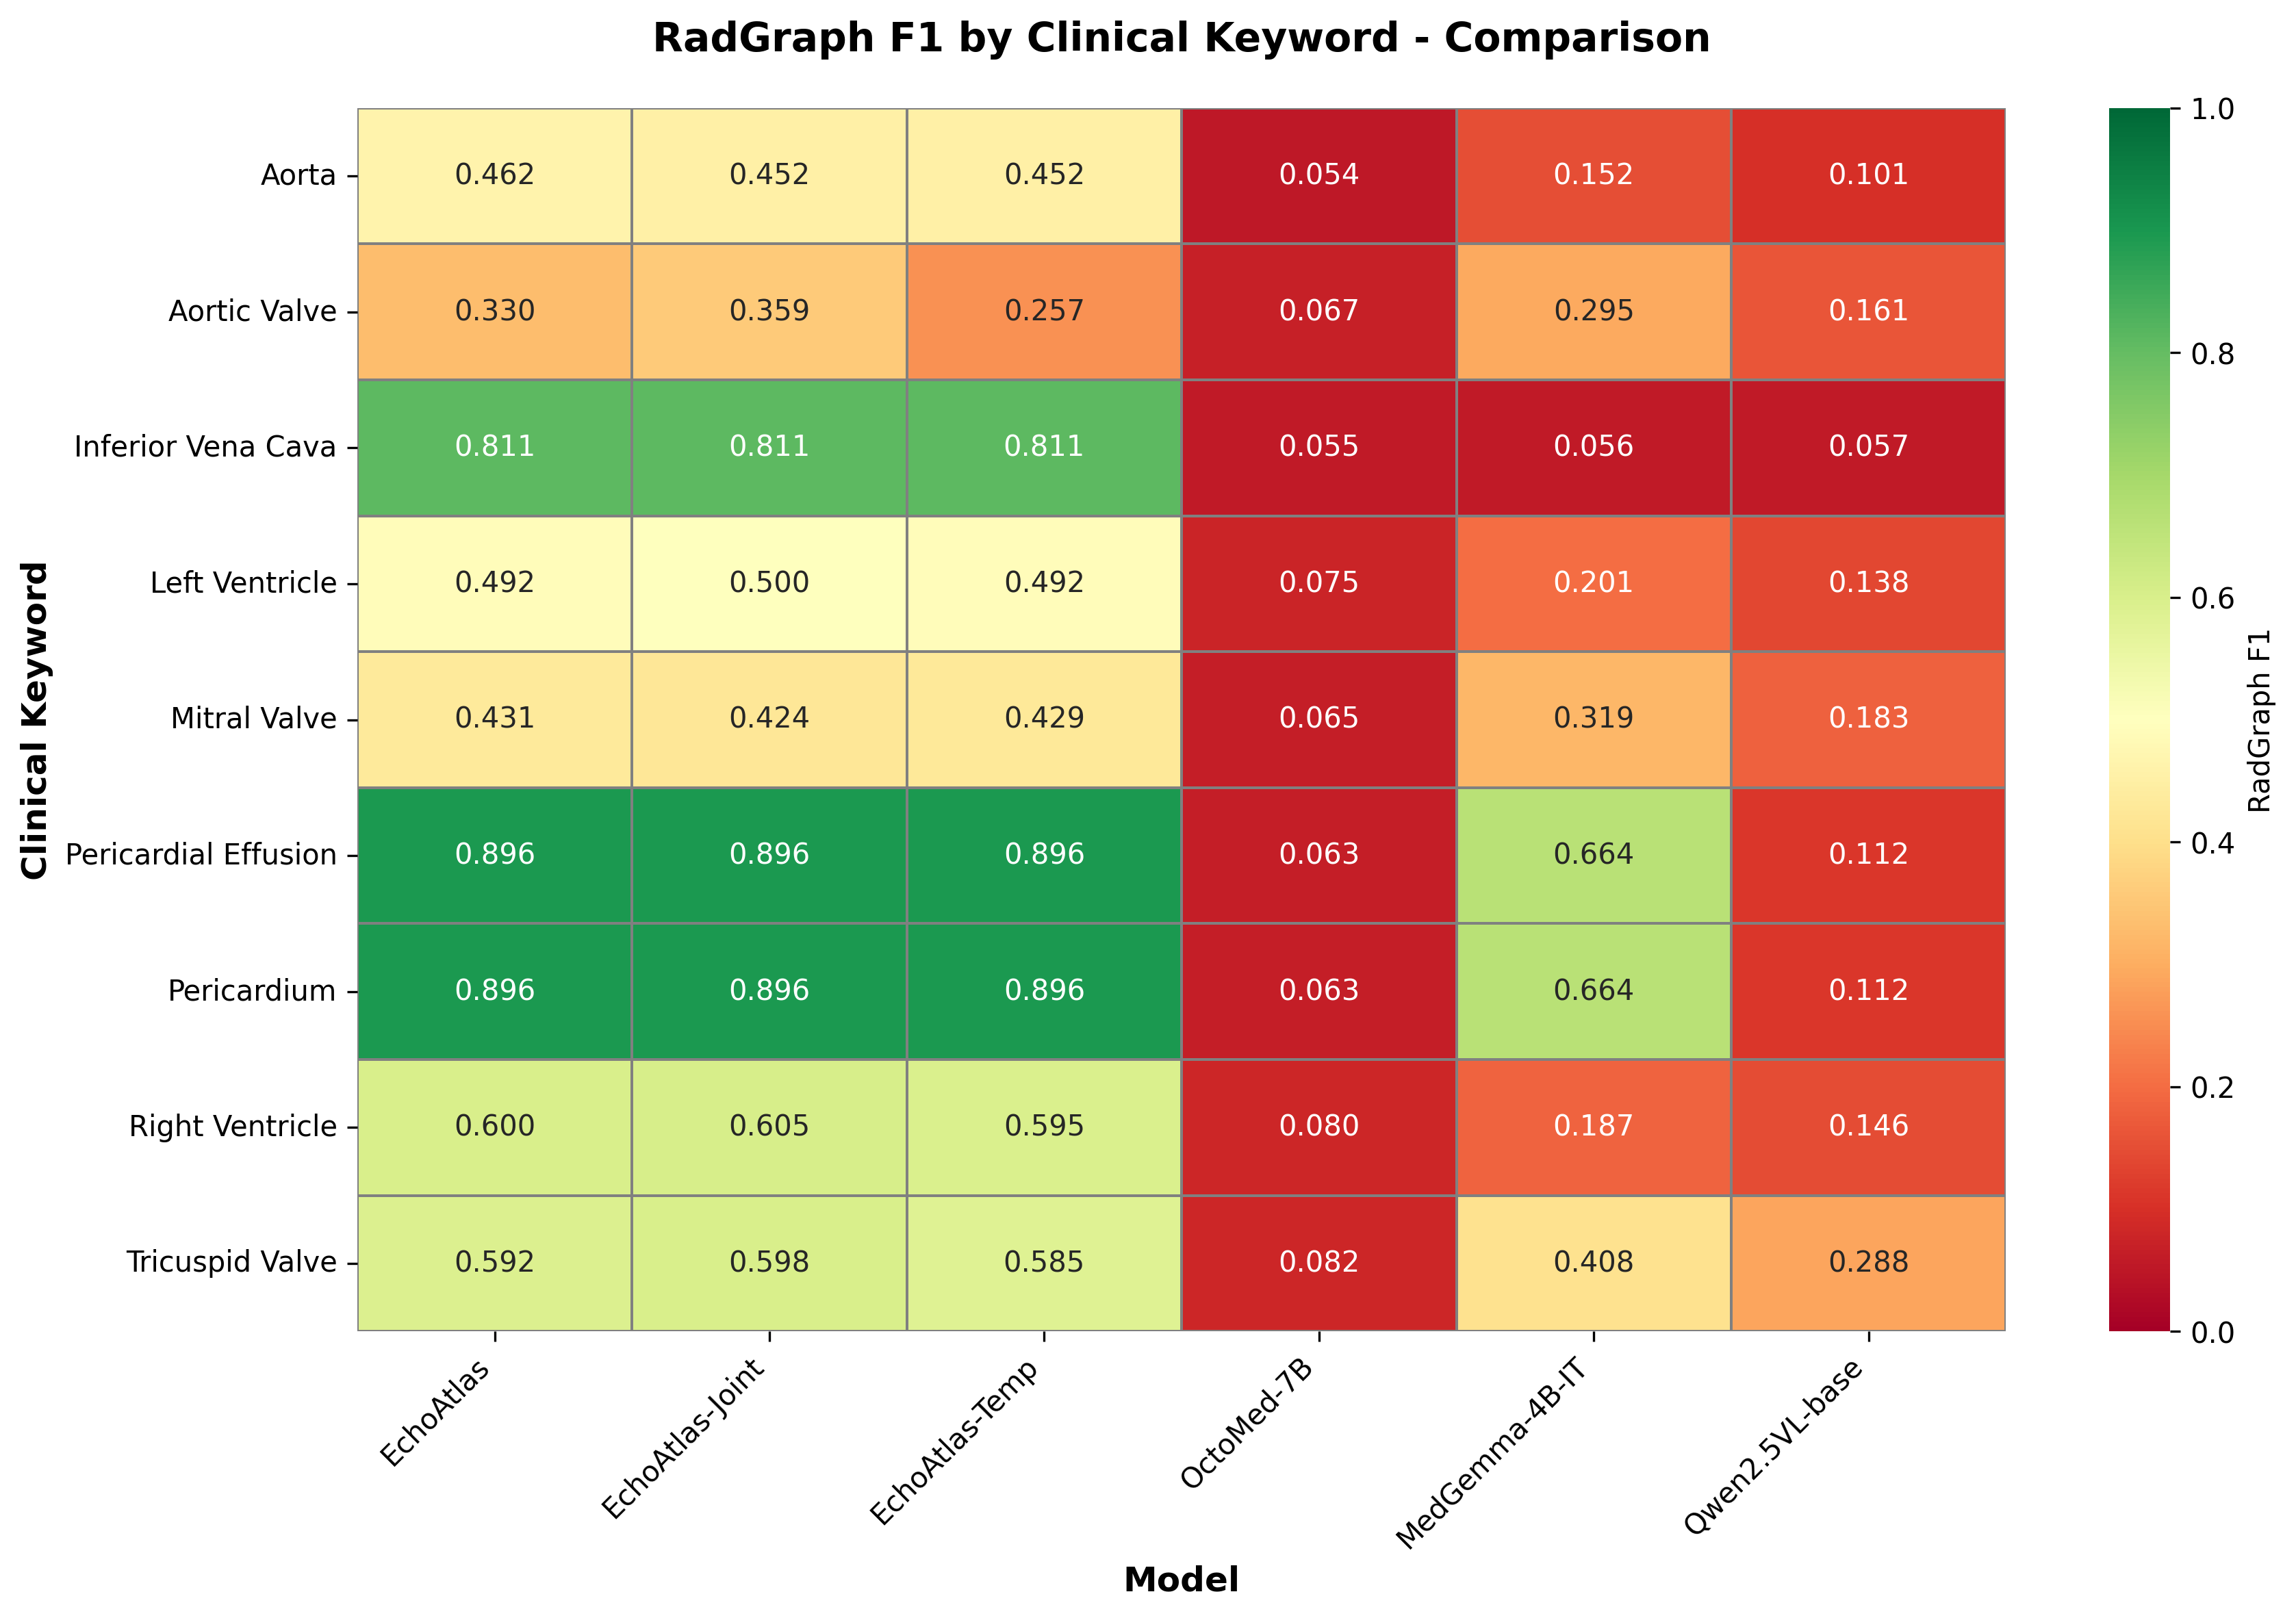
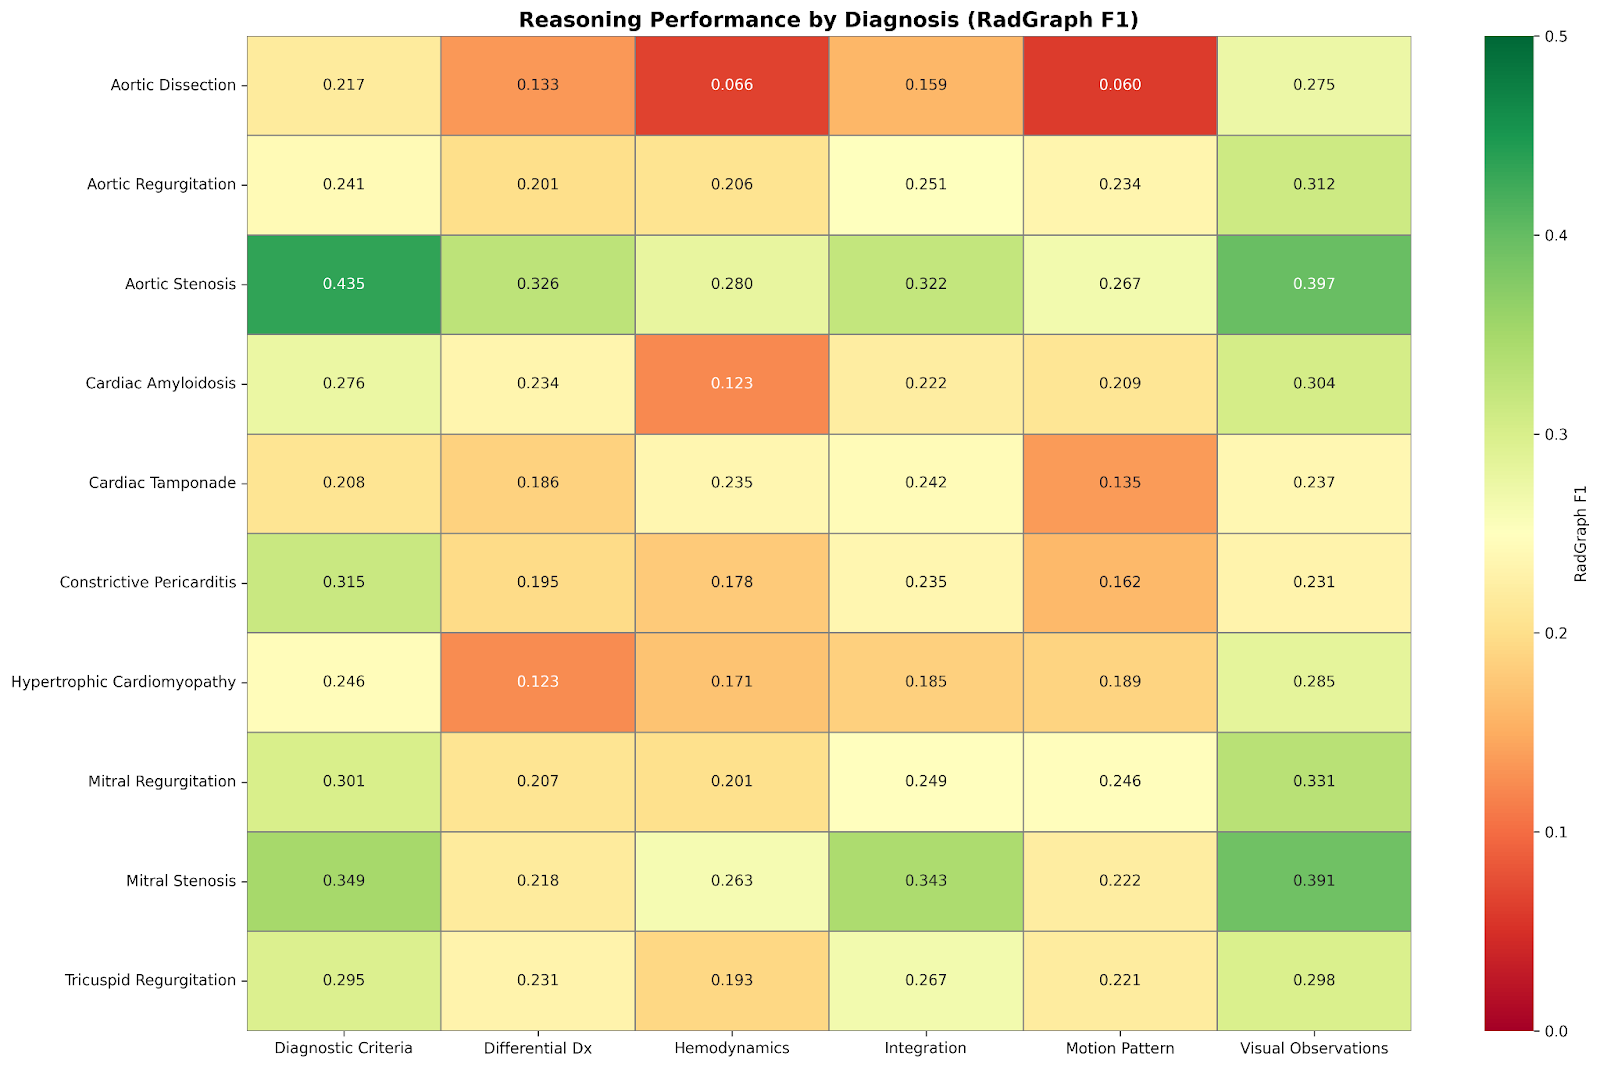
RadGraph F1 is 0.785 for description, 0.703 for open answers, 0.581 for comparison and 0.365 for reasoning. These entity/relation overlap scores are distinct from answer accuracy and do not directly establish clinical correctness or faithful reasoning. Supplementary Figures 1–5 retain the complete keyword-level results, including weaker categories.
The source’s sample counts need care: Table 1 gives 518 comparison, 558 reasoning and 1,801 template entries, whereas Supplementary Table 1 gives 33,554, 518 and 558 test entries respectively. The counting units or discrepancies are not resolved in the manuscript. Table 1 also states that 22 temporal-comparison ground-truth mappings were corrected before reporting results.
Results: numerical measurements and wall motion
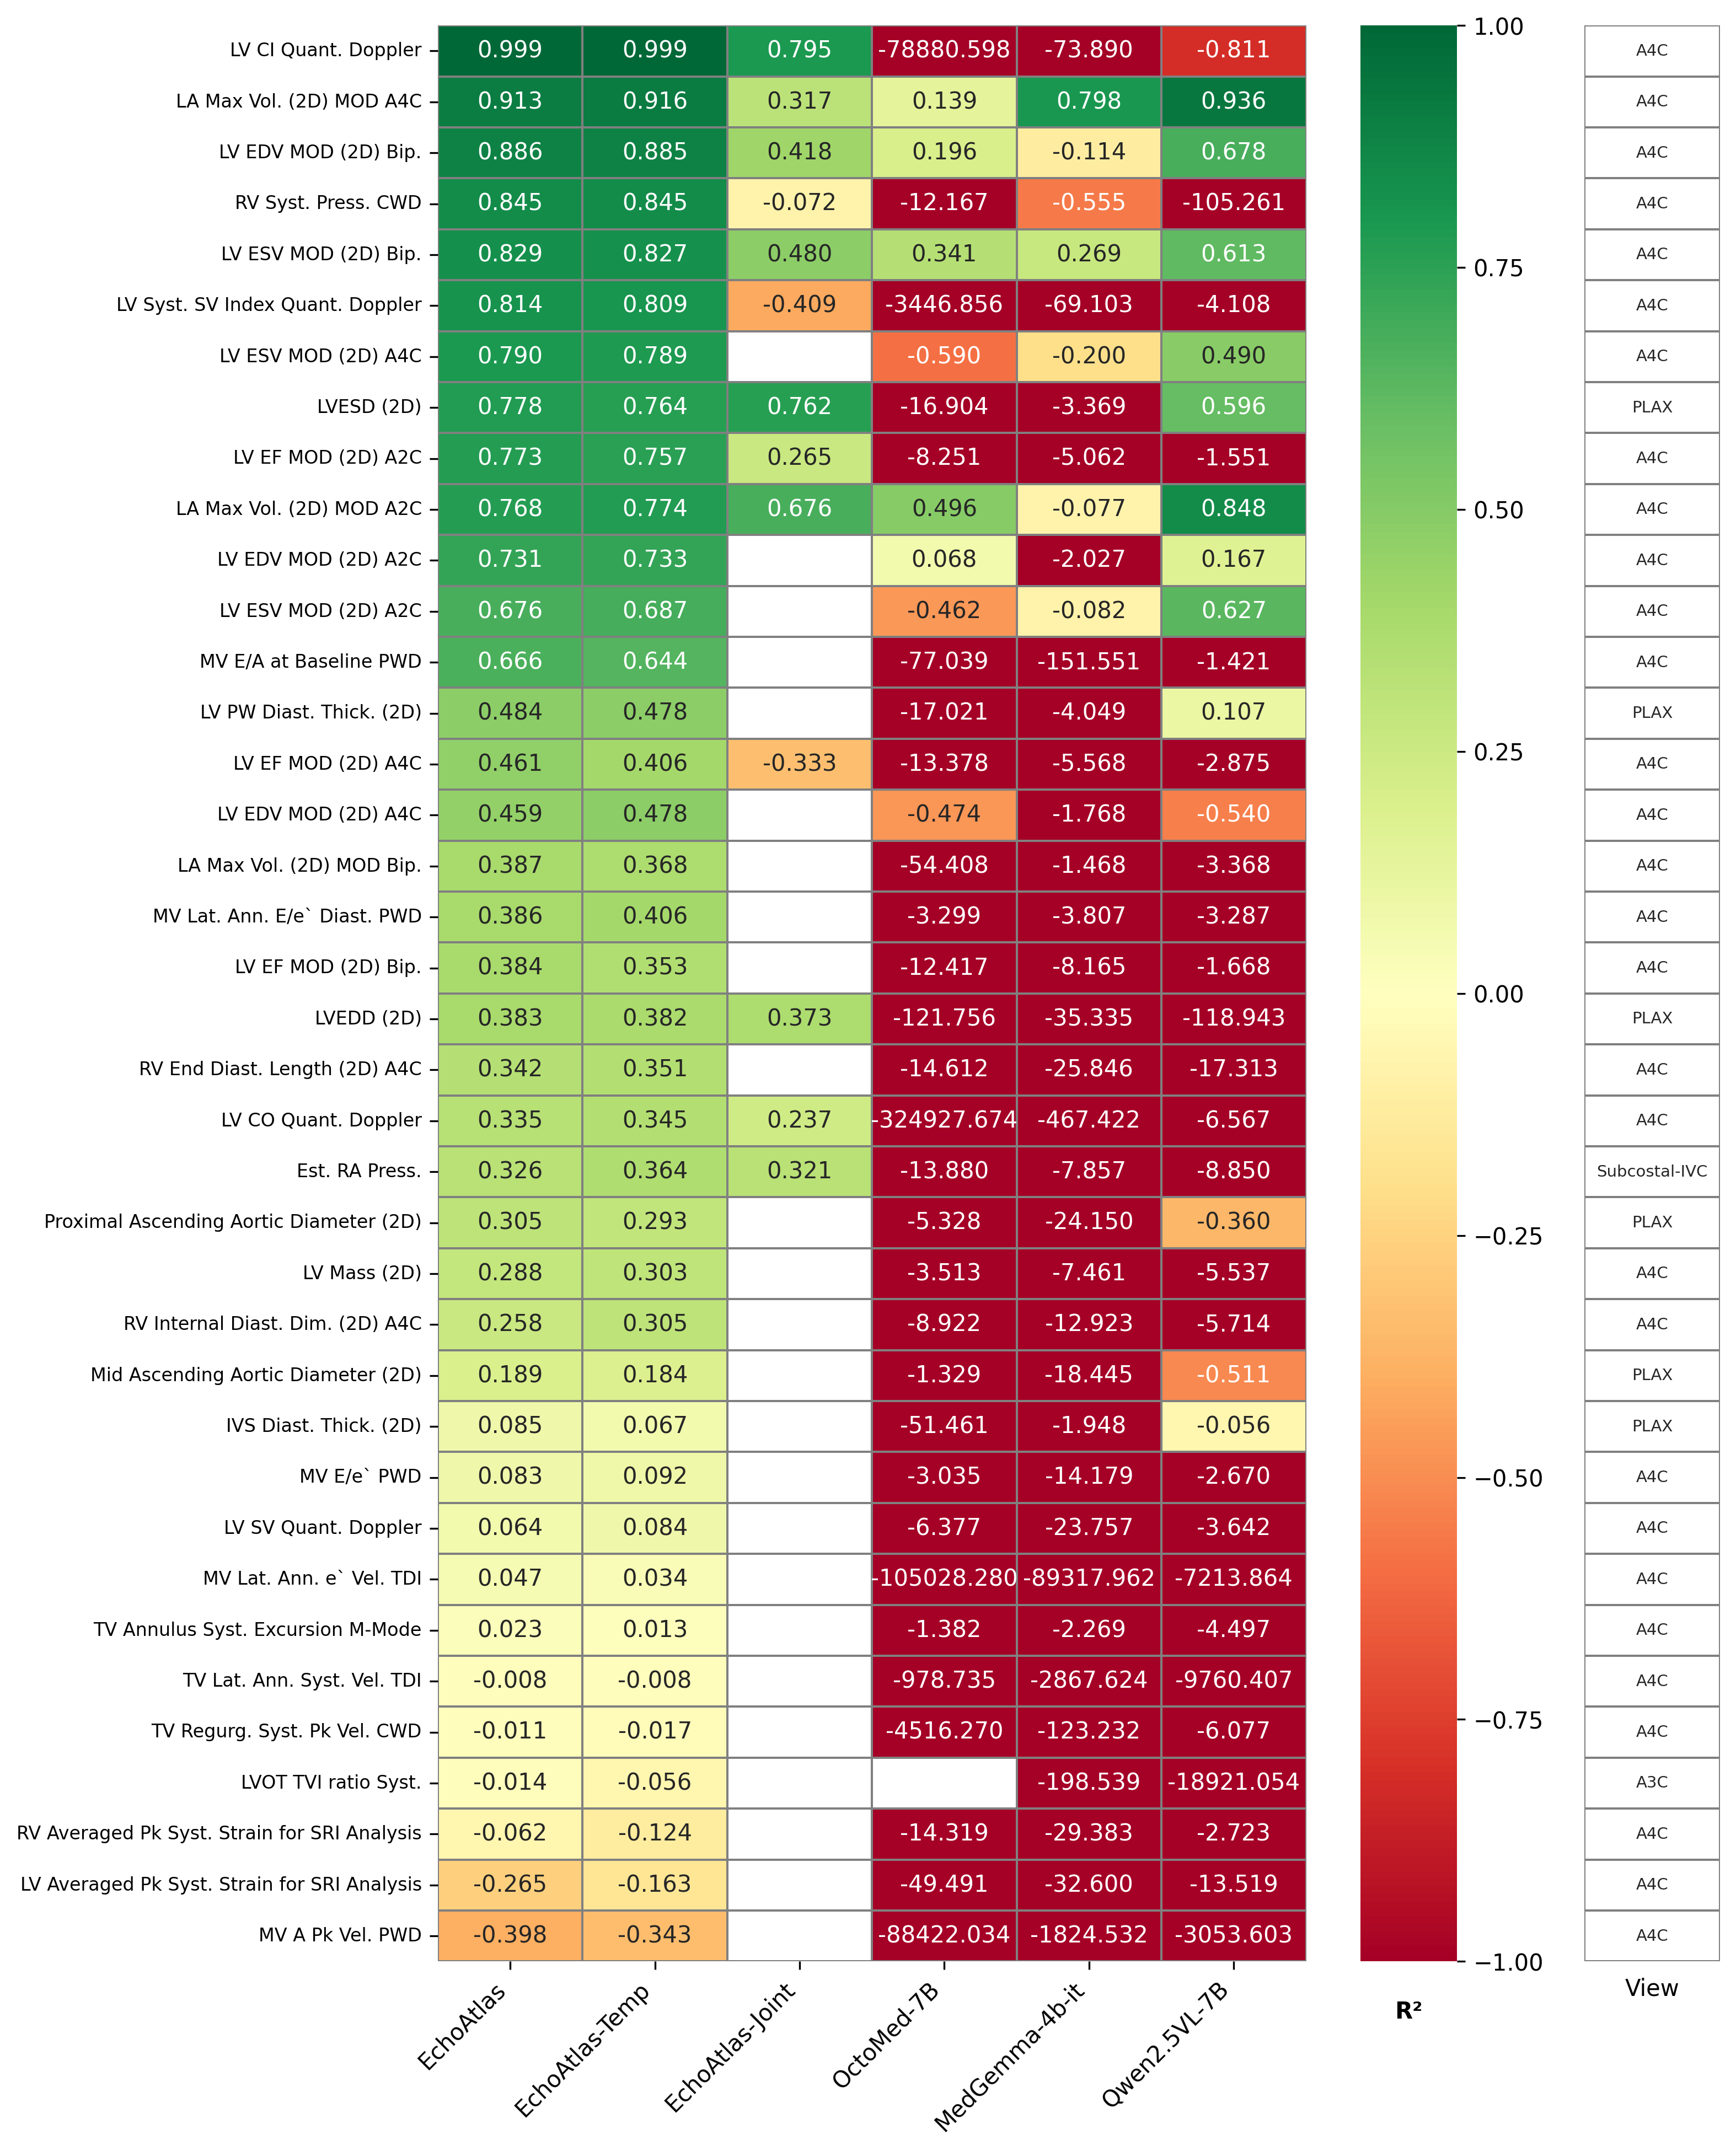
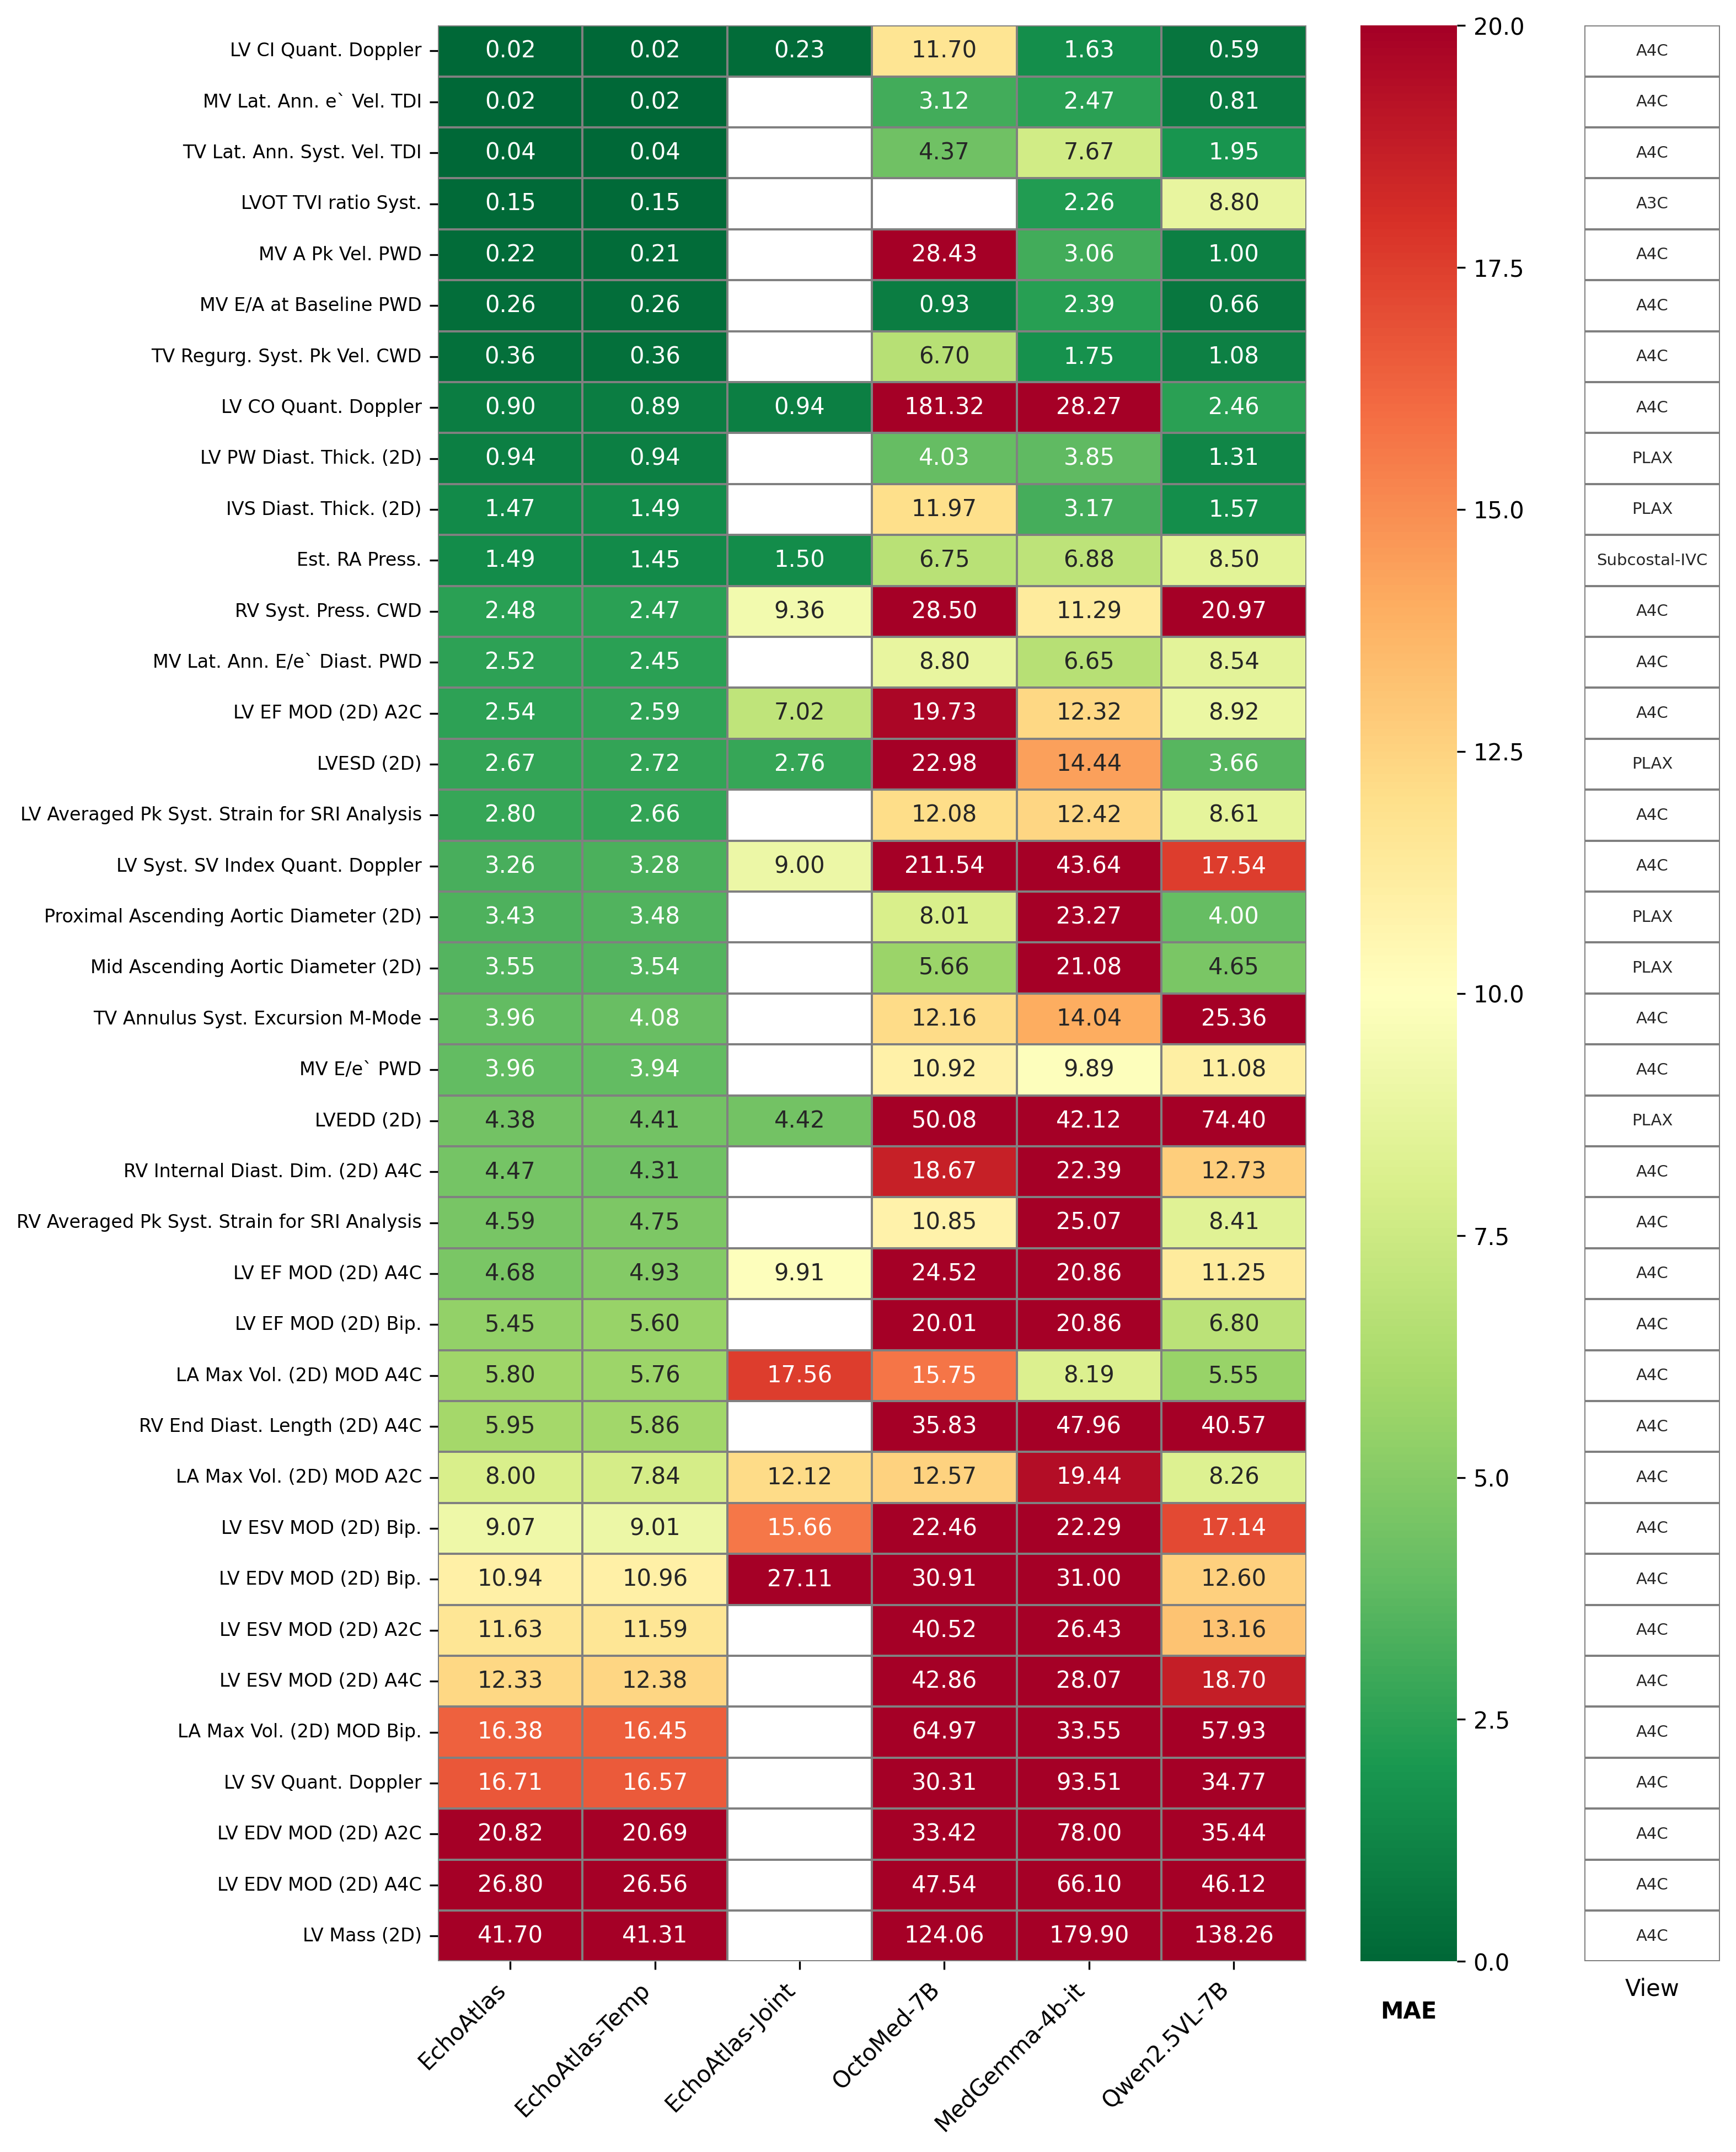
Across 27,391 numerical predictions, the paper reports pooled R²=0.897 and mean absolute error 6.73. These aggregate heterogeneous quantities and units; the pooled error is not a single clinically interpretable measurement error. Per-parameter results in Figure 2 are more informative.
Examples include right-ventricular systolic pressure R²=0.845 with error 2.485, biplane left-ventricular end-diastolic volume R²=0.886 with error 10.94, and ejection fraction R²=0.773 from the two-chamber view versus 0.461 from the four-chamber view, with errors 2.54 and 4.68 percentage points. Performance is not uniformly strong: many strain and Doppler quantities have negative R². Spectral Doppler is absent from the input.
Methods and Figure 2 contain 38 numerical parameters, although Discussion says 39. Approximately 29% exceed R²=0.7 and 63% exceed 0.3. These are report-supervised estimates from videos, without a specialized measurement head or demonstrated direct caliper measurement. Joint-model blank cells indicate tasks not trained, rather than zero scores.
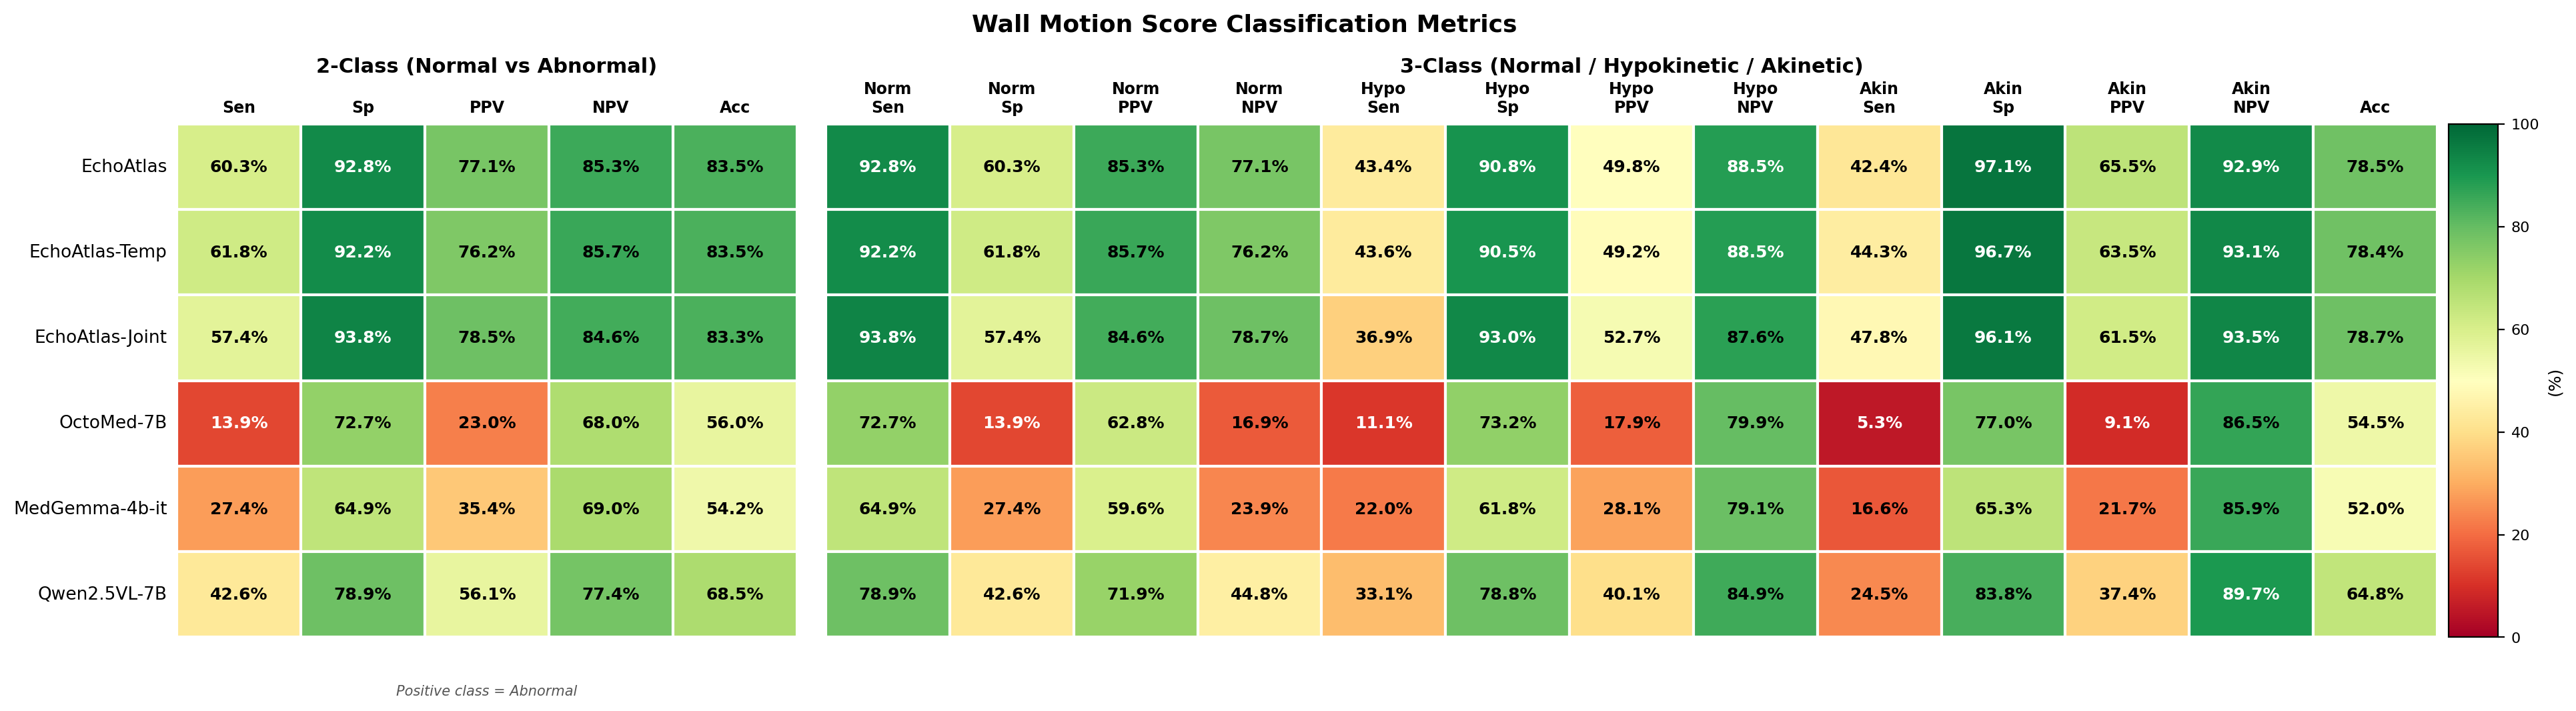
For 3,478 regional wall-motion assessments across 16 segments, the main text gives three-class accuracy 0.745, ranging from 0.586 to 0.892 by segment. Figure 2c instead shows 78.5% for EchoAtlas; the manuscript does not explain the aggregation difference. Binary normal/abnormal performance is higher, with reported positive and negative predictive values of 0.771 and 0.853. These tasks and numerical estimates have different metrics and denominators.
Results: clinical reasoning
Reasoning answers are divided into observations, motion, hemodynamics, differential considerations, diagnostic criteria/integration, and summary. Automated scores are strongest for visual observation and criteria and weaker for motion and hemodynamics. Disease groups range from 140 aortic-stenosis cases to only four dissections and eight tamponades; rare-category results have limited precision.
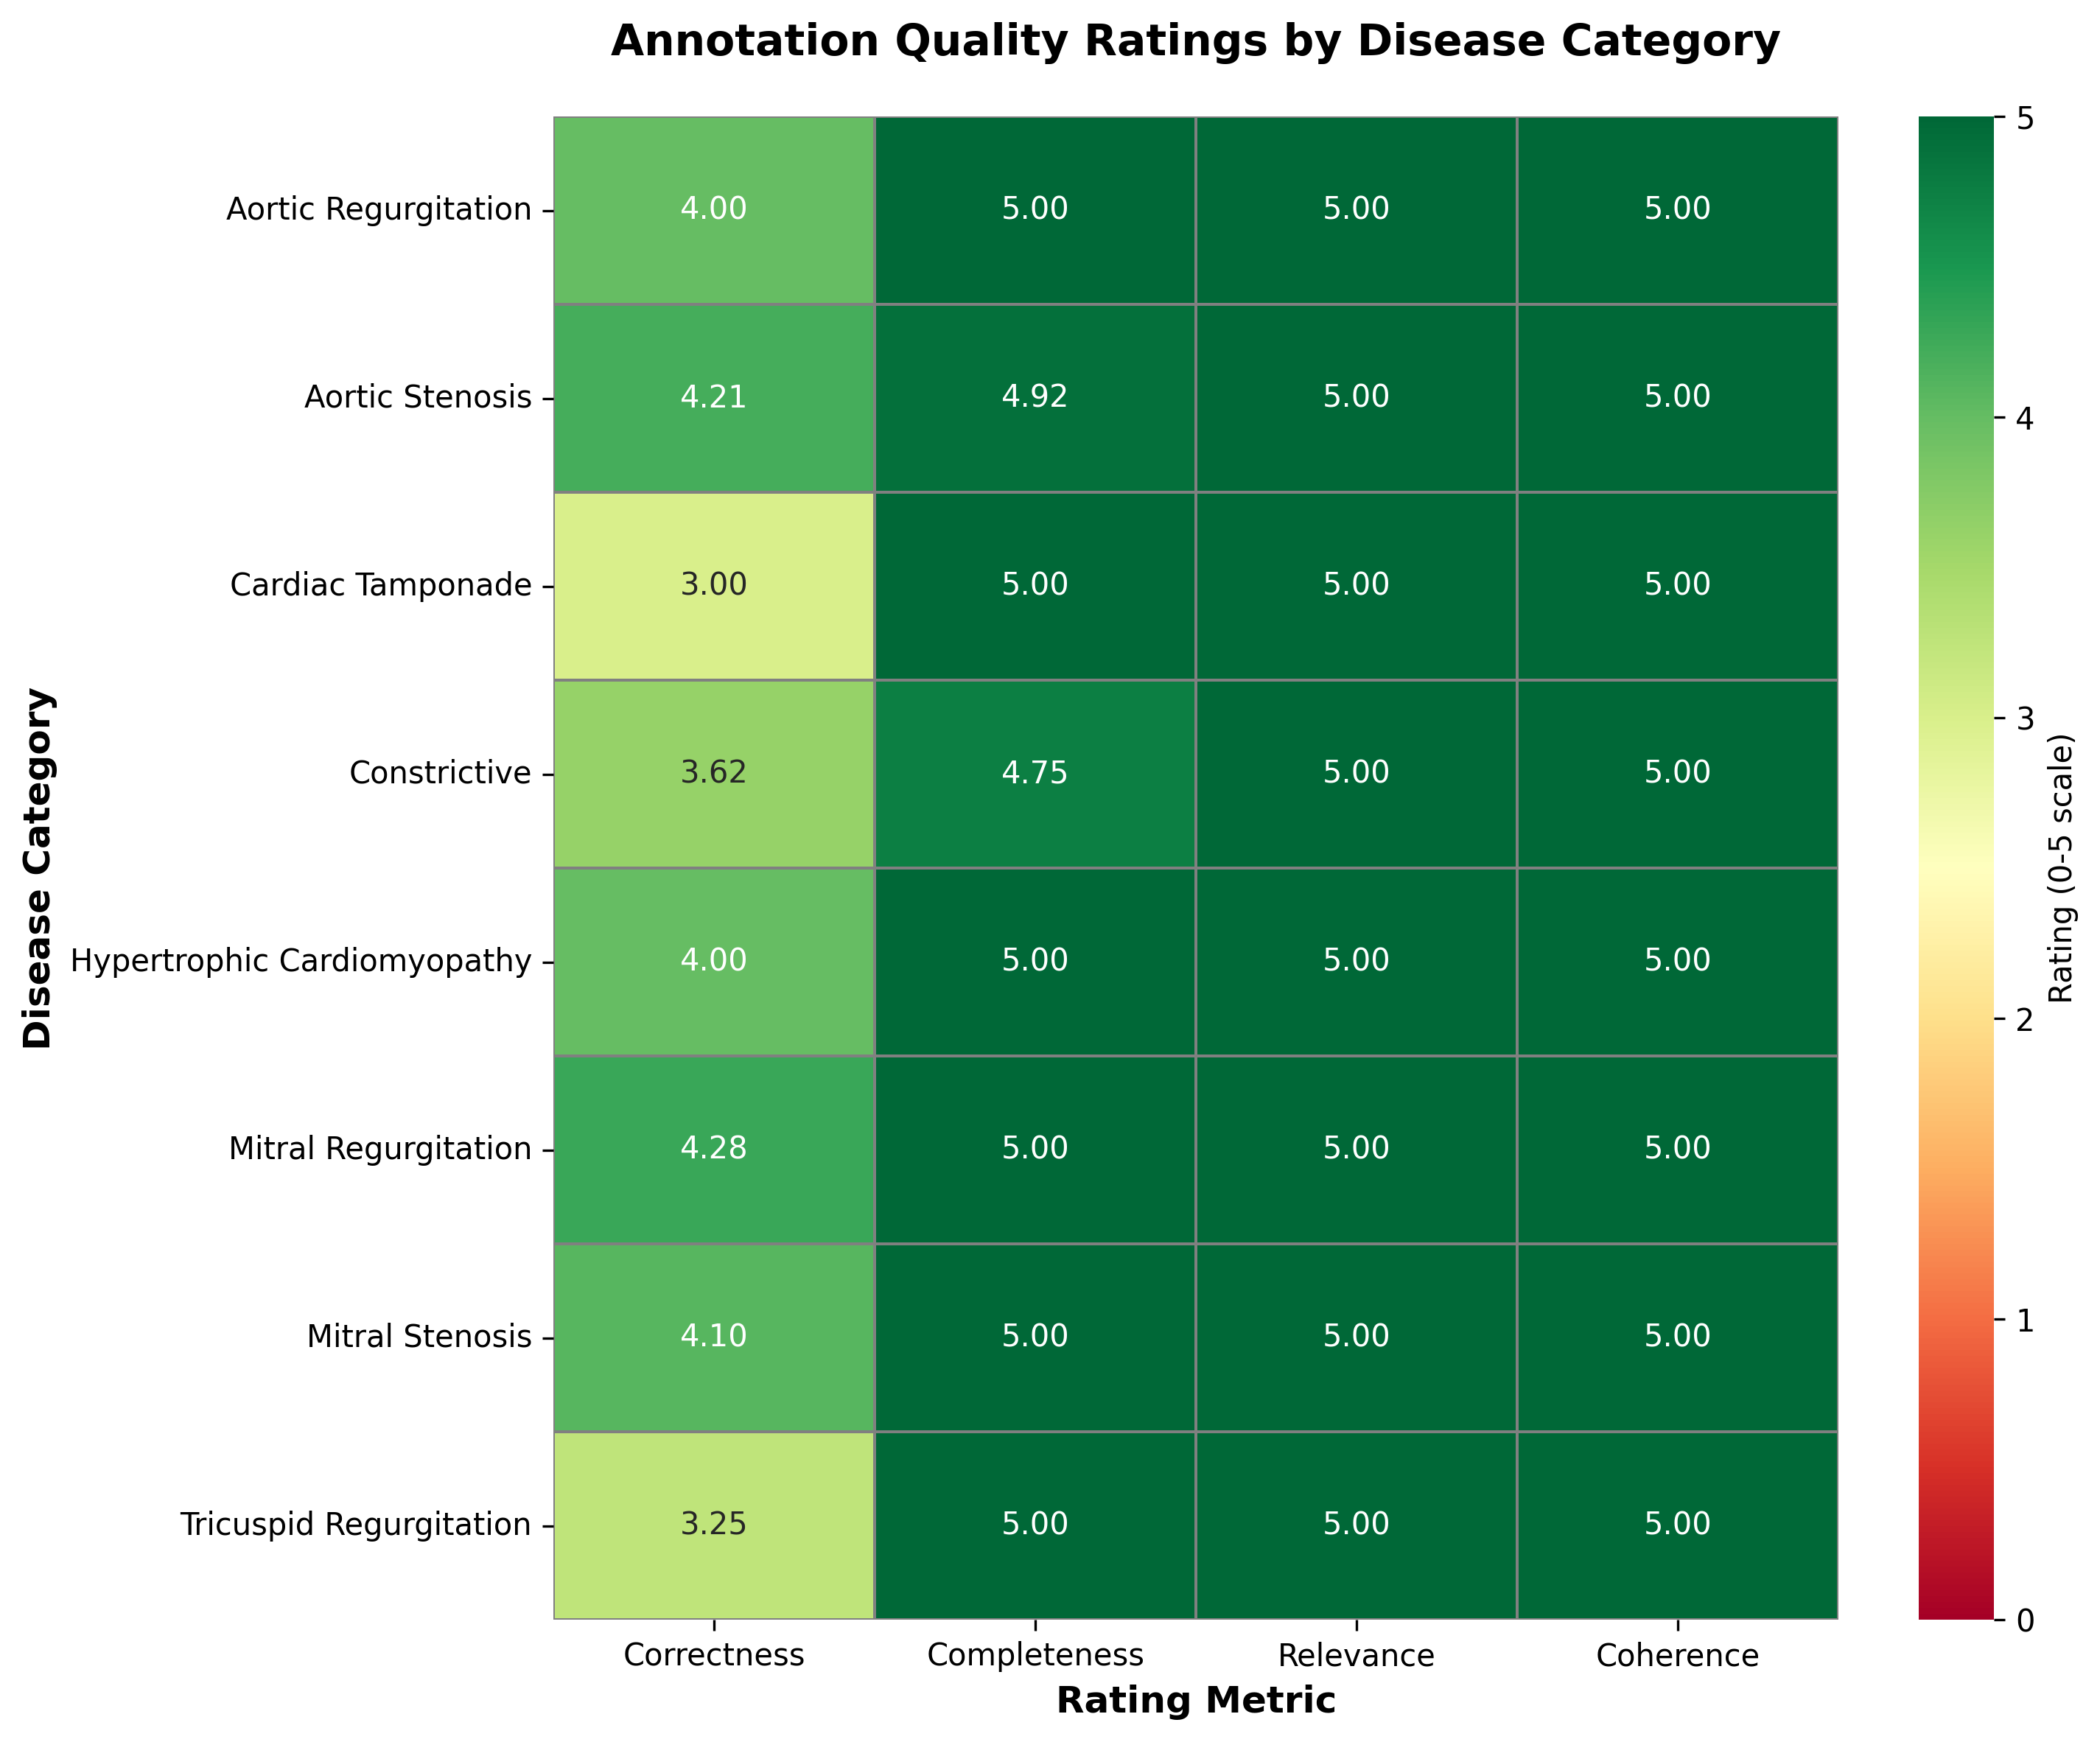
Two cardiologists review 50 disease-stratified random cases. The main text reports relevance and coherence 5.00, completeness 4.96±0.14, and correctness 4.00±0.81. The Figure 3b caption instead gives completeness 4.94±0.25 and correctness 3.87±0.95. These differing summaries remain unresolved and are preserved in the original caption.
Agreement is reported as 86.4%, with κ=0.553. Readable, complete explanations can still contain incorrect diagnoses or plausible explanations of them. This small expert sample supports an assessment of answer quality, not proof that the generated reasoning faithfully reflects the model’s decision process.
Results: template reporting
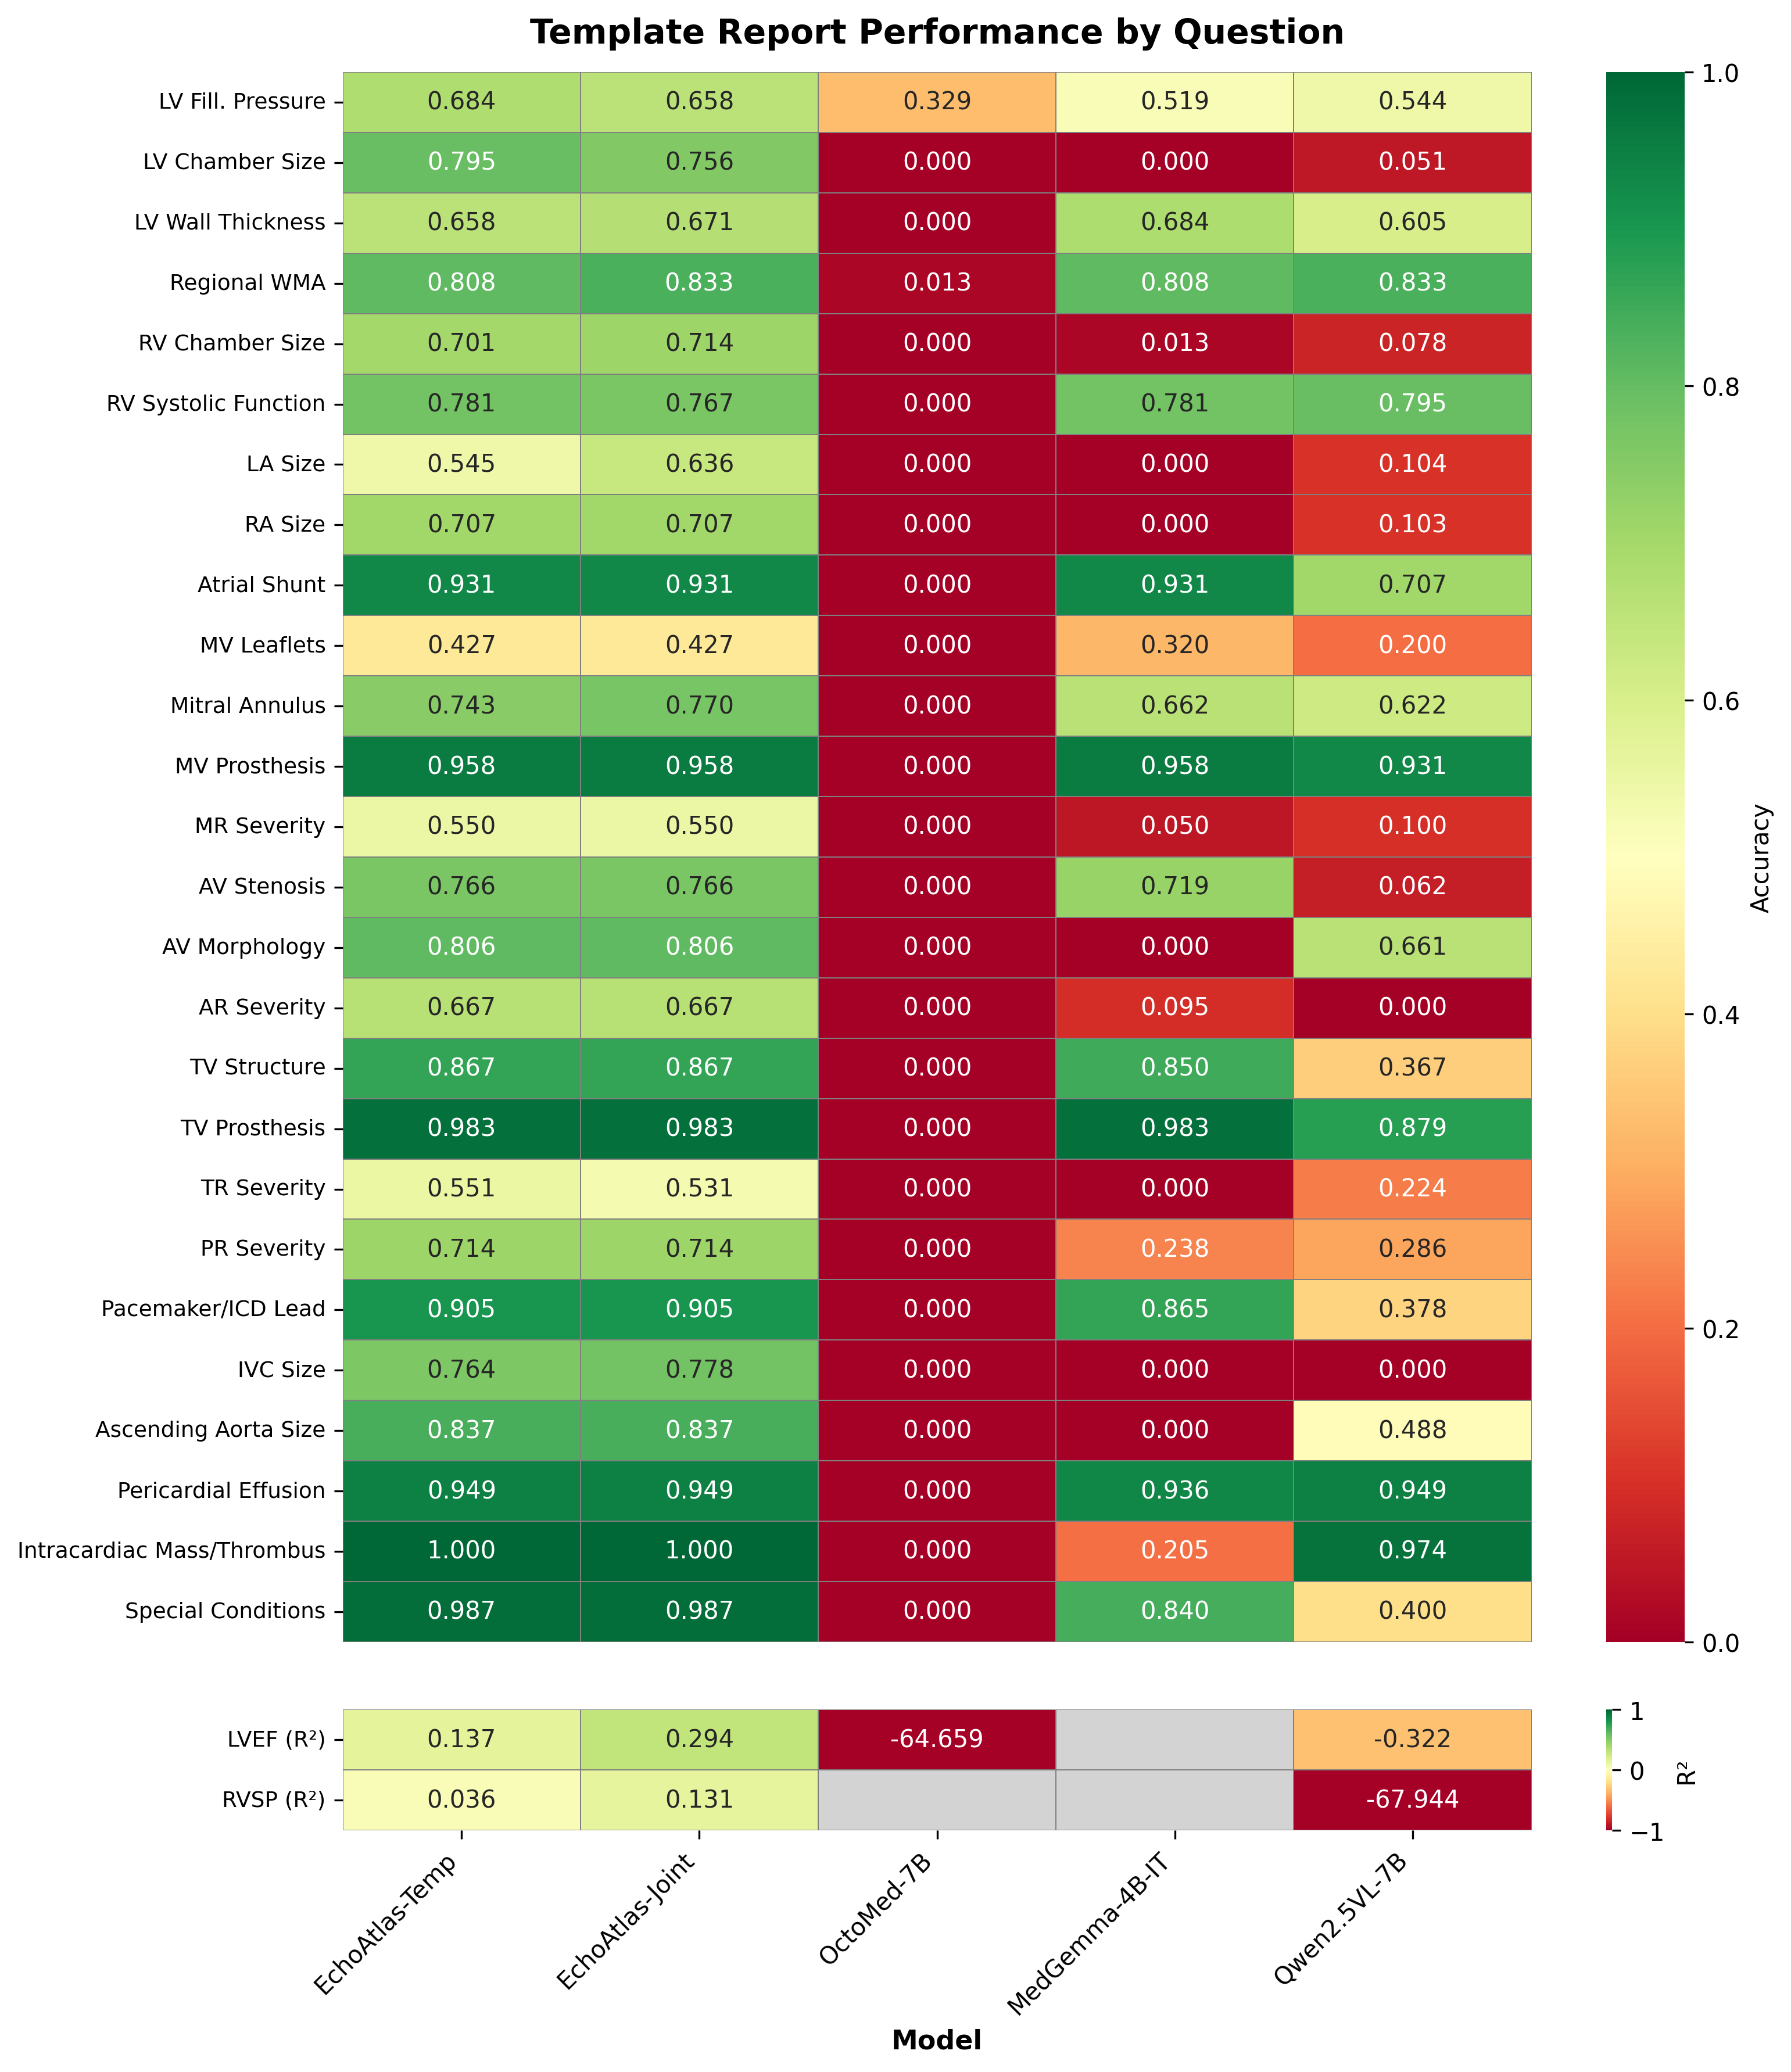
Template-specific fine-tuning yields mean accuracy 0.783 (95% interval 0.763–0.803); joint training yields 0.787 (0.767–0.807). Their difference is small. Strong entries include mass/thrombus, tricuspid prosthesis and effusion; mitral-leaflet classification and fine-grained regurgitation grading remain substantially weaker. Supplementary Figure 6 retains all items.
Template numerical estimates deteriorate: joint/template-only R² is 0.294/0.137 for ejection fraction and 0.131/0.036 for right-ventricular systolic pressure. Template inputs use fewer clips per view, so this is not an isolated test of output formatting. Very low baseline results also reflect refusals or unparsable outputs.
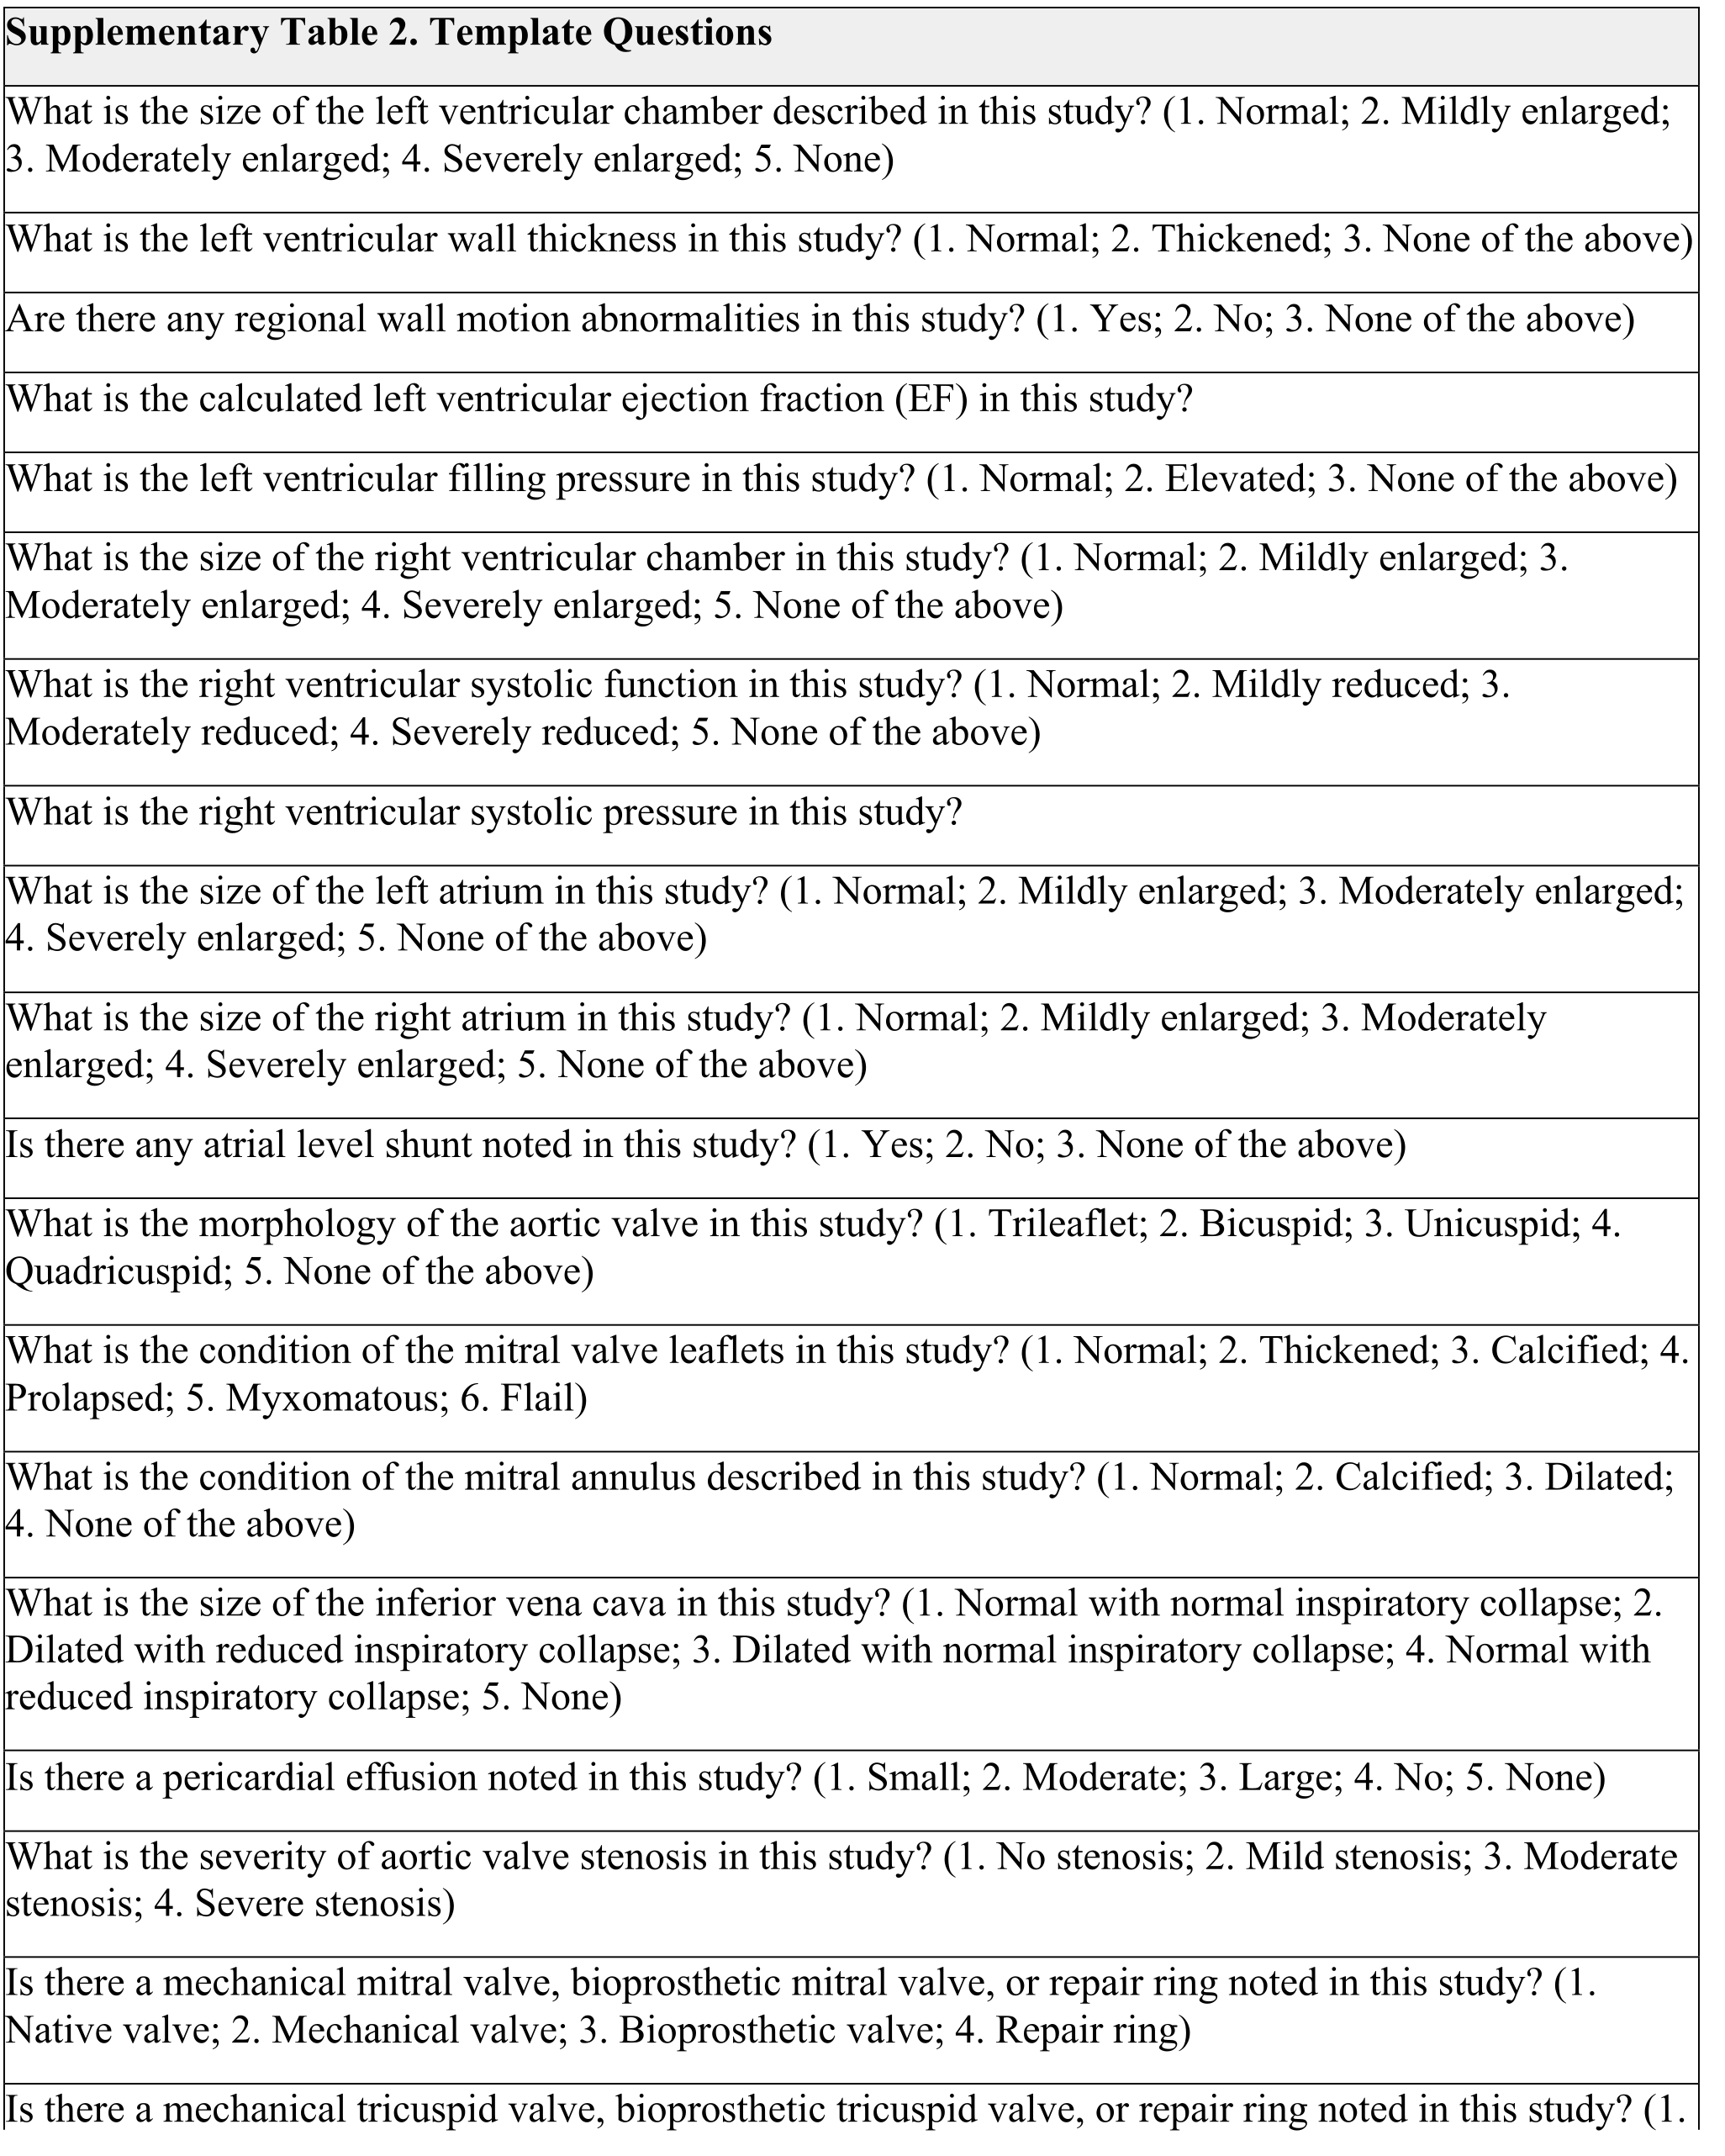
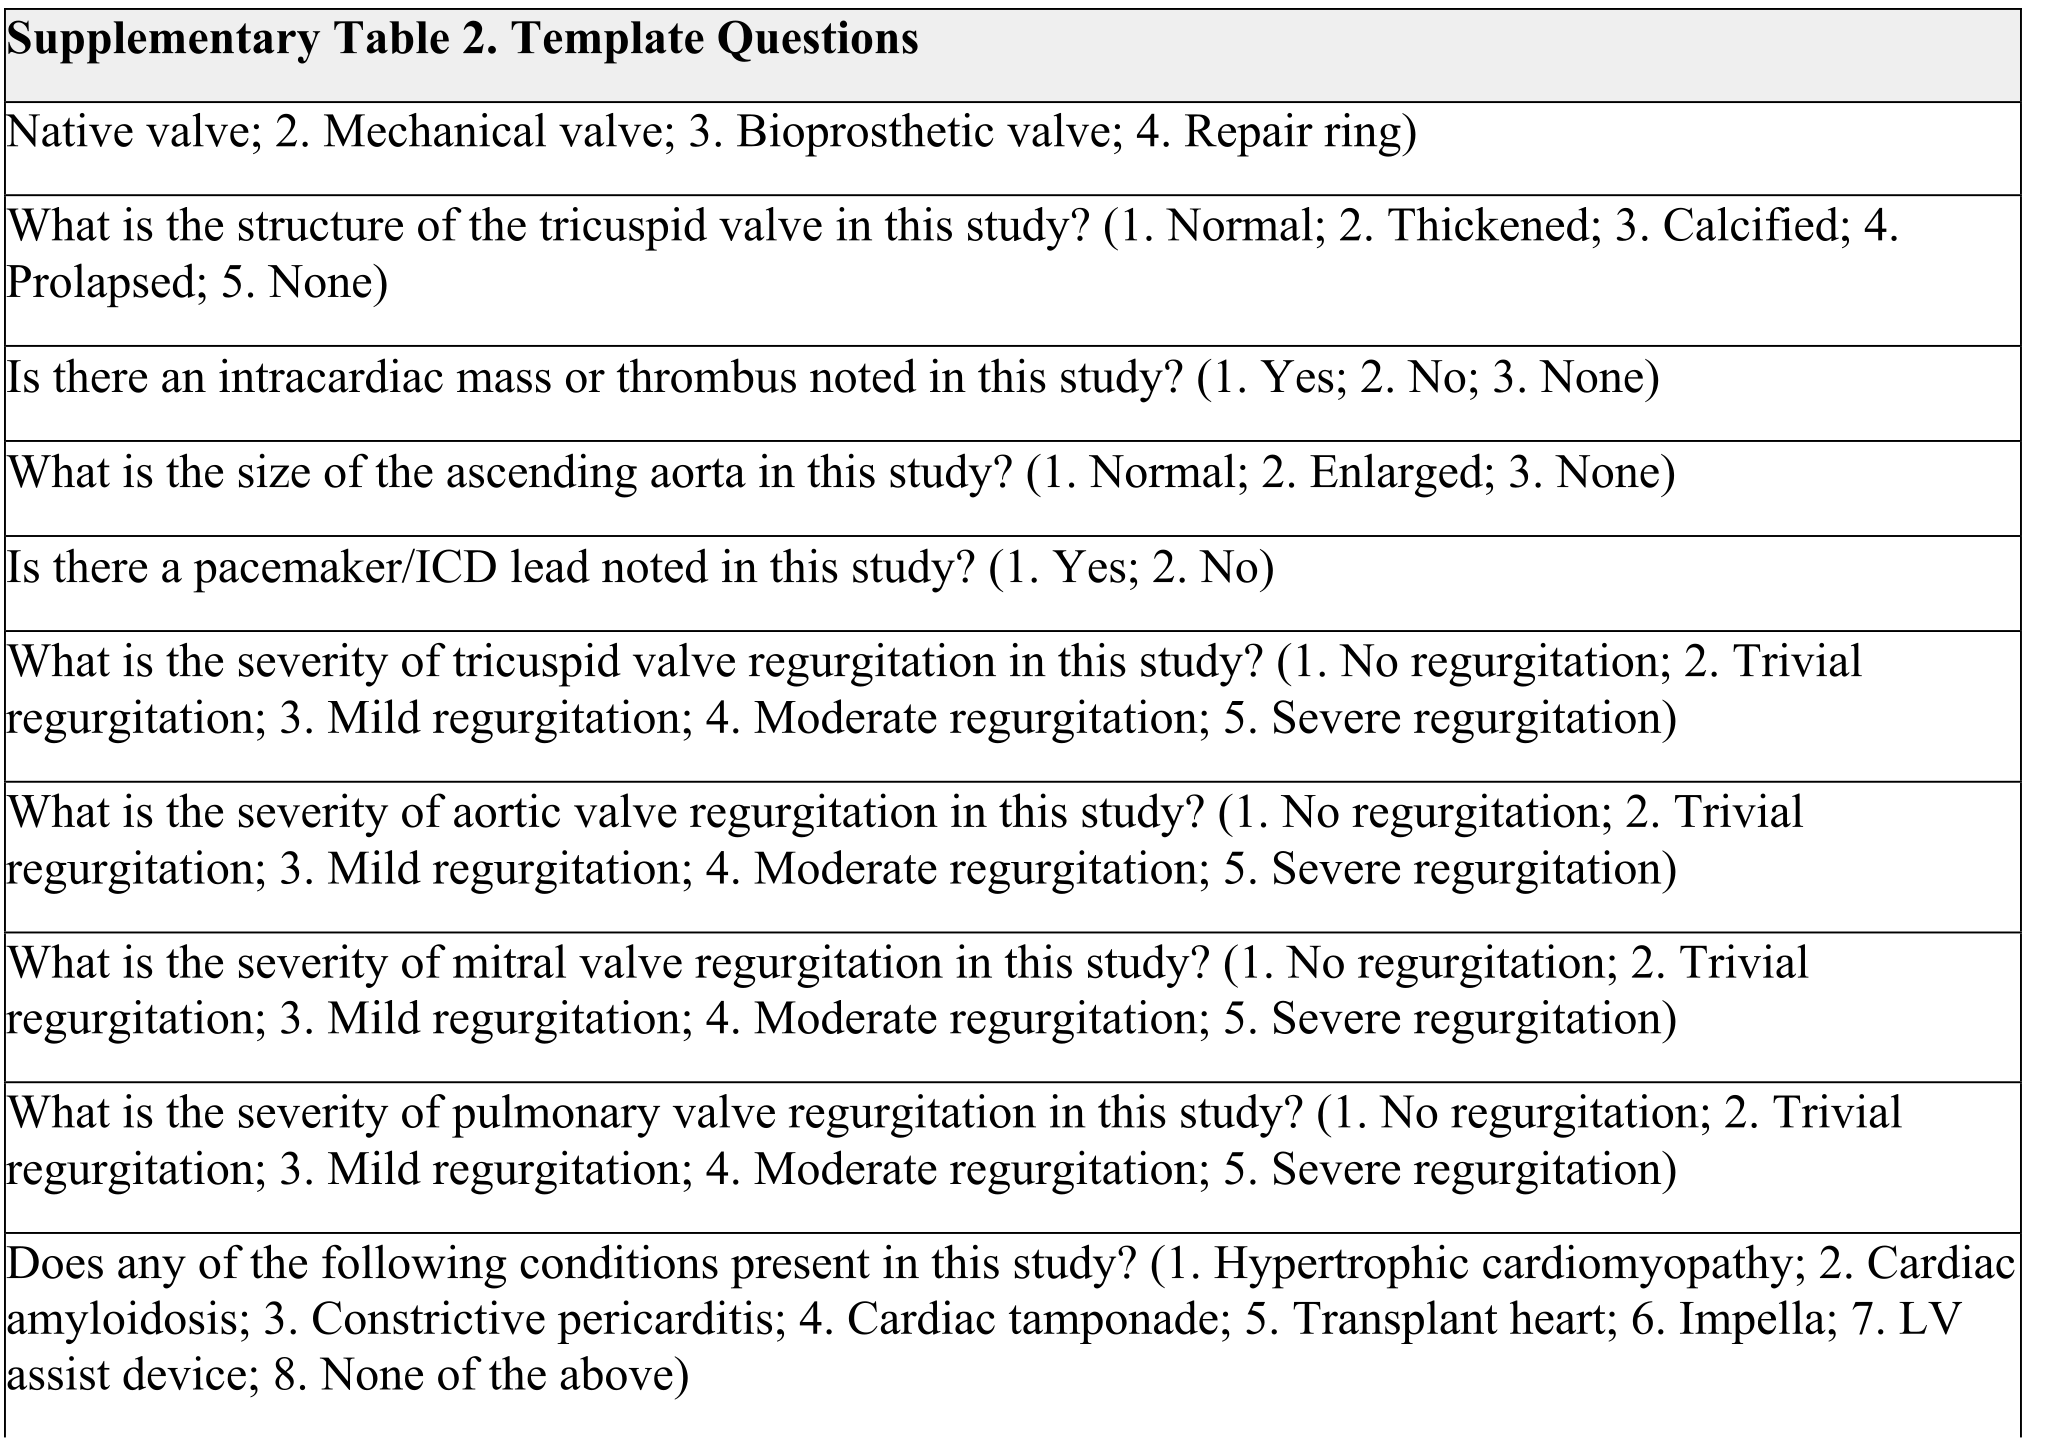
Although Methods calls this a 29-question template, Supplementary Table 2 contains 28 questions: 26 categorical and two numerical, consistent with Supplementary Table 1. Every printed question and answer option is retained below.
Results: external validation
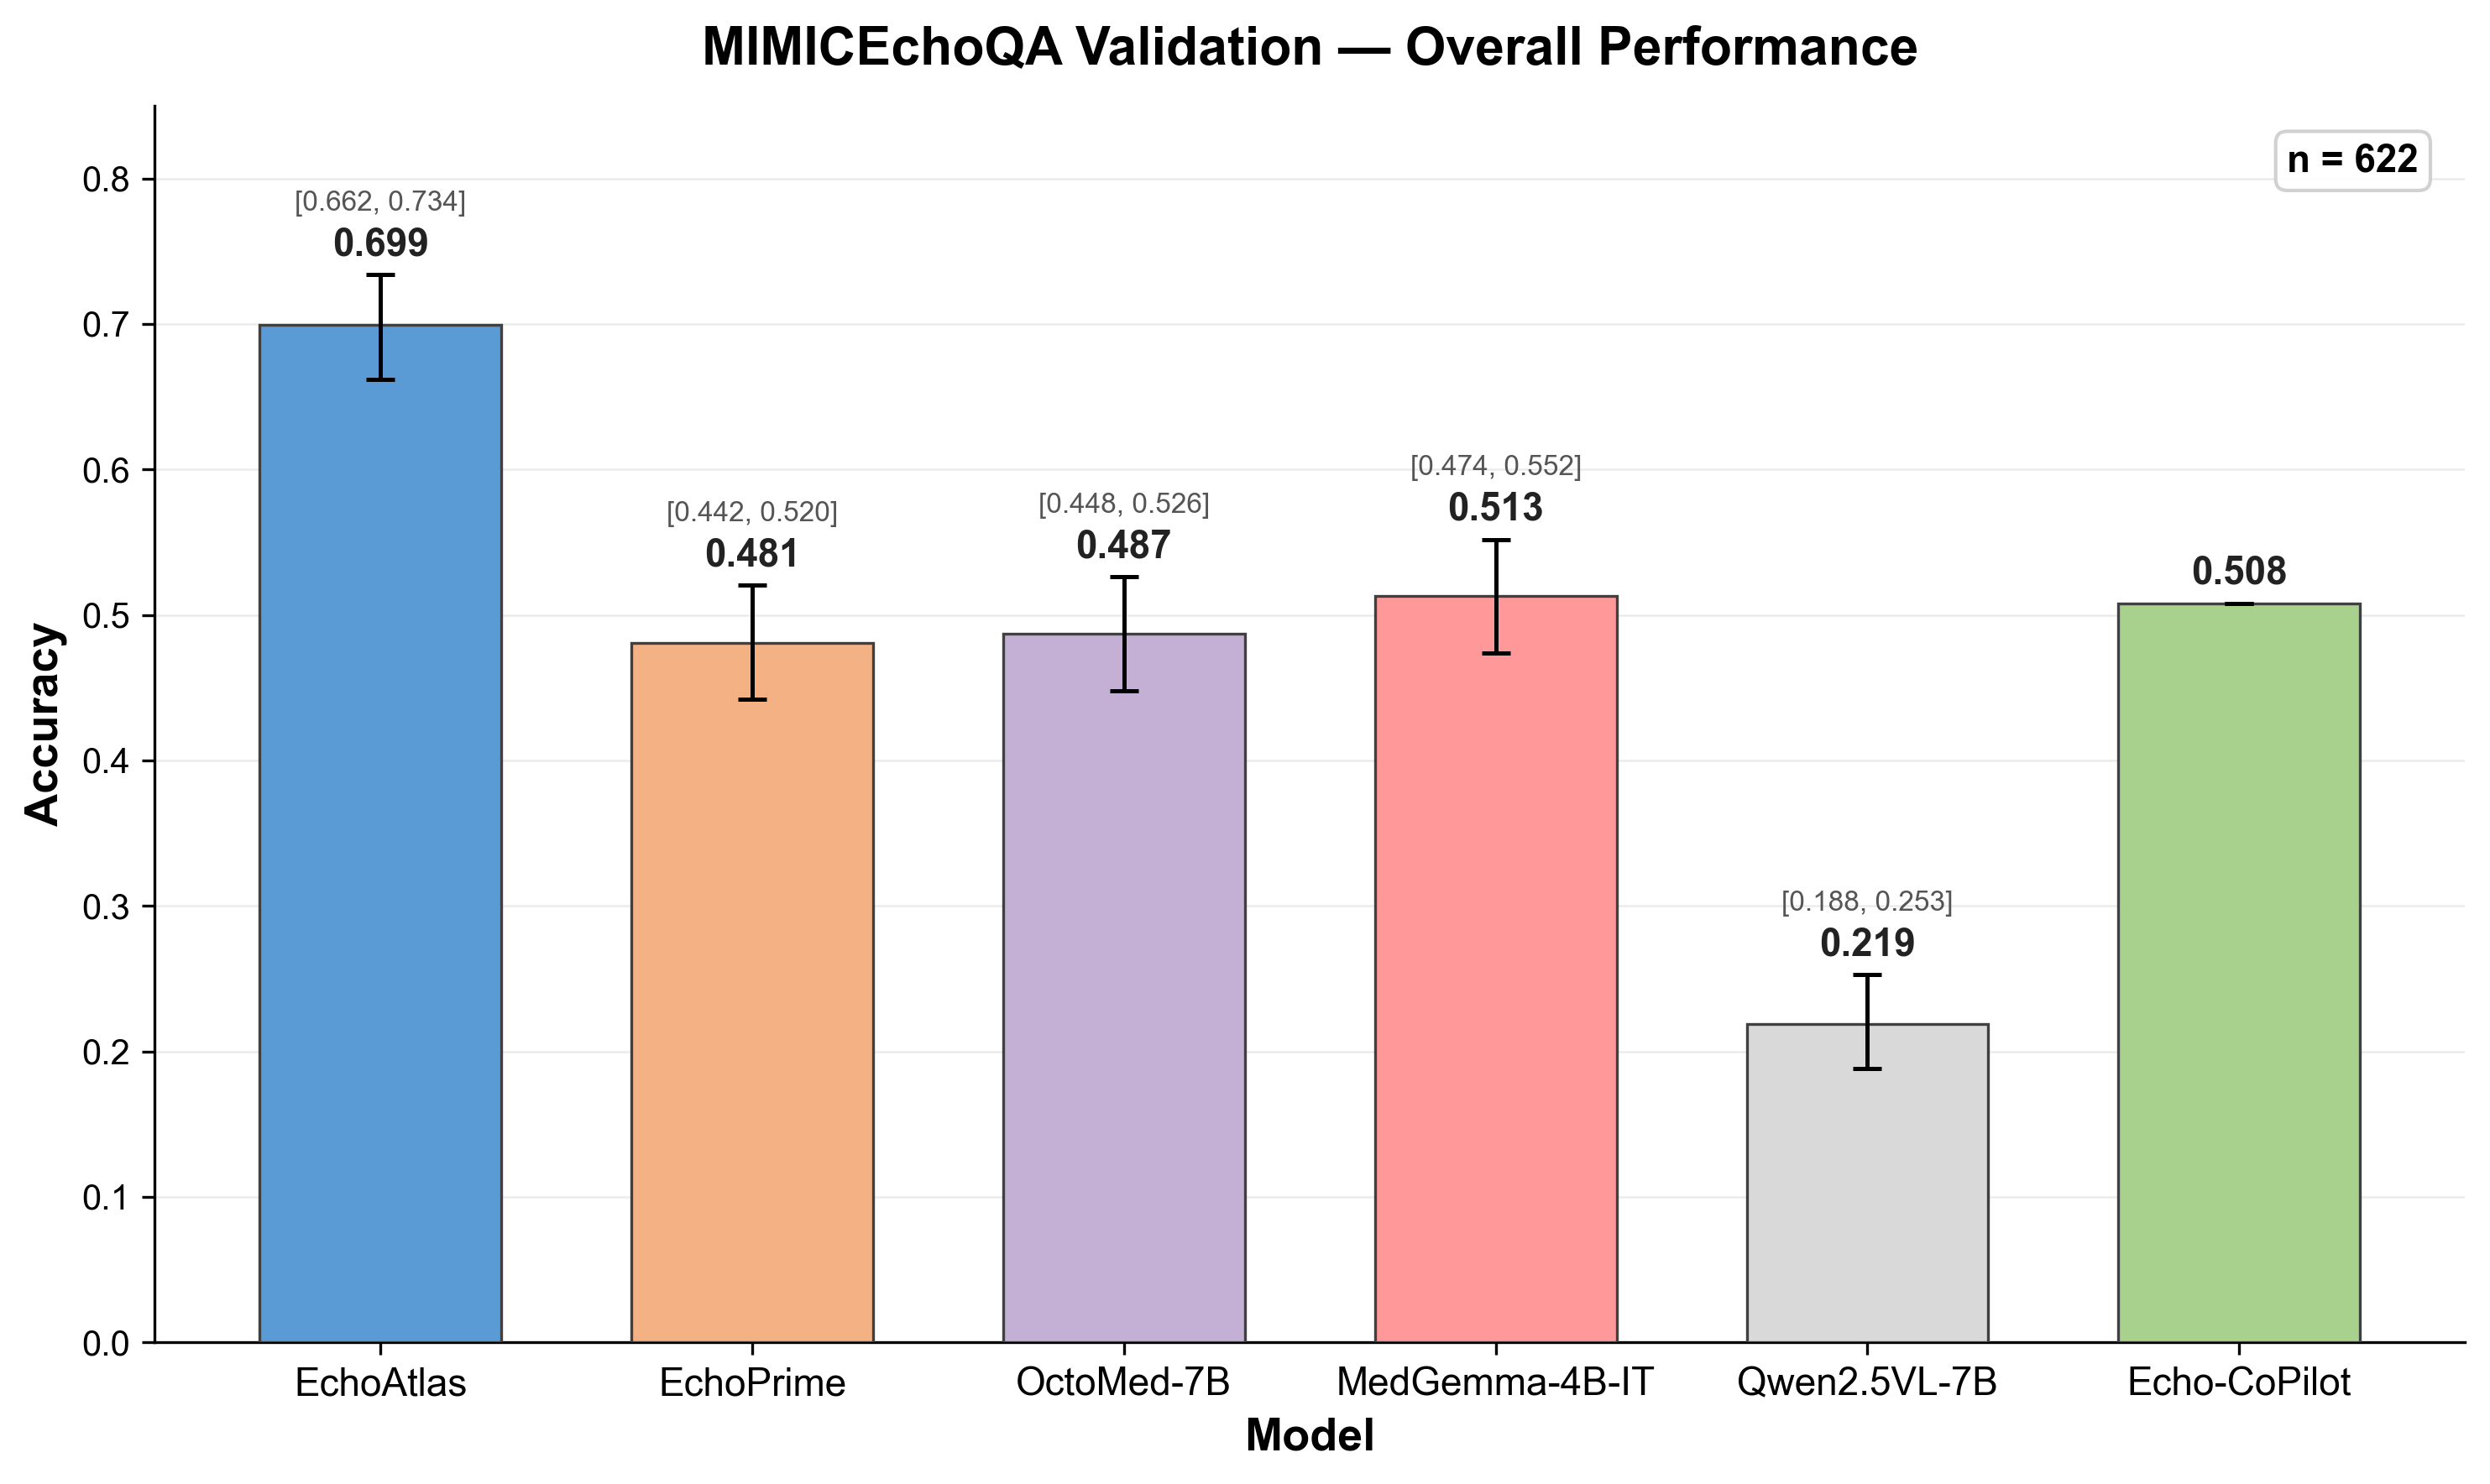
MIMIC-EchoQA provides 622 four-option questions, each paired with a single video from a different institution. EchoAtlas answers 435 correctly: accuracy 0.699 (95% interval 0.662–0.734). Figure 4 shows MedGemma 0.513, OctoMed 0.487, adapted EchoPrime 0.481 and base Qwen 0.219. The prior Echo-CoPilot value 0.508 is taken from the literature [18] [19].
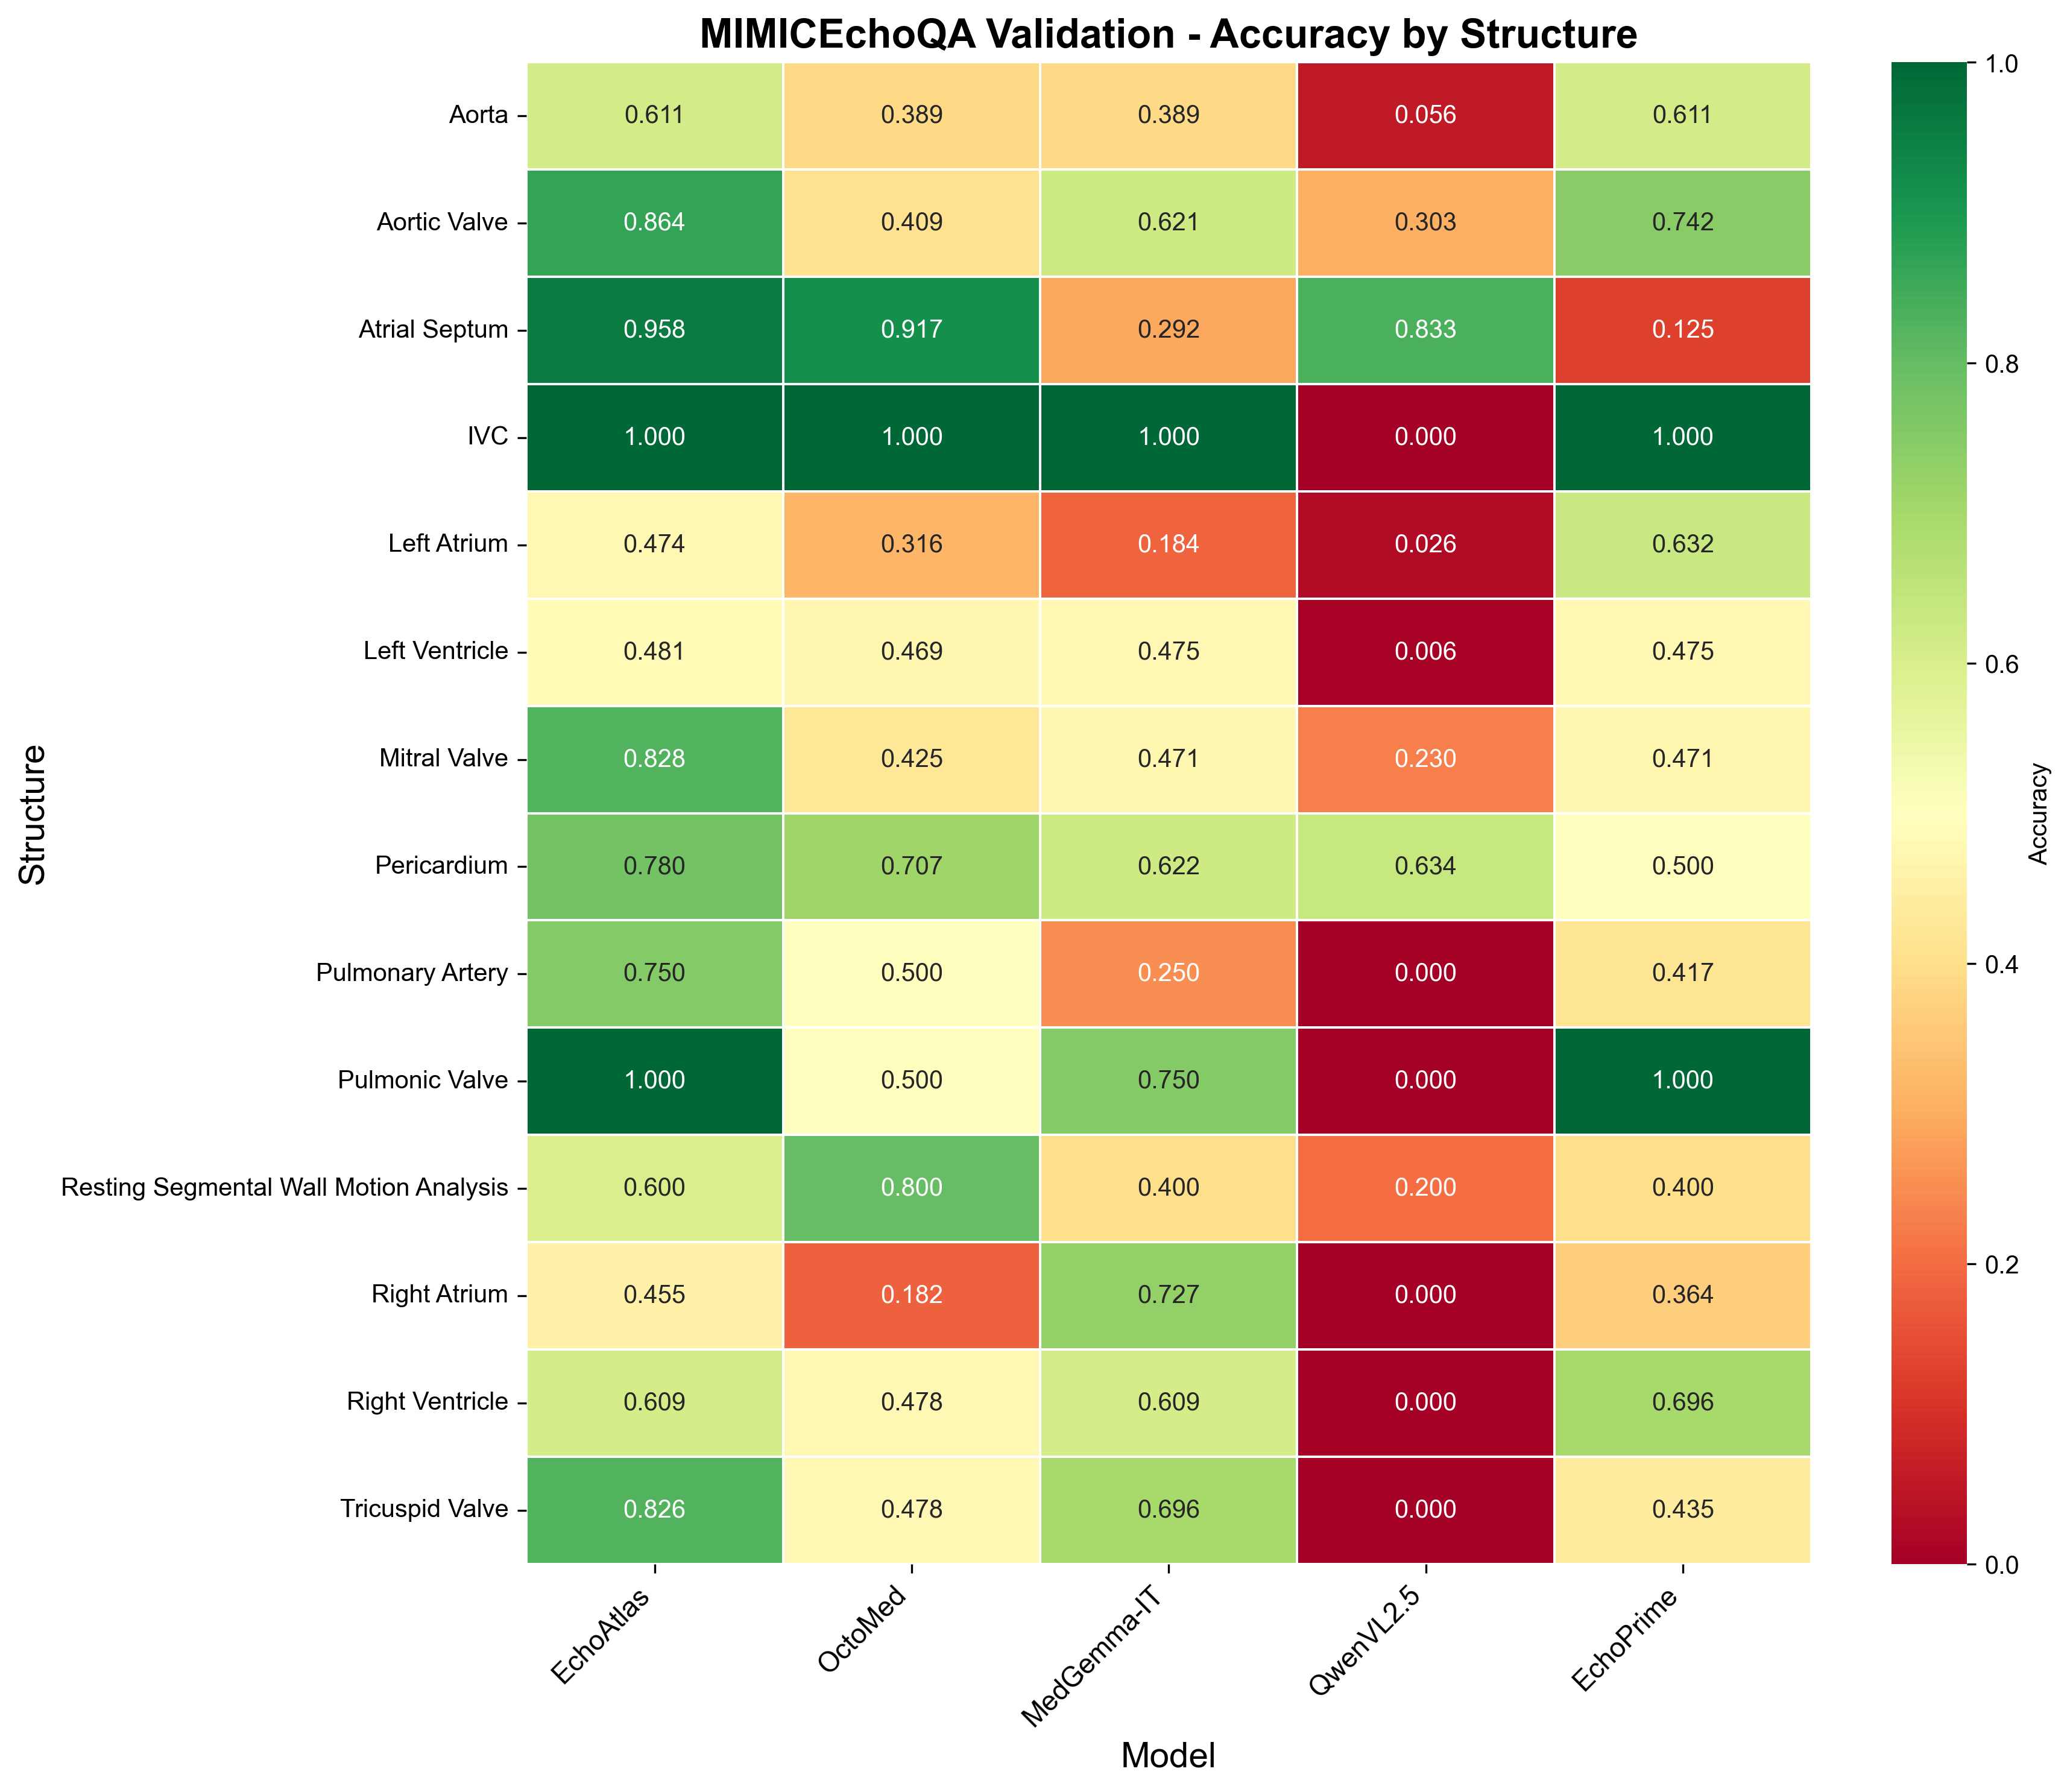
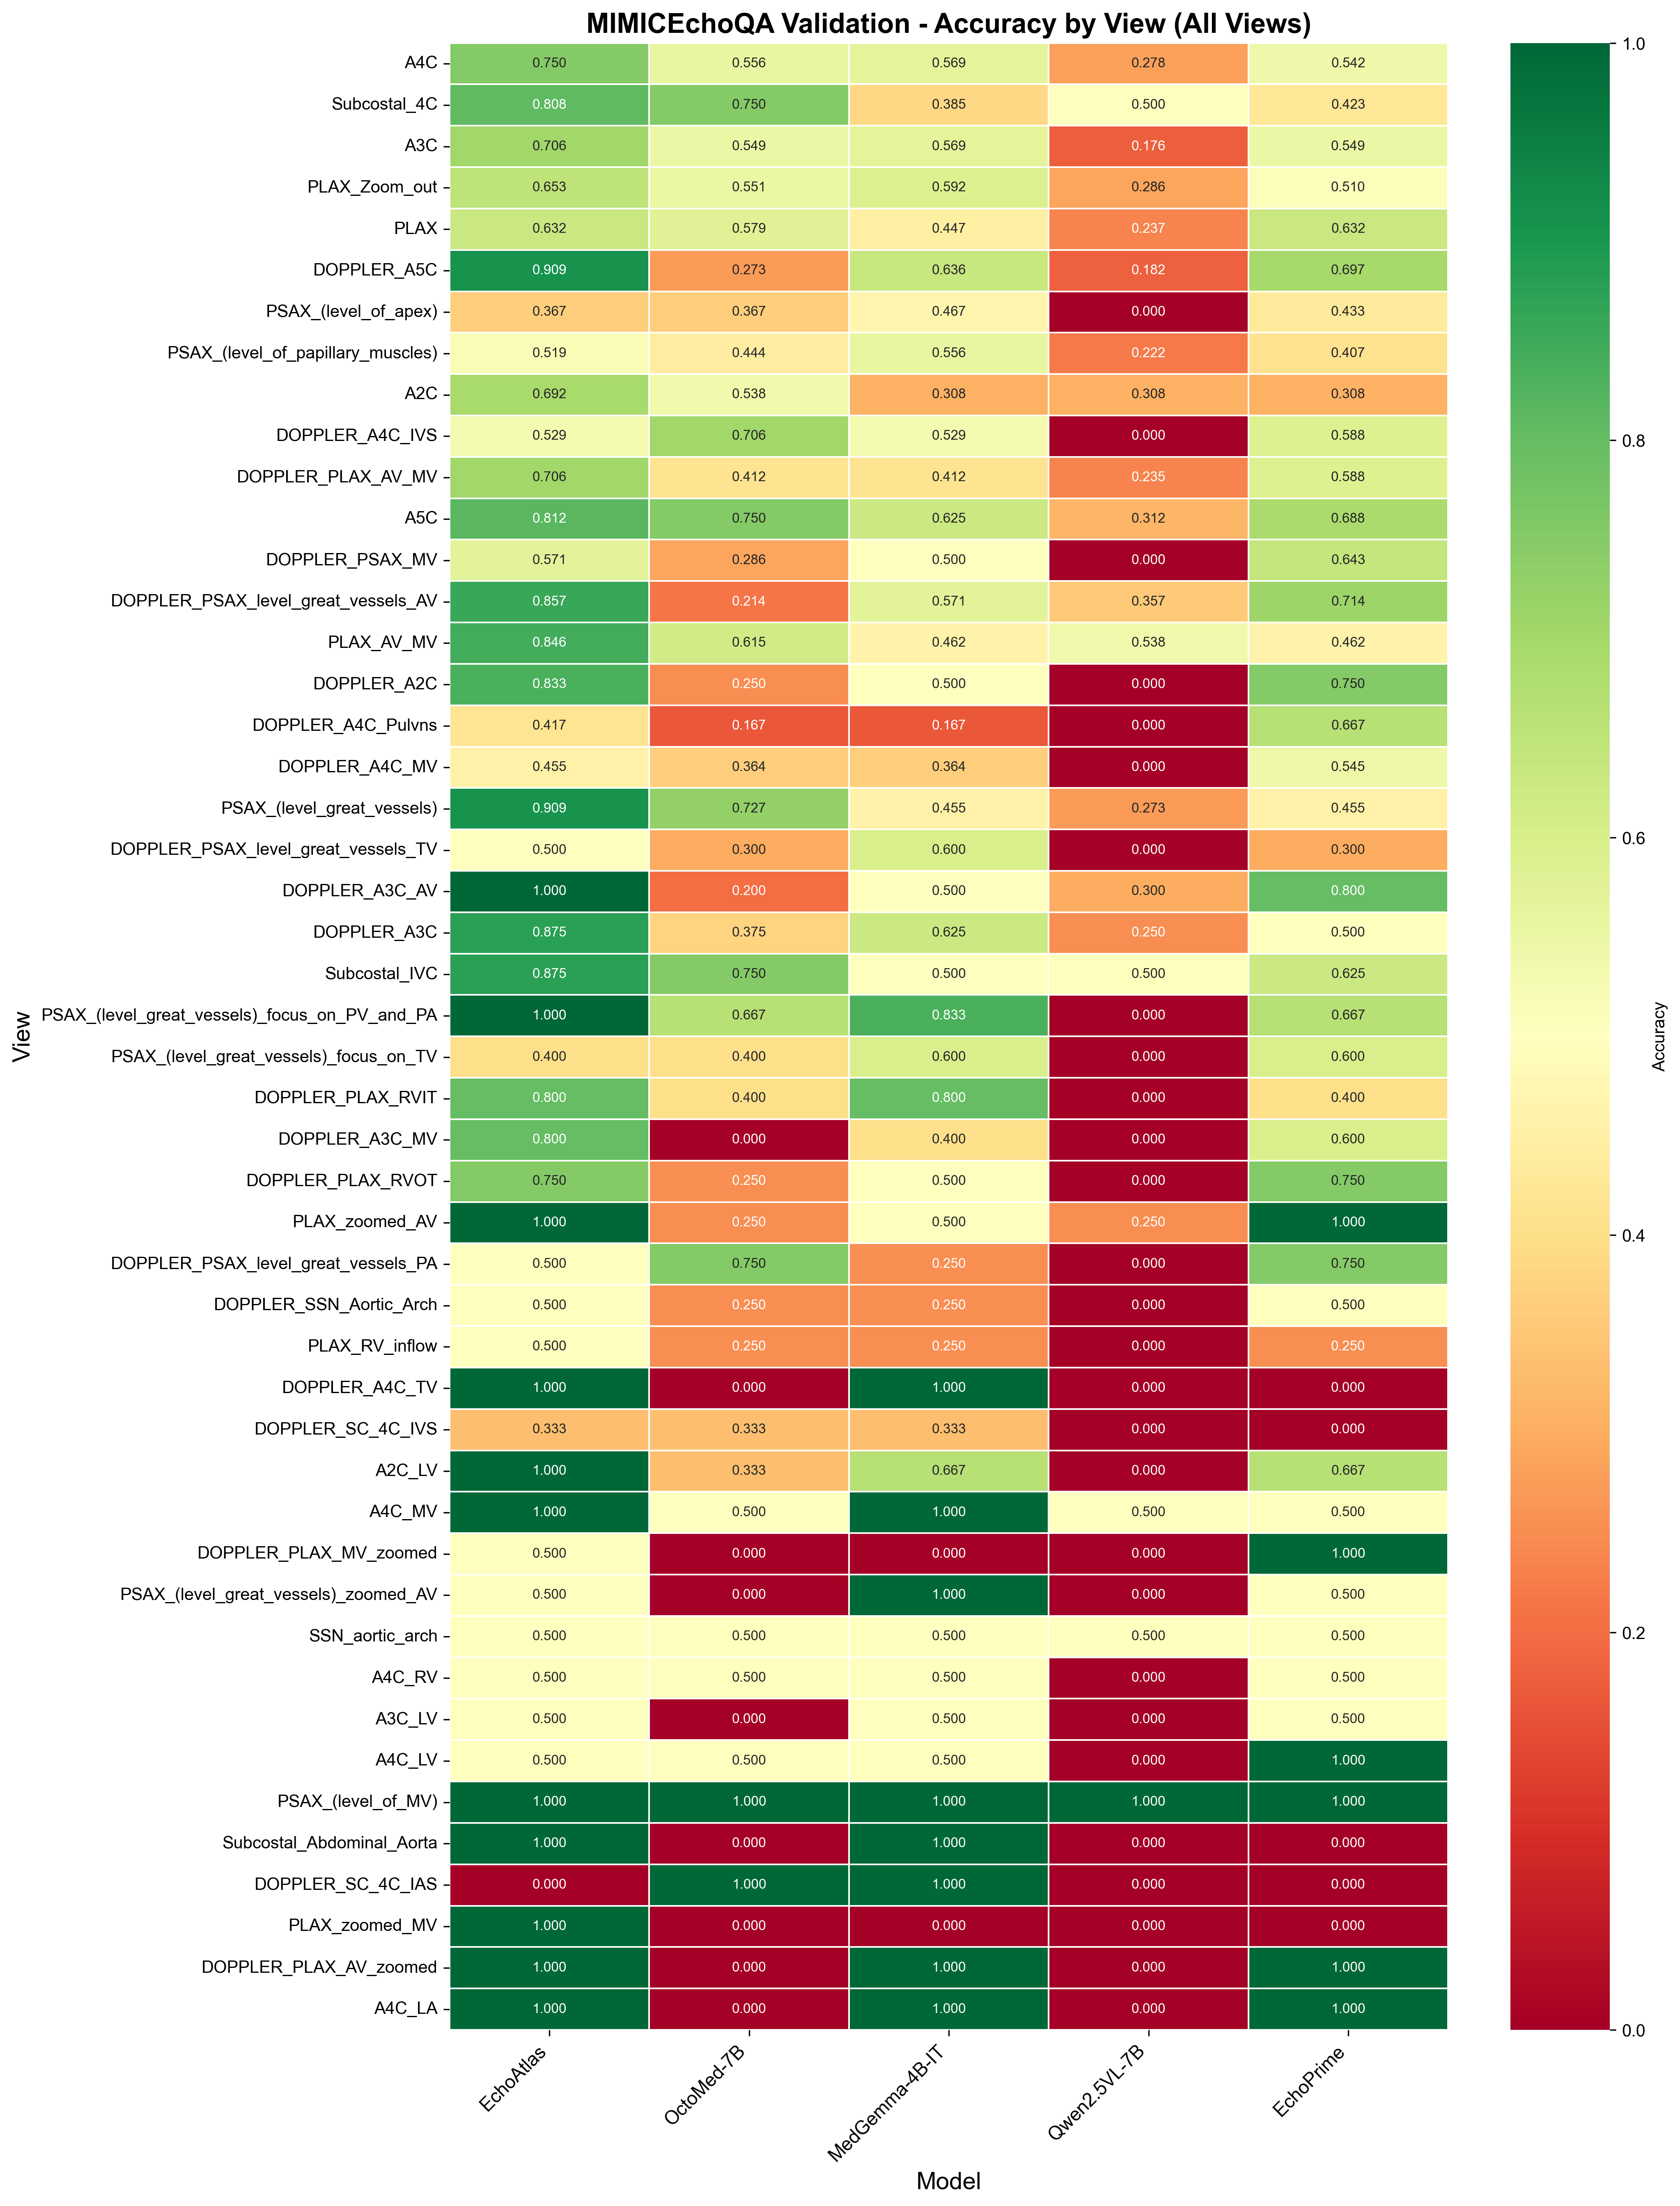
This supports transfer on a retrospective single-clip benchmark. It does not evaluate complete-study reporting or prospective clinical outcomes. Template and joint variants score 0.665 and 0.333, showing that adding tasks does not automatically improve transfer. Performance also varies across structures and severity categories.
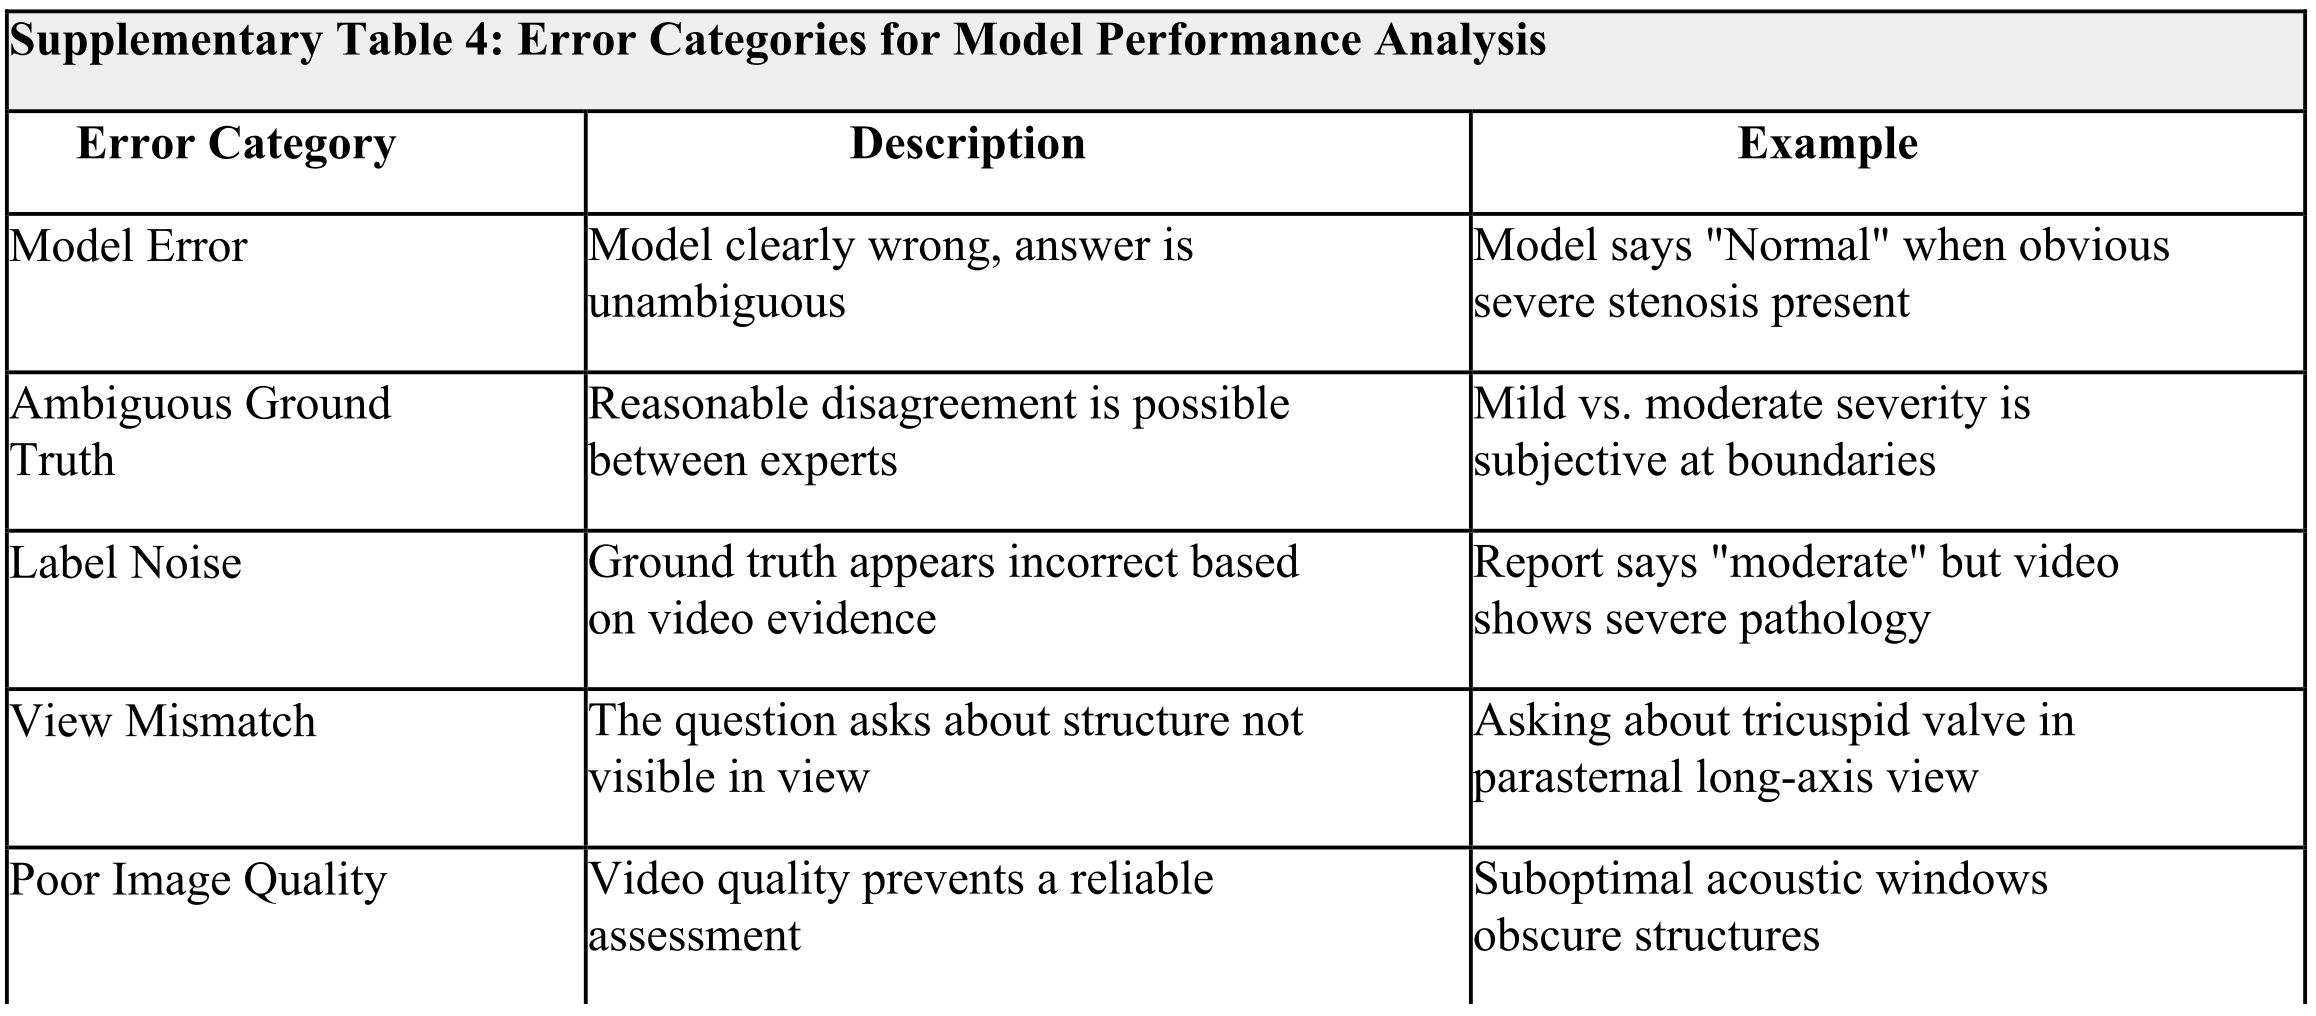
All 187 errors receive expert review. Averaged categories are 39.6% true model error, 39.3% ambiguous ground truth, 10.2% label noise, 5.6% view mismatch and 5.3% poor image quality. Reviewers agree on only 47.6% of categories, κ=0.25. These judgments identify benchmark ambiguity; they do not justify retrospectively increasing the reported accuracy.
Discussion
The principal result is broad task coverage from large-scale echocardiography-specific supervision, with a clear internal advantage over the tested general models and measurable external transfer. Multiple views support integration, while format-specific and numerical weaknesses show that conversational fluency is insufficient.
Training labels originate in clinical reports and language-model transformations. They can carry omissions, incompatible views, or contradictory values. Low numerical performance without the required imaging modality is consistent with missing evidence, not necessarily a failure of language modeling alone. A favorable pooled score can conceal poor individual measurements.
The study is retrospective, largely from one health system, with 93.6% White participants in its reported cohort. External evaluation is narrower than the internal multitask suite. No prospective workflow study, patient-outcome benefit, or community-hospital generalization is demonstrated. Strong appearance and coherence of reasoning should therefore be considered separately from correctness.
The authors propose integrating additional clinical context, improving quantitative supervision and expanding reasoning and reporting. The current comparisons do not fully separate architecture, training data, image/video access, task mixtures and input budgets. Claims of inherent autoregressive advantages over retrieval require broader matched comparisons.
Methods: study cohort
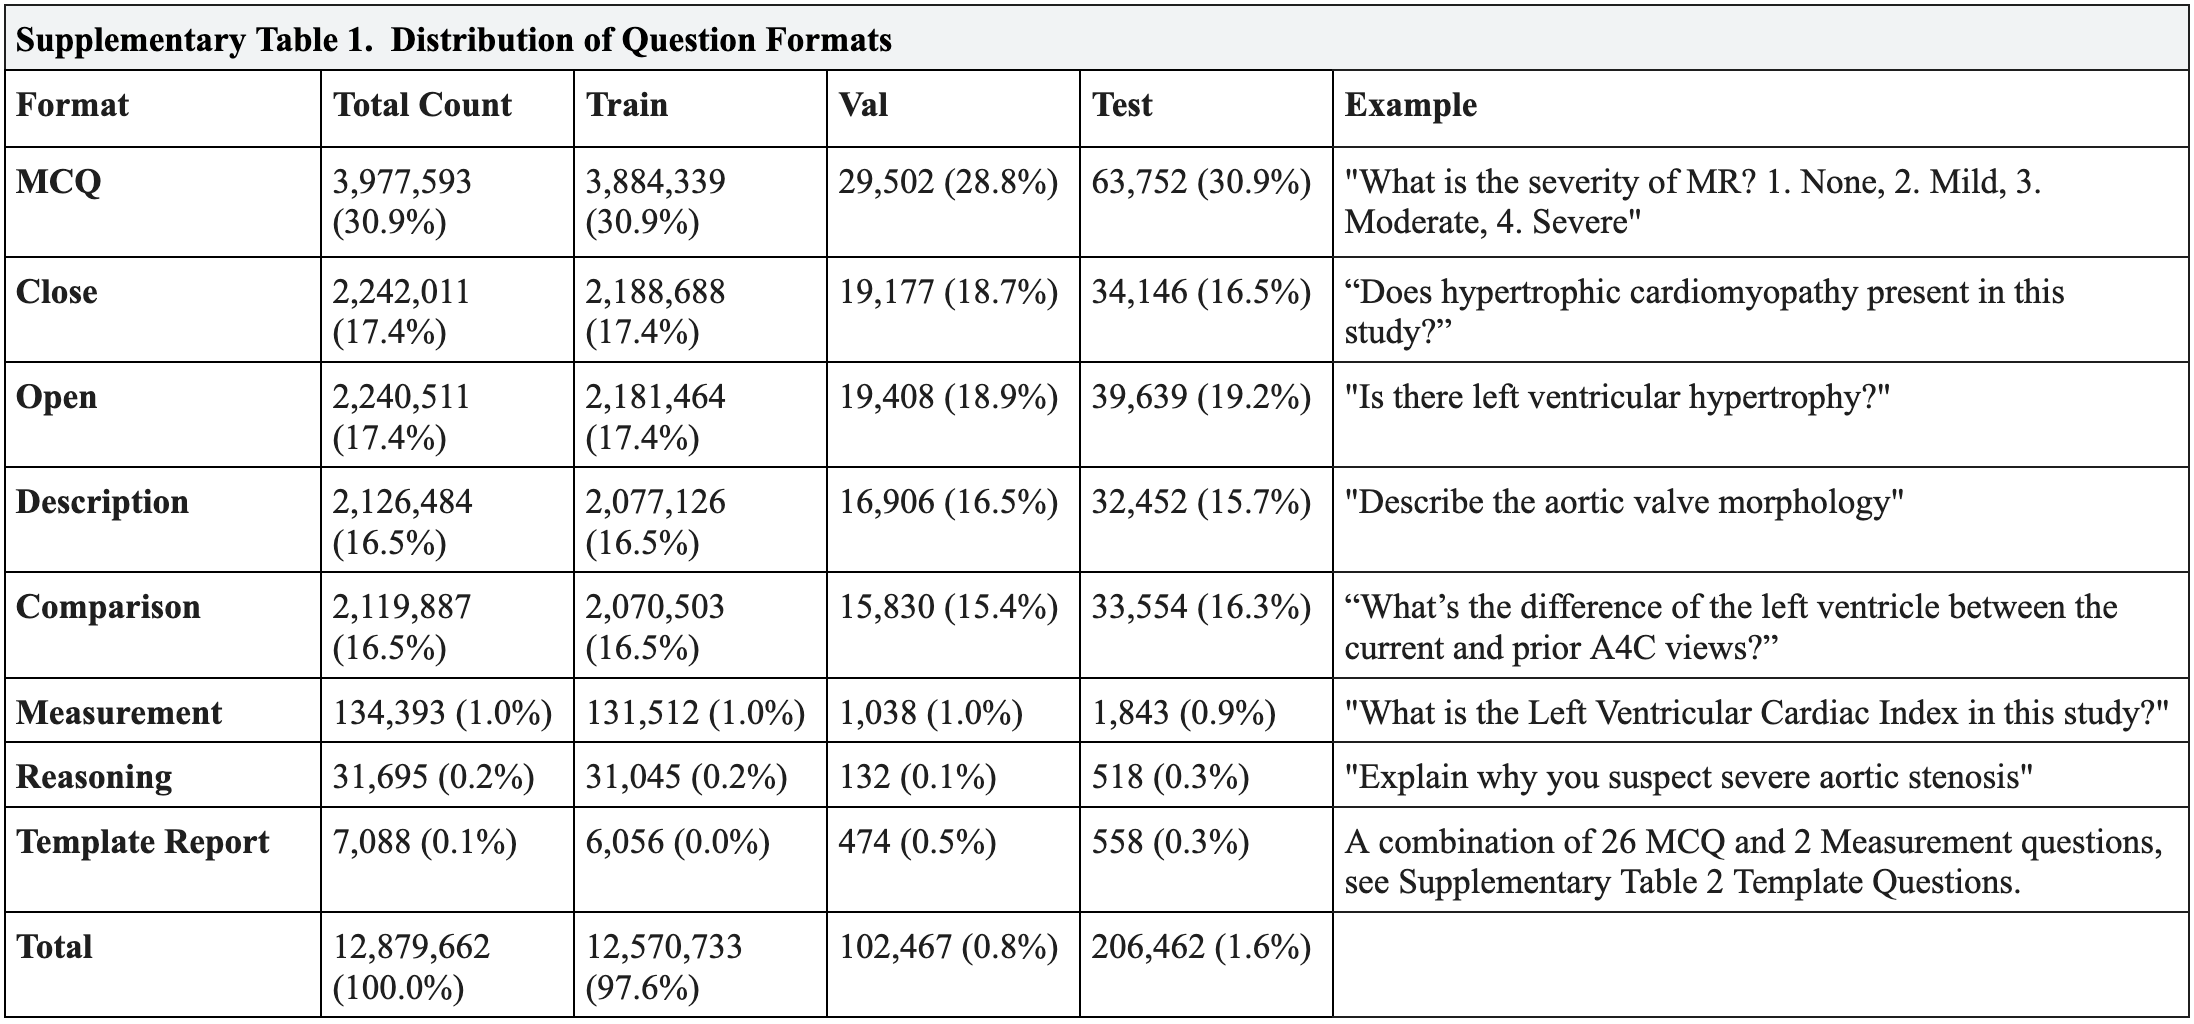
The Mayo Clinic cohort comprises adult echocardiography studies from 2023 with research authorization. Supplementary Table 1 lists 12,879,662 question–answer pairs: 12,570,733 training, 102,467 validation and 206,462 test. The paper’s rounded 12.9 million total and 12.6 million training descriptions refer to different quantities.
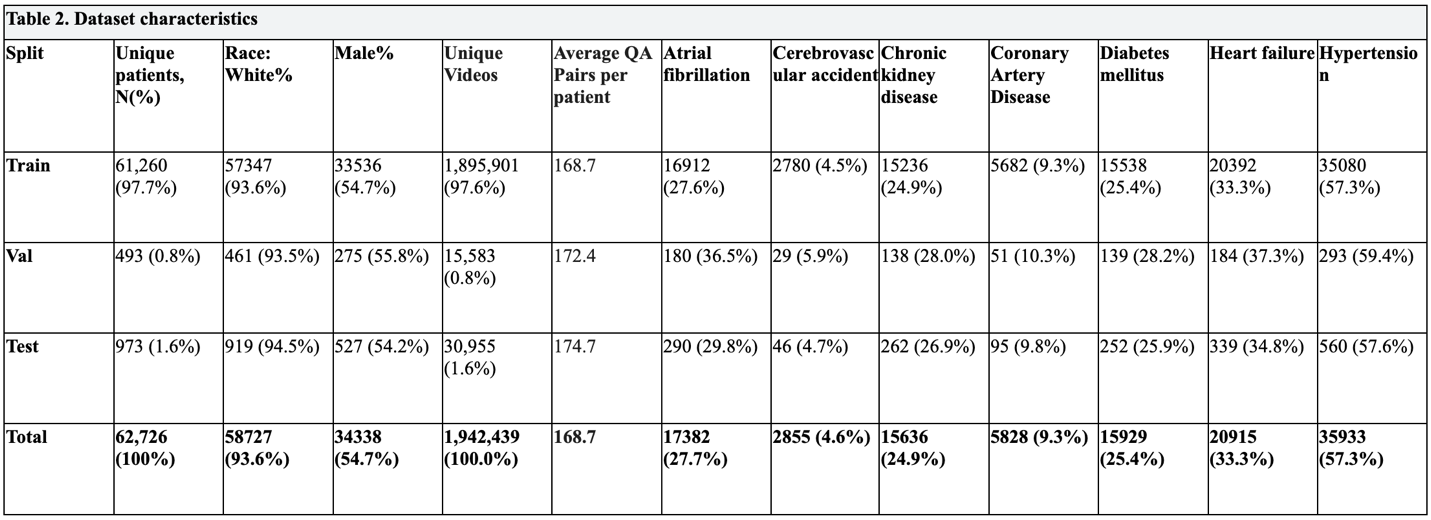
Table 2 reports 1,942,439 videos, approximately 31 per patient, and 54.7% male participants. Dataset quantities should be read from their individual tables: the reported per-patient question average does not directly reconcile with the Supplementary Table 1 total.
Methods: preprocessing and view classification
DICOM studies are divided into single/multiframe and Doppler categories. The model uses multiframe two-dimensional grayscale and color-Doppler clips, excluding spectral Doppler. Videos are cropped by 10%, resized to 224×224, and stored as MJPEG at 30 frames per second; non-imaging regions and the electrocardiogram trace are masked.
A DINOv2 ViT-B/14 view classifier maps 768-dimensional features through a 512-unit layer to 16 views [26]. Eleven uniformly sampled frames vote on each clip, with confidence at least 0.7. Uncertain labels and conflicting metadata are excluded. The authors report view-classification AUC near 0.99 and removal of 388,640 clips (19.1%); the filtering denominator is not fully reconciled with Table 2.
Methods: report-derived question generation
Cardiologists map report statements to appropriate views, excluding, for example, aortic-valve findings from an apical four-chamber view. GPT-4o then converts the mapped text into question–answer pairs. Crucially, it sees the reports, not the images, despite being prompted to assume it can observe them. Thus generated labels are report-derived rather than independently image-verified.
The licensed Mayo endpoint uses the reported API version 2024-10-21, maximum 6,000 tokens, temperature 0.1 and top-p 1.0. A low temperature does not by itself guarantee deterministic output. Eight formats cover general questions, measurements, comparisons, reasoning and templates.
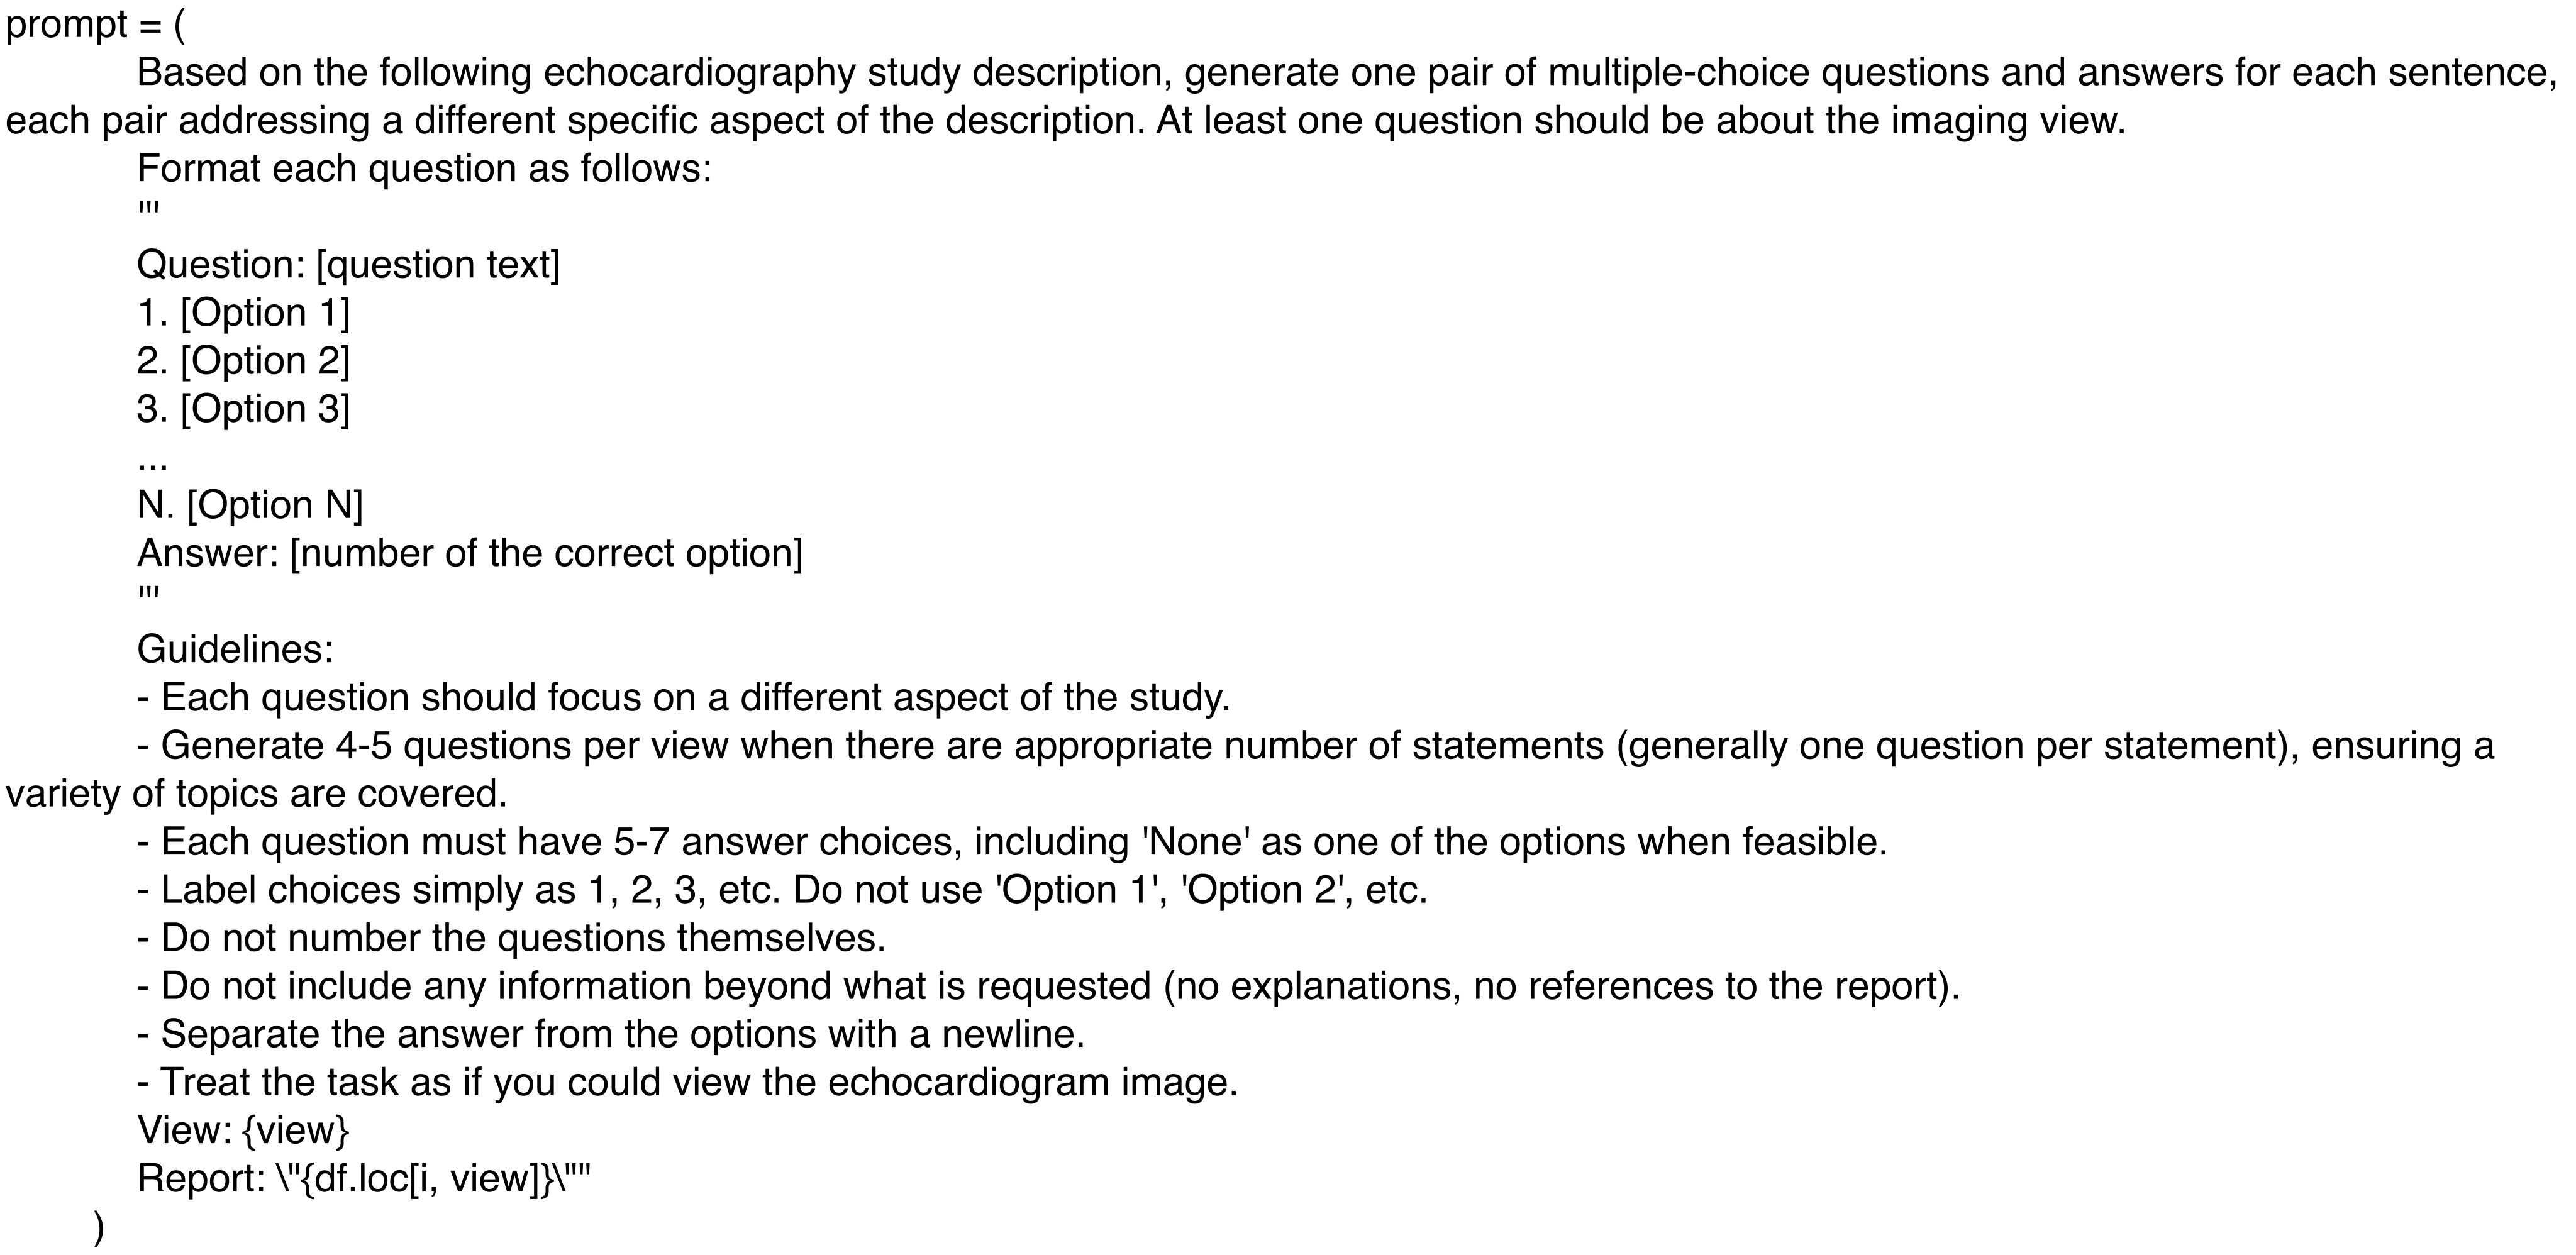
The exact multiple-choice generation prompt is retained as the image labeled Supplementary Figure 8. Methods calls it Figure 9; the caption list assigns Figure 8 to the separate EchoPrime extraction prompt. This edition preserves both original prompt images and identifies the numbering conflict.
Methods: multiview question tiers
General question types have three tiers: single-view structure, multi-view color Doppler, and multi-view structure with diagnostic integration. Mean clip counts are 2.3, 2.7 and 5.7 respectively. The tiers organize supervision and input complexity; they are not independent randomized tests of the benefit of adding views.
Methods: patient-level split
Splits are at patient level: 61,260 training patients, 493 validation and 973 test, or approximately 97.7%, 0.8% and 1.6%. This separates patients across partitions while allowing many correlated videos and questions per patient within each partition. Table 2 retains the complete demographic and data counts.
Methods: measurement, comparison, reasoning and template tasks
Measurement supervision includes 38 numerical parameters and 16 categorical wall-motion segments. Longitudinal questions compare the same type of finding between studies from patients with at least two studies during the year. Reasoning answers follow six prescribed subsections.
Template questions group clinical fields by the most relevant views. Their answers are generated from the source report by the same language model. To fit memory limits, template inputs use one or two clips per view, compared with three to five for other multiview tasks. Both pages of the exact 28-question table are retained.
Methods: model selection
The authors select Qwen2.5-VL-7B using existing medical-image and video benchmark performance relative to Qwen2-VL and InternVL 3.5 [27] [28] [29]. LoRA reduces adaptation cost [30]; training uses LLaMA-Factory. This selection rationale is not a controlled architecture ablation on the full EchoAtlas dataset.
Methods: staged training and settings
EchoAtlas trains on all question types except template reporting. EchoAtlas-Temp adds one template epoch to that checkpoint. EchoAtlas-Joint trains on the combined mixture from initialization, using a subset described as the 13 best-performing numerical tasks. Differences therefore include task mixture, numerical-task selection and training exposure.
Settings are LoRA rank 16, batch two per device, eight gradient-accumulation steps, learning rate 10⁻⁴, cosine decay and warm-up ratio 0.1. The paper reports one epoch for the base model, two for Temp, and approximately 190 hours on four 80 GB A100 GPUs, or 760 GPU-hours.
Methods: comparison models
Baselines are base Qwen2.5-VL-7B, OctoMed-7B and MedGemma-IT-4B [13] [14]. MedGemma receives a single frame per clip because its tested interface supports images rather than videos. Input modality and domain specialization consequently differ across models; this is not a parameter-matched architecture-only comparison.
Methods: expert reasoning review
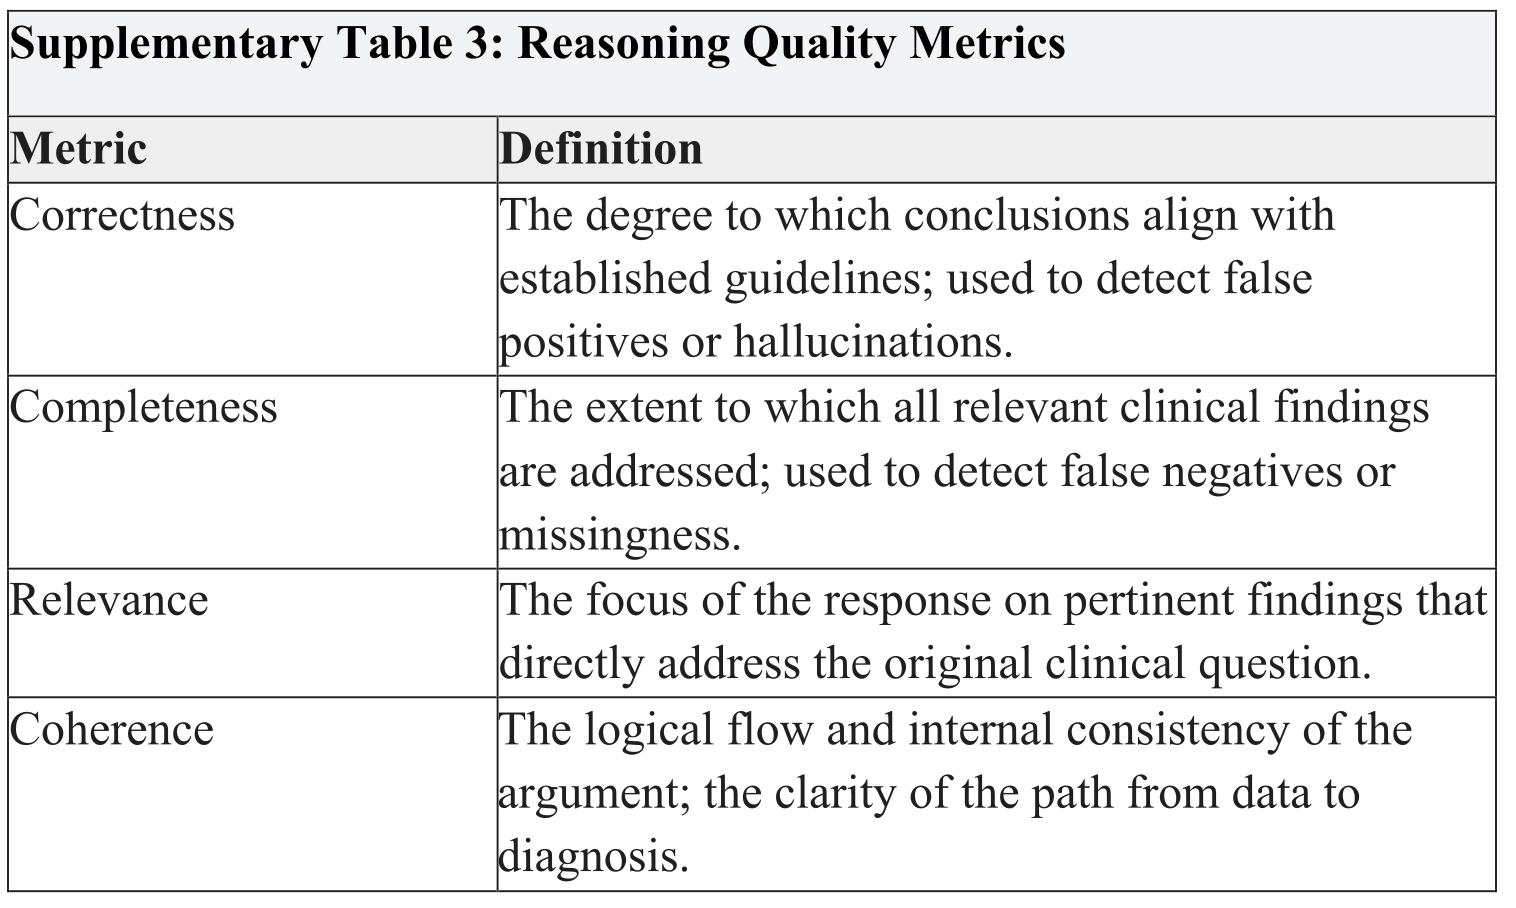
Two independent cardiology experts rate 50 disease-stratified random cases on five-point correctness, completeness, relevance and coherence scales, following earlier evaluation work [23] [31] [32]. Table S3 retains their definitions. Correctness targets false statements; completeness targets missing findings. These dimensions should not be collapsed into a single claim of reliable diagnosis.
Methods: external benchmark
The external benchmark derives from Beth Israel Deaconess studies collected in 2012–2019. It contains 622 single-video, four-option questions generated from reports, filtered for view appropriateness and checked by cardiologists [17] [19]. Site, acquisition period and question format change together, so the experiment does not isolate temporal robustness.
Methods: EchoPrime adaptation
EchoPrime normally combines a full study’s clips for retrieval-based reporting. Here it is adapted to a single clip; predicted metrics and retrieved text are sent to the reported GPT-5 endpoint to extract the multiple-choice answer. The paper acknowledges that this is an out-of-distribution use of EchoPrime.
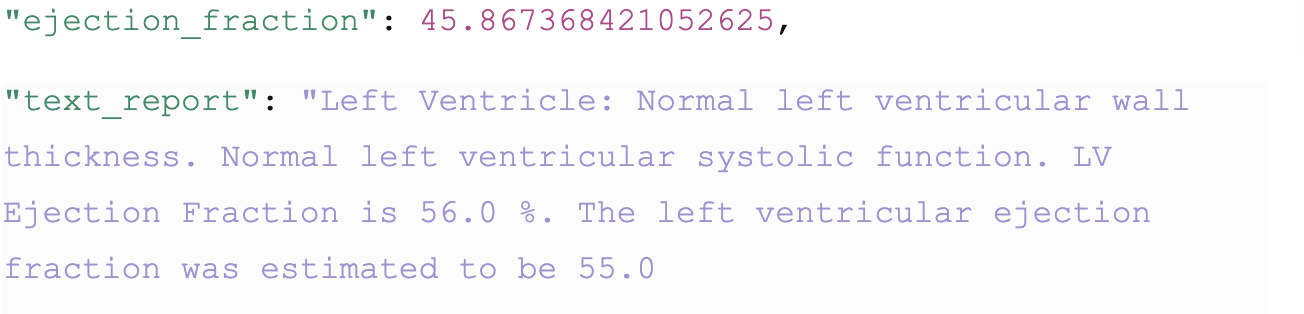
Supplementary Figure 7 shows conflicting outputs: predicted ejection fraction about 45.87%, while retrieved text describes 55–56% and normal function. Prioritizing the text yields roughly 0.44 accuracy; prioritizing predicted metrics yields roughly 0.48, the configuration used in the main comparison. This example exposes a conflict in the adapted pipeline, not a general impossibility of retrieval-based reasoning.
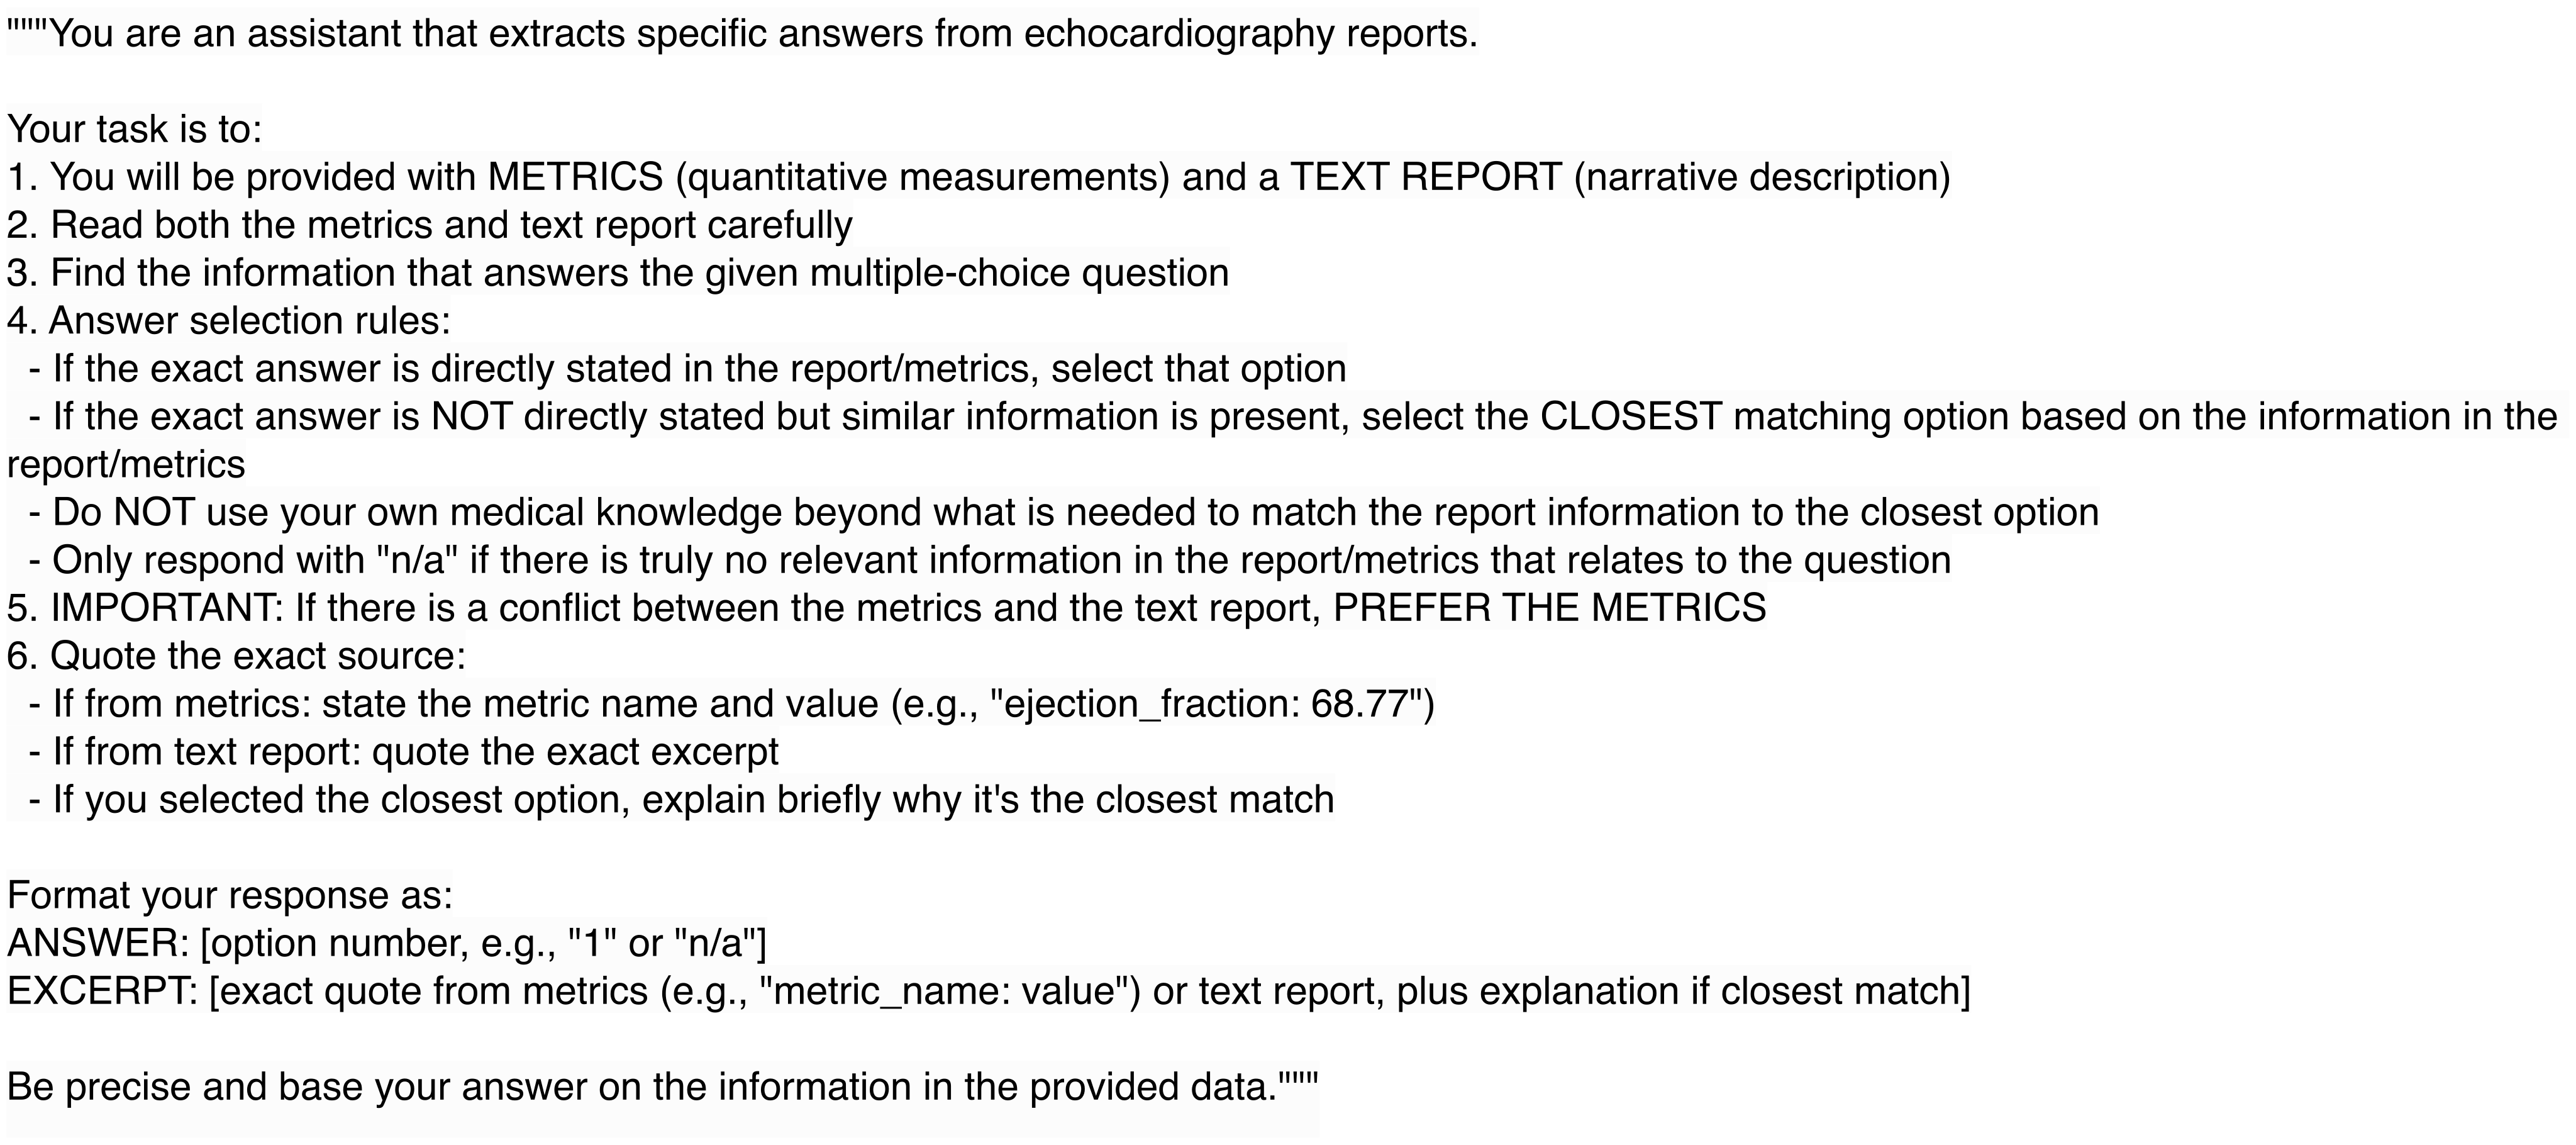
The exact extraction prompt is retained as Figure S9, its printed label. The accompanying caption calls it Figure 8. It instructs the model to use only supplied evidence and deductions, with direct metric predictions taking priority.
Methods: external error review
Two cardiologists independently classify every incorrect external answer using five categories: model error, ambiguous ground truth, label noise, view mismatch and poor image quality. Table S4 retains the definitions and examples. Their averaged category distribution and fair agreement describe the audit; they do not replace the original benchmark labels.
Methods: statistical analysis
Accuracy evaluates categorical answers, RadGraph F1 evaluates clinical entities and relationships in free text, and R²/mean absolute error evaluate numerical estimates [34]. Wall-motion reporting additionally includes sensitivity, specificity and predictive values for three-class and binary tasks. These measurements answer different questions.
The paper uses 1,000 bootstrap replicates for intervals and 1,000 paired permutations for model comparisons, with a 0.05 threshold. It does not state patient-cluster resampling or multiple-comparison adjustment. Repeated questions from the same patient may therefore affect uncertainty estimates.
Echo-CoPilot’s external result is literature-derived, and Figure 4 does not show its confidence interval. The manuscript’s paired-test description should not be assumed to establish paired significance against that prior result without access to the corresponding predictions.
Ethical review and approval
Mayo institutional review approved protocol 22-010944. Included patients had authorized minimal-risk retrospective research; additional consent was waived. The study states compliance with the Declaration of Helsinki.
Data availability
Mayo data remain restricted for privacy; access is described as requiring a reasonable request and institutional review approval. MIMIC-EchoQA is available through PhysioNet. The manuscript does not explicitly establish an unrestricted release of model weights, code or the private training cohort.
Acknowledgments
Chieh-Ju Chao reports NIH/NHLBI K08 HL175205-01A1 and Mayo Clinic awards. Mohammad Asadi reports Amazon AI and Stanford HAI fellowships. Other authors declare no relevant funding for this work.
Author contributions
Chao leads conceptualization, methods, software, validation, curation, analysis and writing; Asadi contributes methods, software and writing. Li contributes validation, curation, writing and visualization; Ramasamy, Pecco, Wang and Poterucha support data preparation. Arsanjani, Kane, Oh, Banerjee, Langlotz, Li, Adeli and Erickson contribute resources, methodology, review and/or supervision as listed in the source. All authors approved the manuscript.