At a glance
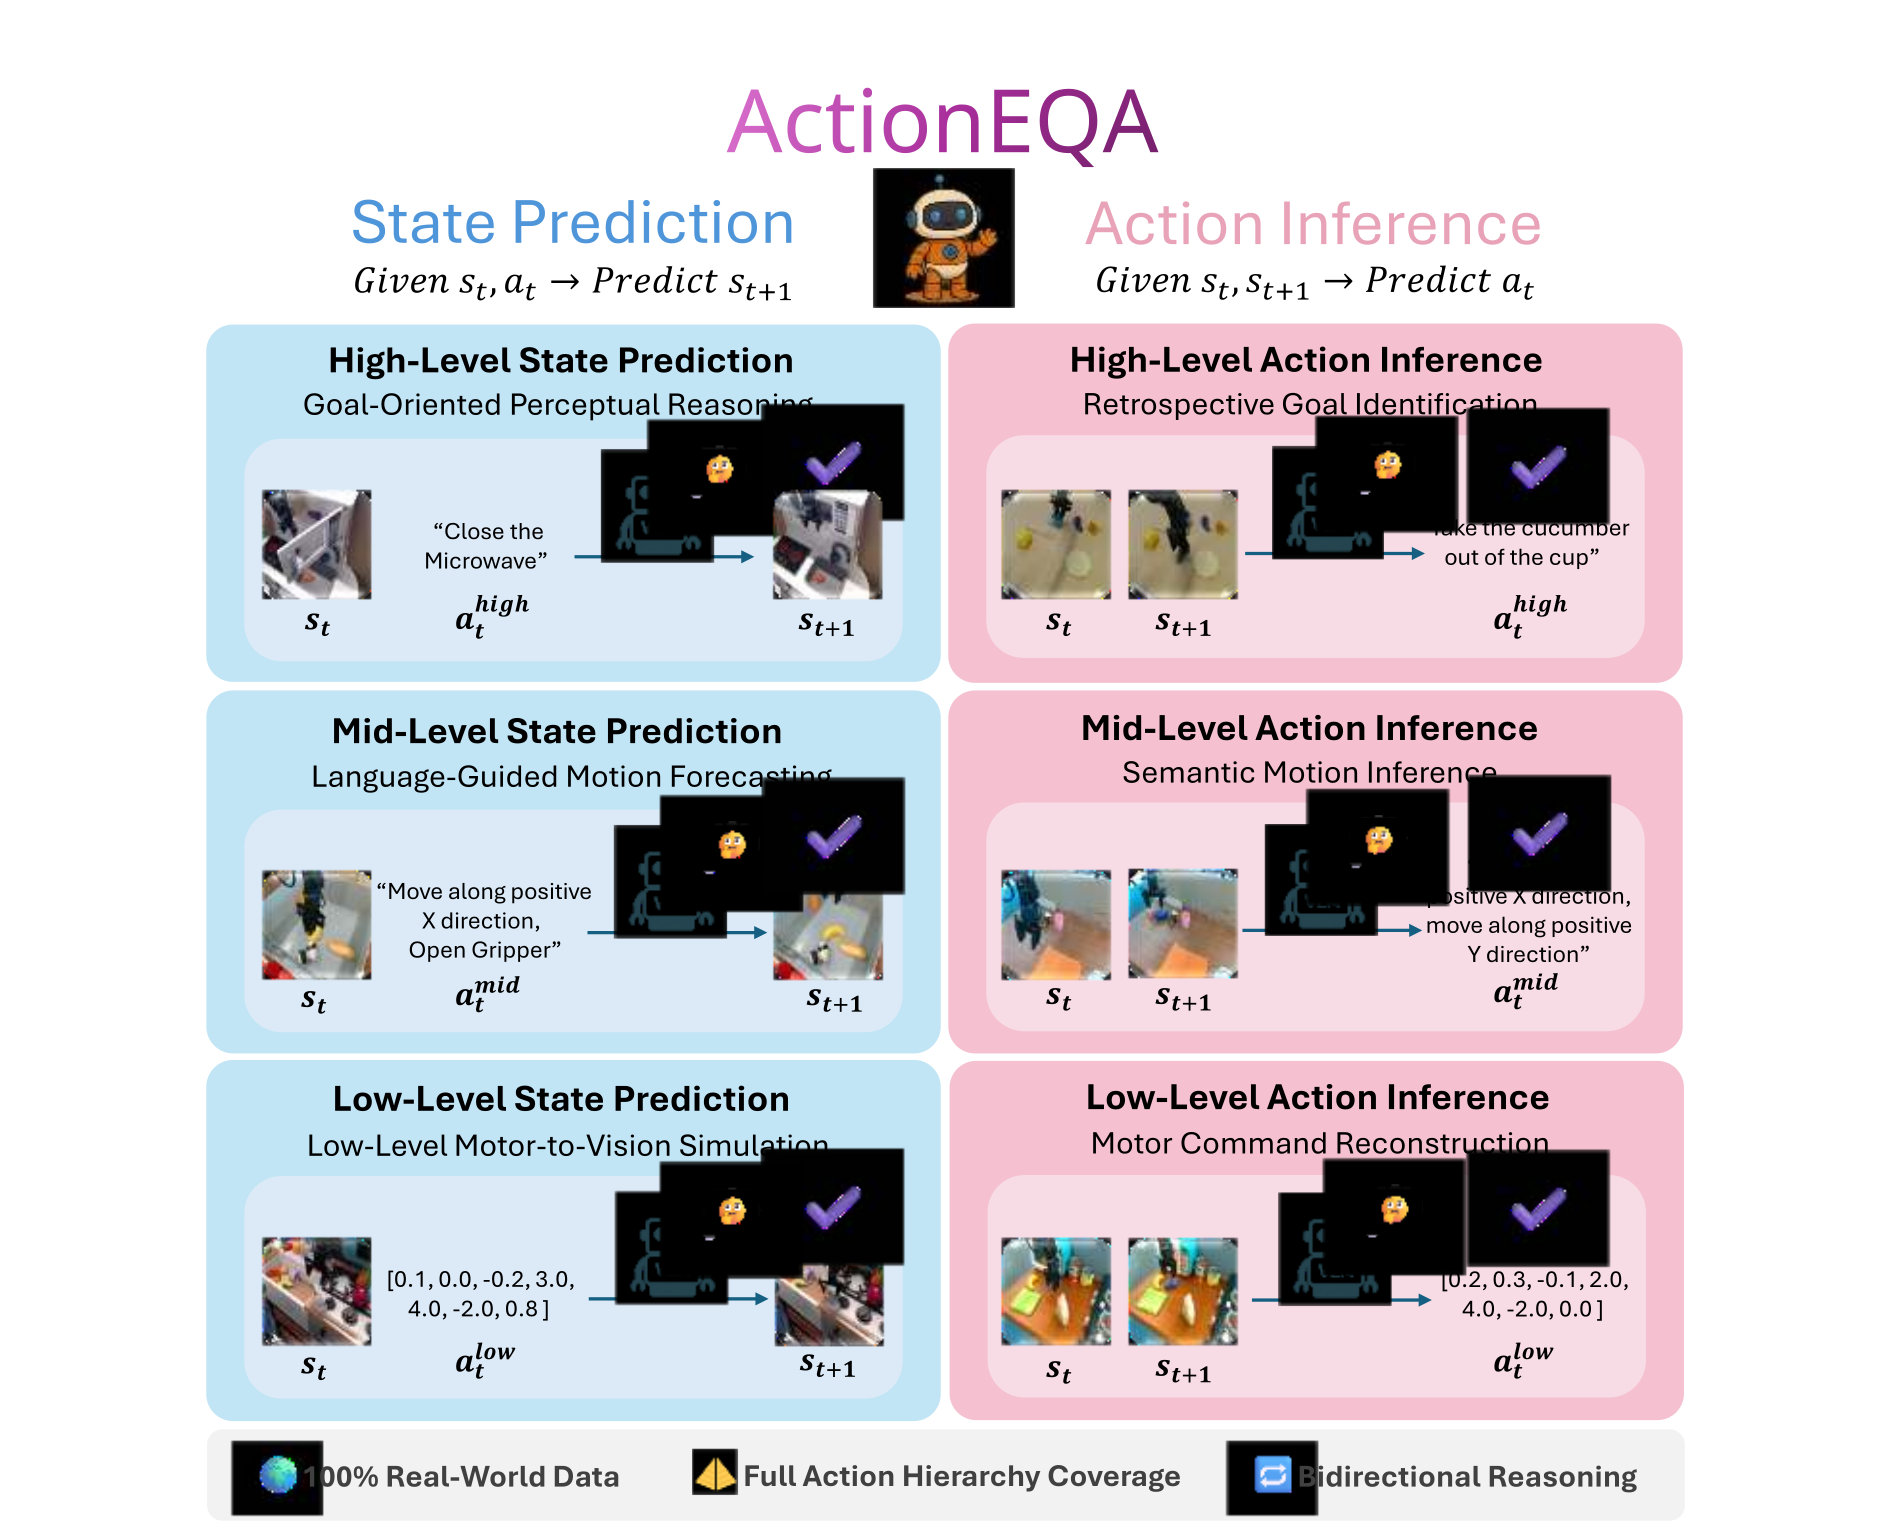
ActionEQA tests whether vision-language models connect robot actions with their visual consequences. It crosses three representations—task goals, verbal motion descriptions and numerical end-effector changes—with two directions: predicting a resulting image and identifying an action from before/after images. All tasks are four-choice questions, not closed-loop robot control.
The benchmark reports 8,795 questions from DROID, BridgeData V2 and RT-1. Among 34 tested models, Gemini-2.5-Pro scores 58.4% overall against a two-annotator human score of 95.6%. Mid-level motion language is especially difficult; extra camera views help some configurations and hurt others. This edition retains all 51 figures, 33 tables, original prompts, error examples and equations from the complete 92-page TMLR paper.
1. Introduction
A model can understand a goal such as closing a microwave without correctly interpreting the translation, rotation and gripper change needed to accomplish it. Task-success benchmarks do not isolate these levels of action understanding. ActionEQA uses questions derived from real demonstrations to diagnose the gap [20] [50] [77].
The results characterize the evaluated model versions and question design. They do not directly establish how accurately those models would generate continuous commands or recover from mistakes on a robot.
2.1 Bidirectional action understanding
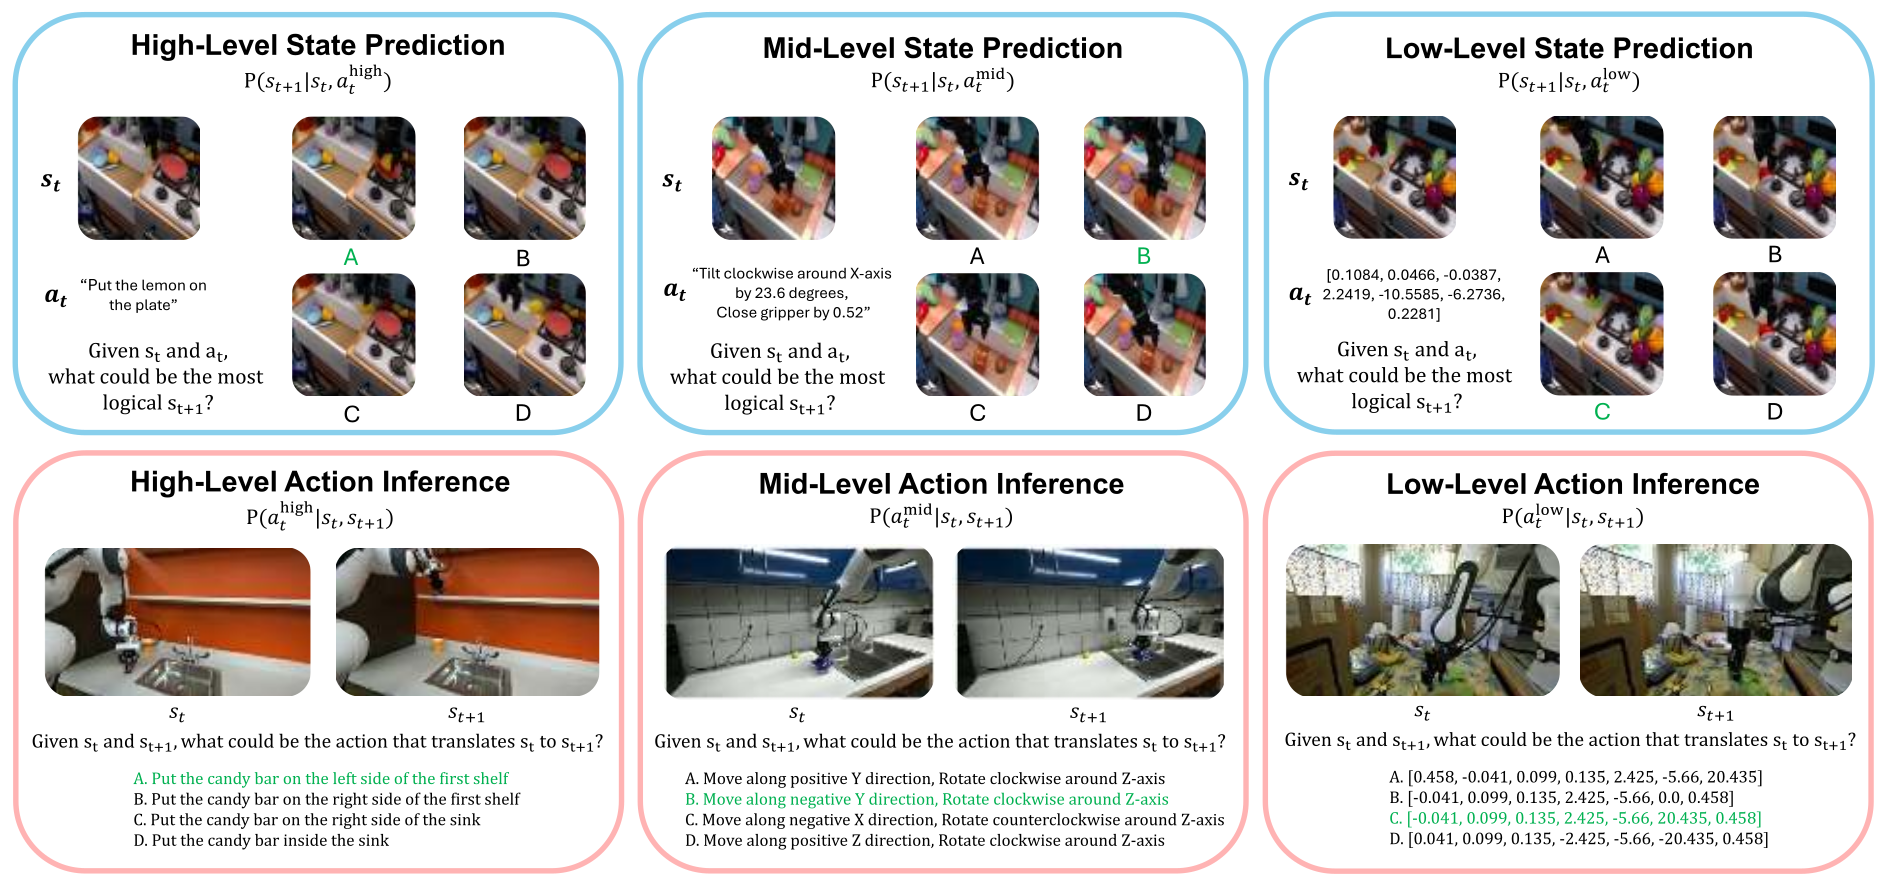
High-level actions state a semantic goal. Mid-level actions compose verbal descriptions of motion along or around the robot-base axes. Low-level actions use seven values: changes in x, y, z, roll, pitch, yaw and gripper aperture. The latter are derived state differences, with an acknowledged approximation for rotation.
State Prediction supplies an initial image and action, then asks for the correct resulting image among four candidates. Action Inference supplies initial/final images and asks which of four actions explains their difference. These directions have different input and answer modalities; the accuracy gap is not an isolated causal test of forward versus backward physical reasoning.
2.2 Benchmark curation
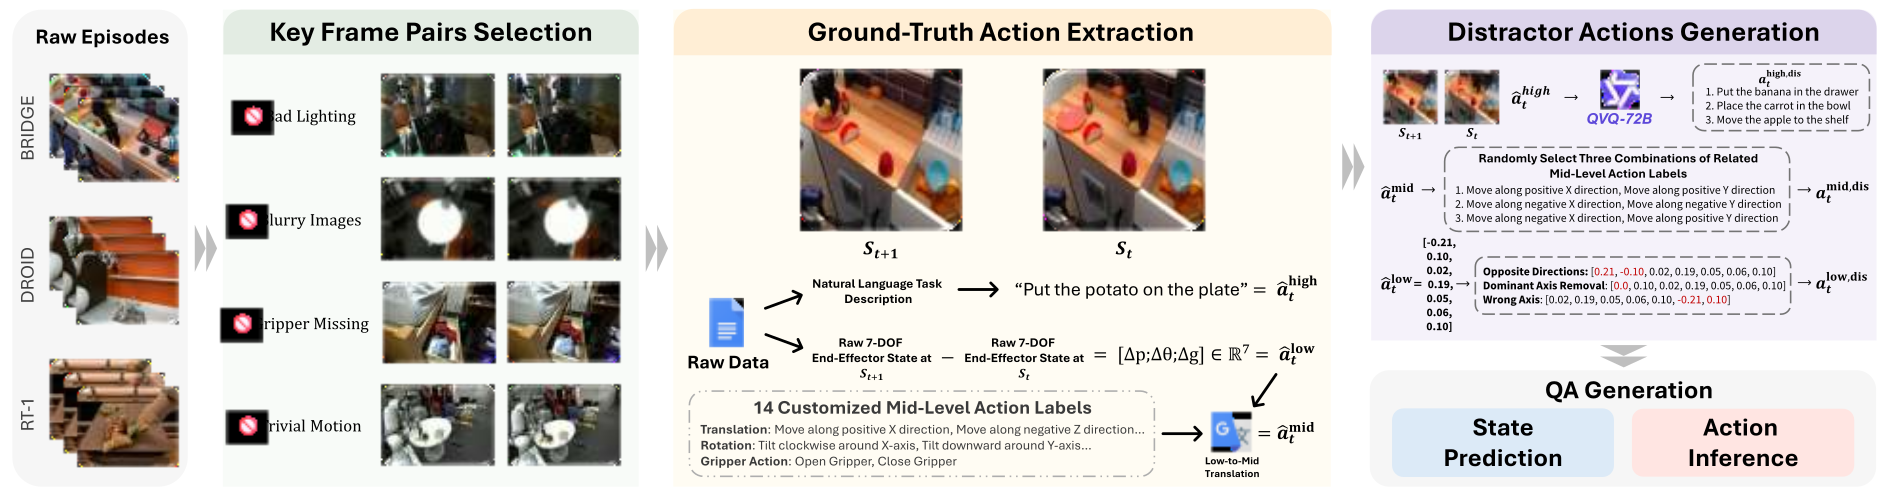
The pipeline extracts episodes, selects visually meaningful frame pairs, derives action labels, constructs distractors and reviews the resulting questions. High-level labels come from source instructions; low-level labels subtract end-effector states; fourteen signed motion/gripper labels express the mid-level.
QVQ-72B generates high-level distractors, followed by human review [57]. Mid-level distractors alter combinations of relevant components; low-level distractors invert, remove or permute numerical components. Different distractor constructions contribute to differences in difficulty across levels.
3.1 Experimental setup
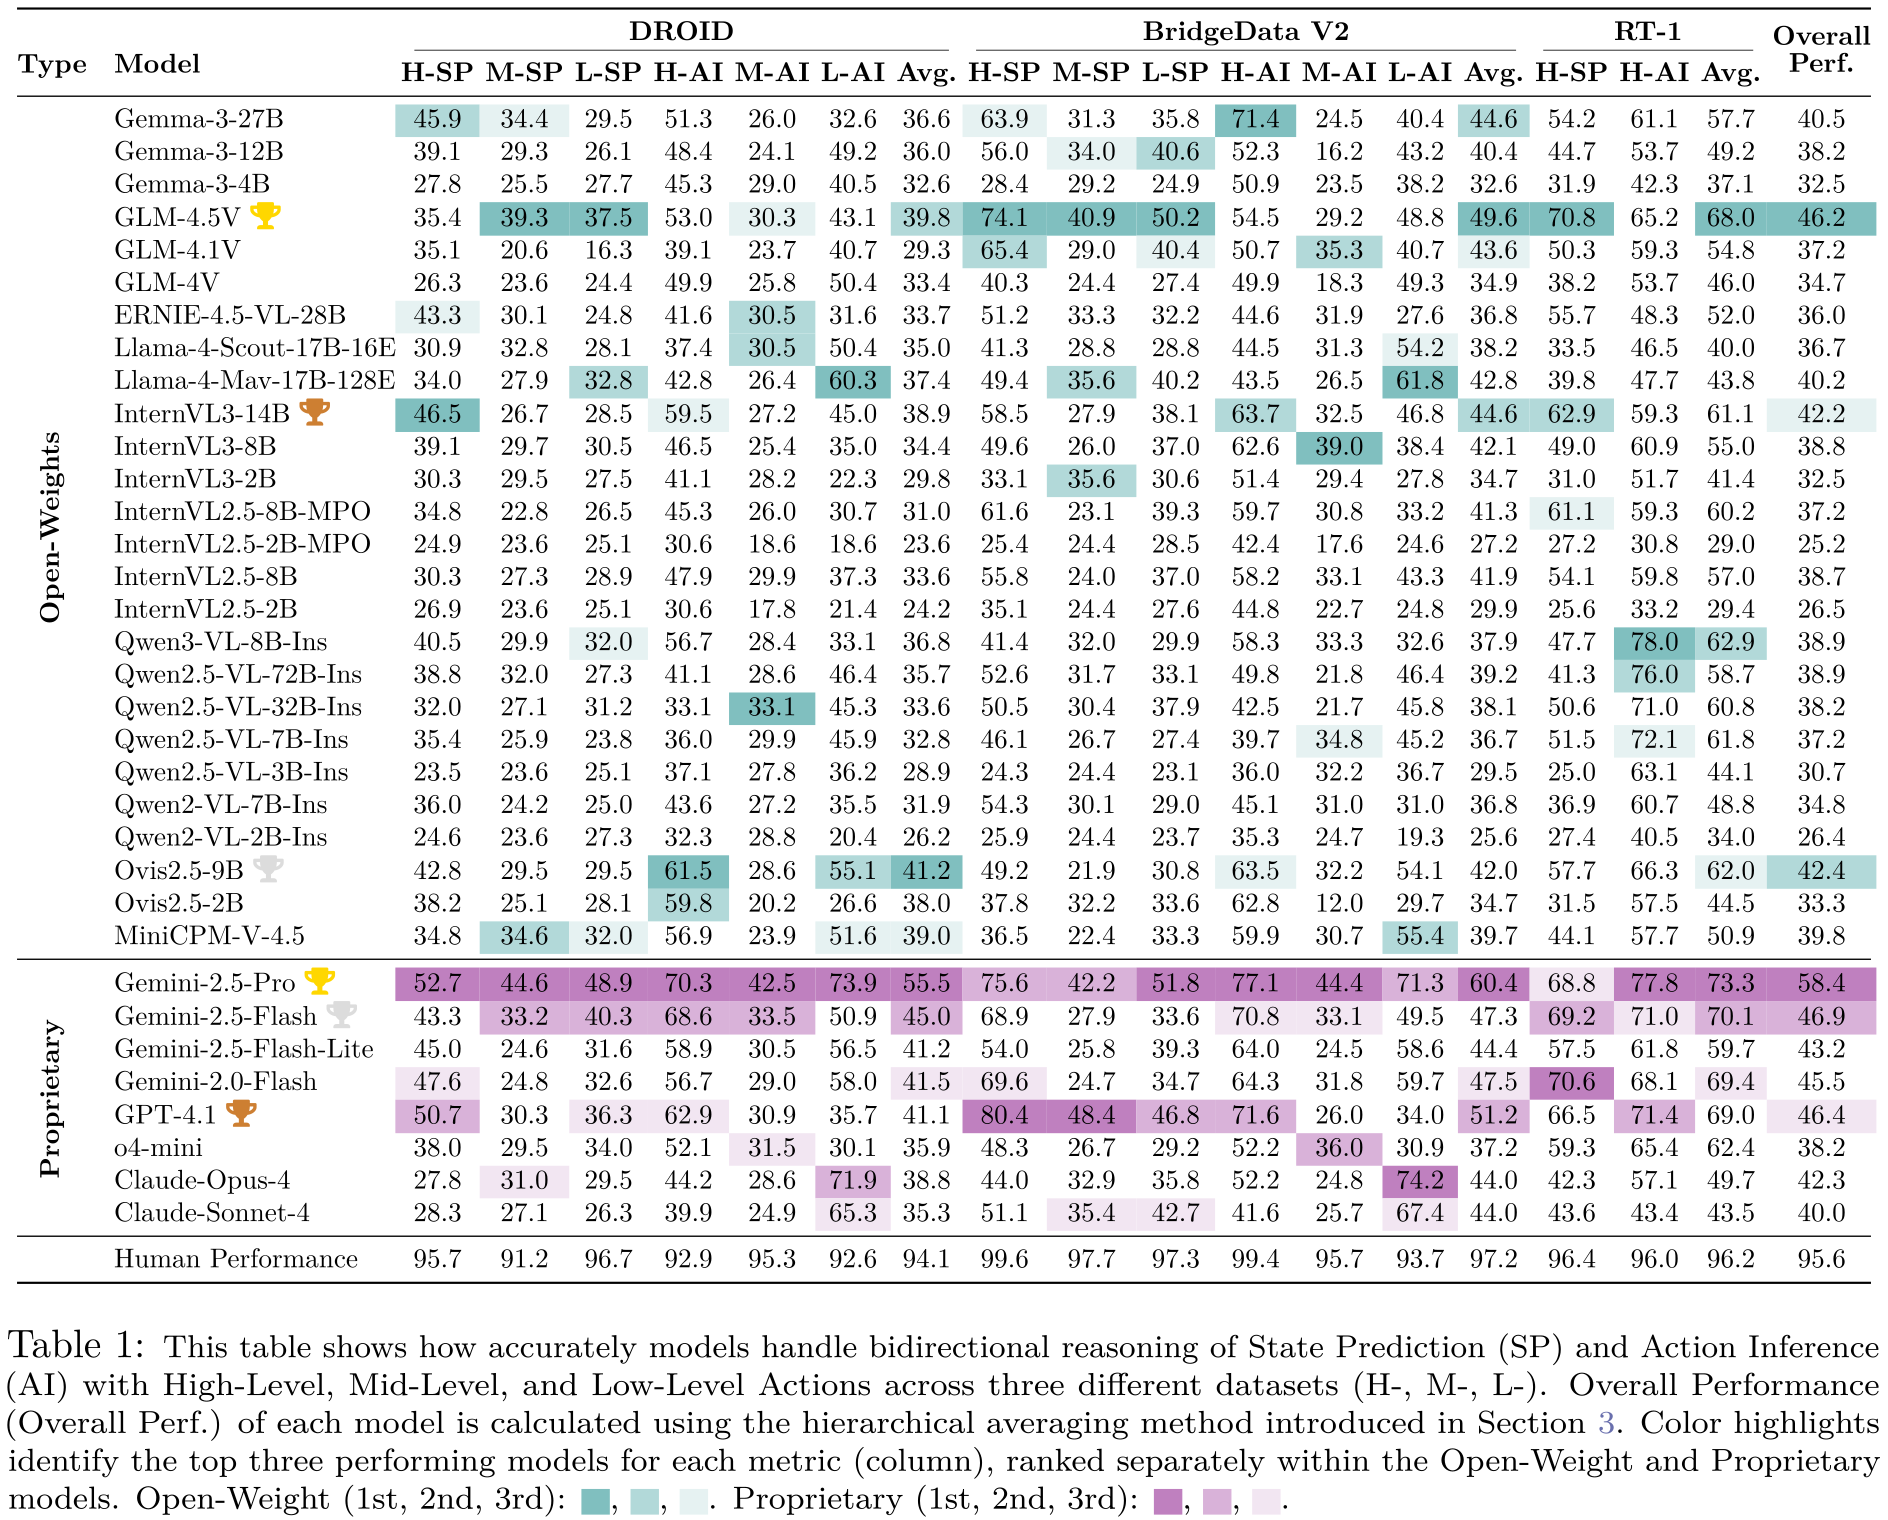
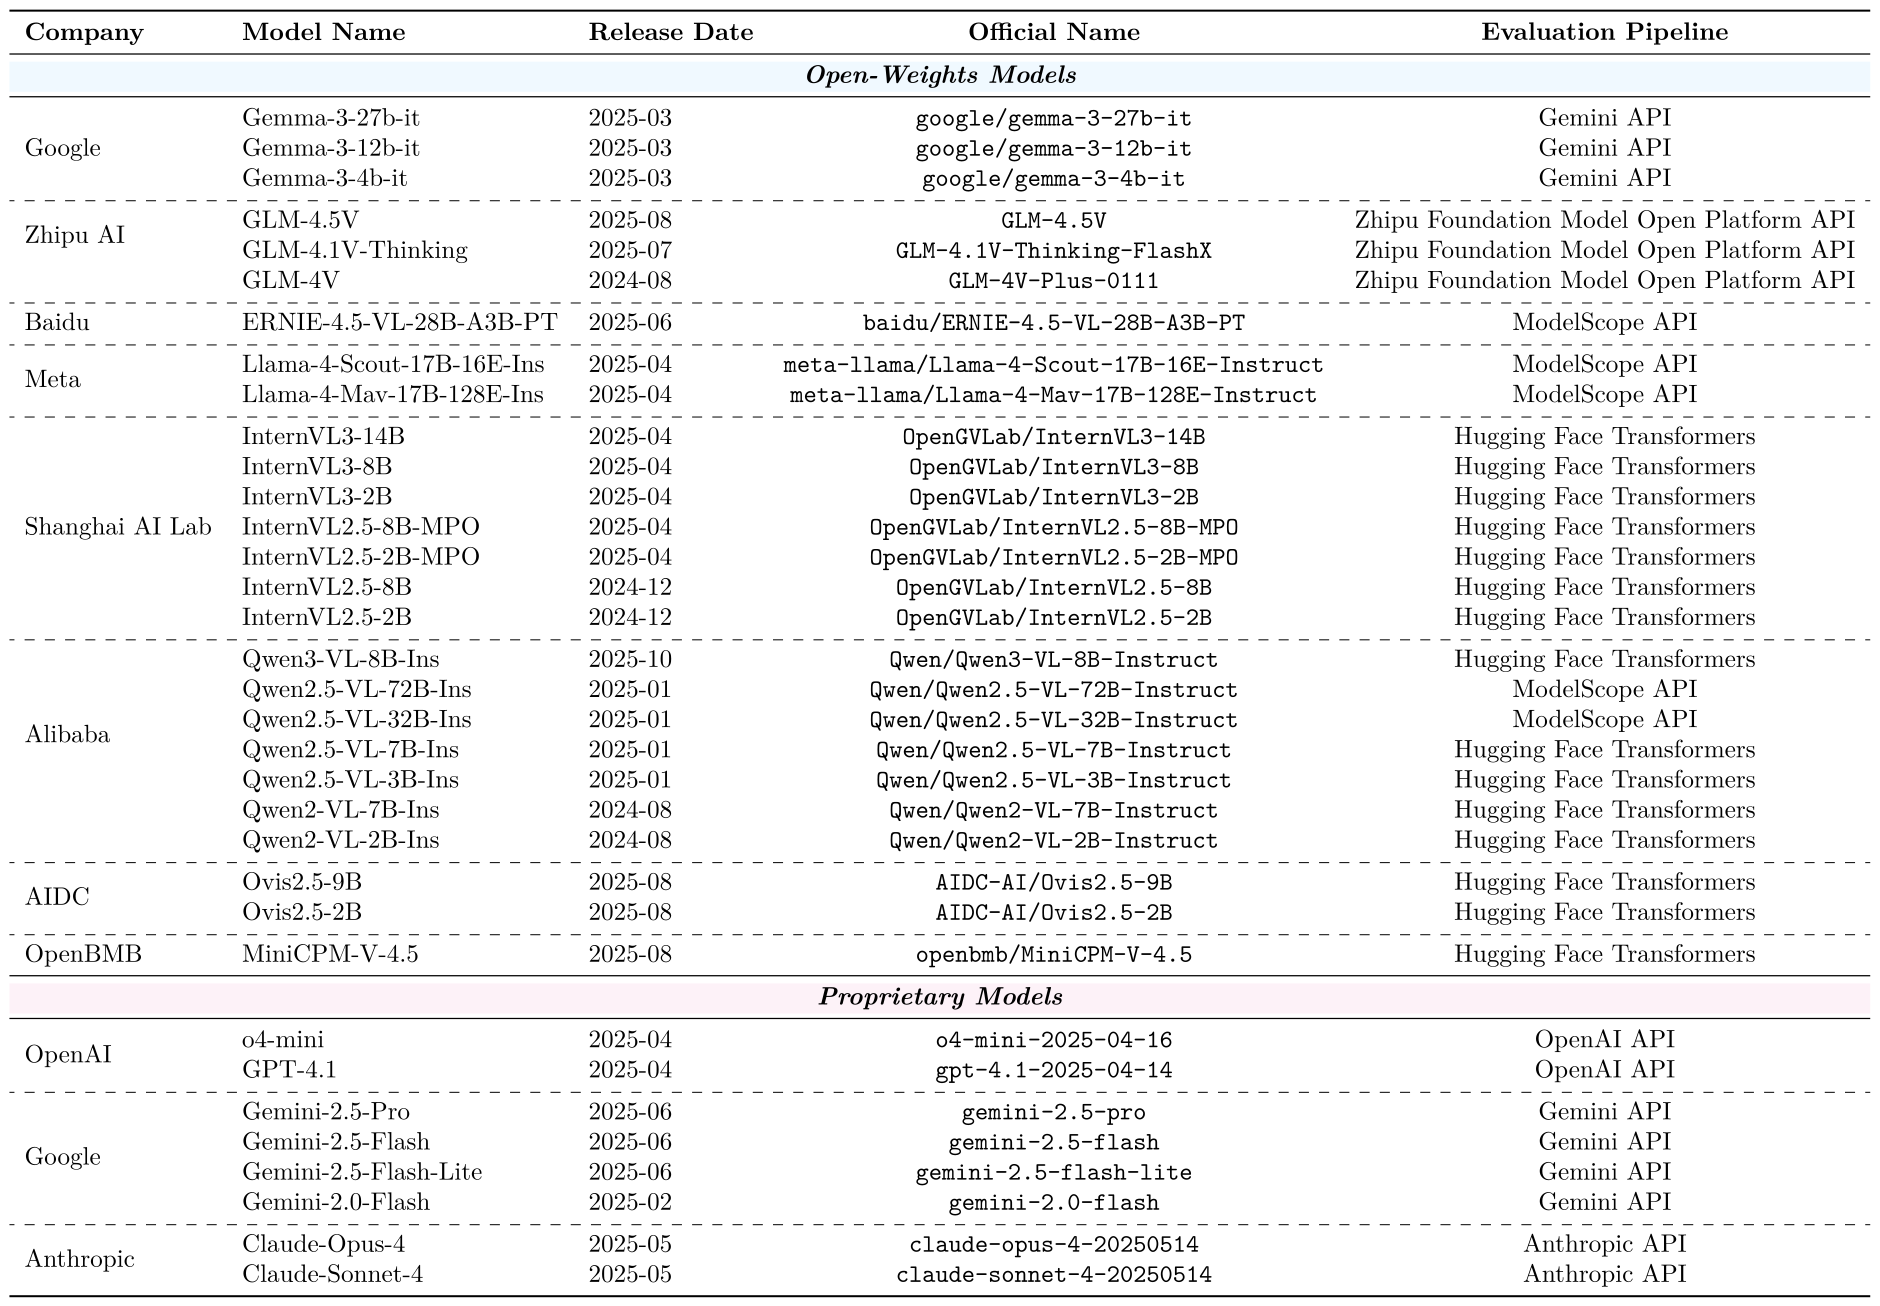
Evaluation covers 26 open-weight and eight proprietary models, using zero-shot direct-answer prompts, temperature zero and a 2,048-token output cap. Accuracy requires the expected answer character. Table 1 retains every model/task result and ranking color; Table 20 specifies model identifiers and inference providers.
The overall score averages datasets within each of six task categories, then averages categories equally. It is not pooled question accuracy. RT-1 contributes only to high-level categories, because mobile-base motion would confound its fine-grained arm-action labels. Temperature zero reduces sampling variation but does not by itself guarantee identical hosted-model execution.
3.2 The mid-level bottleneck
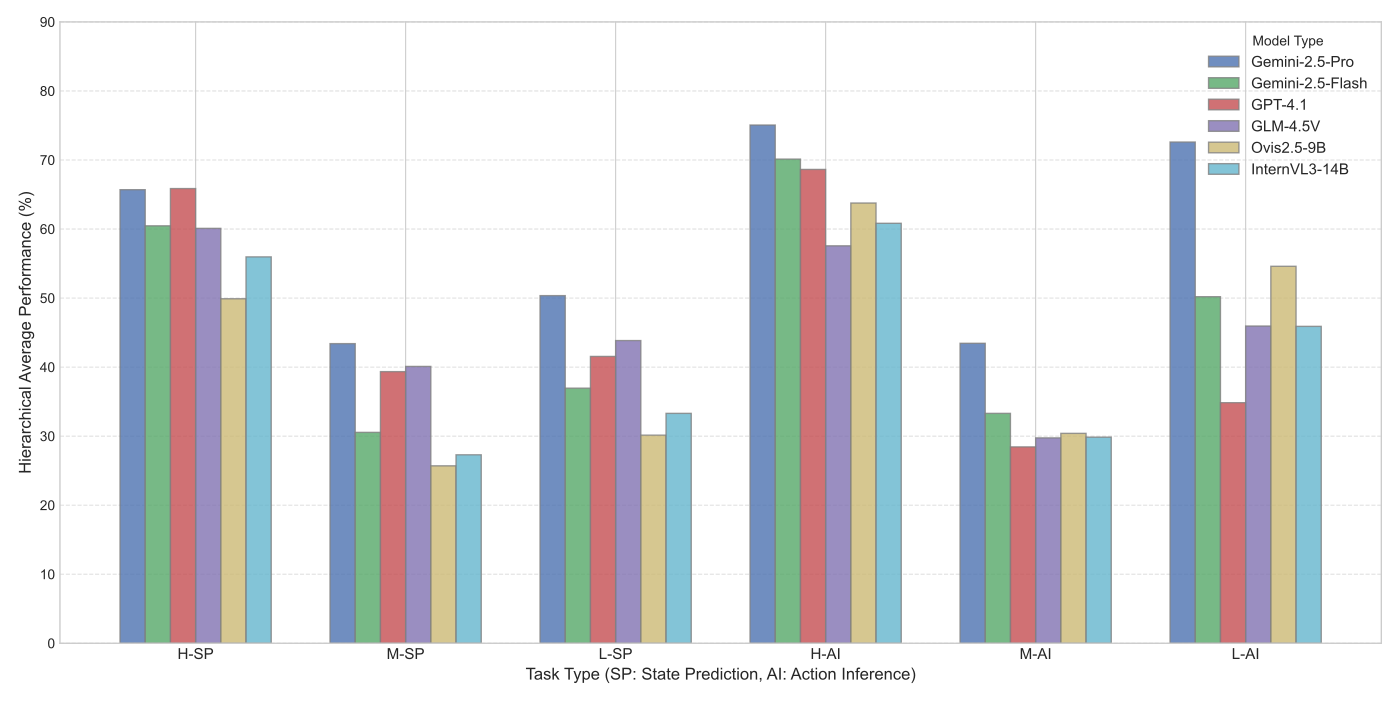
The reported pattern is V-shaped: mid-level motion descriptions are harder than both semantic goals and numerical vectors. Gemini-2.5-Pro scores approximately 70.4% at the high level, 43.4% at the mid-level and 61.5% at the low level.
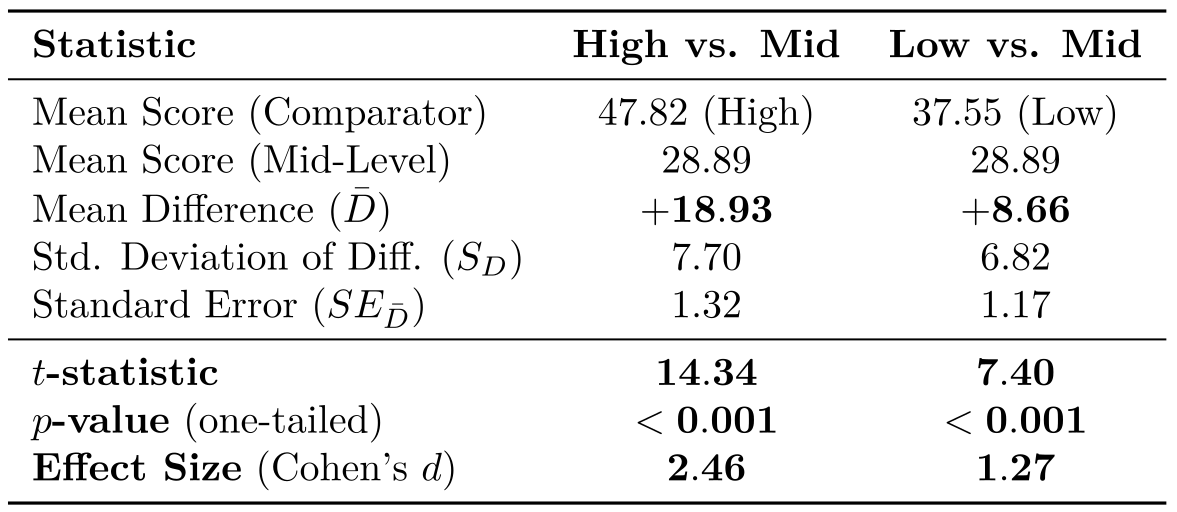
The controlled hierarchy comparison excludes RT-1 and reports mean high-minus-mid and low-minus-mid gaps of 18.93 and 8.66 percentage points across 34 models. This supports a difficulty associated with verbal geometric composition under this benchmark; it does not prove a universal ordering across action representations or distractor designs.
3.2 Prediction and inference
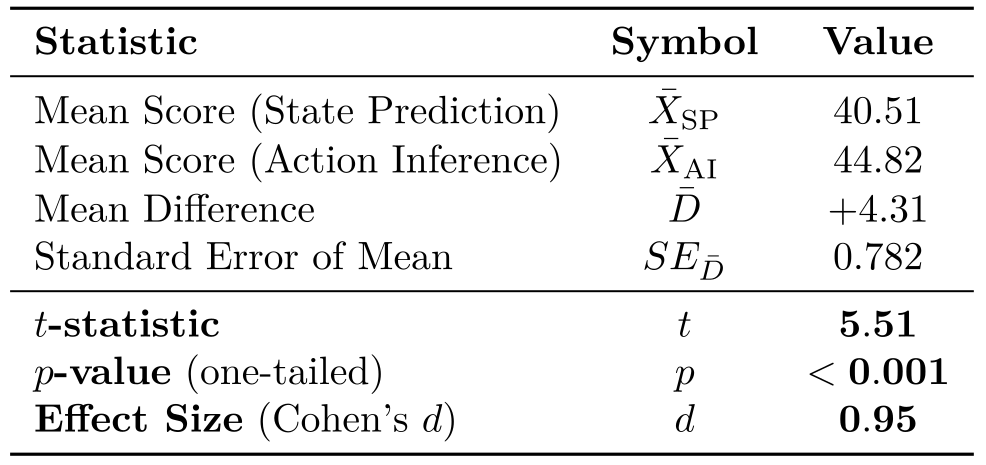
Gemini-2.5-Pro scores about 63.7% on inference and 53.2% on prediction. Appendix C.12 reports a positive average inference advantage of 4.31 points across models using an equal average over seven dataset/task cells per direction.
The advantage is an aggregate tendency, not universal. For example, hierarchical averages calculated from Table 1 put GPT-4.1 and GLM-4.5V higher on prediction than inference. Appendix C.8’s contrary GLM summary does not match those table values.
3.2 Model and human performance
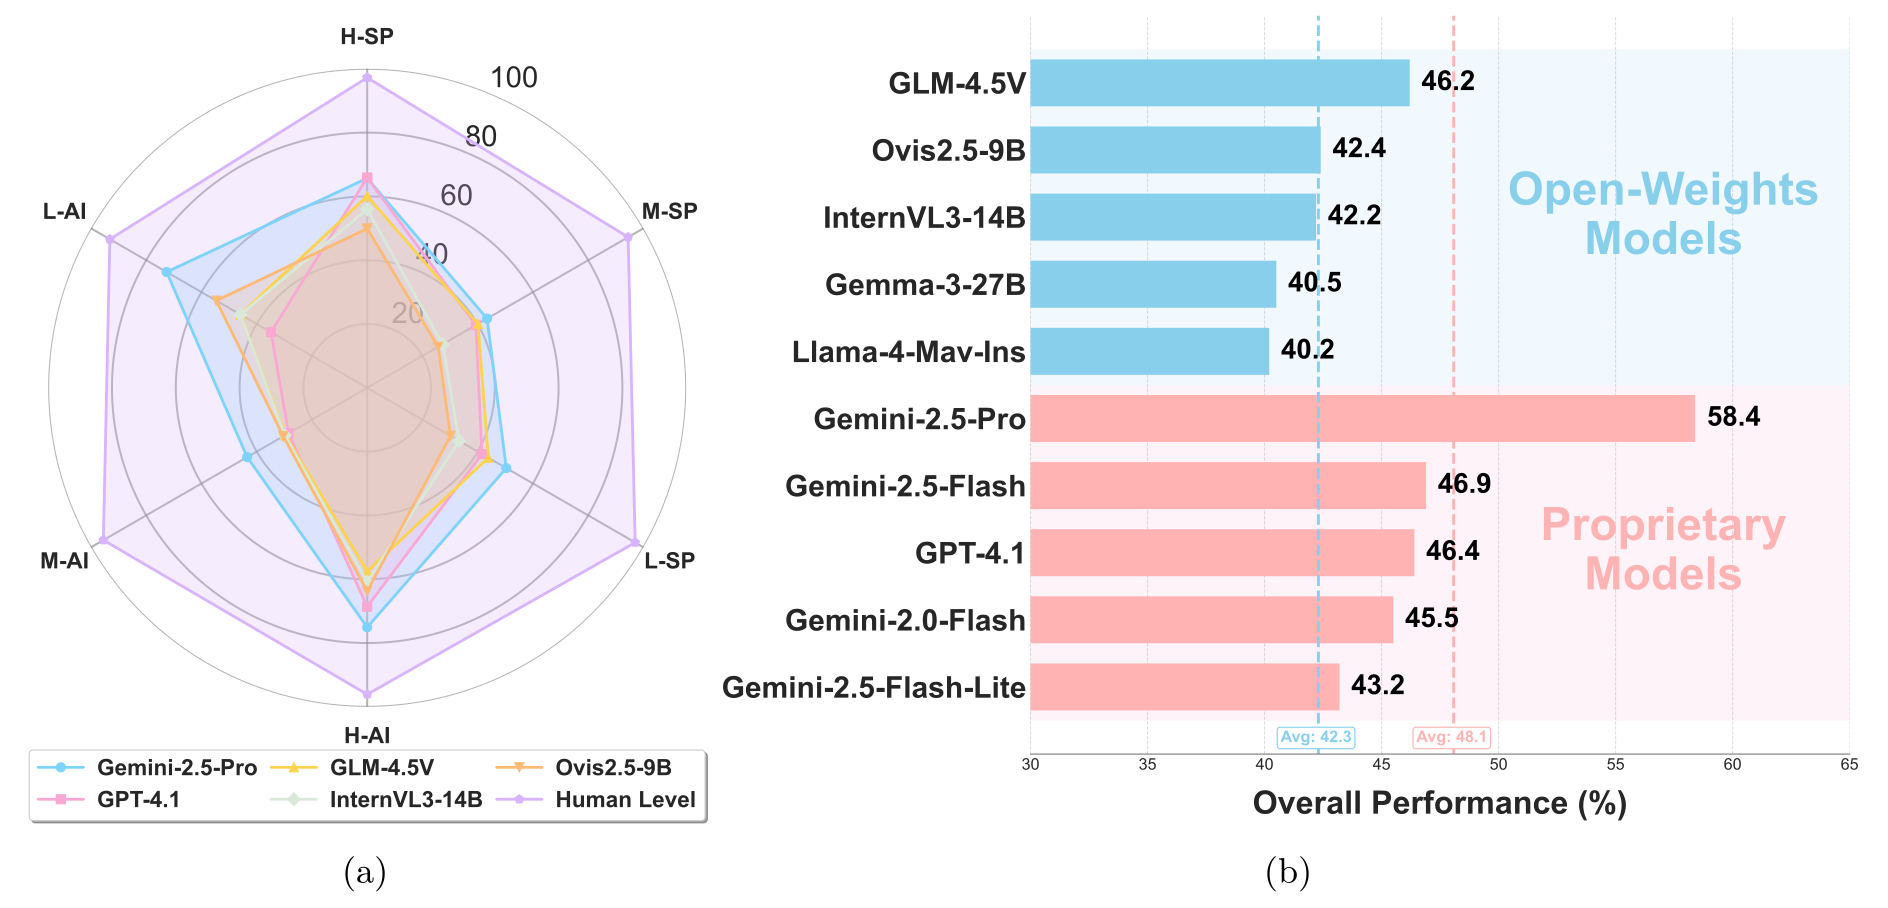
Gemini-2.5-Pro leads at 58.4%, followed by Gemini-2.5-Flash at 46.9% and GPT-4.1 at 46.4%; GLM-4.5V leads the open-weight group at 46.2%. The 37.2-point gap to the reported human score is substantial for these selected tasks.
Figure 5b compares the best five models in each access category. Their means, 48.1% and 42.3%, describe that selection rather than all proprietary and open-weight models. The experiment does not isolate architecture, data volume or licensing as the cause of the difference.
3.3 Multiple exocentric views
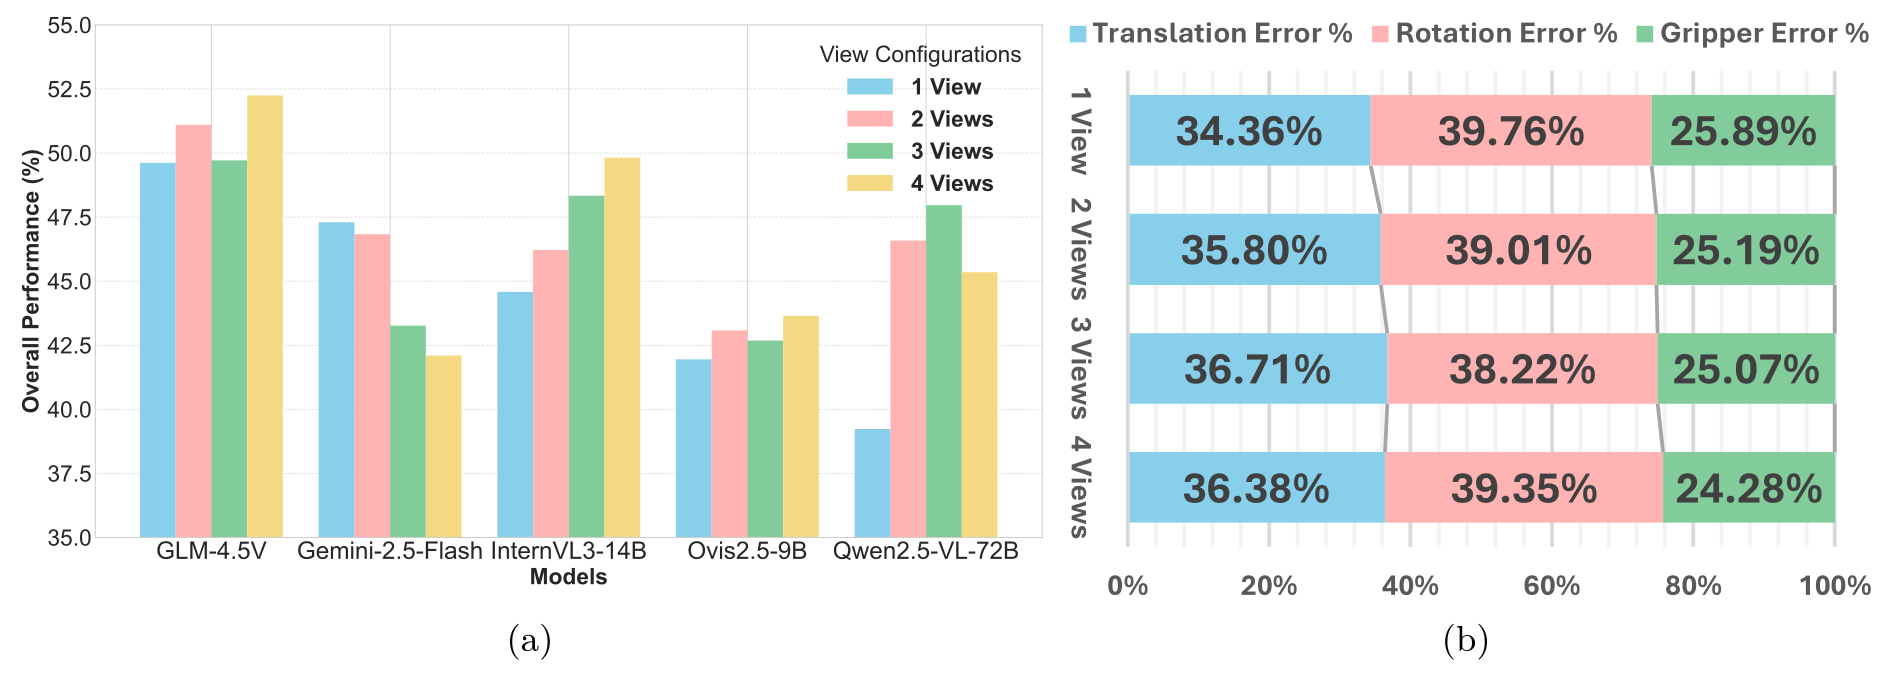
Five models receive one to four concatenated BridgeData V2 views. InternVL3-14B improves from 44.6% to 49.8%, while Gemini-2.5-Flash falls from 47.3% to 42.1%. Other models show non-monotonic or task-dependent changes; Table 2 preserves all scores and reported Wald intervals.
Additional views often help action inference more than state prediction, but the response varies by model. Cross-view reconciliation is a plausible explanation, not a measured internal mechanism. Concatenated input size, image processing and visual-token allocation also change with the setup.

3.3 Rotation difficulty
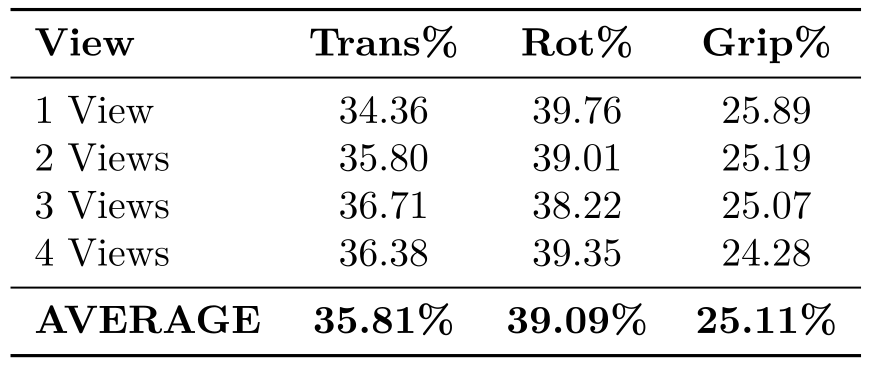
Rotation contributes the largest normalized error proportion in the mid-level inference analysis; gripper actuation contributes the smallest. These are per-action error rates rescaled to sum to 100%, not raw failure probabilities.
Figure 6b and Table 28 give rotation shares 39.76, 39.01, 38.22 and 39.35% for one through four views. The main prose assigns the endpoints differently. The original plot/table are retained; neither translation nor rotation shows a consistent improvement from more views in this analysis.
3.4 Camera perspective
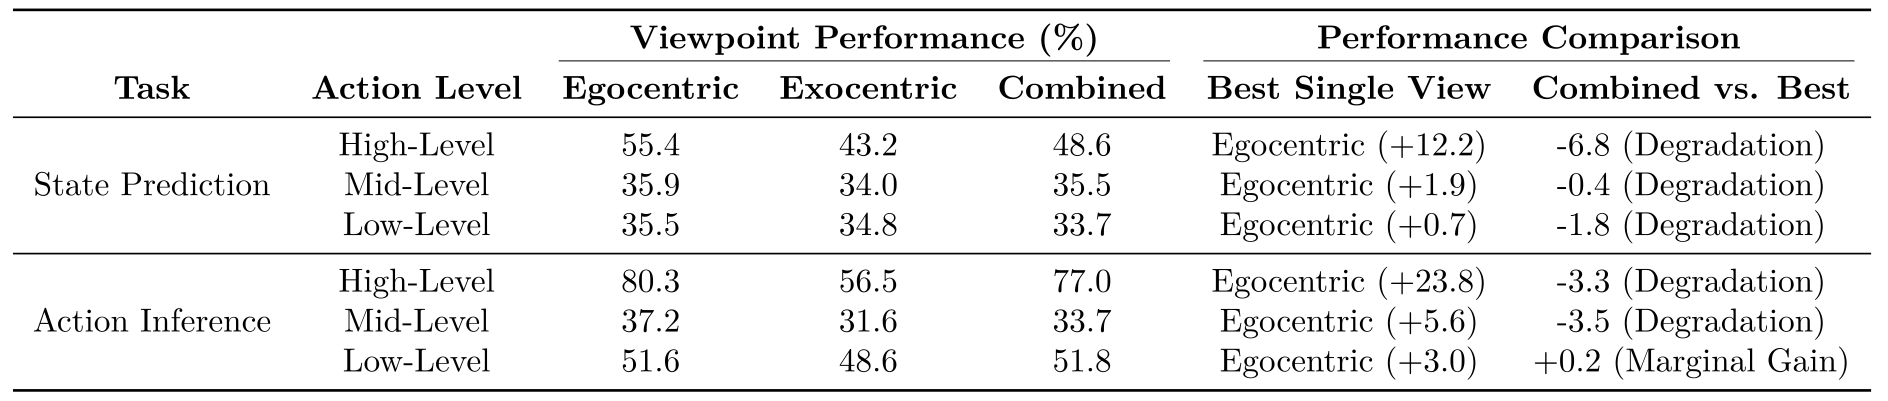
On DROID, the six-model mean favors the wrist camera over an external camera in every task category. The largest gap is 23.8 points for high-level inference; high-level prediction gains 12.2 points. Individual models and categories have exceptions.
Concatenating both views usually lowers the category average relative to wrist-only input, including −6.8 points for high-level prediction. Low-level inference has a small +0.2-point gain. This is evidence about these camera placements and the tested concatenation method, not a general rule that sensor fusion is harmful.

4. Qualitative error analysis
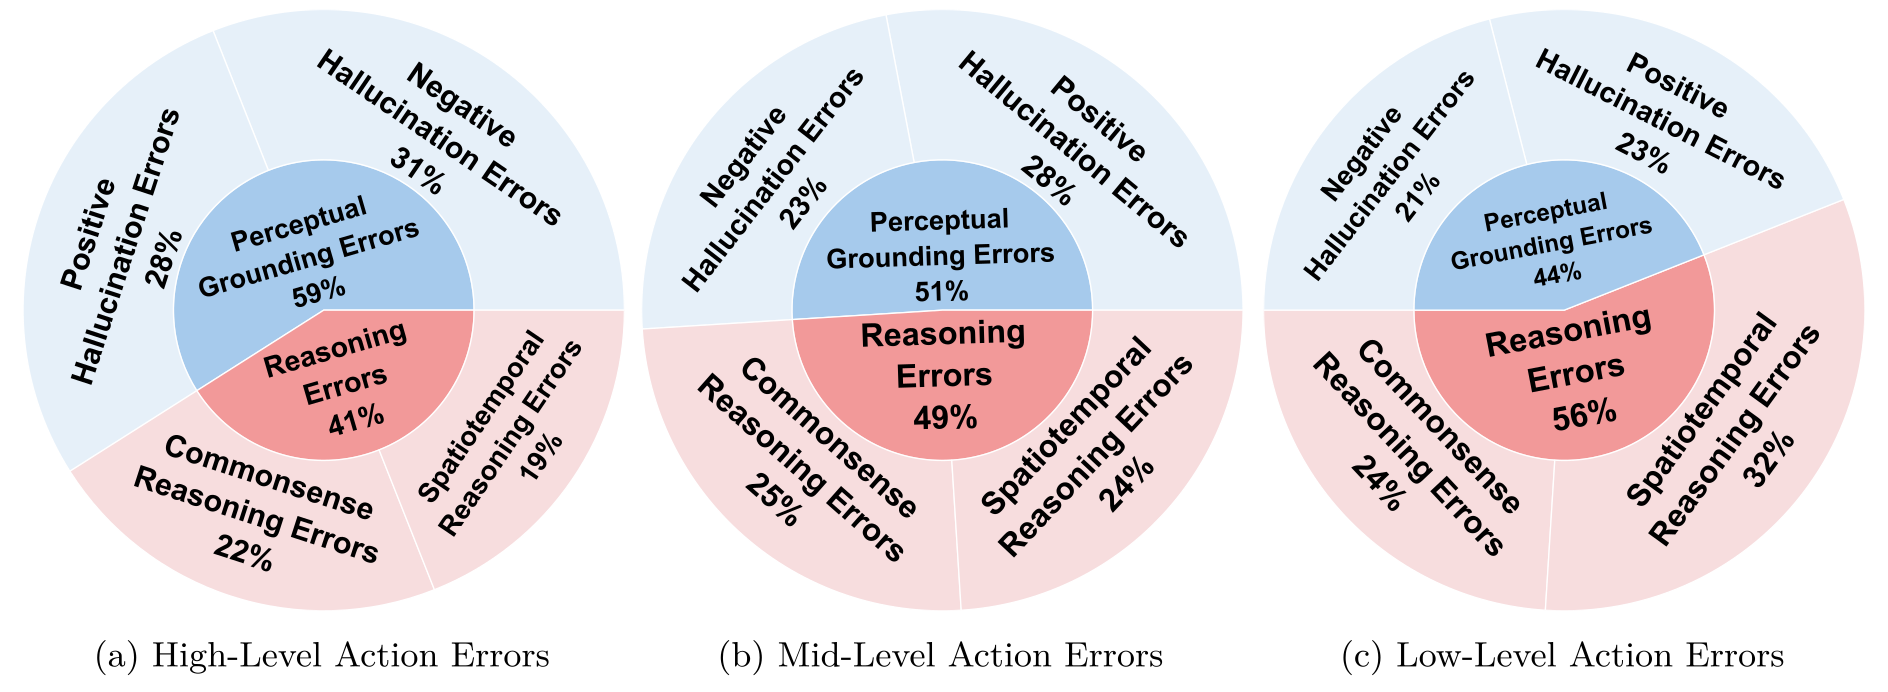
The authors inspect Gemini-2.5-Pro errors using separate prompts that elicit written reasoning. Perceptual errors account for 59% of high-level errors and 44% of low-level errors; reasoning labels account for the complementary 41% and 56%. The mid-level split is 51%/49%.
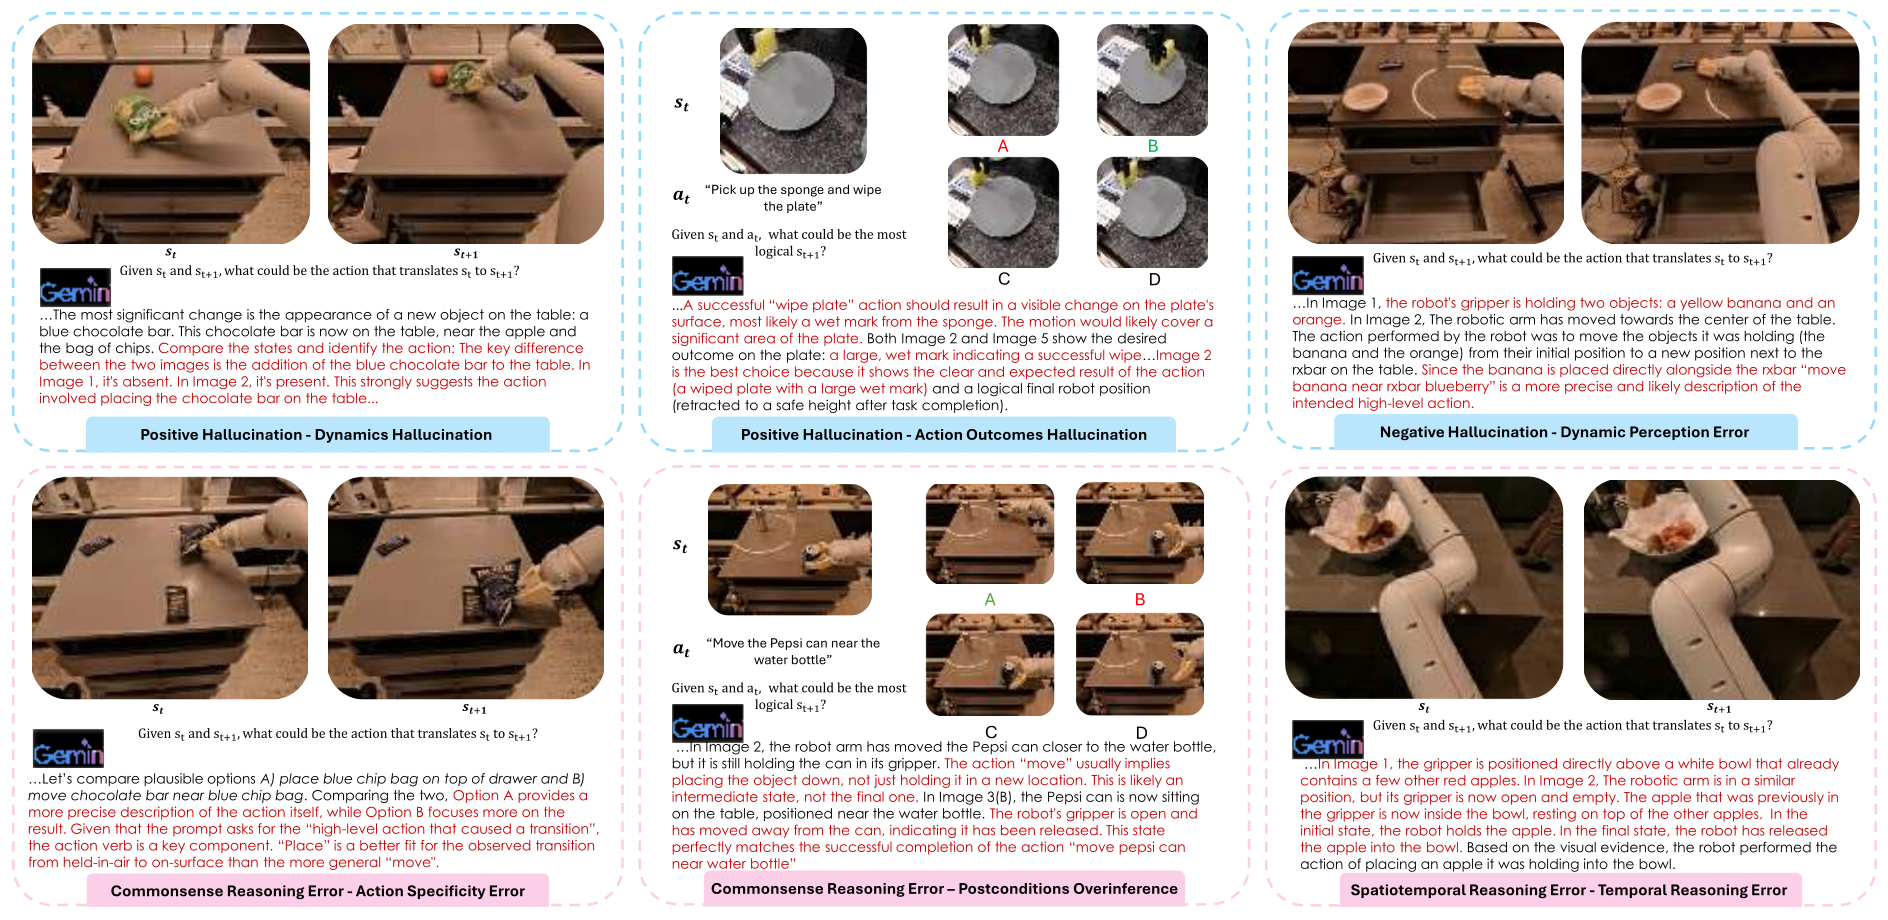
The sample description is inconsistent: one sentence says fifty cases per action level within each direction, implying 300, while the following paragraph says 150 total. The percentages and examples are preserved without resolving this discrepancy. Generated explanations support an interpretive taxonomy; they are not guaranteed faithful measurements of hidden computation.
Examples include treating an occluded chocolate bar as newly placed, confusing a shadow with a wet mark, inventing a banana from gripper color, insisting that moving entails release, and reversing the before/after sequence. Full original panels remain below.
5. Related work
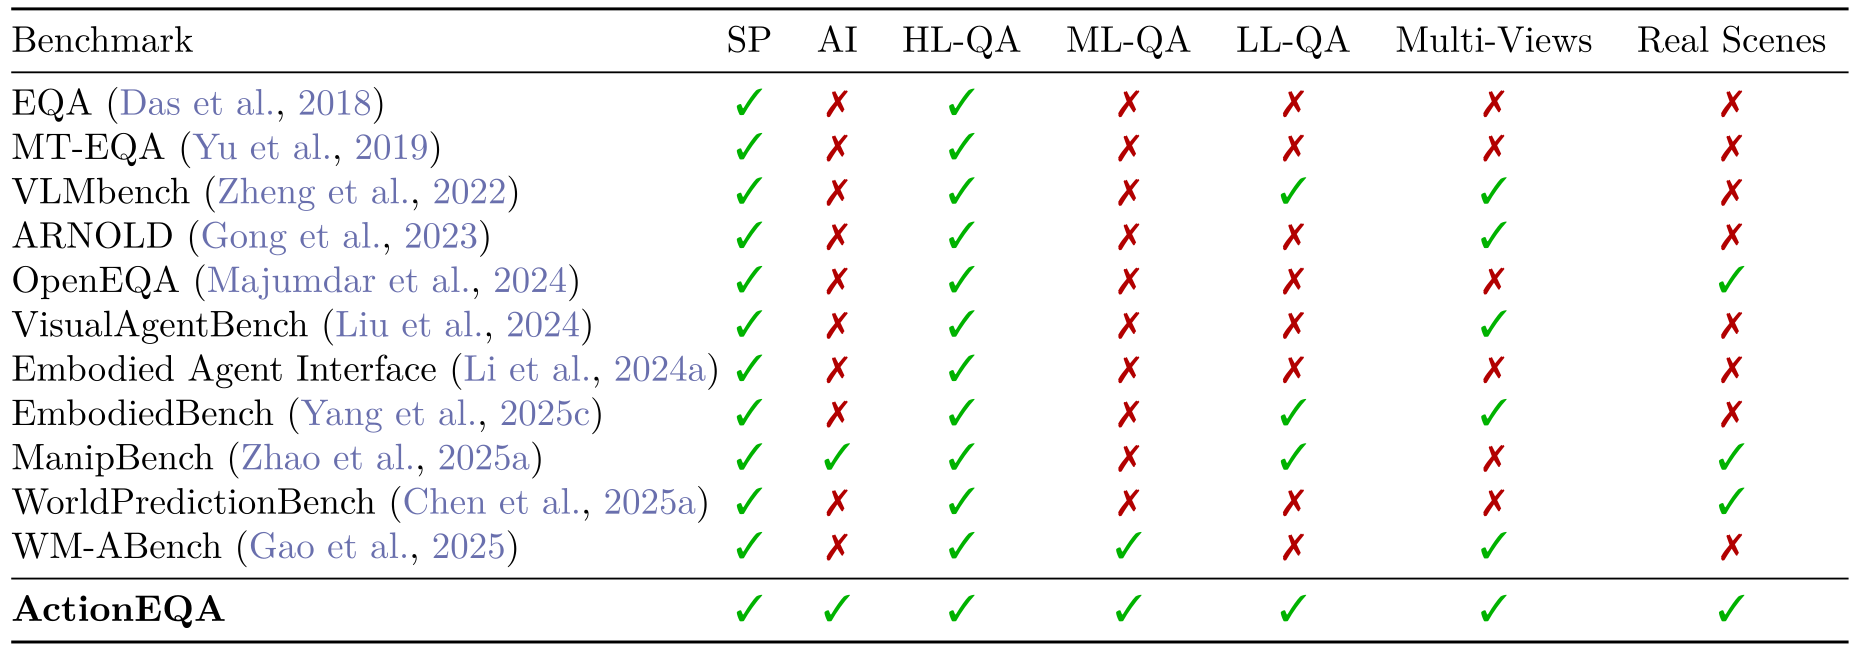
Prior work evaluates navigation/question answering, language-guided manipulation and embodied decision making [20] [25] [41] [71]. Table 5 preserves the authors’ comparison across direction, action level, camera views and real scenes.
ActionEQA’s contribution is a structured diagnostic interface. Its questions complement execution-based evaluation and do not replace measurements of task completion, robustness or safety.
6. Conclusion
ActionEQA exposes weaknesses in connecting language and numerical motion descriptions to observed robot transitions. The strongest practical findings are the mid-level difficulty, model-dependent effects of added viewpoints, and the need to distinguish answer accuracy from physical execution.
B. Coordinate convention
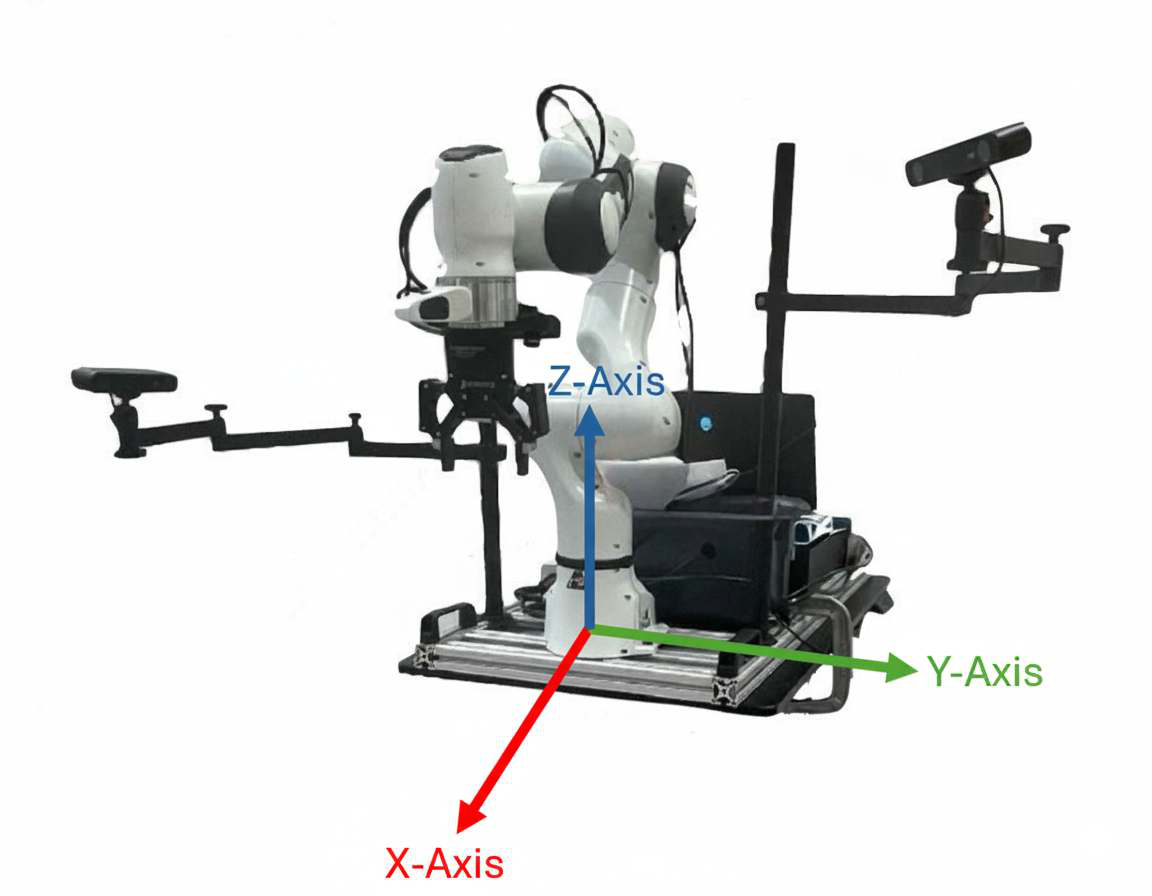
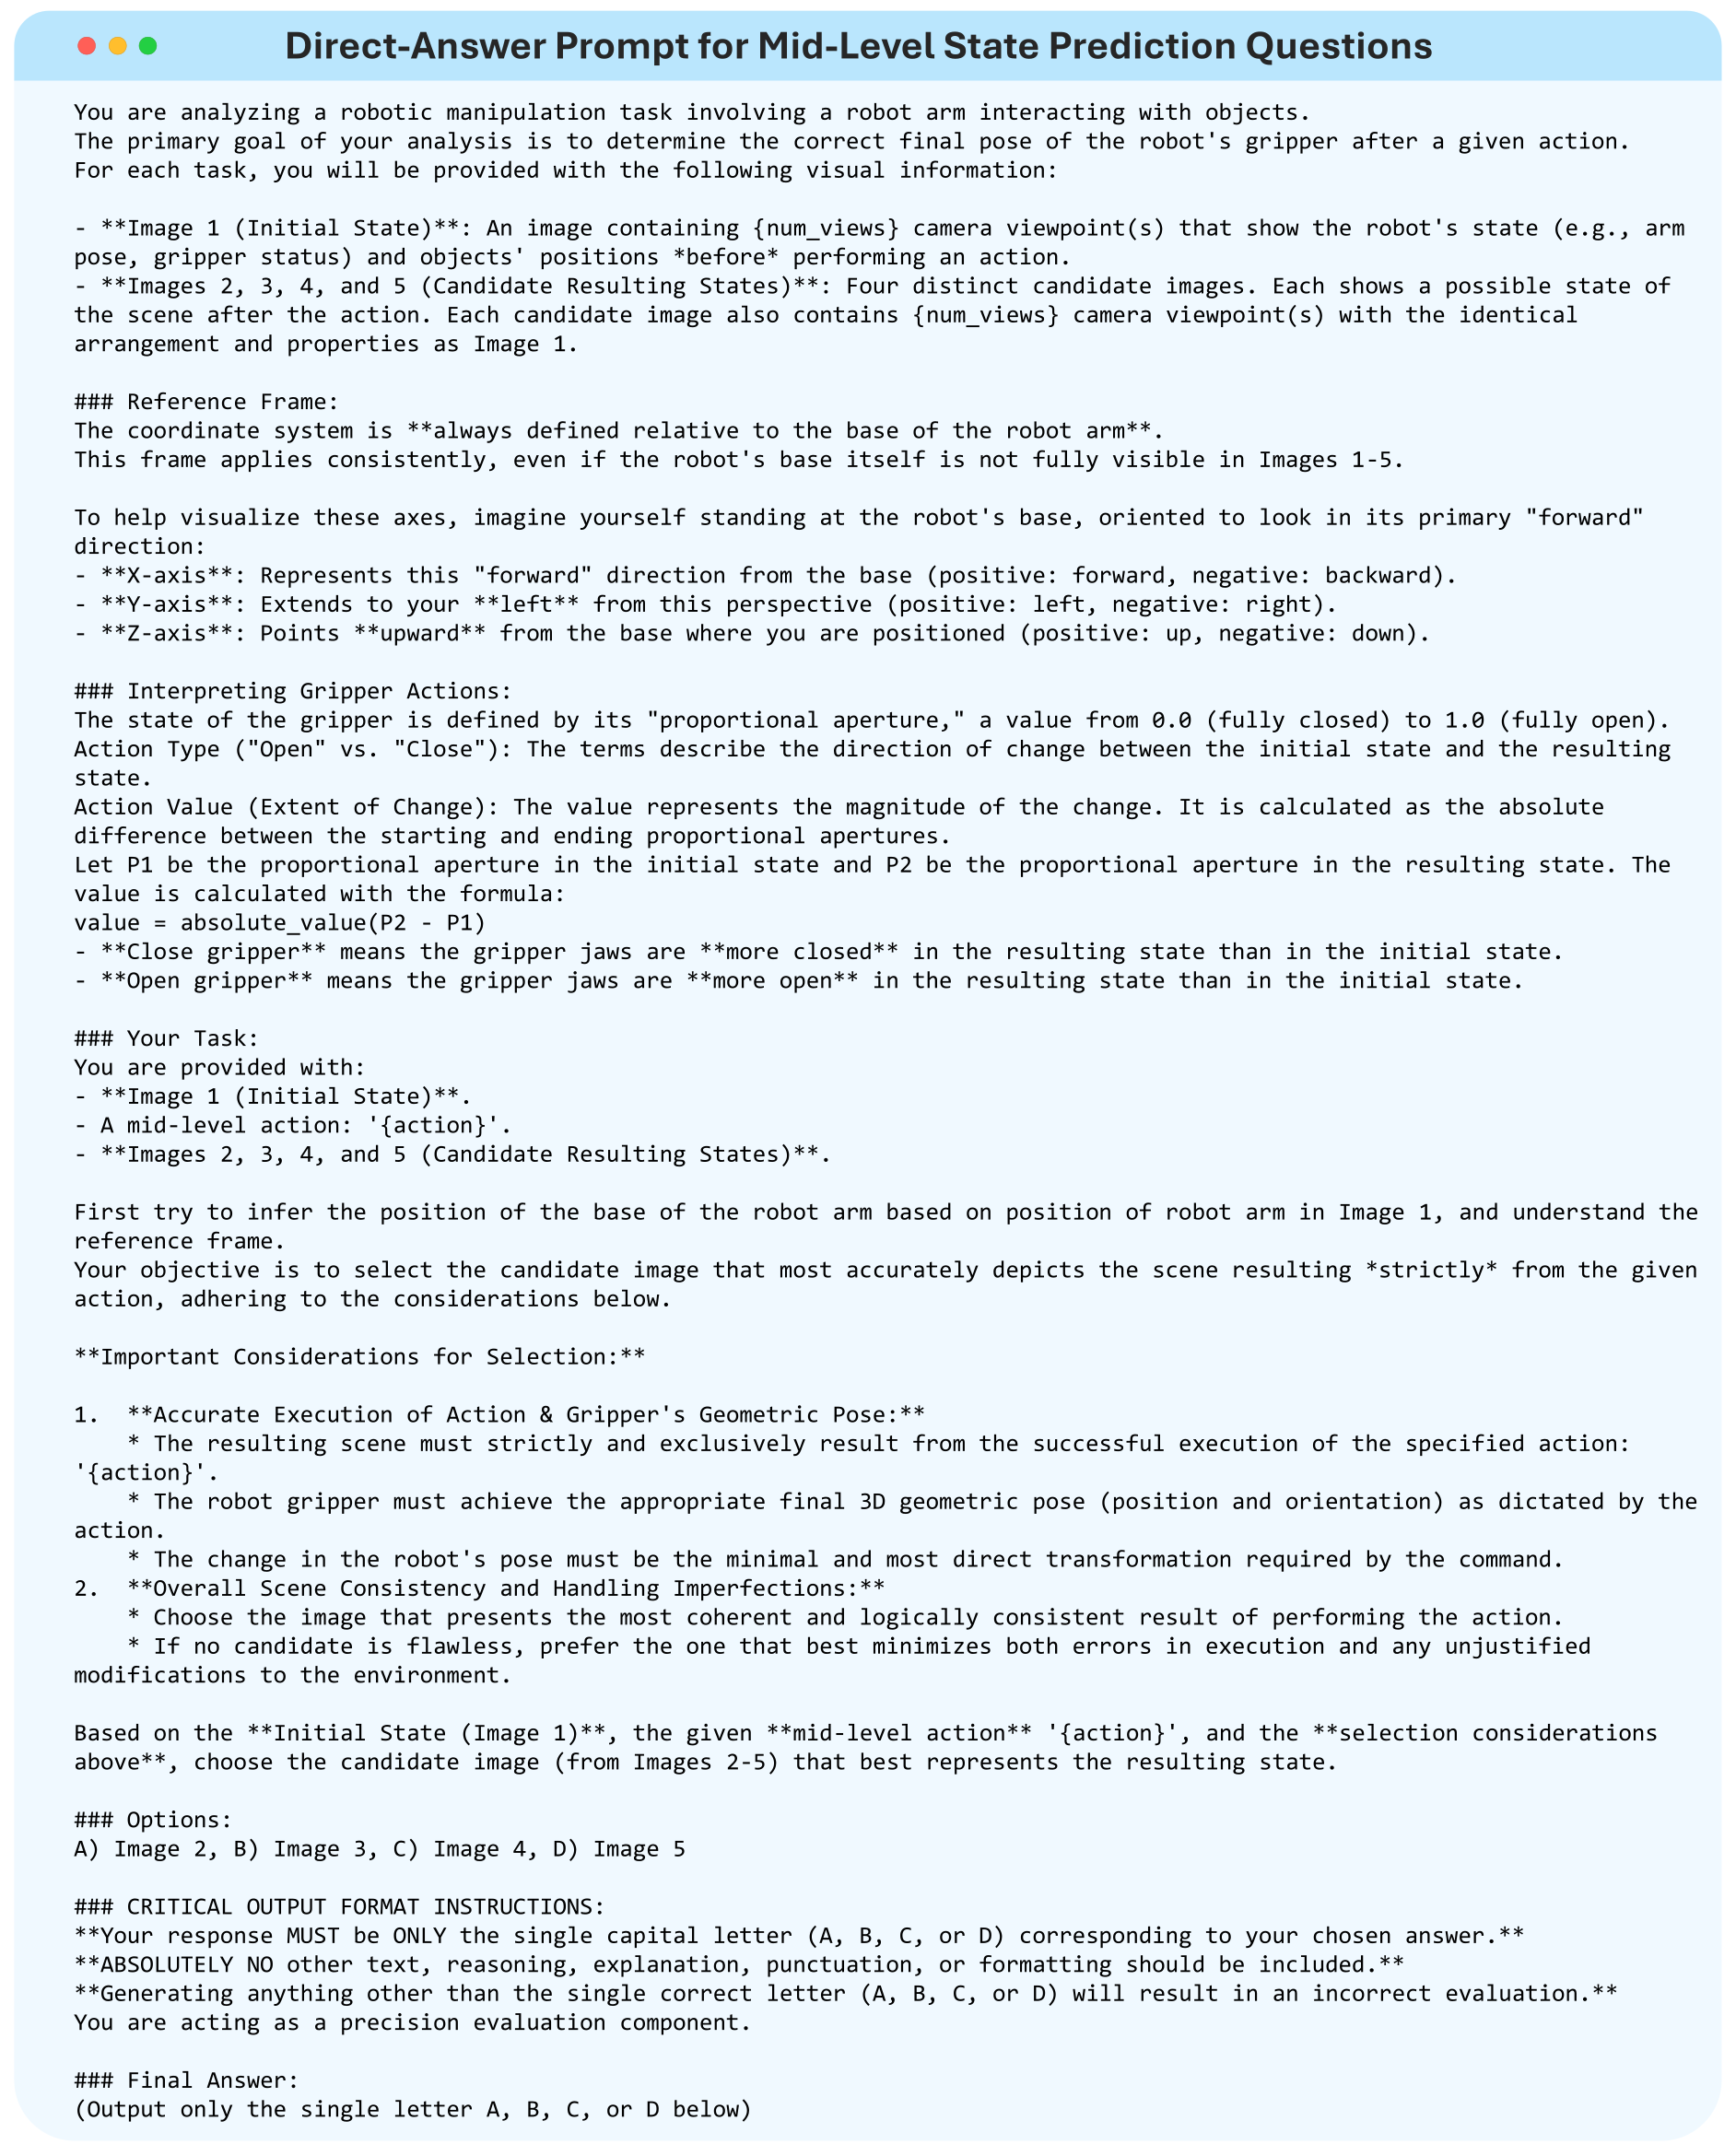
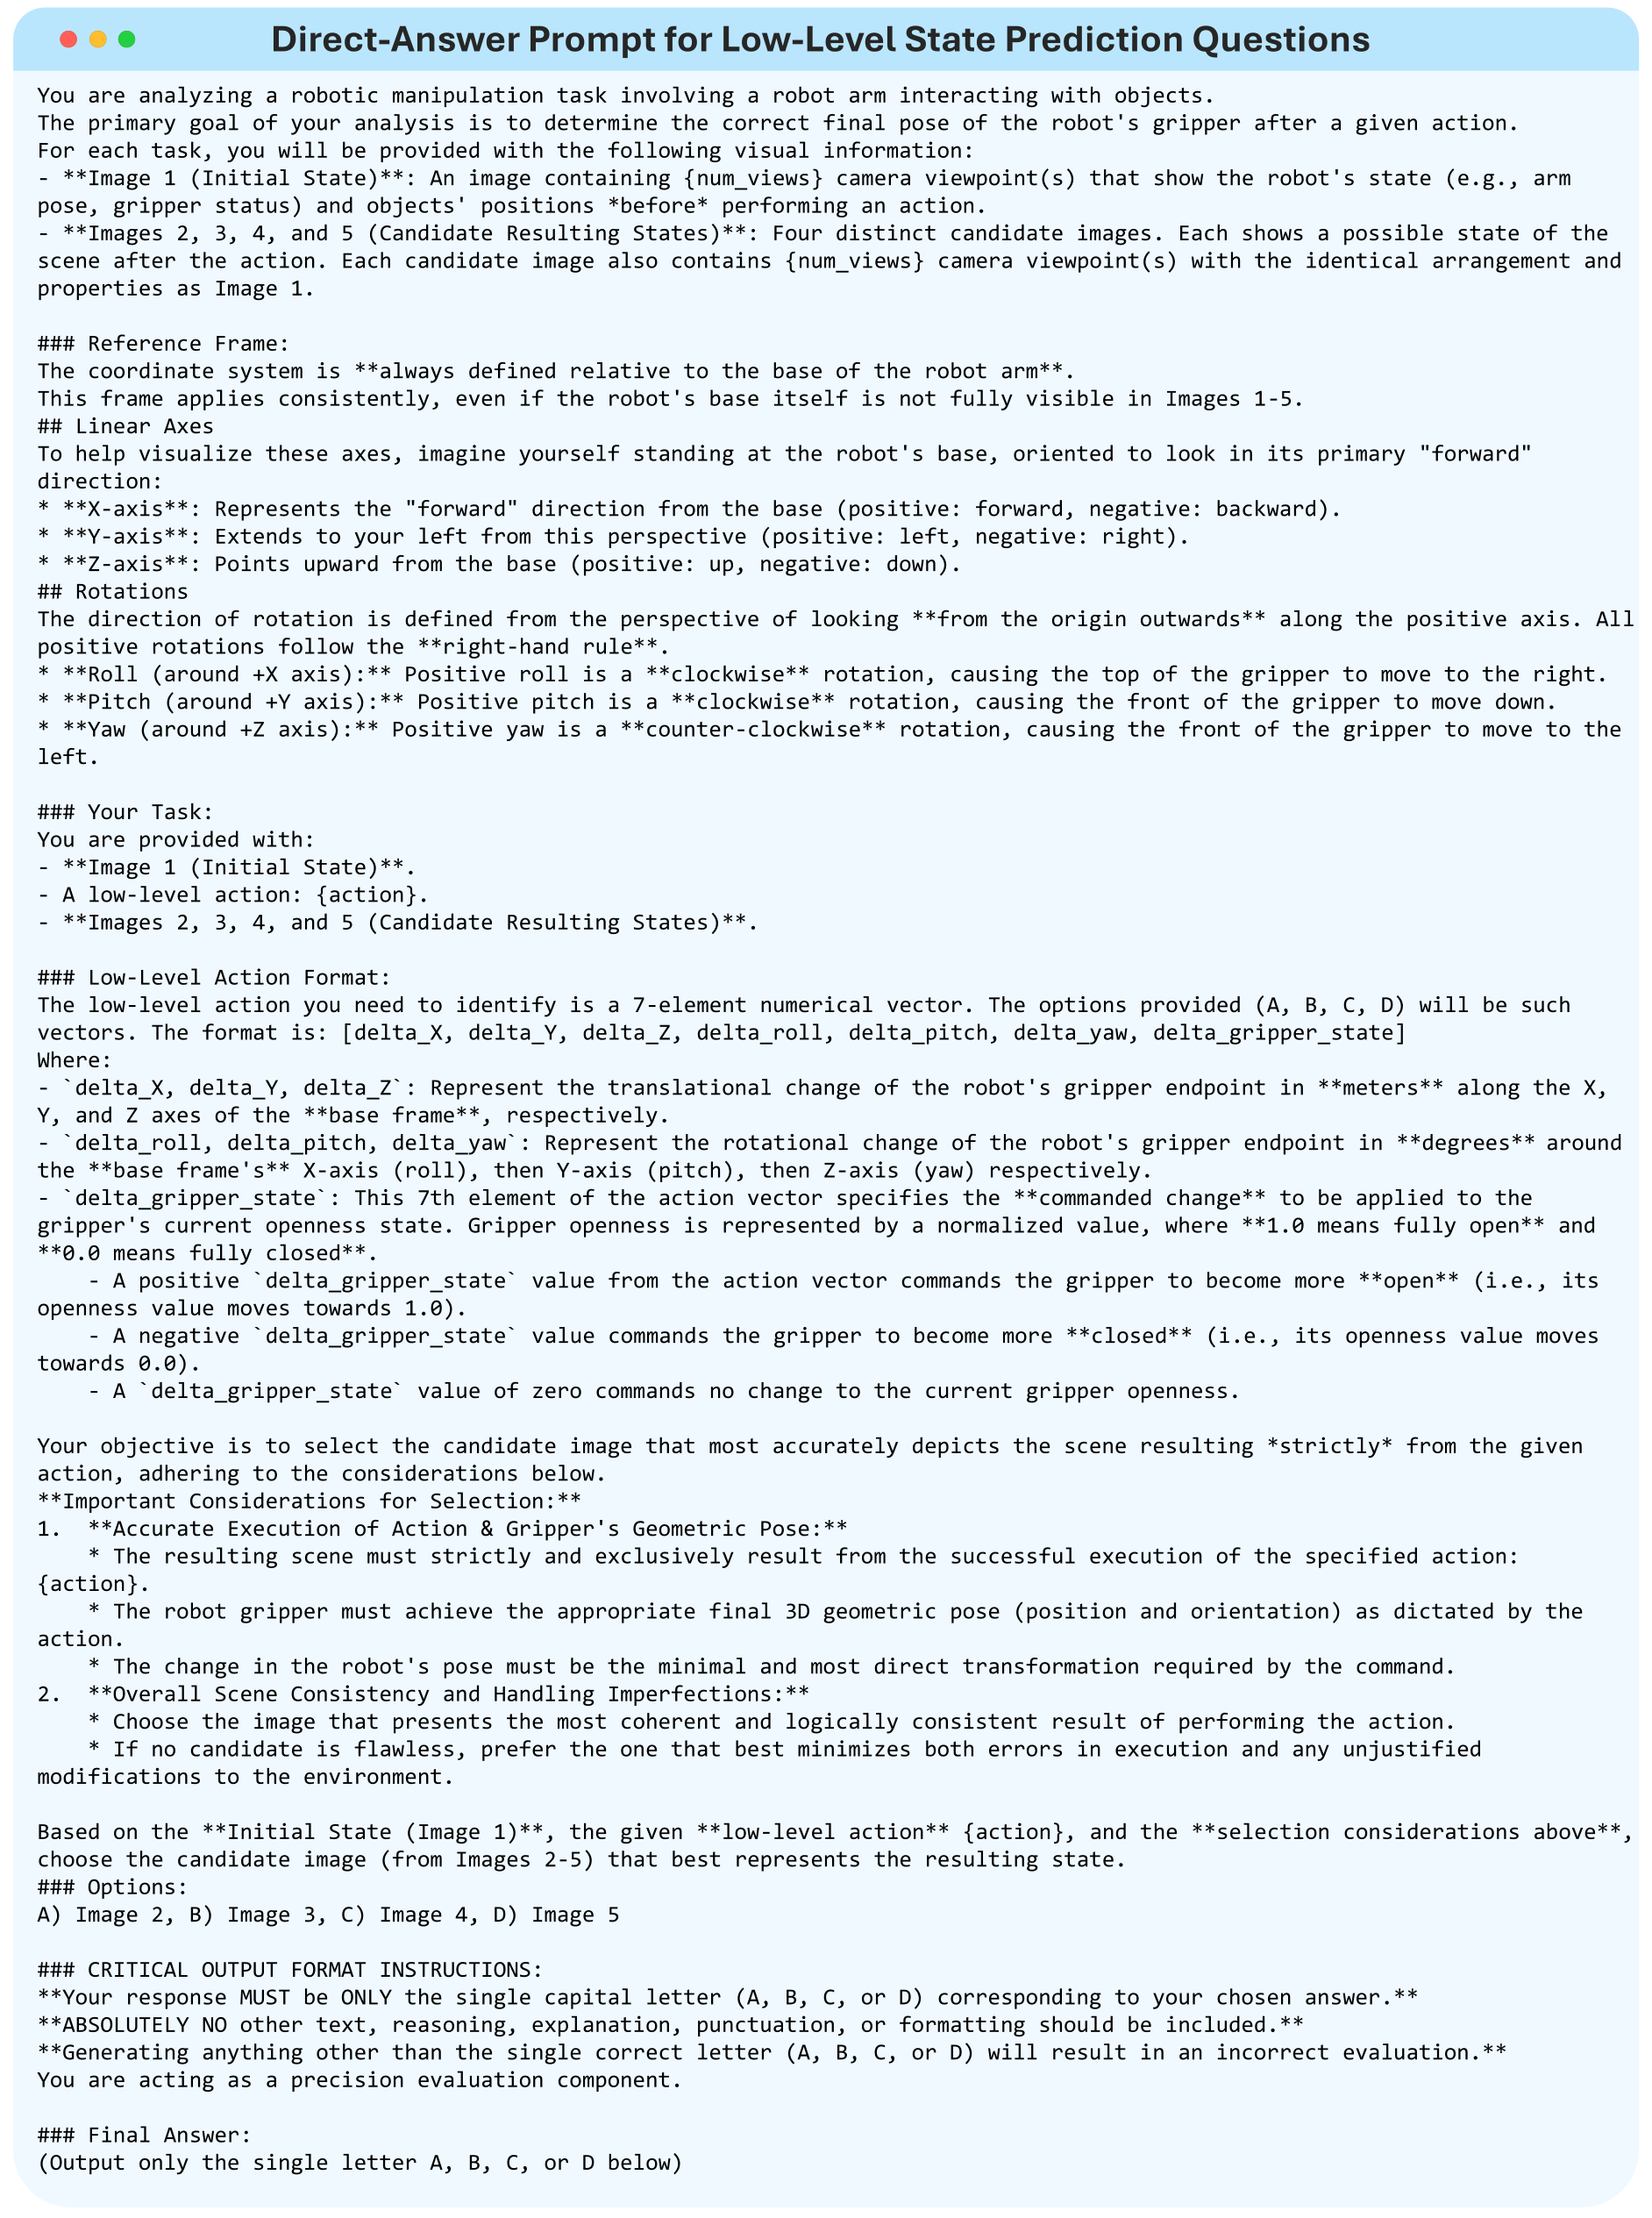
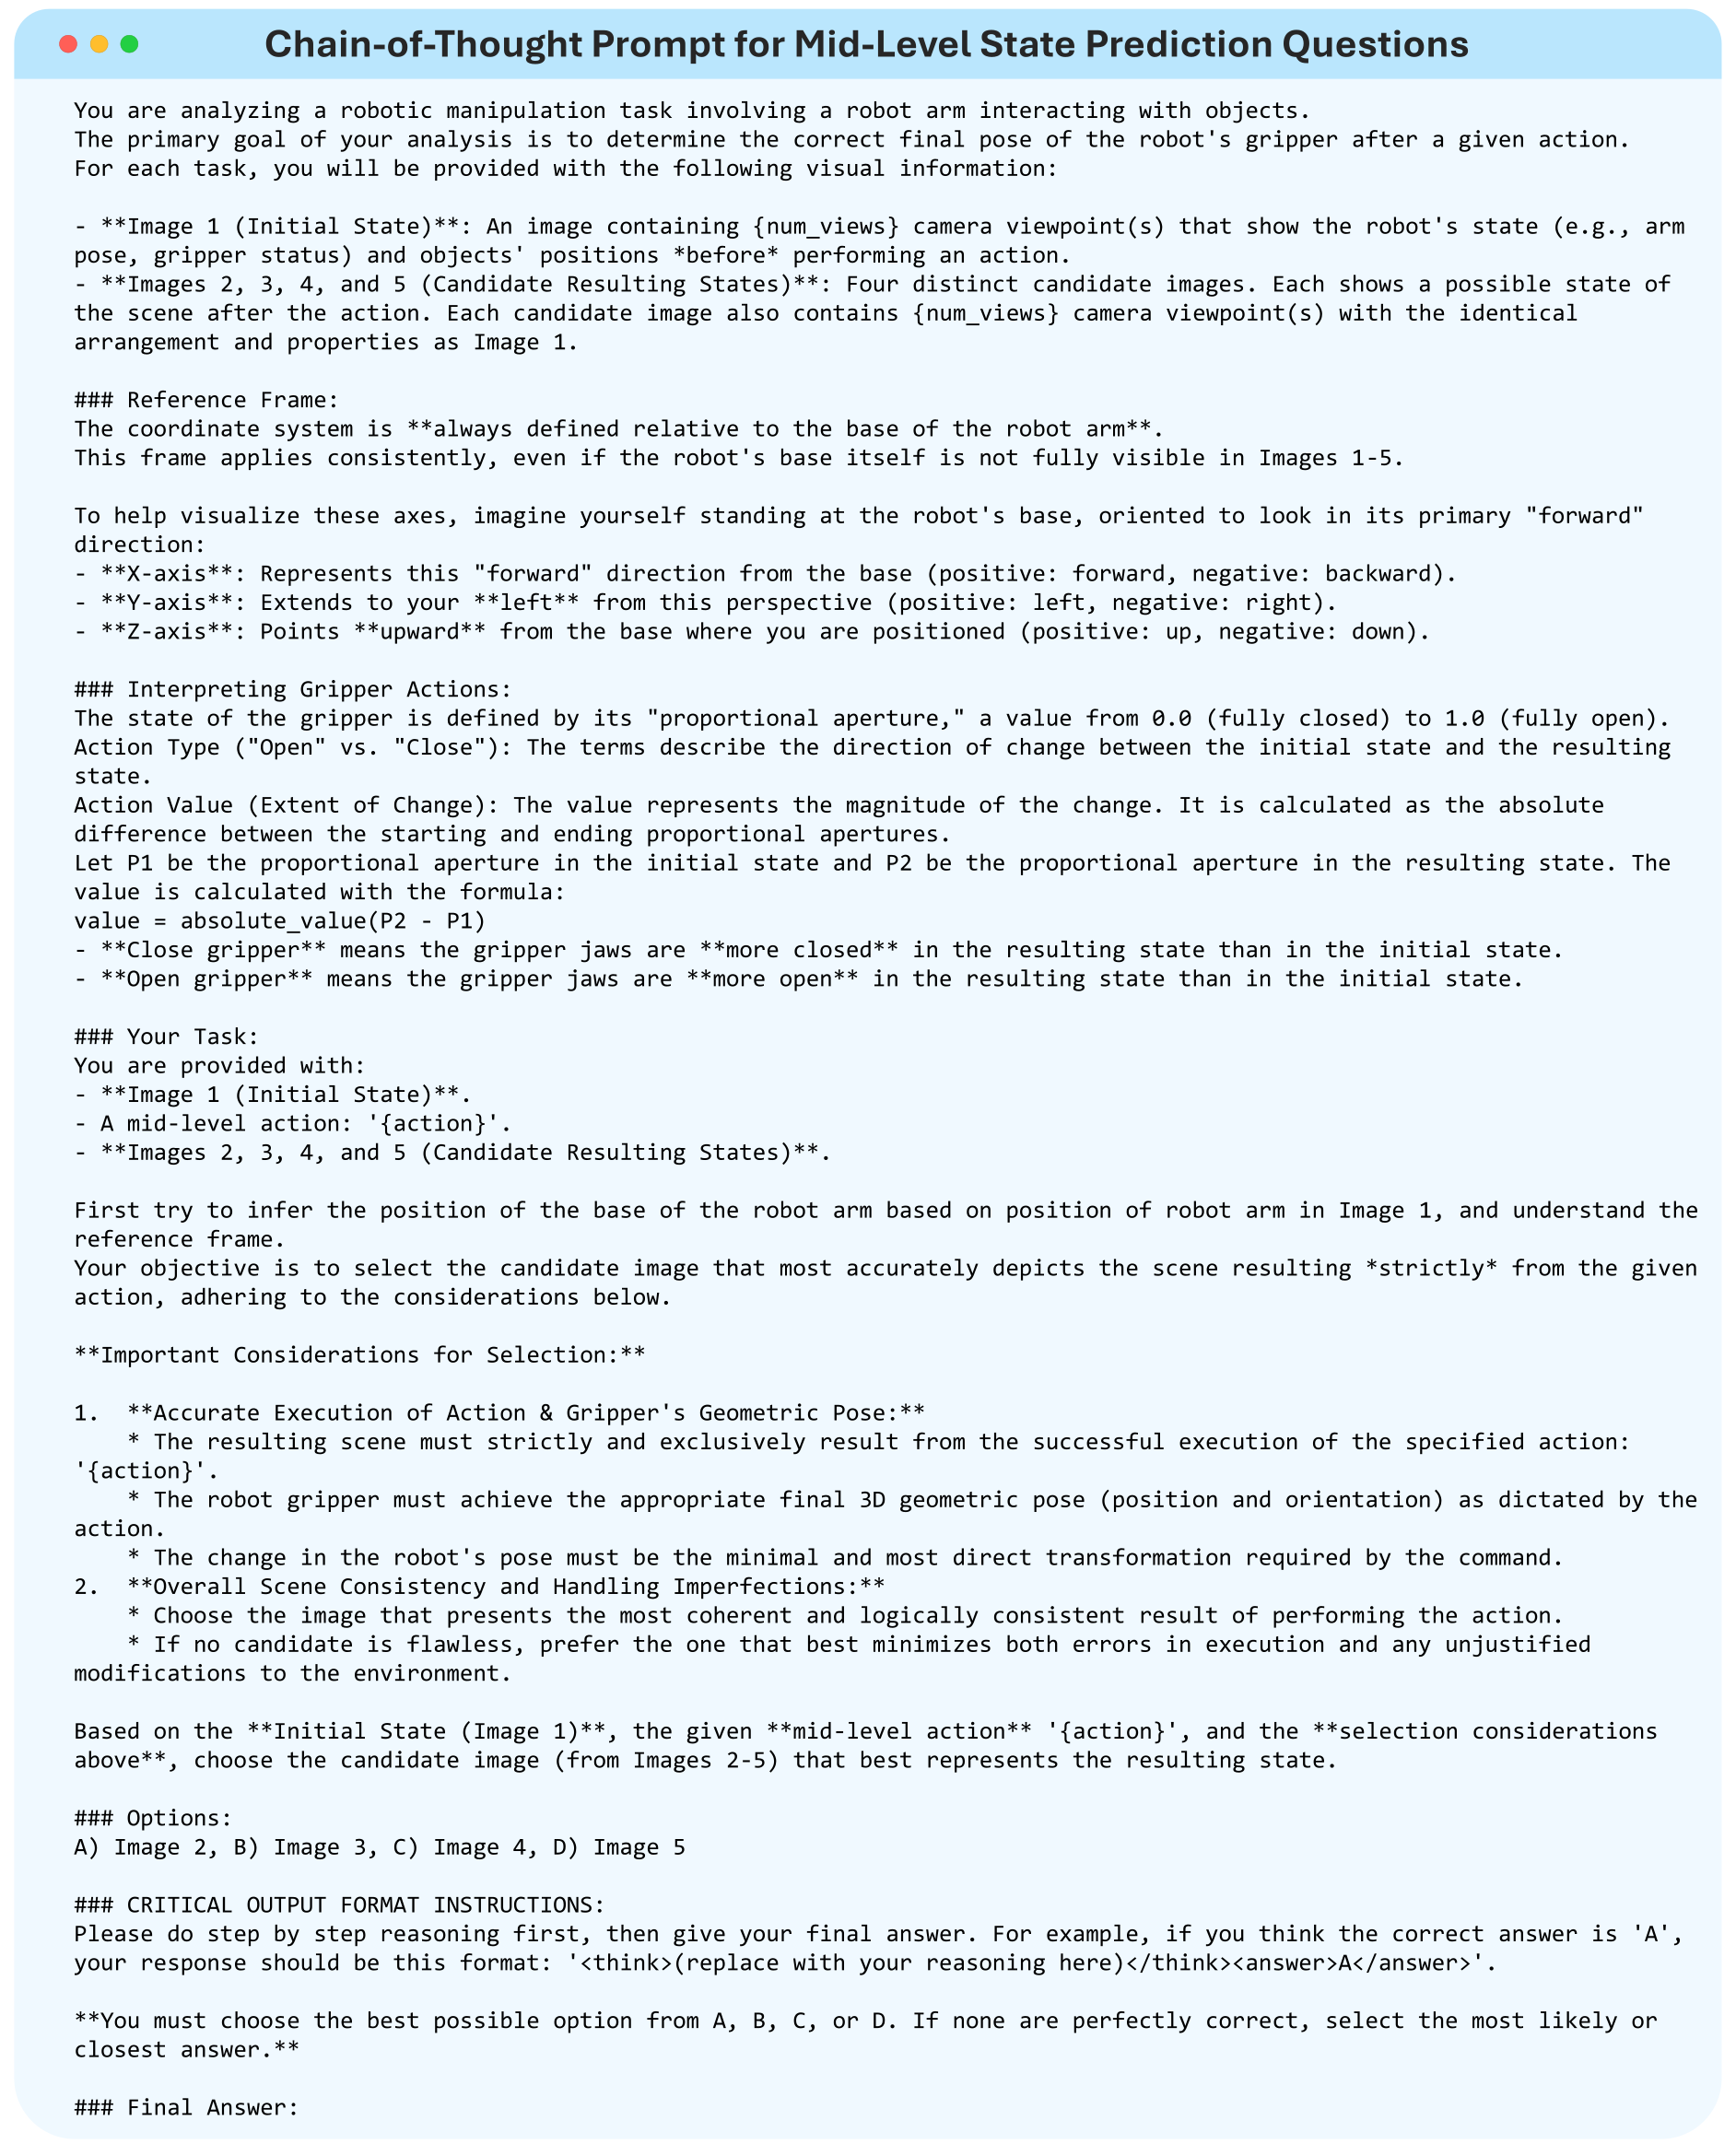
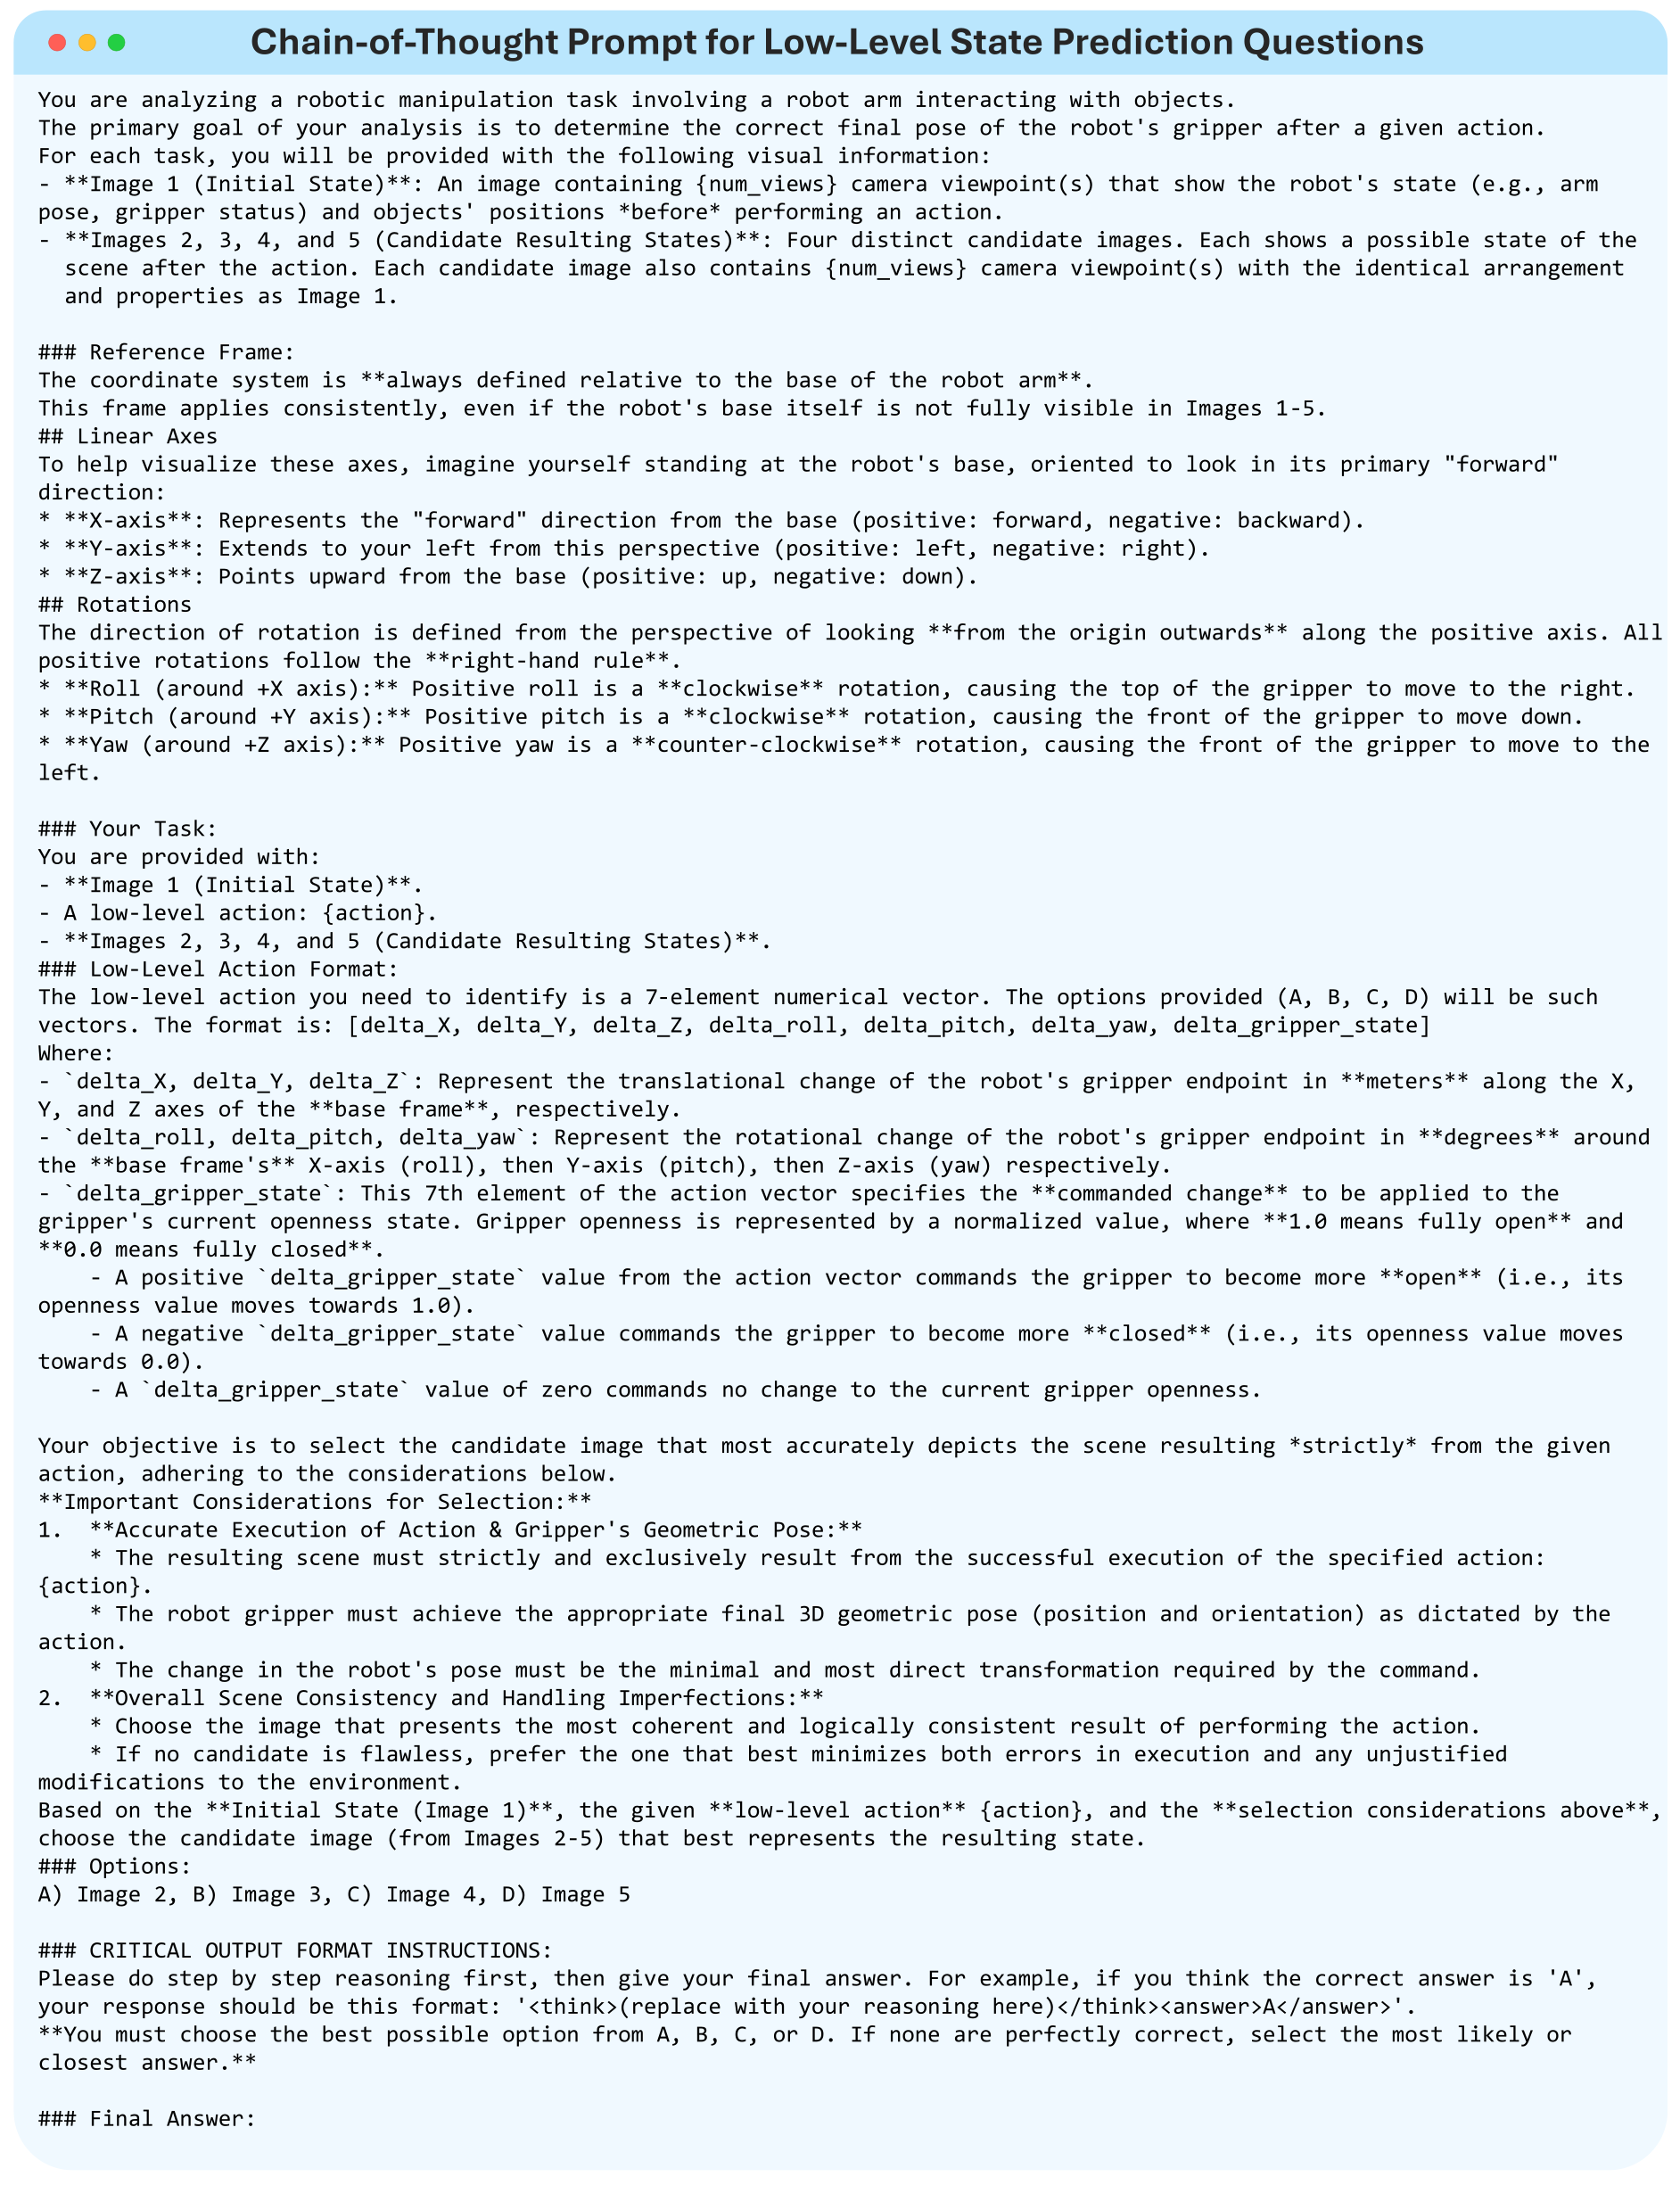
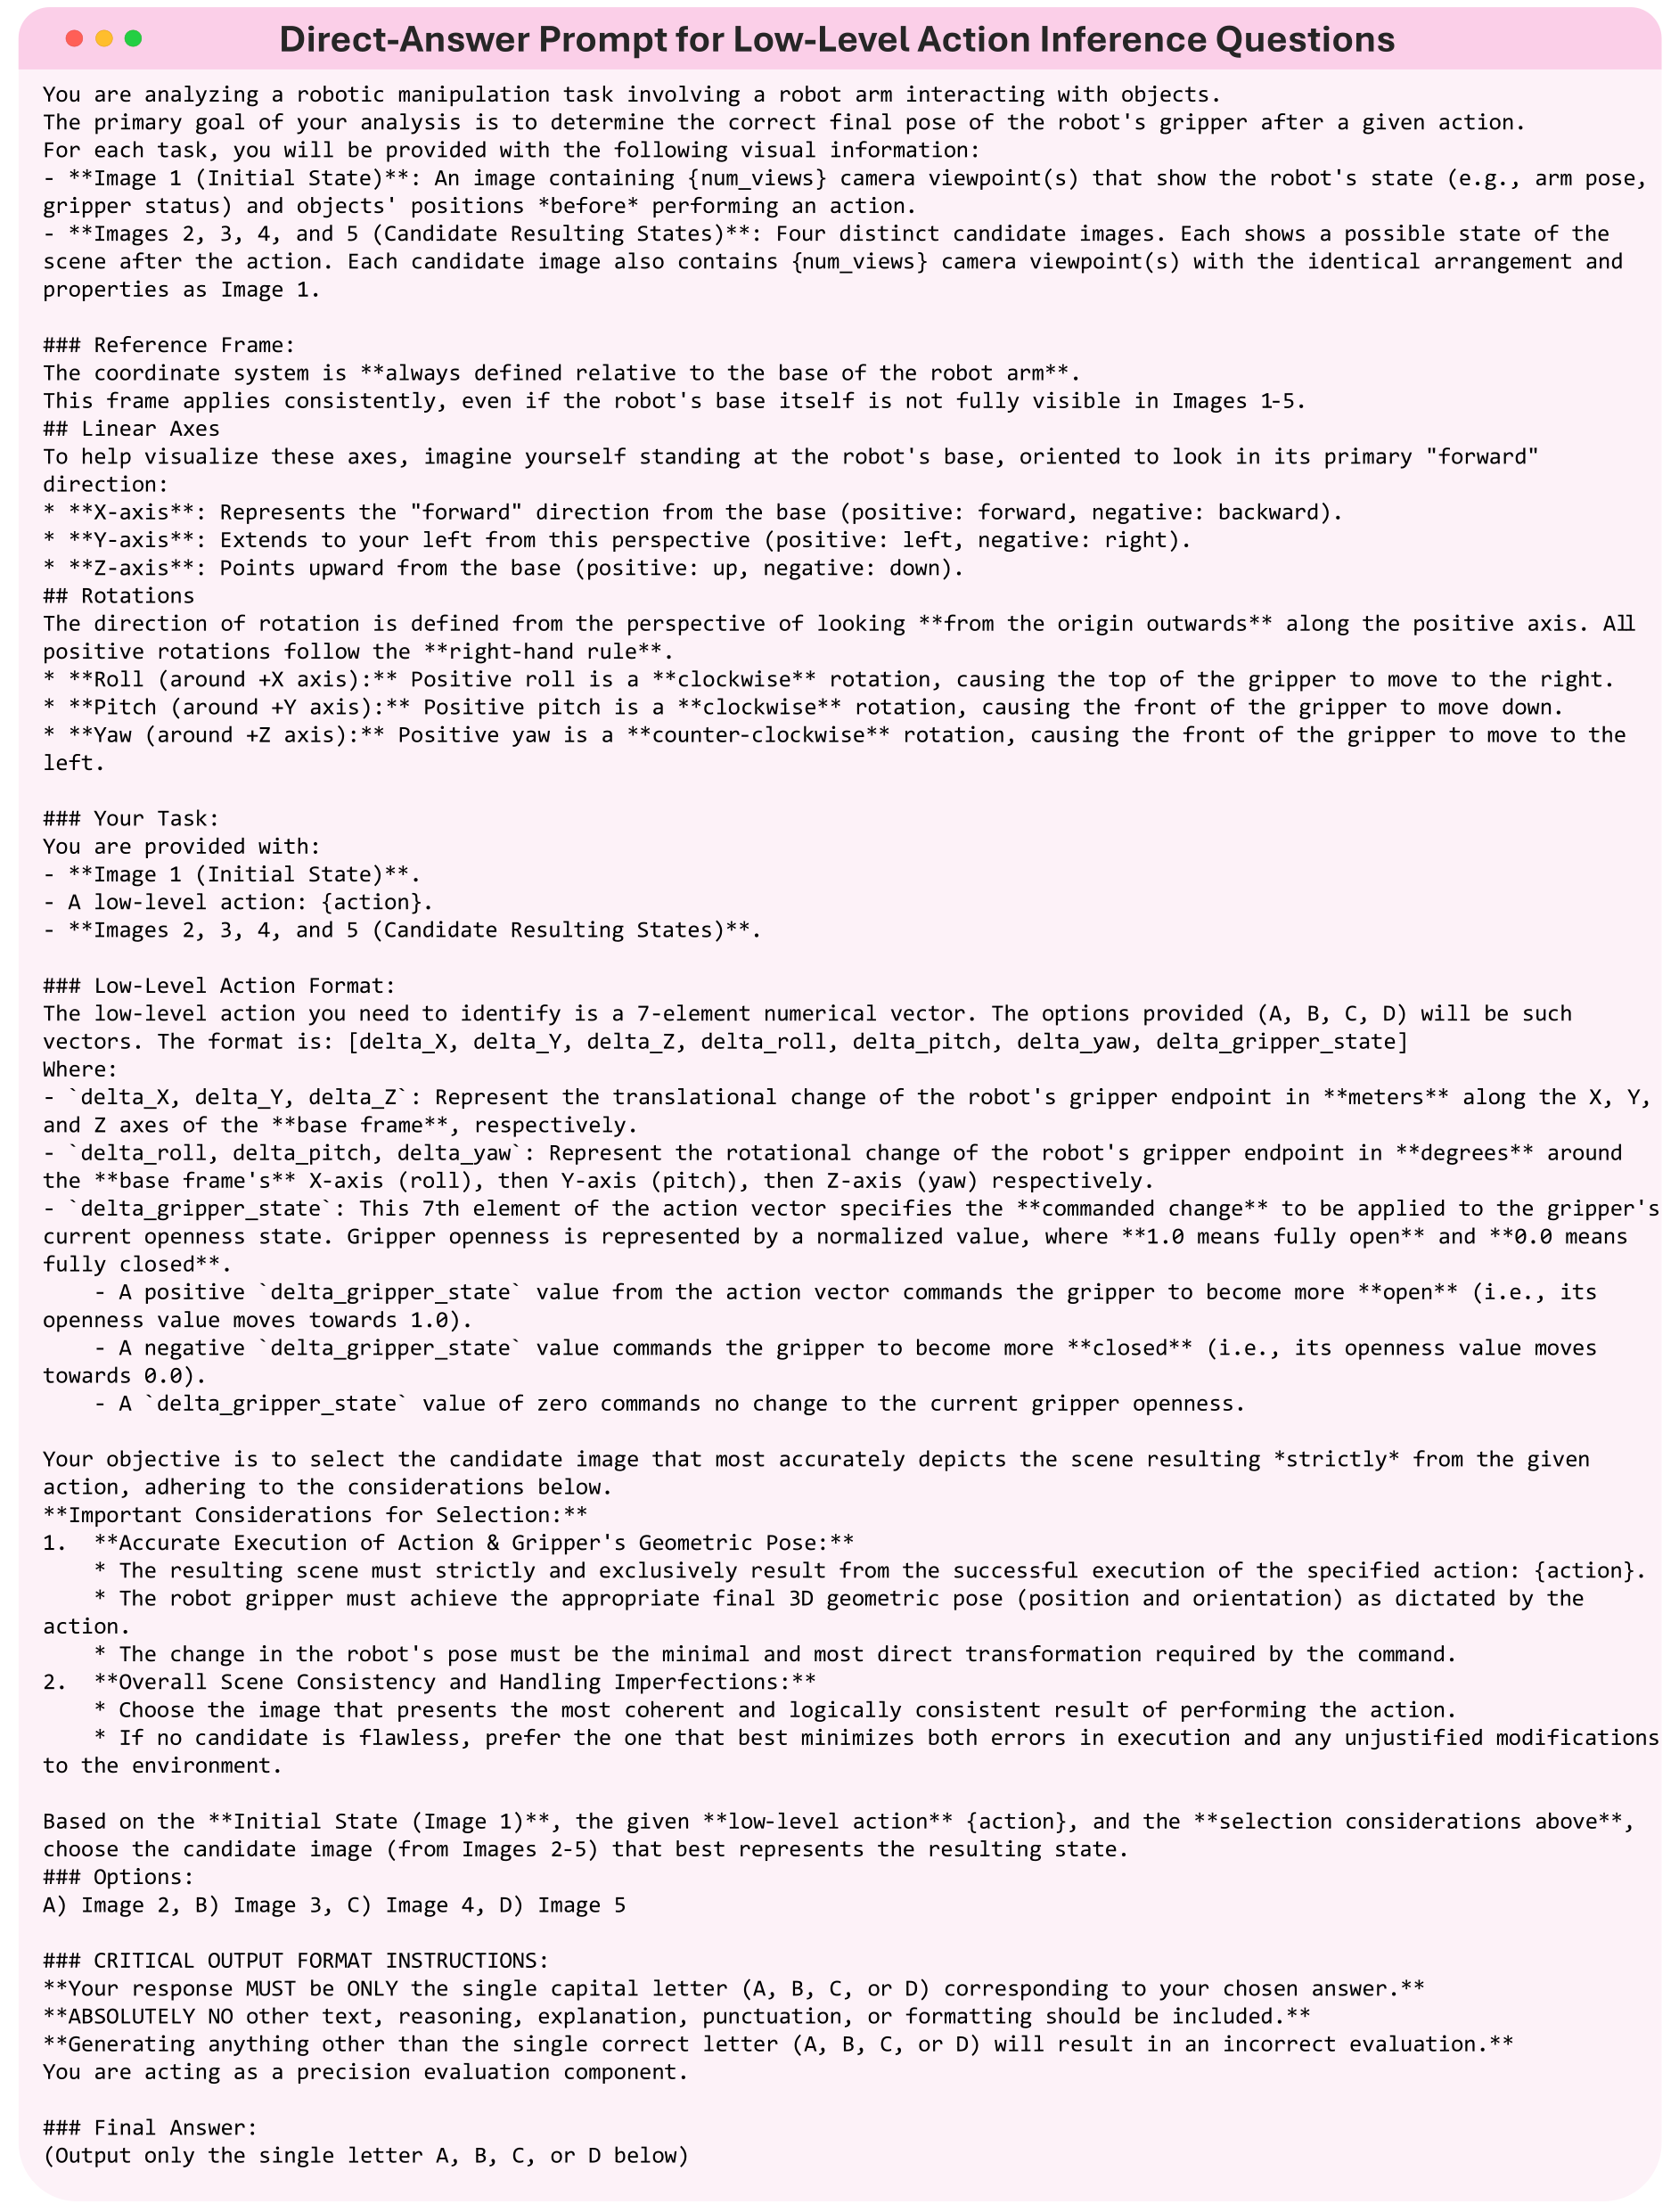
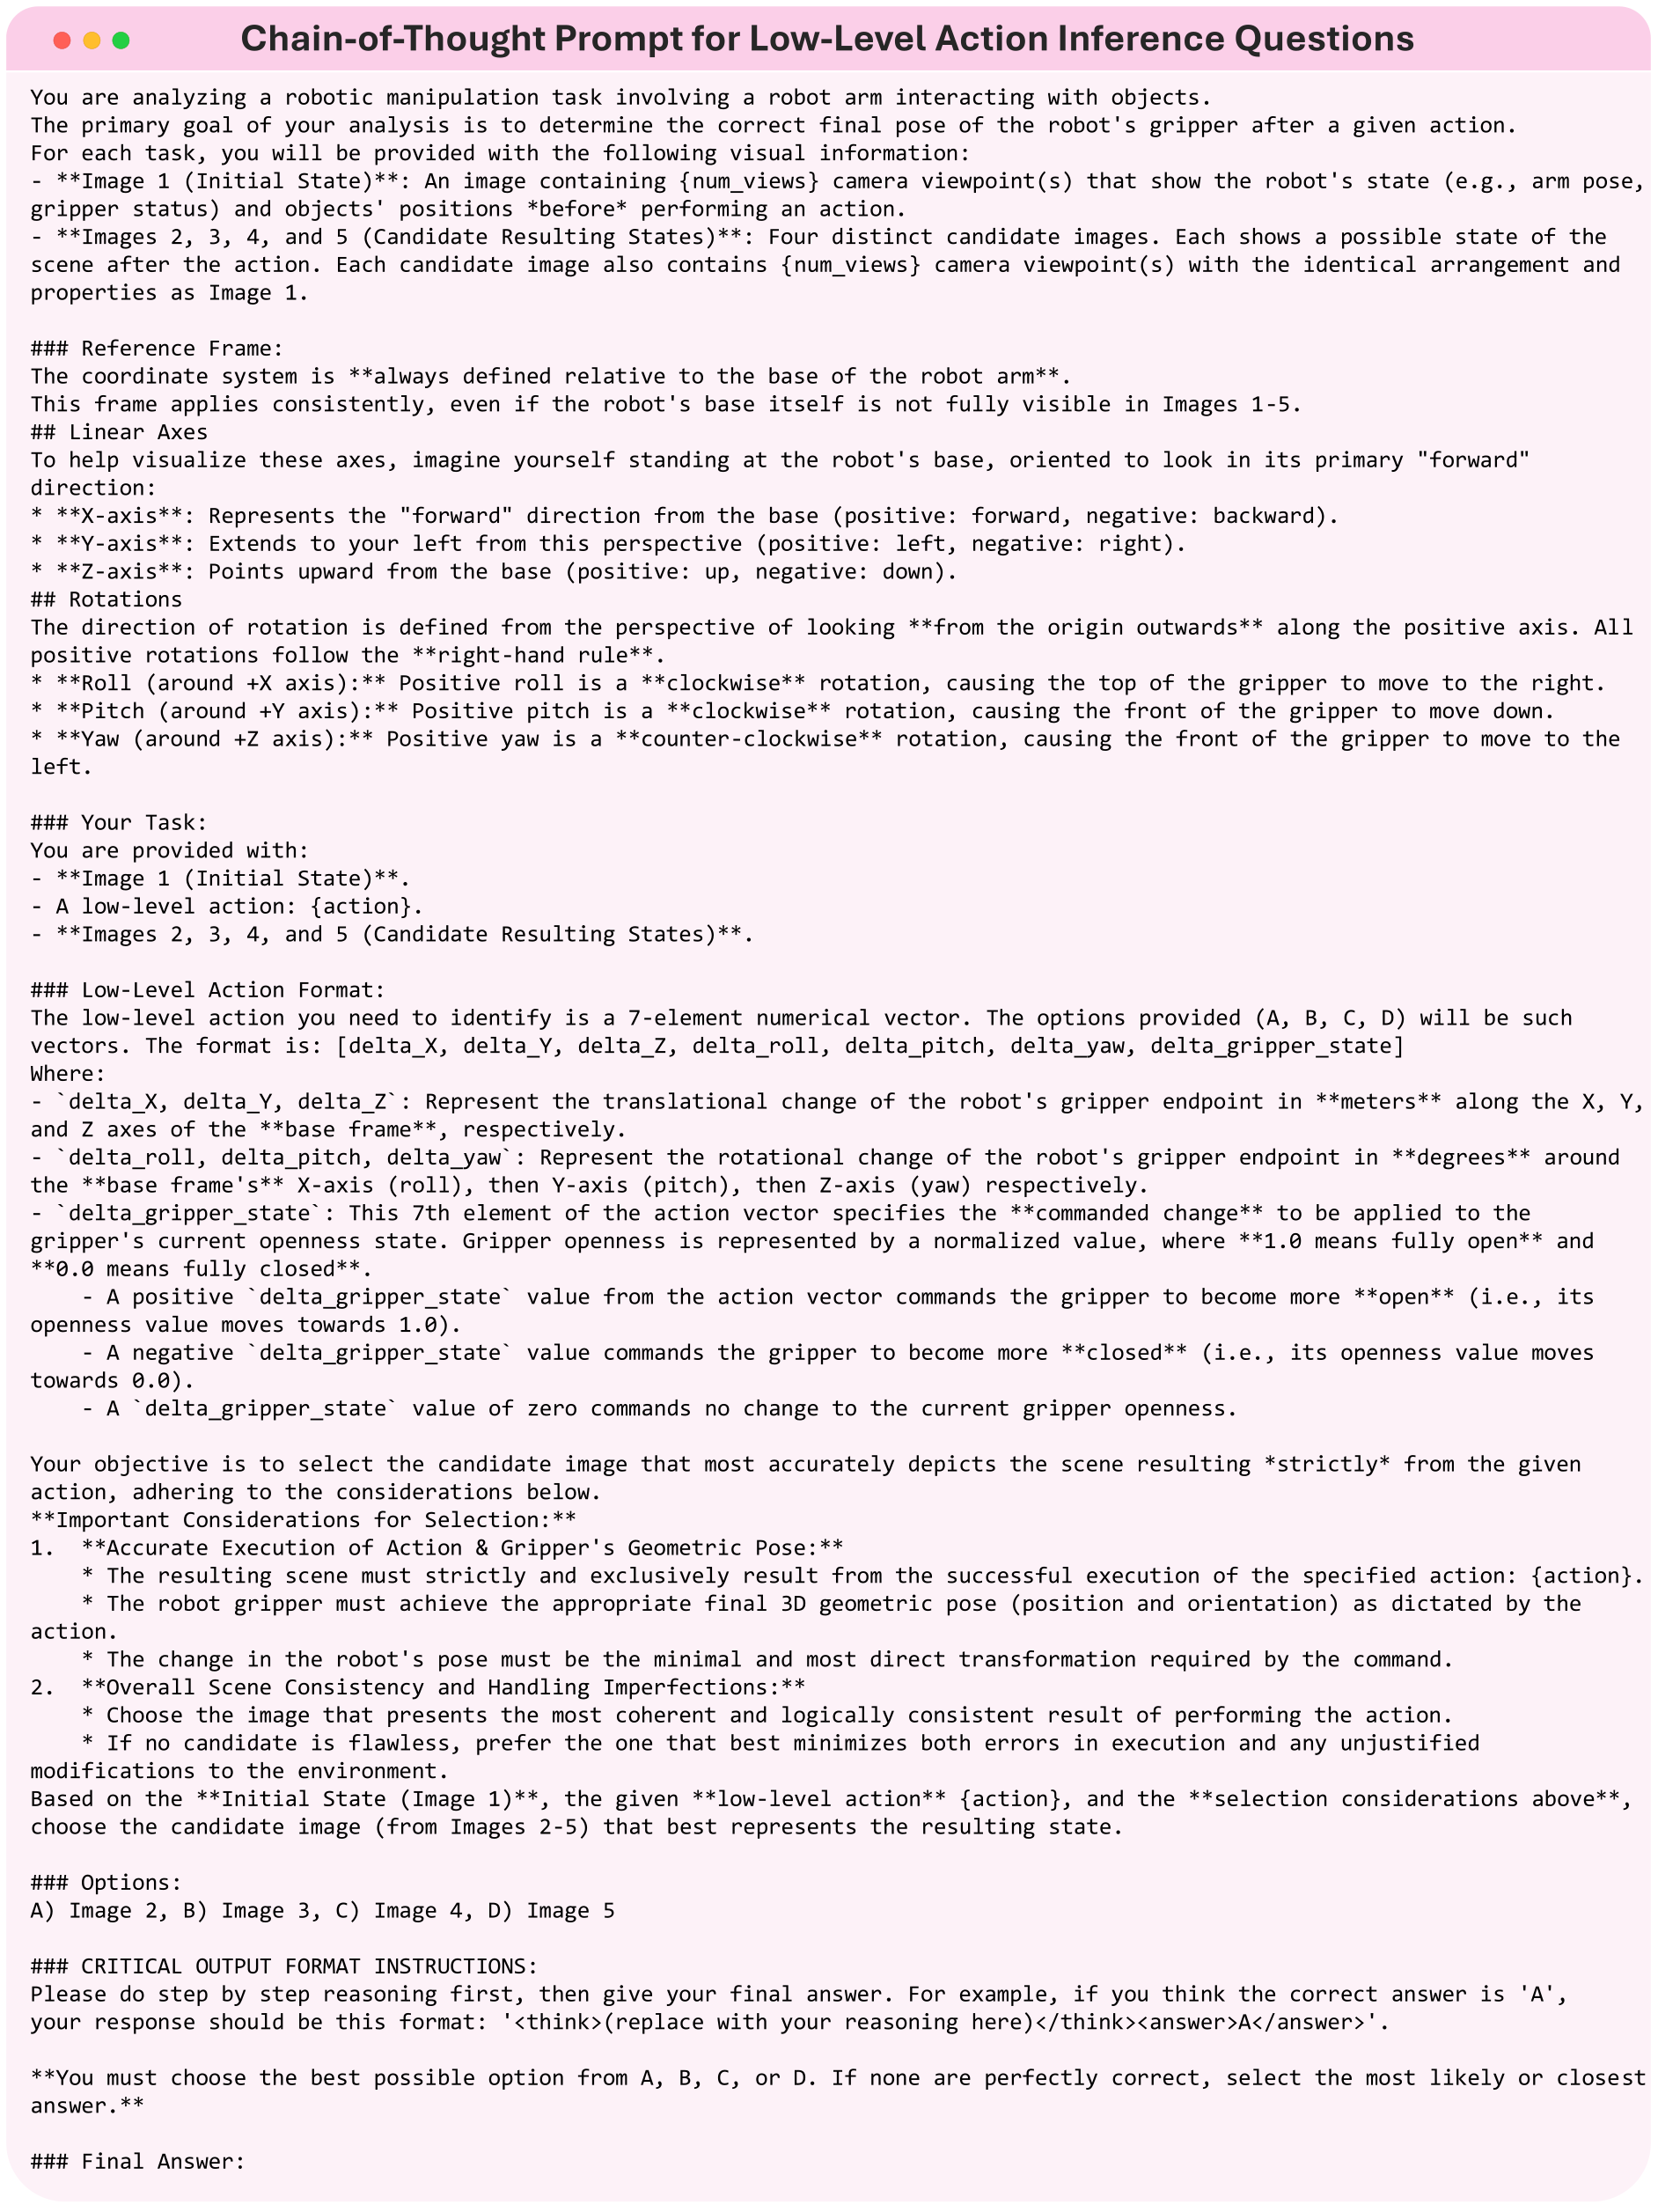
The intended base-frame convention is X forward, Y left and Z upward. Figure 9 preserves the original robot illustration. Its caption says the positive X-axis points “State Prediction,” an apparent wording error; the prompts explicitly say forward.
The low-level prompts also combine an outward-looking convention with clockwise roll/pitch and counterclockwise yaw. Those exact descriptions are preserved and should be checked against the dataset convention when reproducing the evaluation.
B.1 Dataset selection
The source collections differ in robot, scene, vocabulary and camera geometry. The benchmark samples selected transitions from them; the size of the original collections should not be confused with ActionEQA’s 2,629 reported episodes.
B.1.1 BridgeData V2
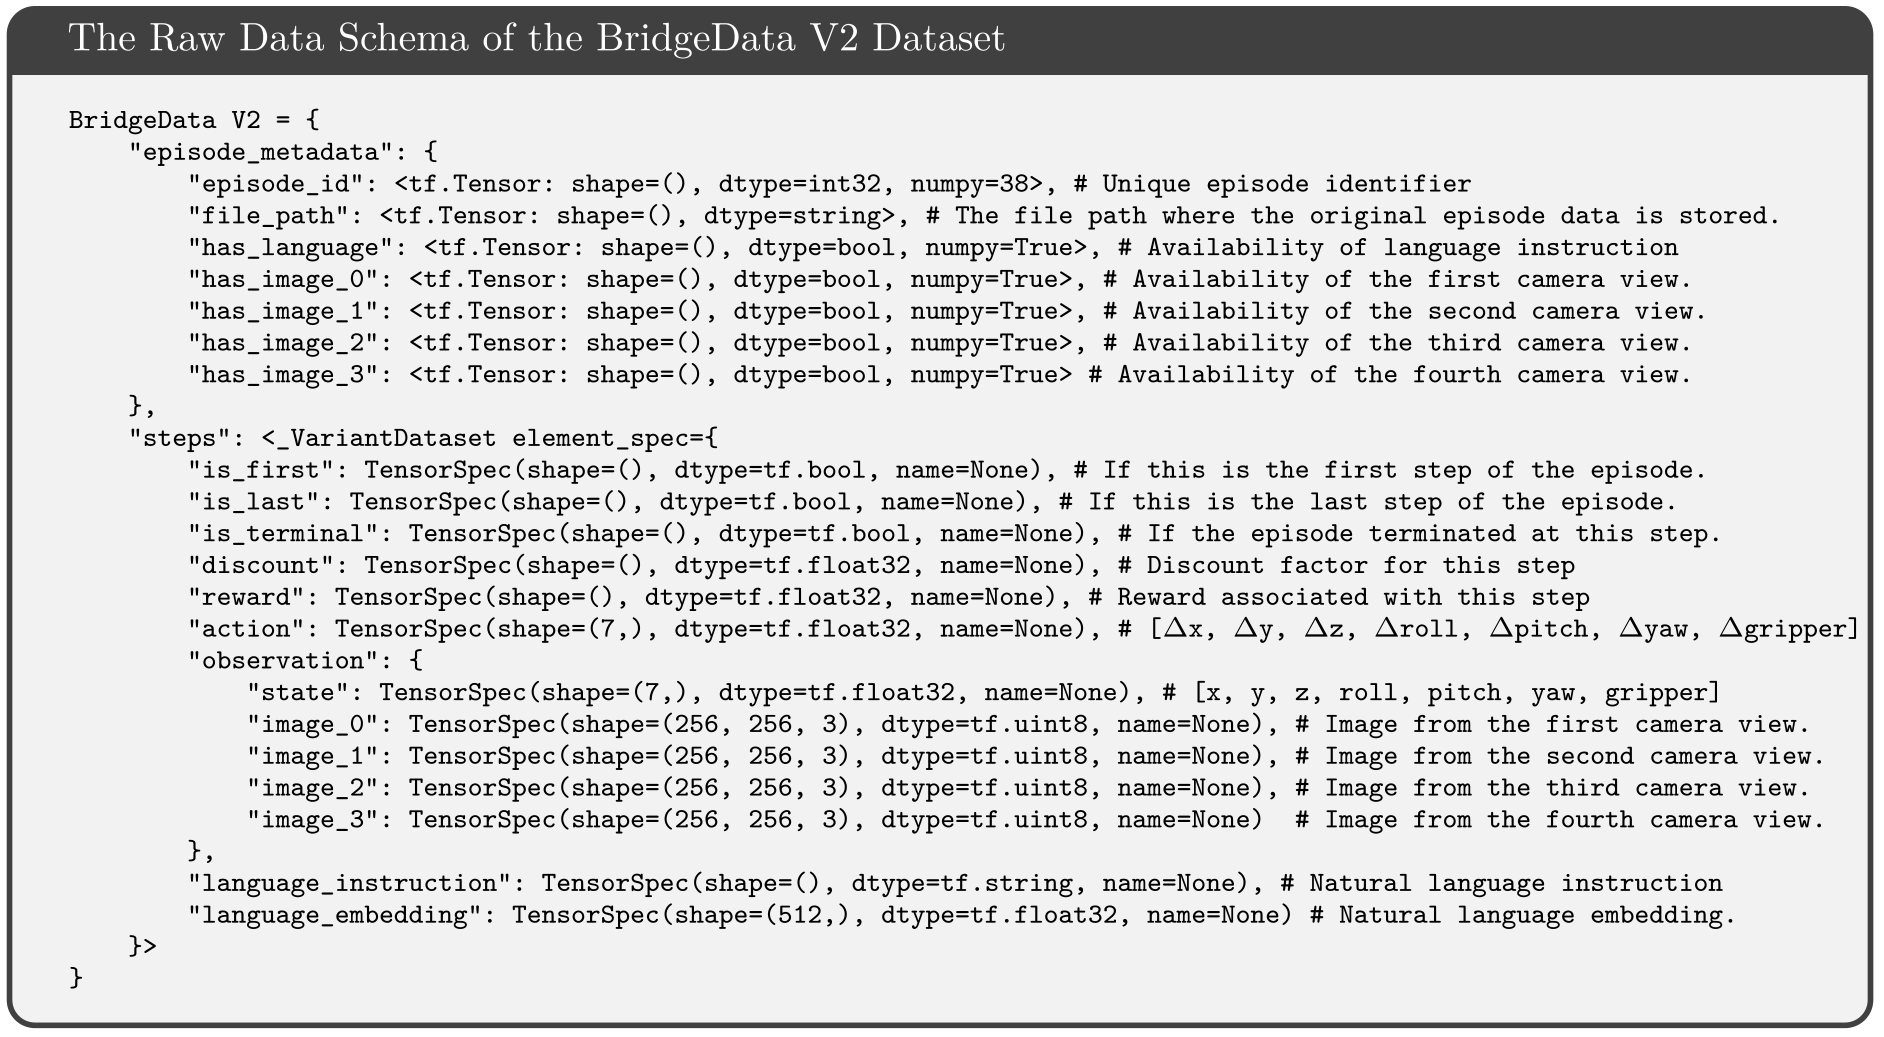
BridgeData V2 supplies WidowX manipulation with language instructions and up to four external views [64]. Its seven-state representation contains Cartesian pose and gripper aperture; state differences supply the numerical action representation. The complete original episode schema is retained.
B.1.2 DROID
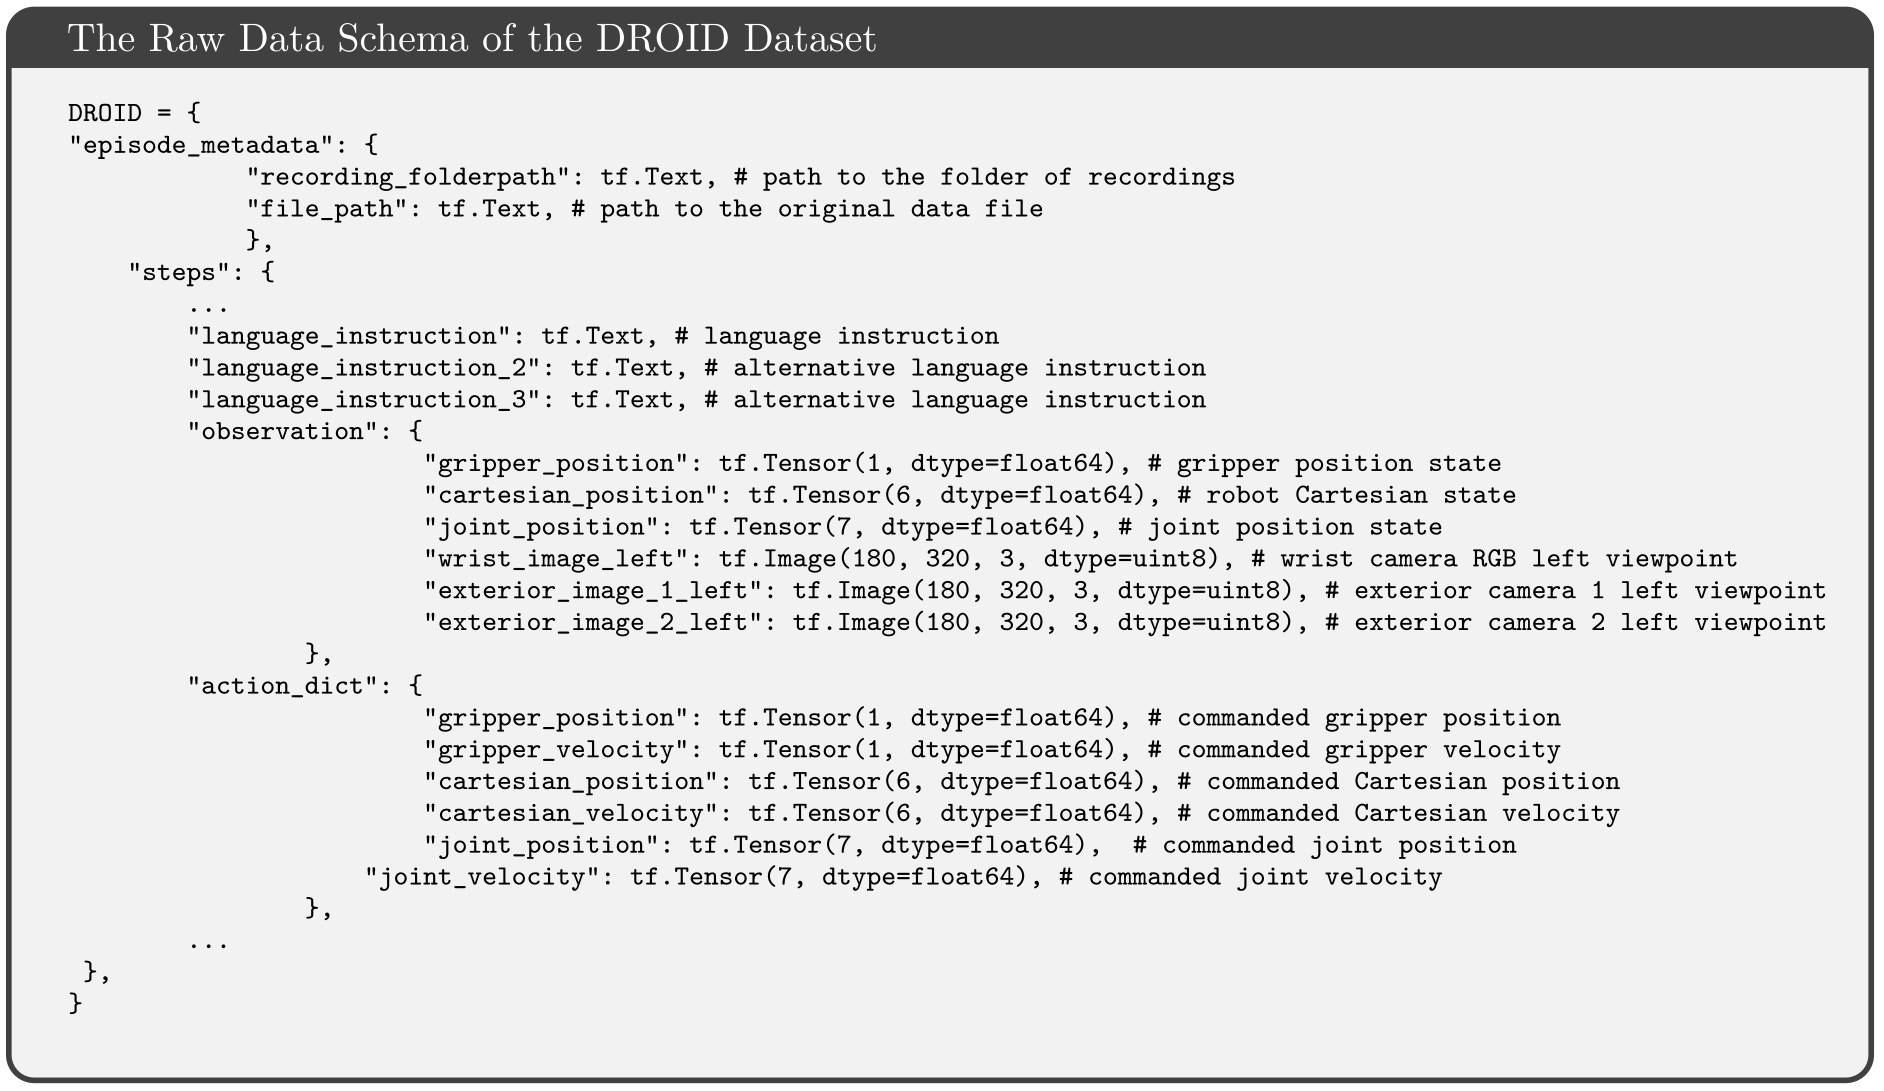
DROID supplies diverse Franka Panda demonstrations, wrist imagery and external stereo cameras [37]. Numerical actions subtract the seven end-effector/gripper state components. The exact vector expression and complete logged-data schema are preserved.
State differences over selected image pairs describe an observed transition. They are not necessarily a single low-level command from the original controller.
Equation

B.1.3 RT-1
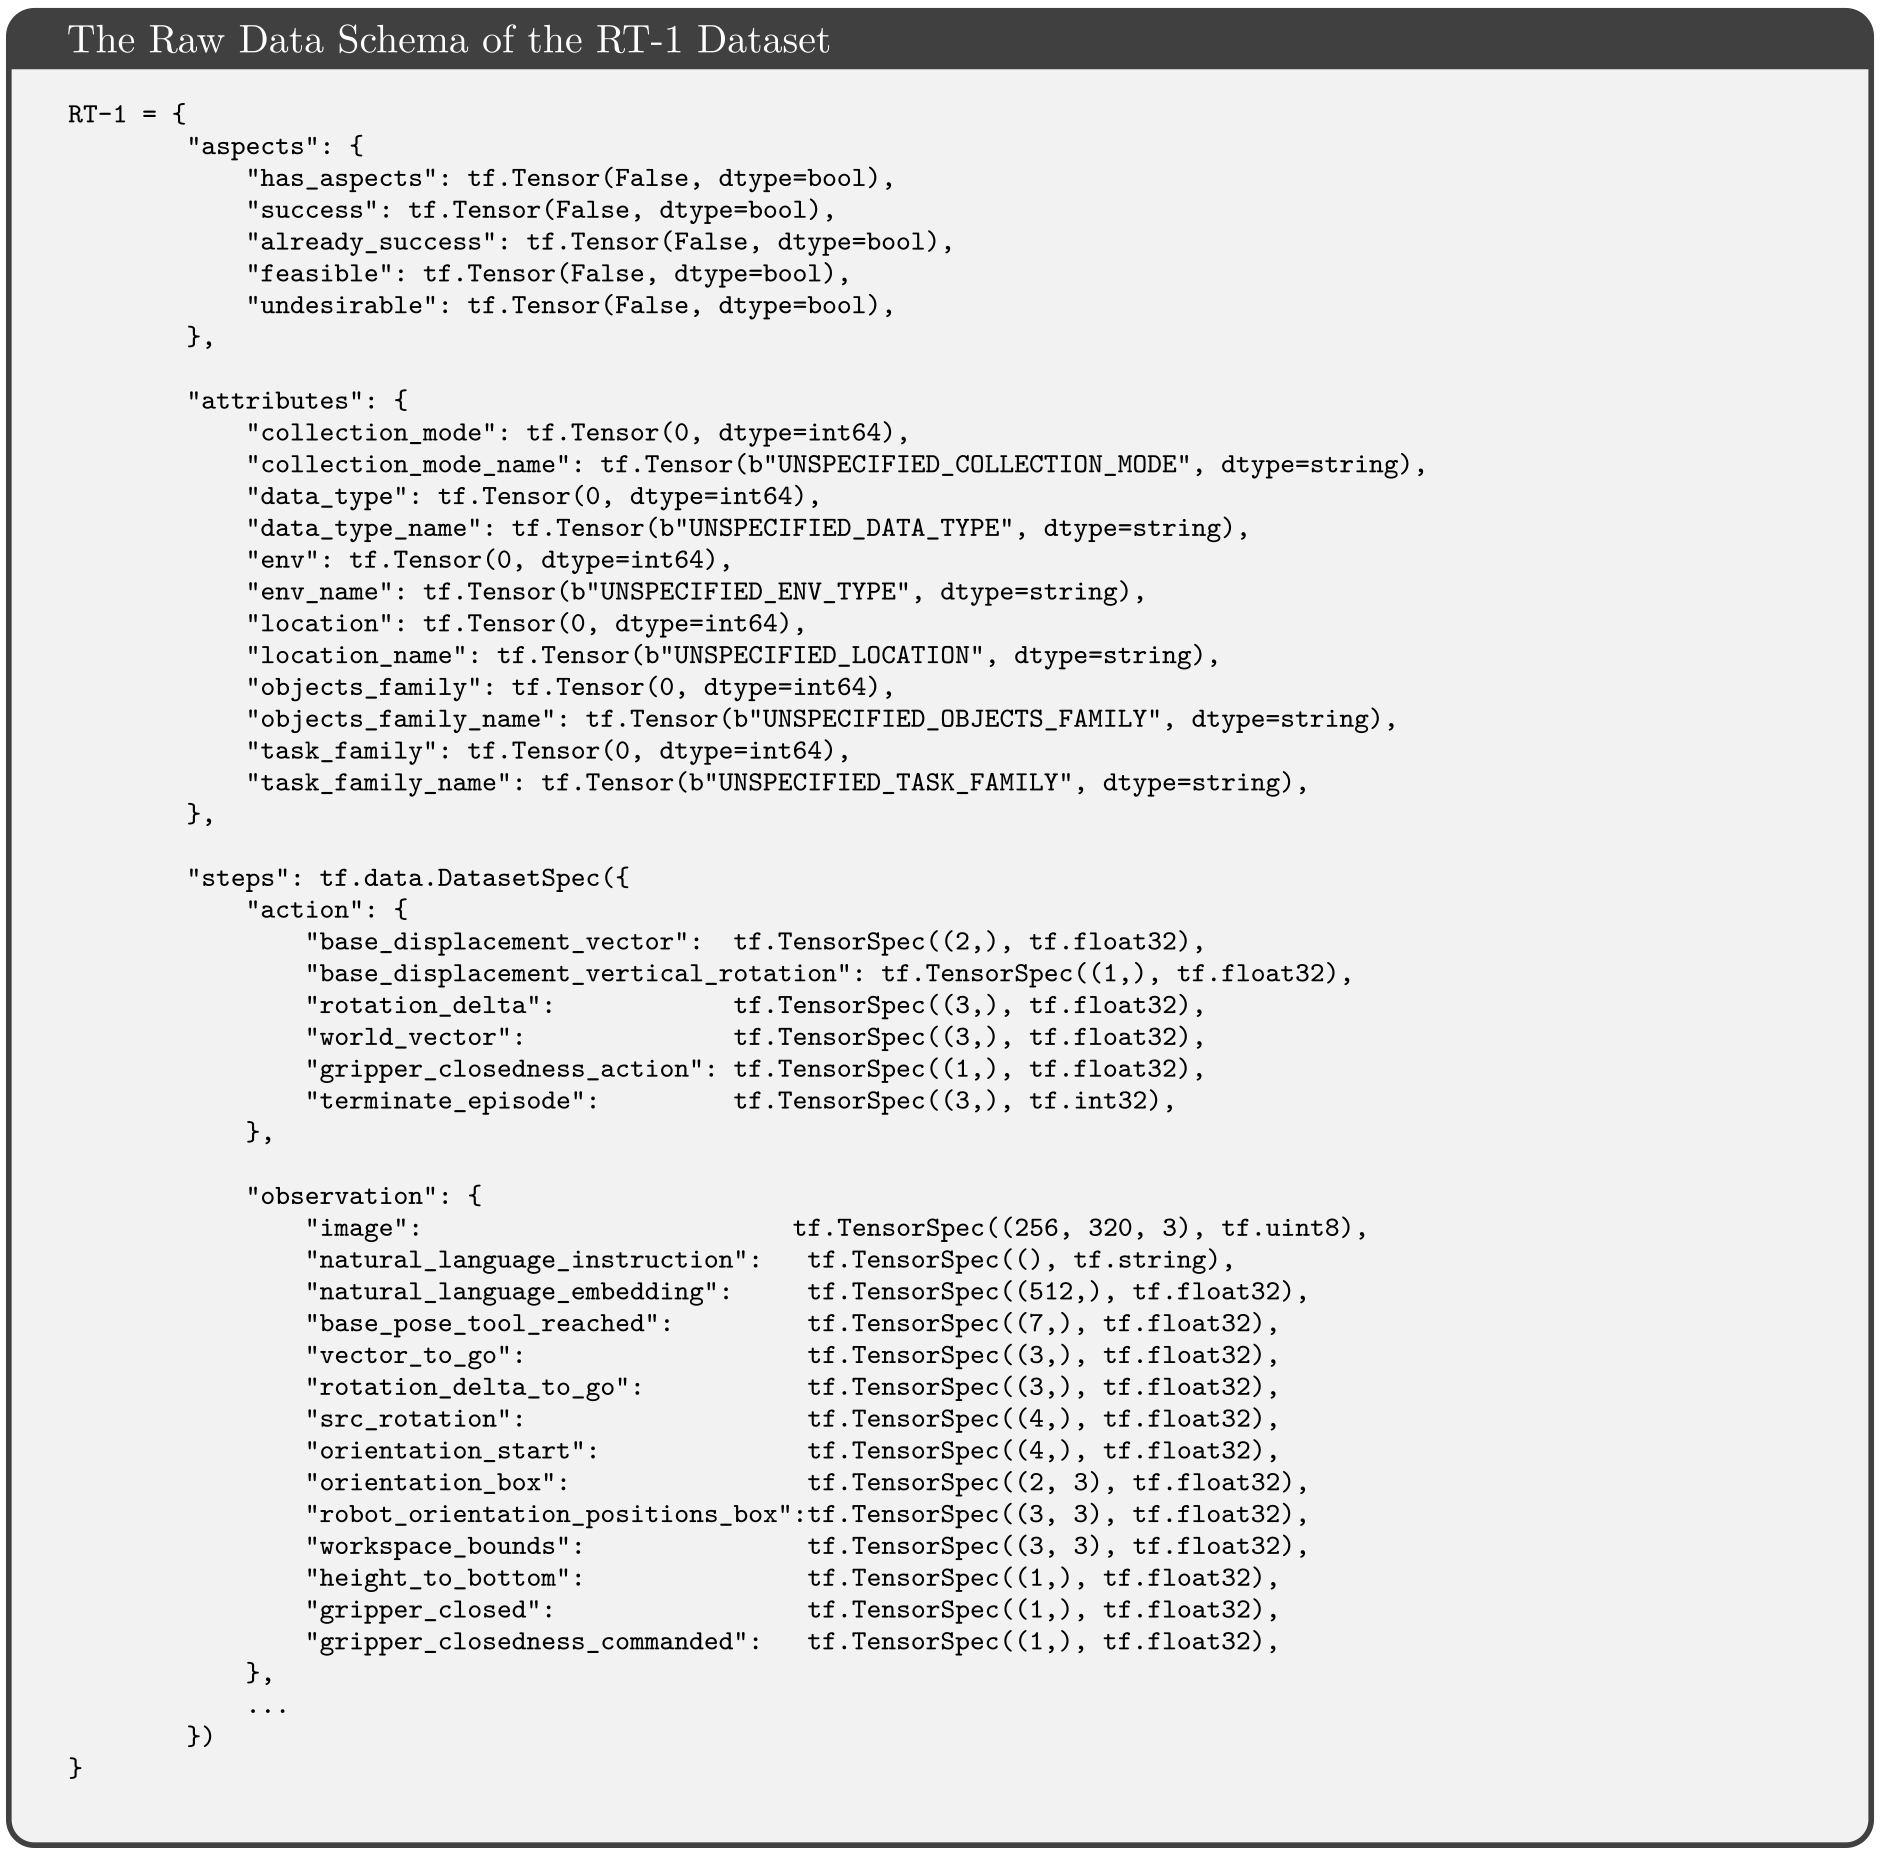
RT-1 contributes varied kitchen-manipulation goals [11]. Because its mobile base and arm can move together, ActionEQA uses it only for high-level prediction/inference. The complete original data schema, including base-motion fields, remains below.
B.2 Frame-pair selection
Selection removes blur, poor lighting, occluded end effectors and trivial motion. At least two of seven action components must exceed dataset-specific thresholds: BridgeData V2 uses 0.10 m per translation axis, 18° per rotation axis and 0.2 gripper change; DROID raises translation to 0.18 m.
This favors large, compound and visible movements. It therefore does not measure ordinary micro-adjustments or the full distribution of control steps. The paper describes selected key-frame pairs while also using consecutive-timestep notation.
B.3 Action extraction
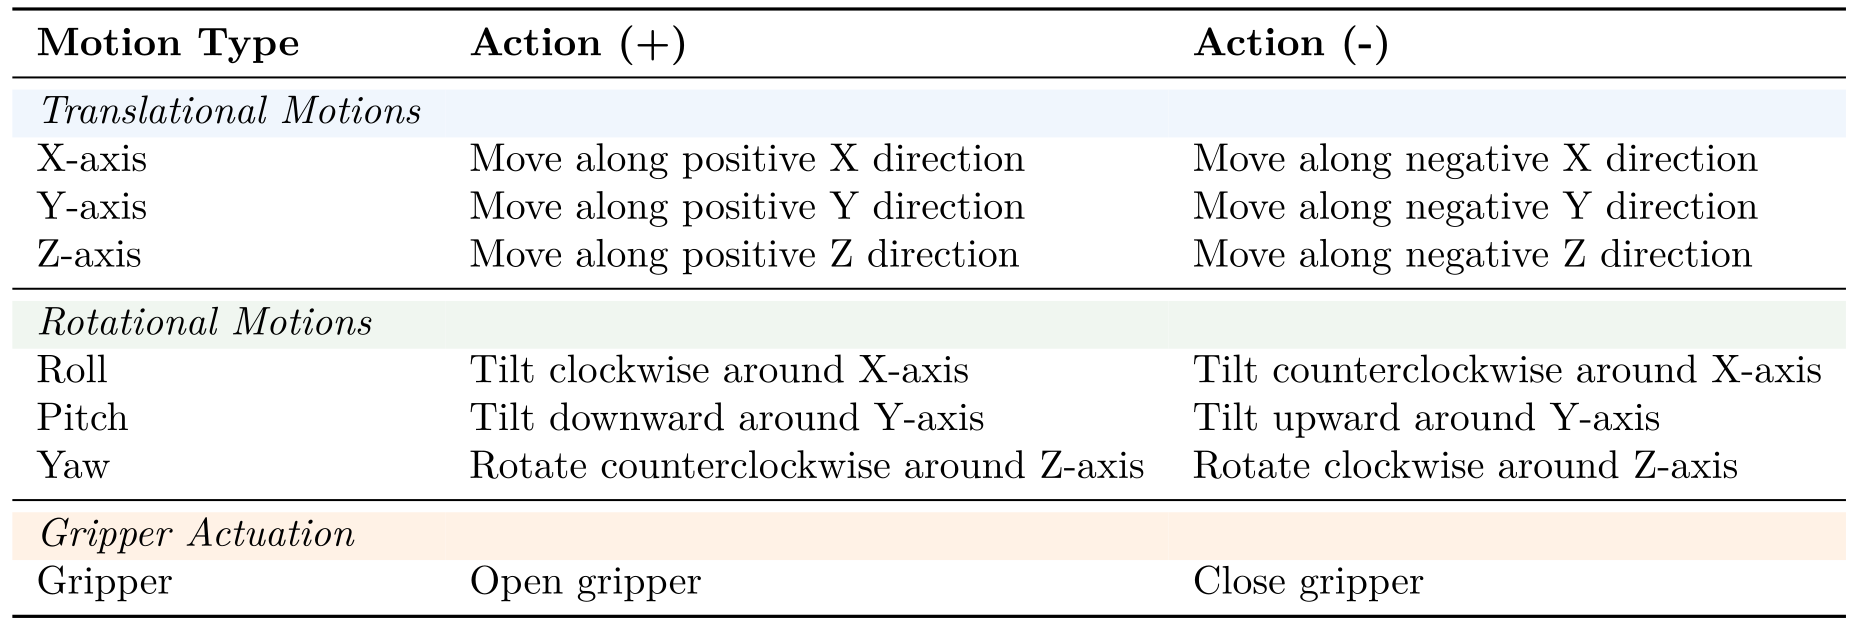
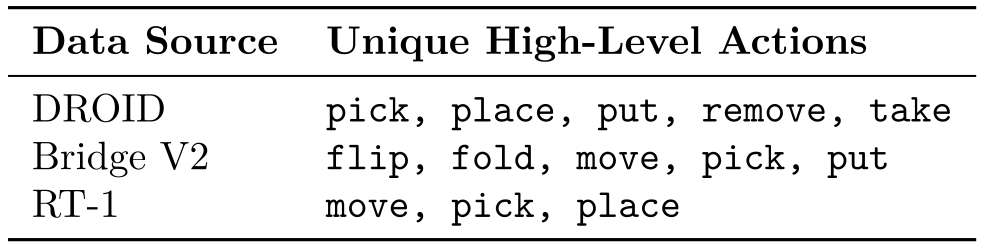
High-level labels inherit episode instructions. The fourteen mid-level labels form opposing pairs for X/Y/Z translation, roll/pitch/yaw and gripper opening/closing. Table 6 preserves their exact sign conventions and Table 7 the listed verbs by source.
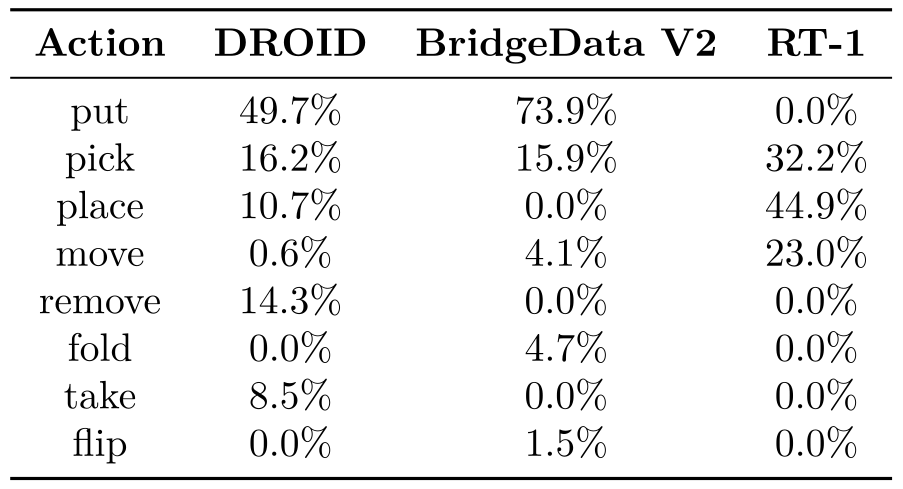
Table 7 omits DROID “move,” although Table 11 later assigns it 0.6%. The full source tables are retained instead of silently reconciling their vocabularies.
B.4 Distractor generation
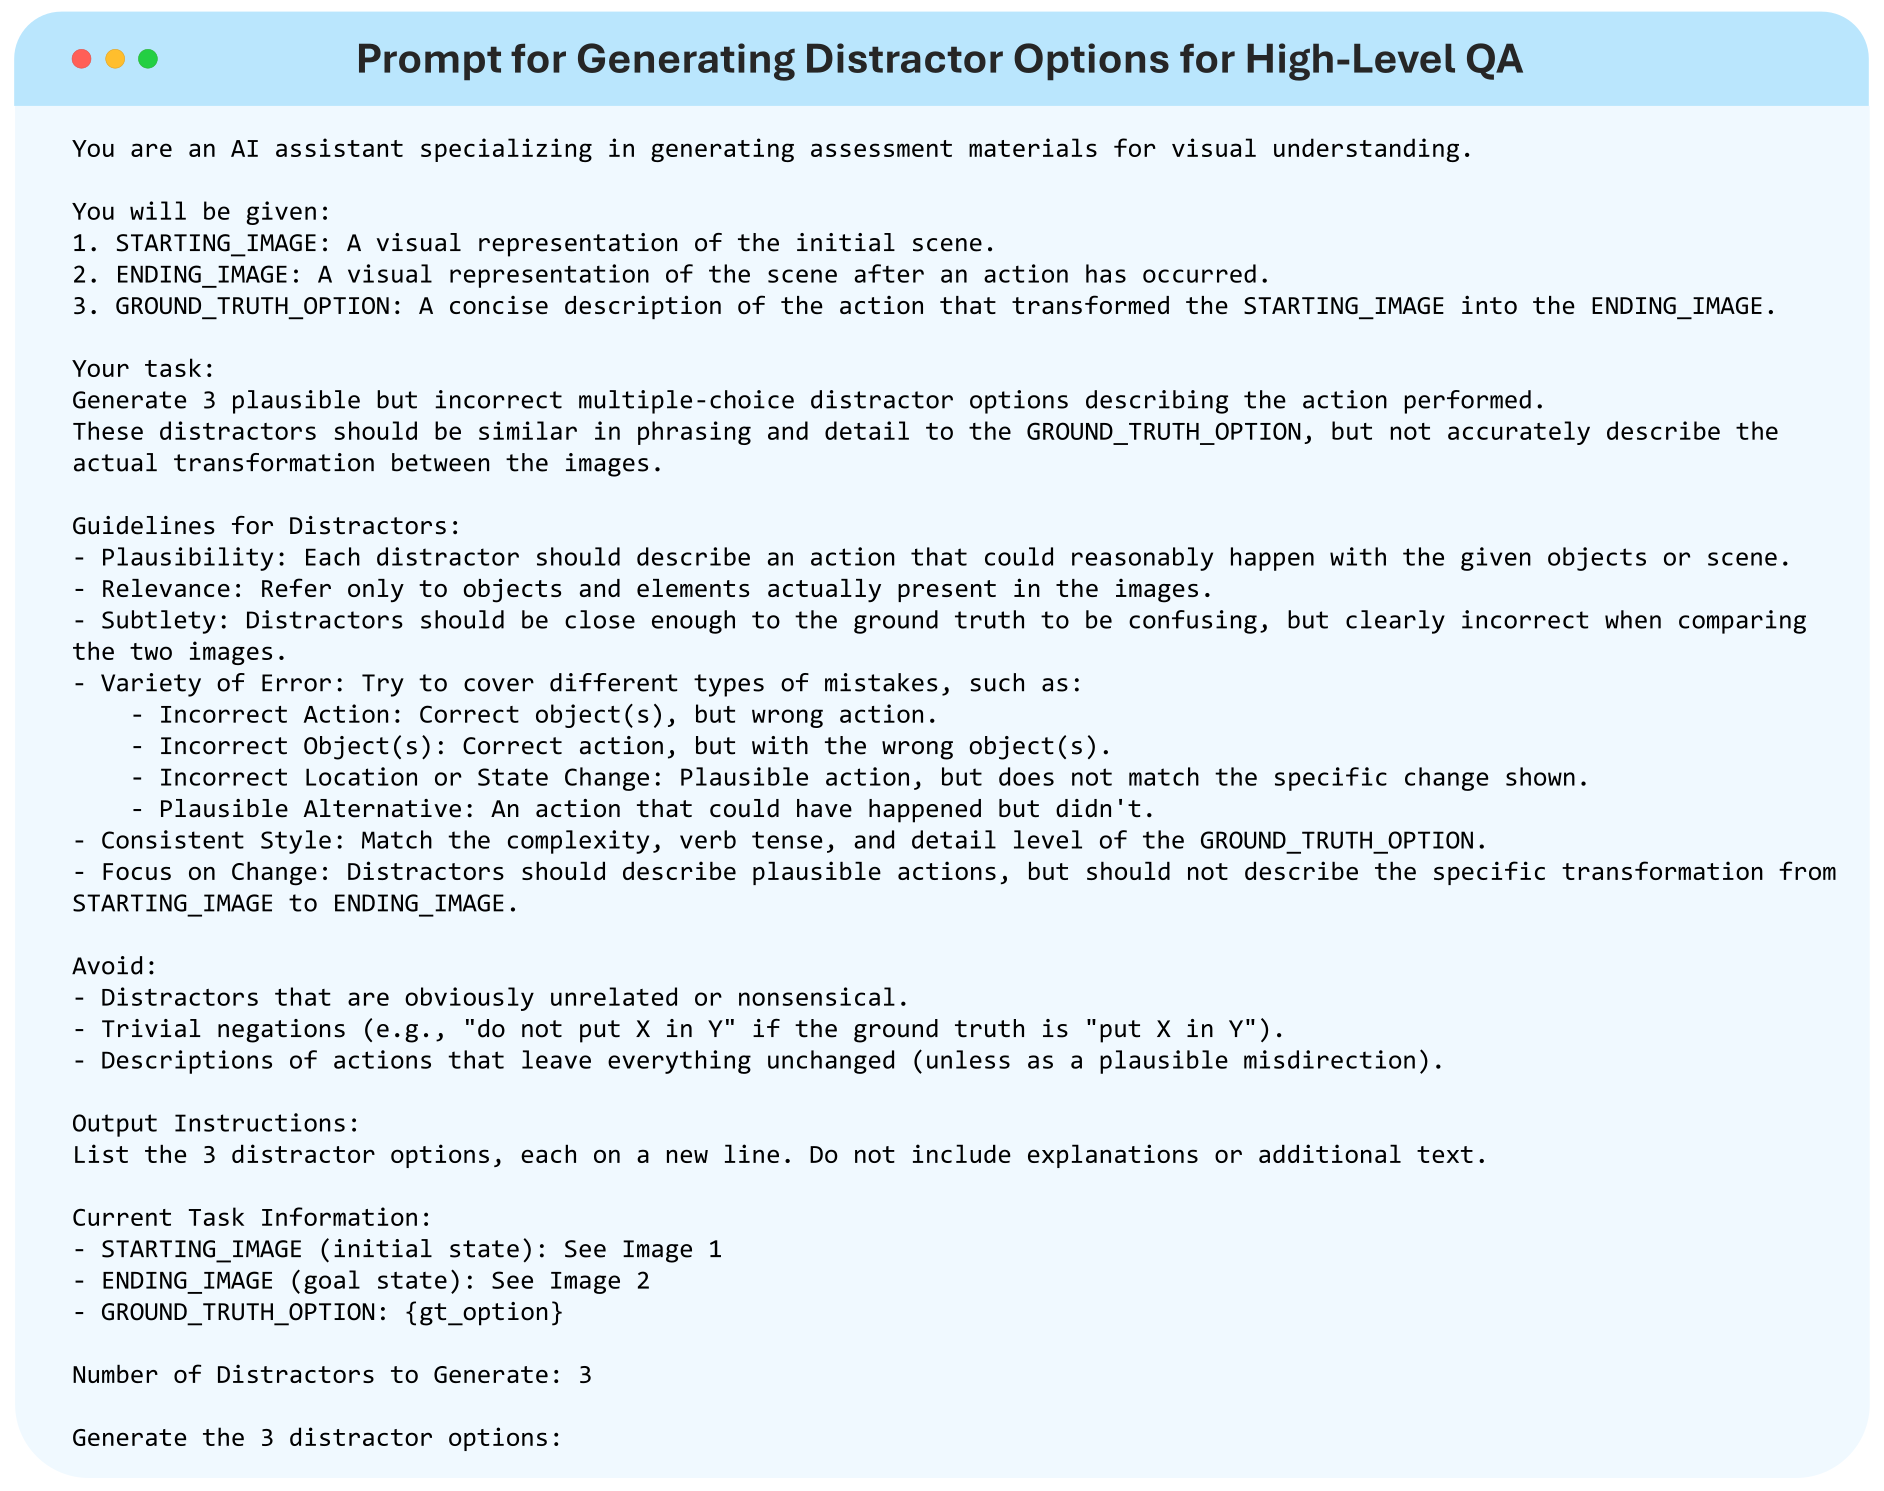
QVQ receives both frames and the correct high-level label, then proposes three stylistically similar alternatives involving wrong objects, actions, locations or outcomes. Human review checks that alternatives remain plausible but incorrect.
Mid-level distractors draw alternate combinations of relevant components. Low-level distractors flip signs, remove dominant components or permute axes. The paper gives more detail for action-option generation than for the provenance of every candidate resulting-state image.
B.5 Question generation and verification
Final review checks standardized format, task labels, correctness and ambiguity for every question. The additional sampled calibration study quantifies annotator judgments, but does not make the full benchmark demonstrably free of all ambiguity or shortcuts.
B.6 Dataset statistics
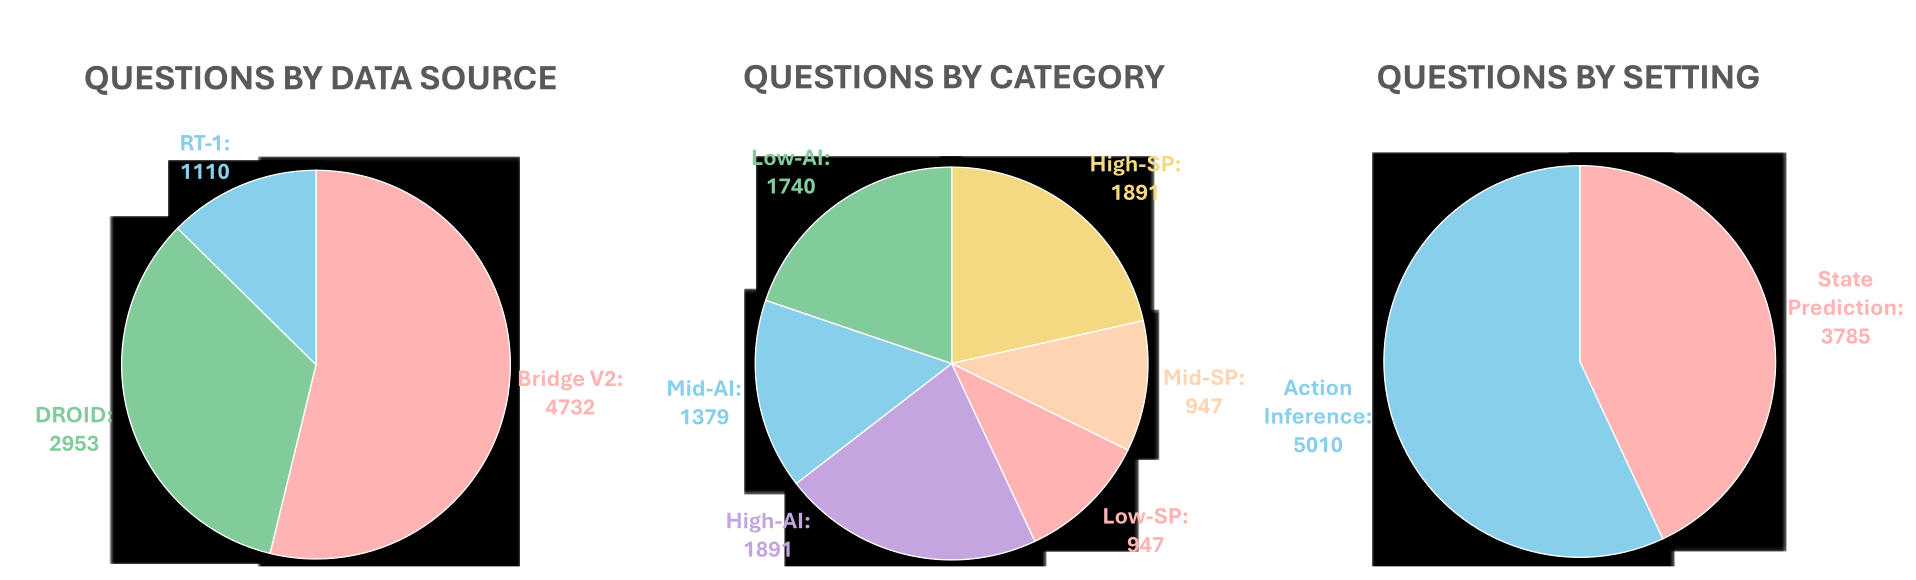
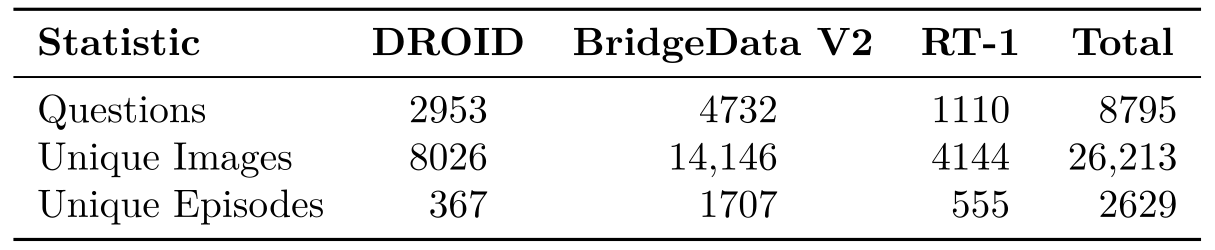
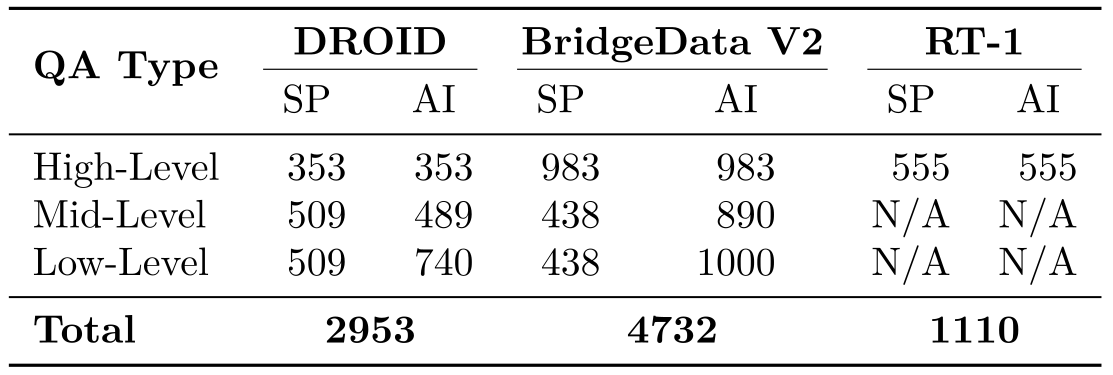
The reported distribution is 4,732 BridgeData V2, 2,953 DROID and 1,110 RT-1 questions. There are 3,785 prediction and 5,010 inference questions. High-level tasks have 1,891 questions per direction; mid/low prediction each have 947, while mid/low inference have 1,379 and 1,740.
Tables 8–9 preserve all counts. Table 8’s image rows total 26,316 whereas the printed total is 26,213; no reconciliation is supplied. Later high-level analyses also use 4,344 combined entries and 2,172 prediction entries, differing from the main counts of 3,782 and 1,891.
B.7.1 High-level action distribution
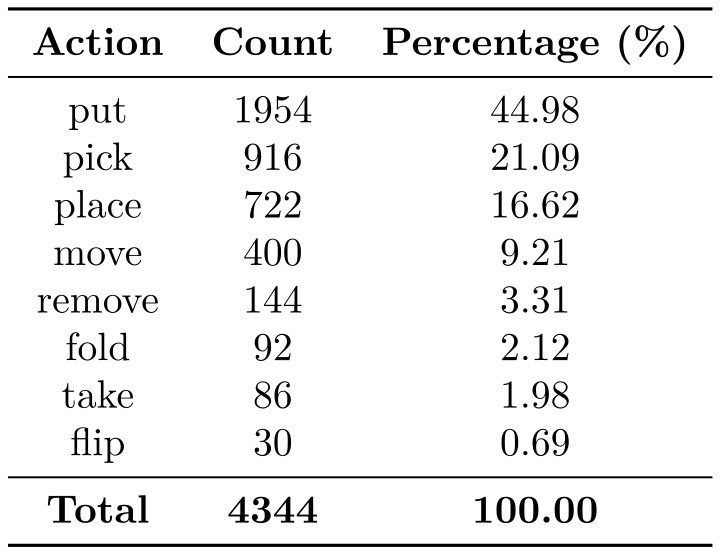
Put, pick and place account for 82.69% of the distribution reported in Table 10. Vocabulary depends strongly on source: BridgeData V2 favors “put,” RT-1 uses “place”/“pick,” and fold/flip occur only in BridgeData V2.
This creates lexical and source imbalances. Table 10’s 4,344-entry denominator is retained but is not explained as the same population as the main high-level question count.
B.7.2 Mid-level action distribution
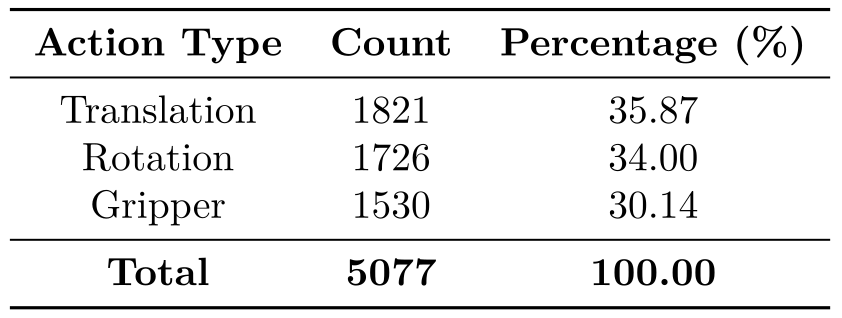
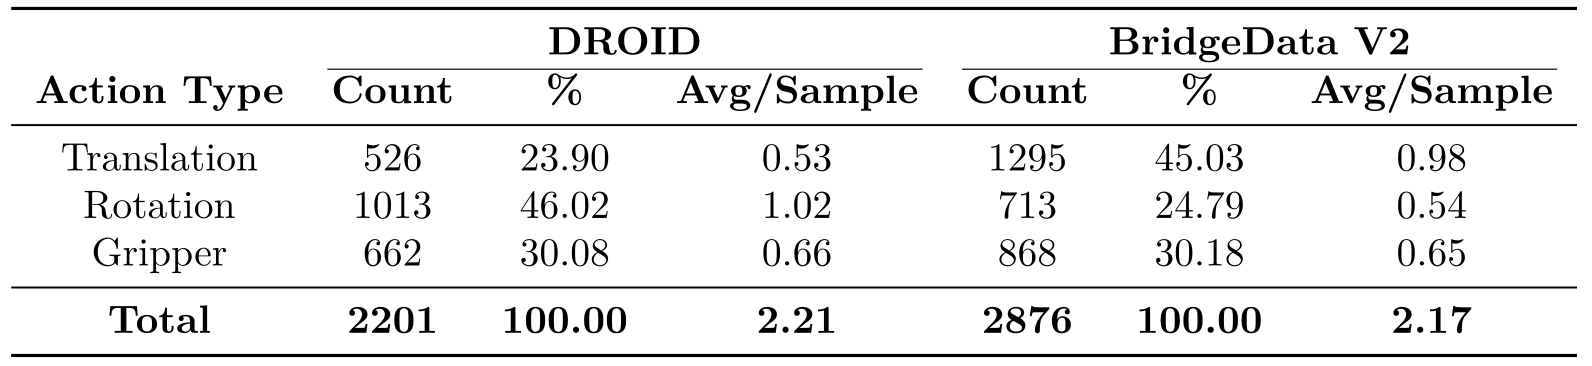
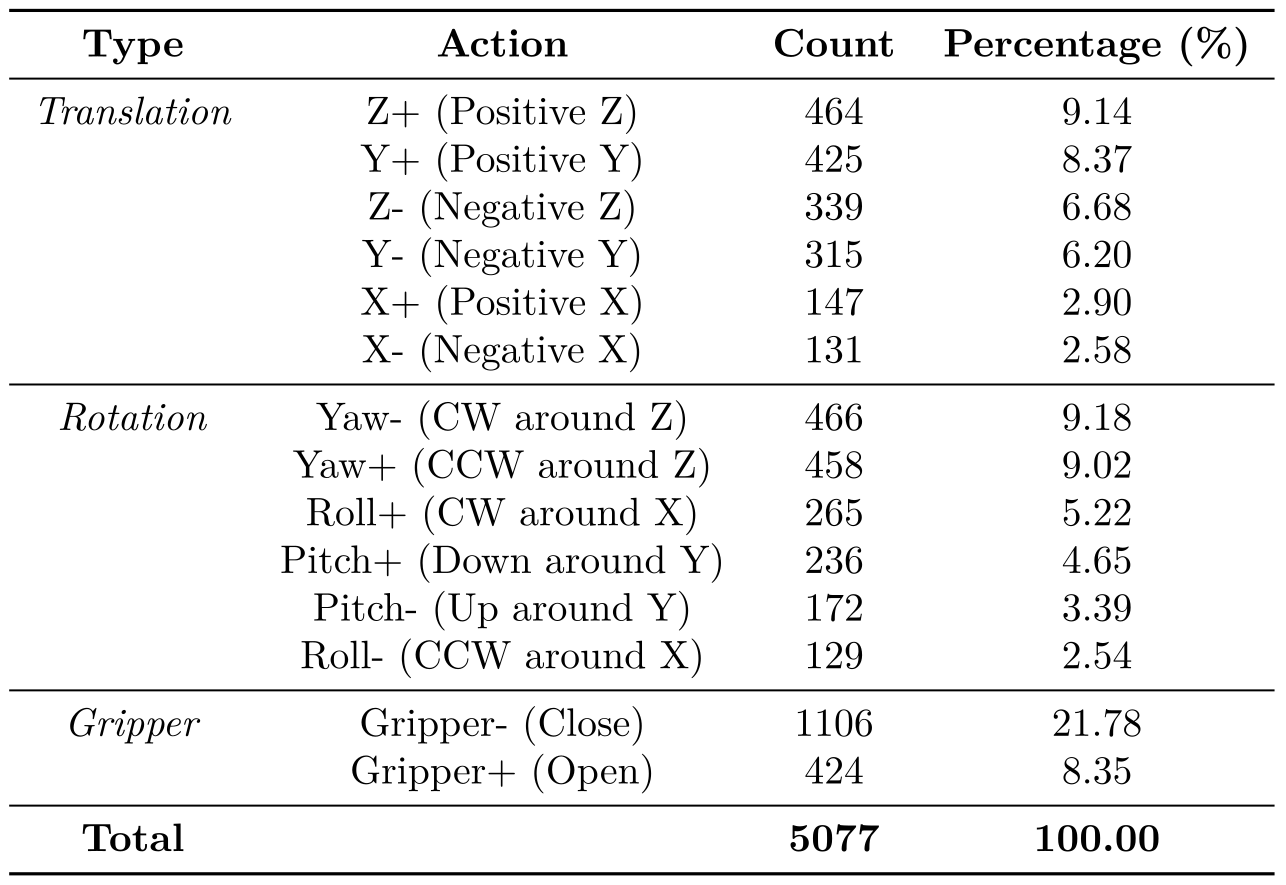
Across 5,077 labeled components, translation, rotation and gripper actuation contribute 35.87%, 34.00% and 30.14%. Questions can contain several components, so these counts are not numbers of independent questions.
DROID is more rotation-heavy and BridgeData V2 more translation-heavy. Closing is more common than opening; Z translation and yaw are prominent. Tables 12–14 retain component counts, source proportions and every signed primitive.
B.7.3 Low-level action magnitudes
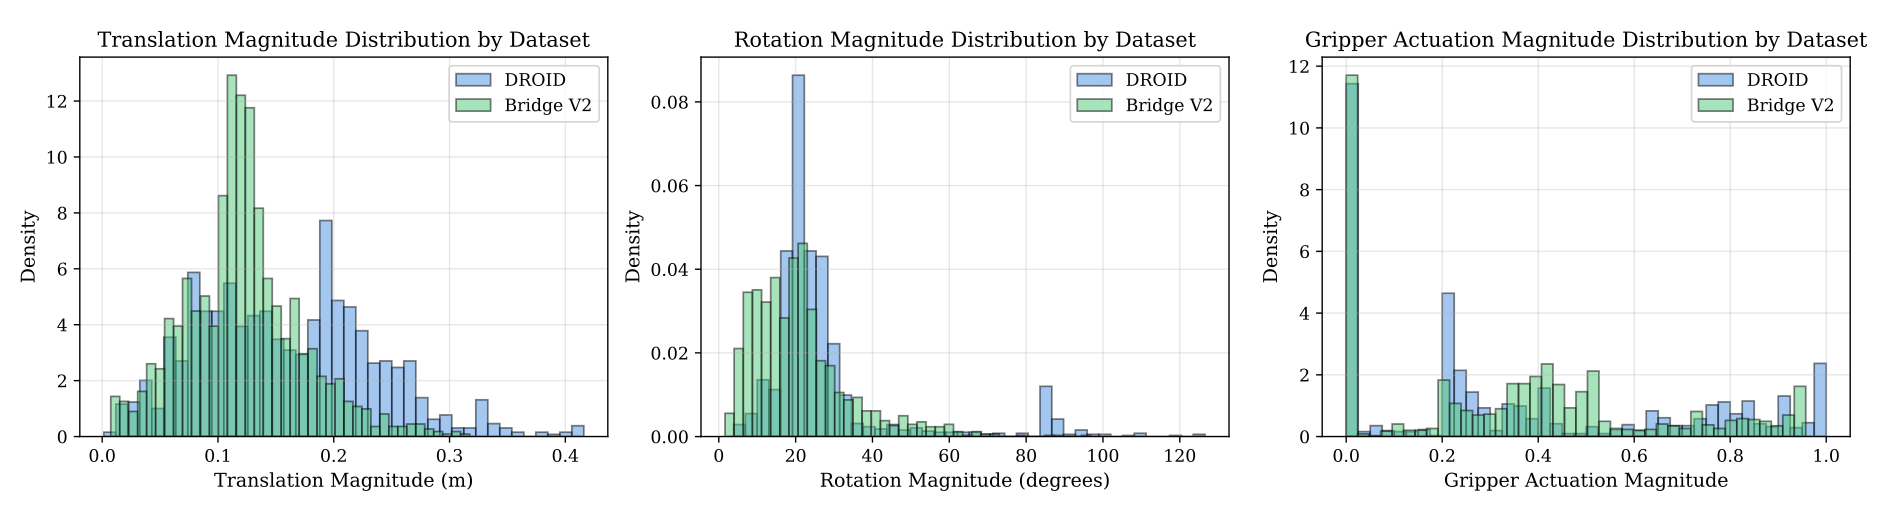
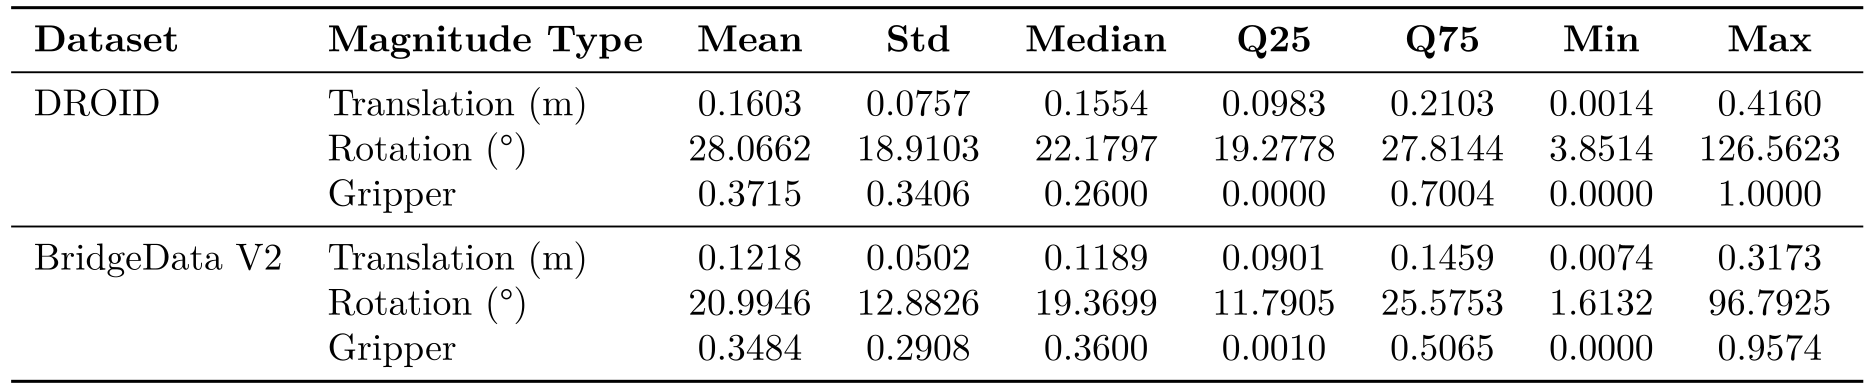
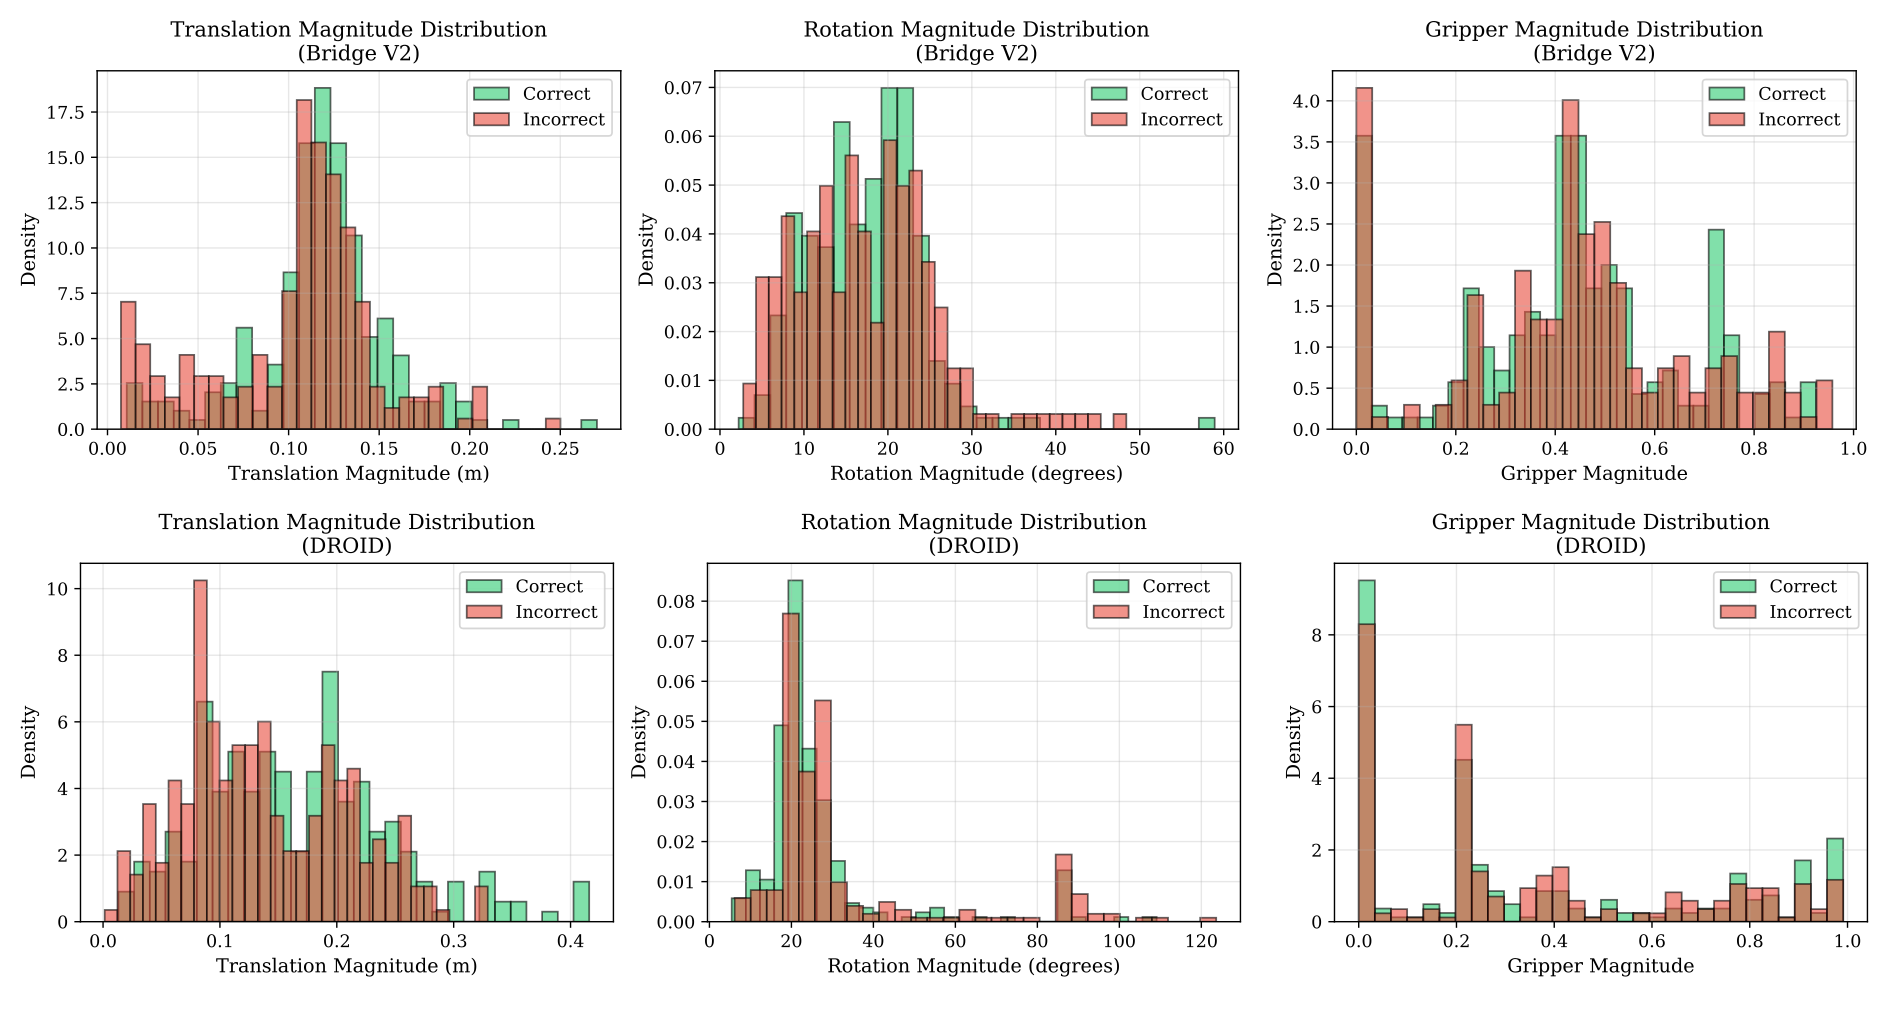
Mean translation magnitude is 0.1603 m for DROID and 0.1218 m for BridgeData V2; mean Euler-difference norm is 28.07° and 20.99°. Tables 15–16 and Figure 13 retain spreads, quantiles and distributions.
These statistics describe selected transitions and a coordinate-based rotation approximation. The Euclidean norm of Euler-angle differences is not a coordinate-invariant rotation angle.

B.8 Answer positions
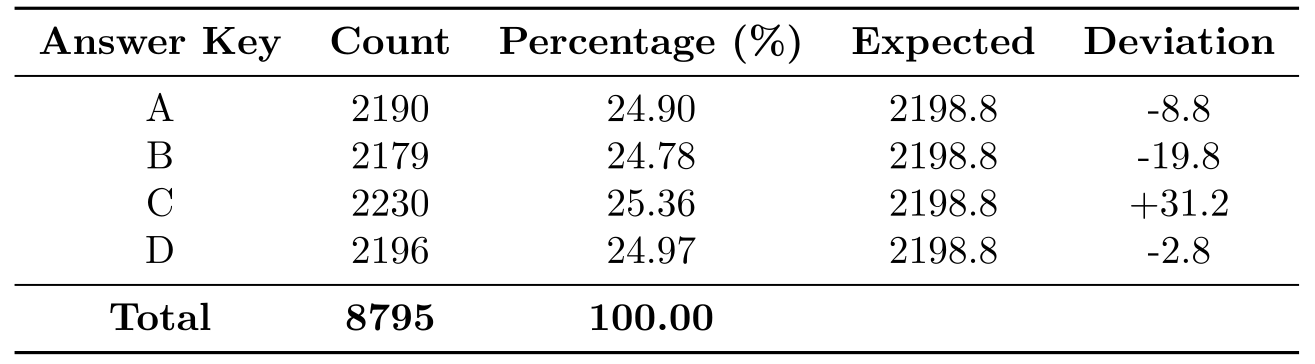
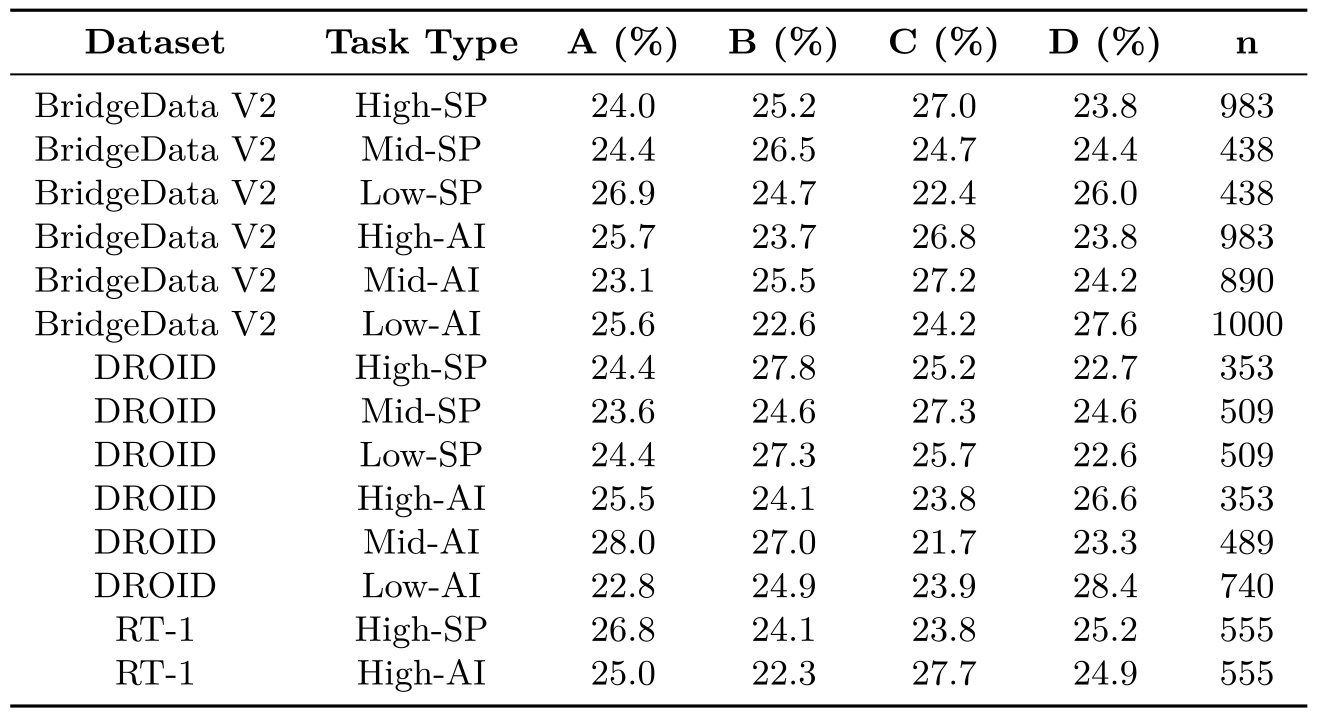
Correct options are approximately balanced: A 2,190, B 2,179, C 2,230 and D 2,196. The reported uniformity test gives χ²=0.66 and p=0.8826; source-specific and task-specific distributions are retained in Tables 18–19.
Balanced answer positions reduce a simple position shortcut. They do not establish absence of visual, lexical, dataset-source or distractor-construction artifacts.

C.1 Model configurations
Table 20 preserves all 34 identifiers, release dates and inference paths, including hosted open-weight models and local Transformers runs. Vision preprocessing follows each implementation’s defaults; smaller local models use RTX 4090 workstations.
This is the paper’s model snapshot, not a current leaderboard. Training-data access, architecture and serving details vary and are not experimentally controlled.
C.2 Evaluation and averaging
Exact-match accuracy is averaged first across datasets for each task category, then equally over the six categories. Equations 1–2 preserve that definition. Because RT-1 has only high-level tasks, averaging dataset-level totals instead would assign different weights.
Reported category scores, question-weighted camera comparisons and seven-cell direction tests use different aggregation schemes. They should not be treated as numerically interchangeable.
Equations


C.3 Human evaluation
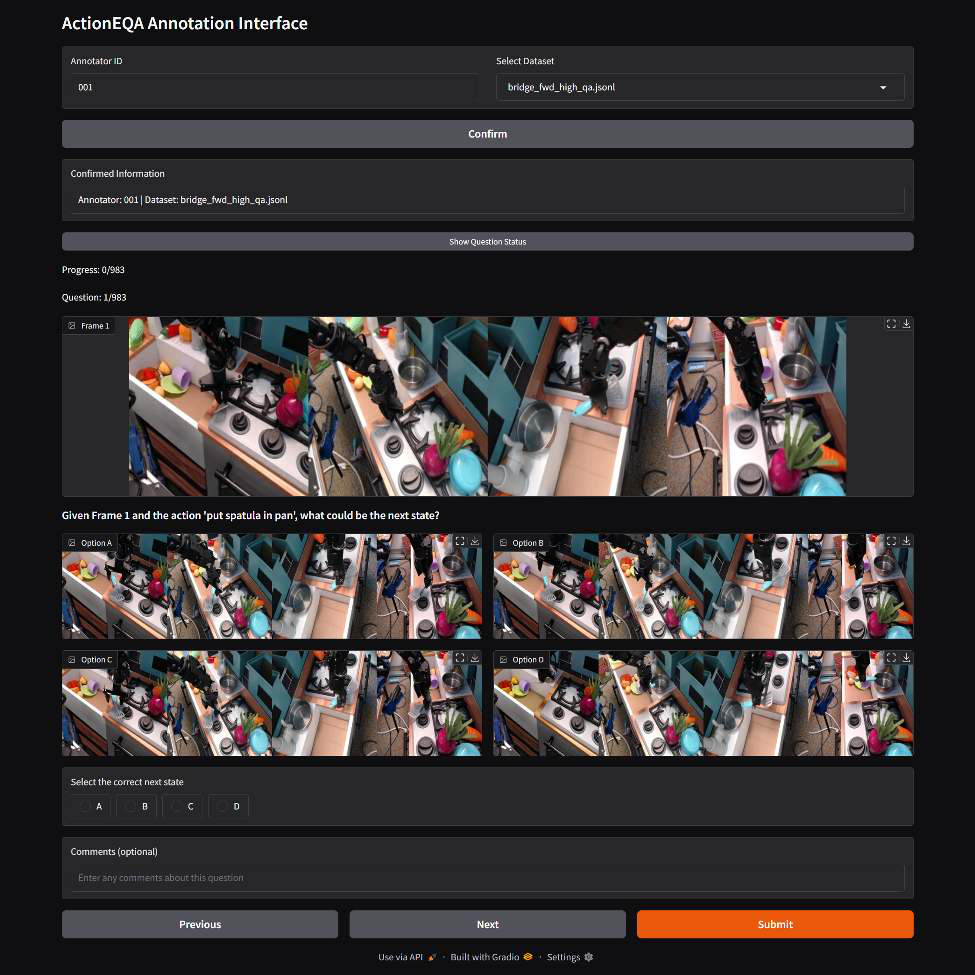
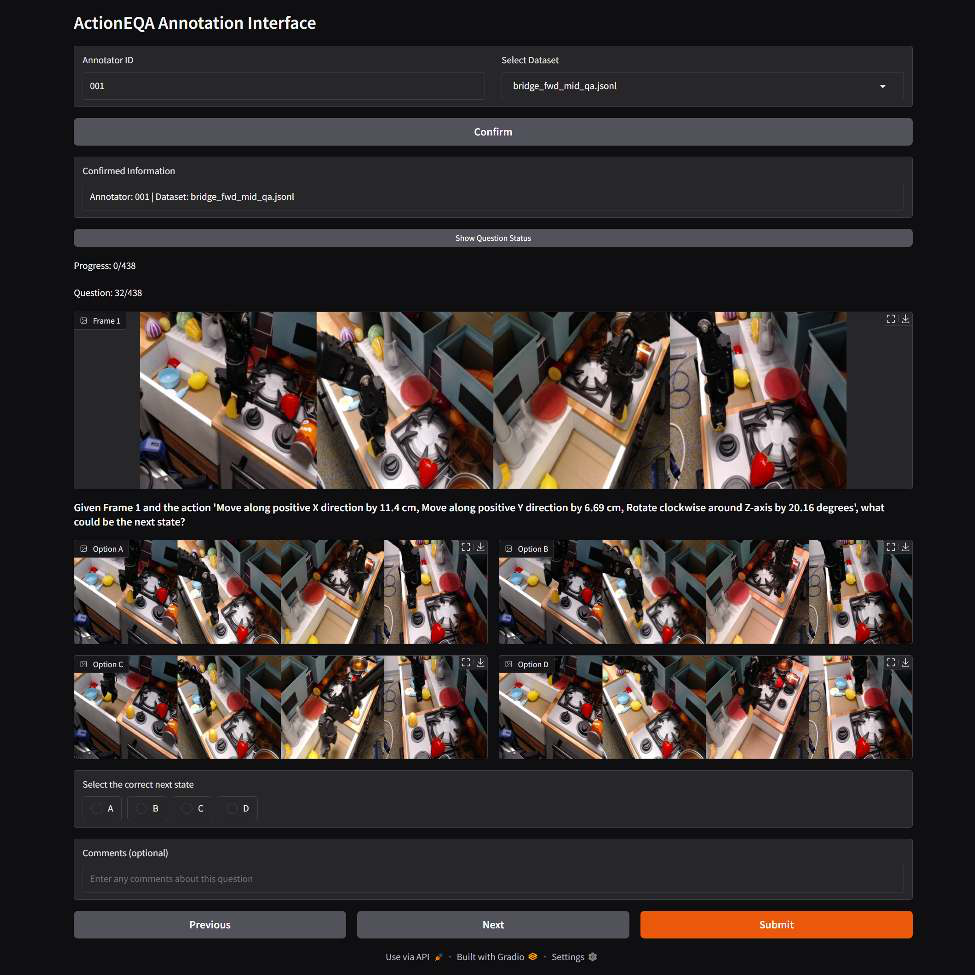
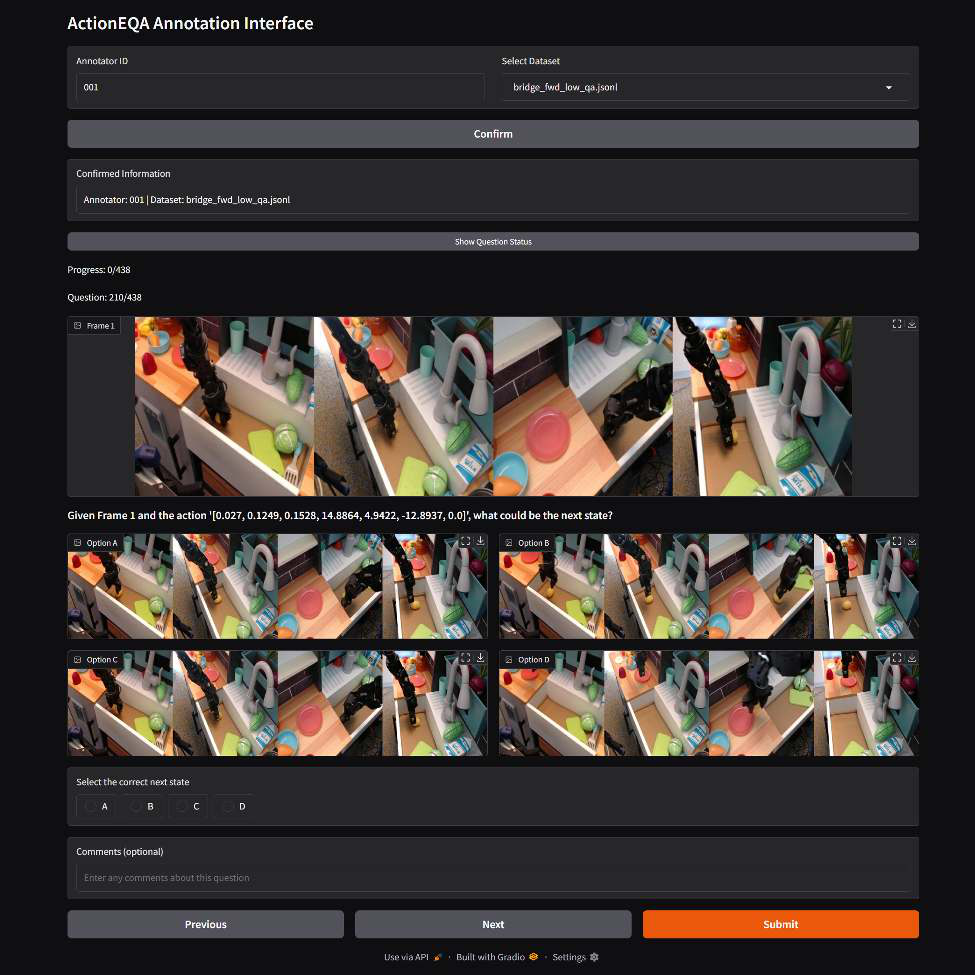
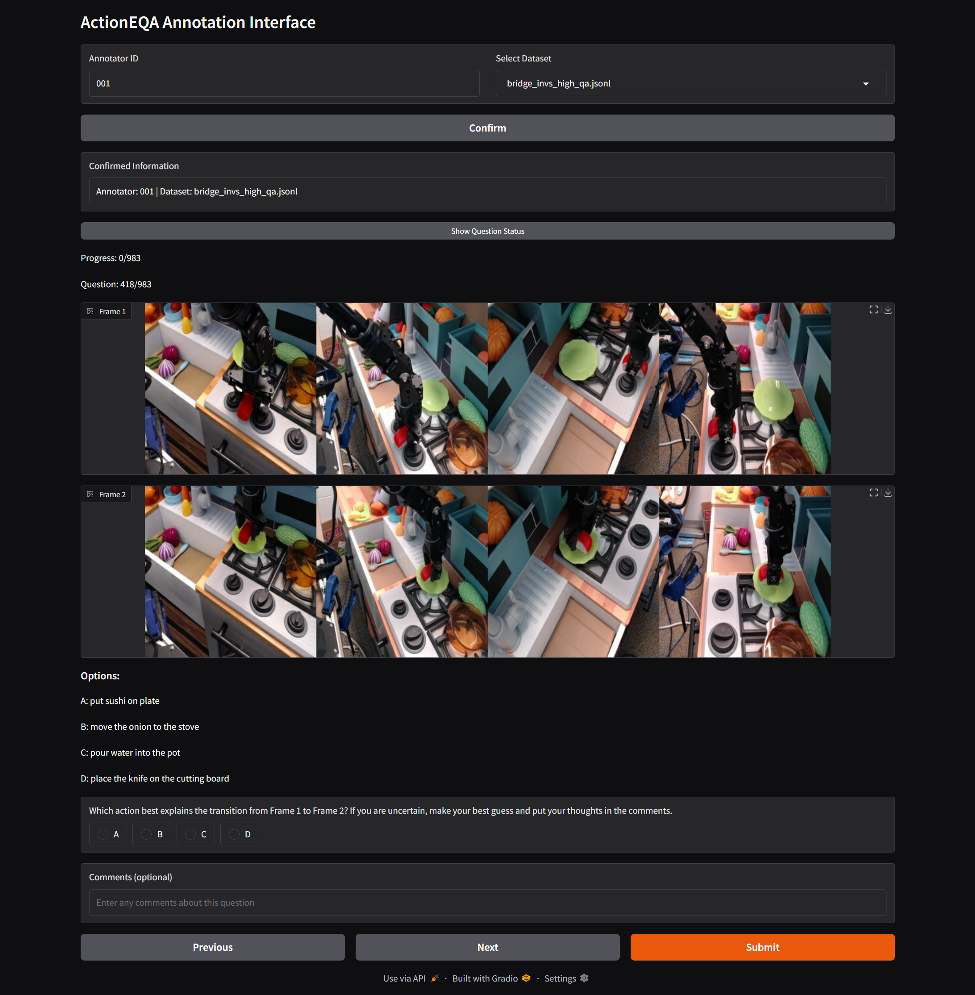
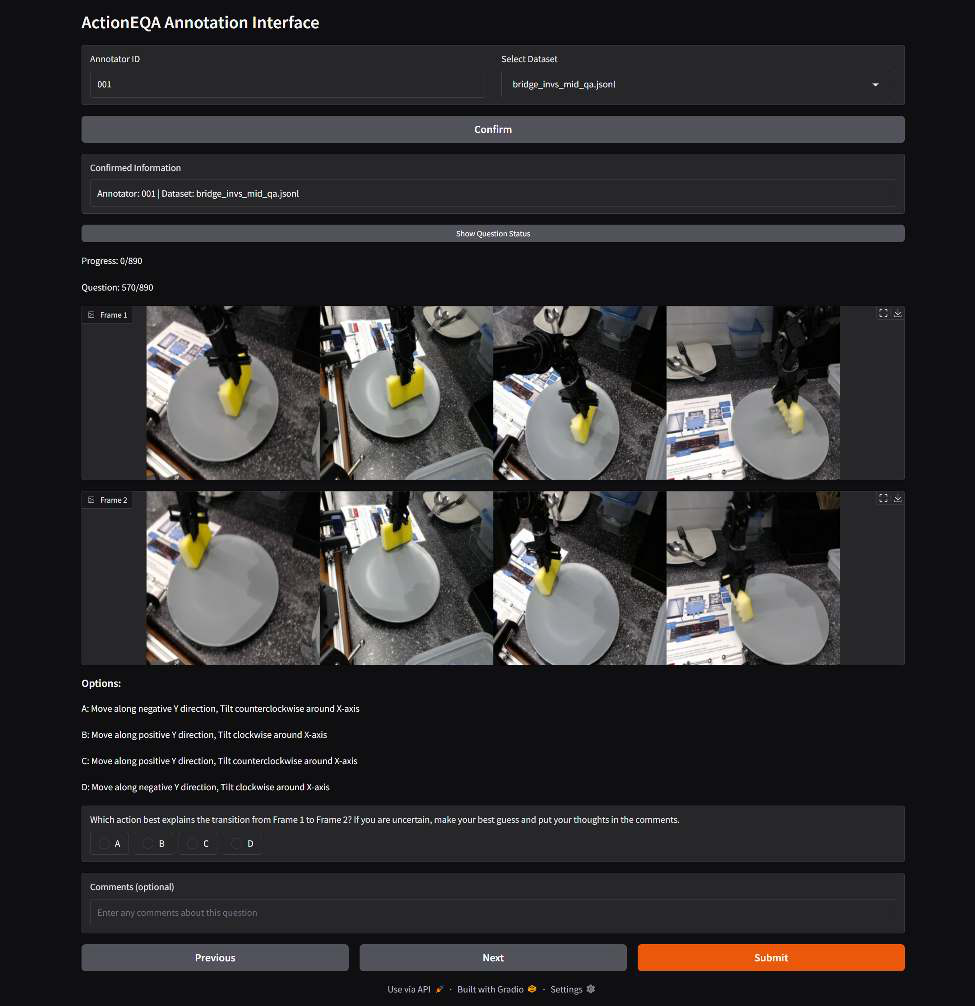
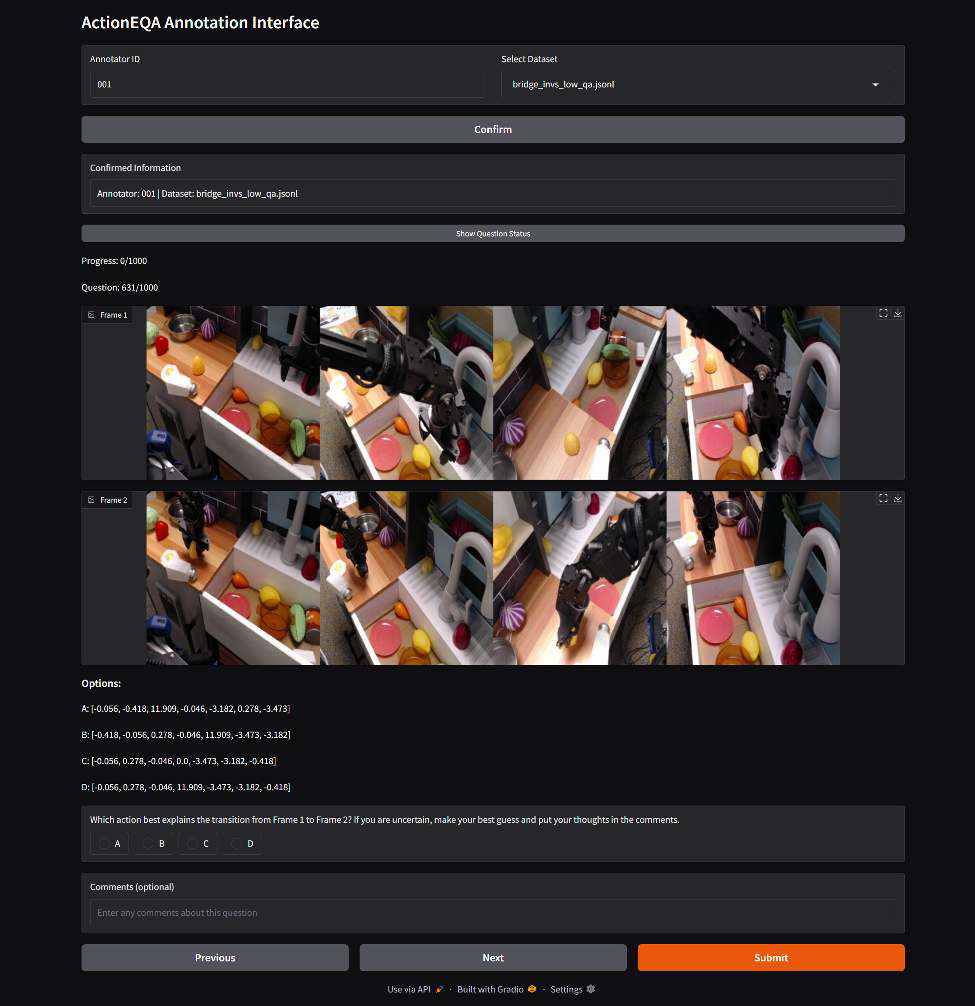
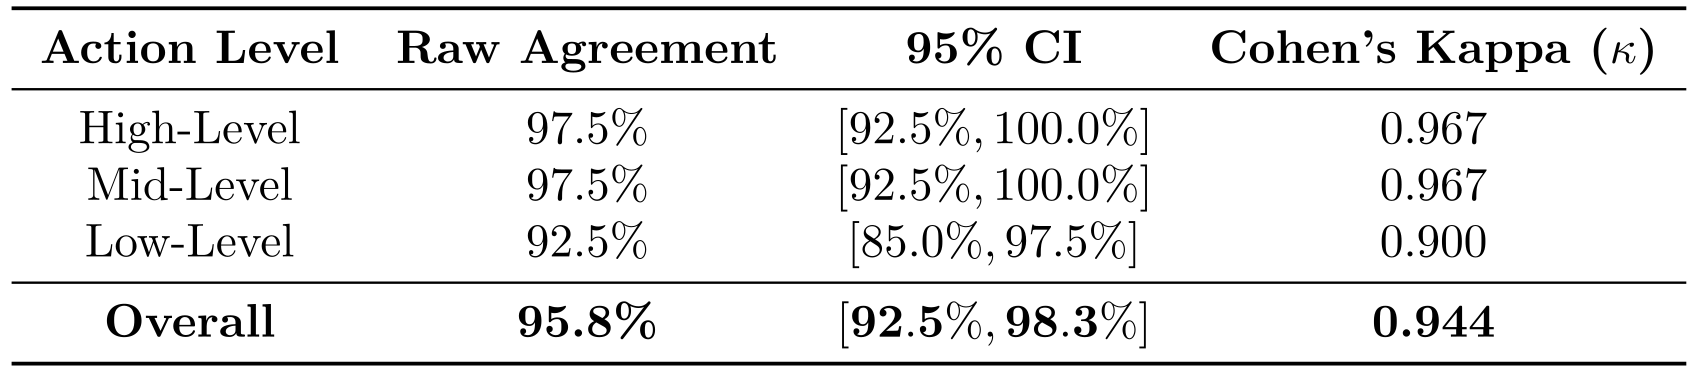
Two professional annotators answer disjoint halves of the benchmark using the same images, instructions and options as models. Both additionally annotate a stratified 120-question subset, twenty per task category. Agreement is 95.8%, with a 1,000-resample bootstrap interval of 92.5–98.3%.
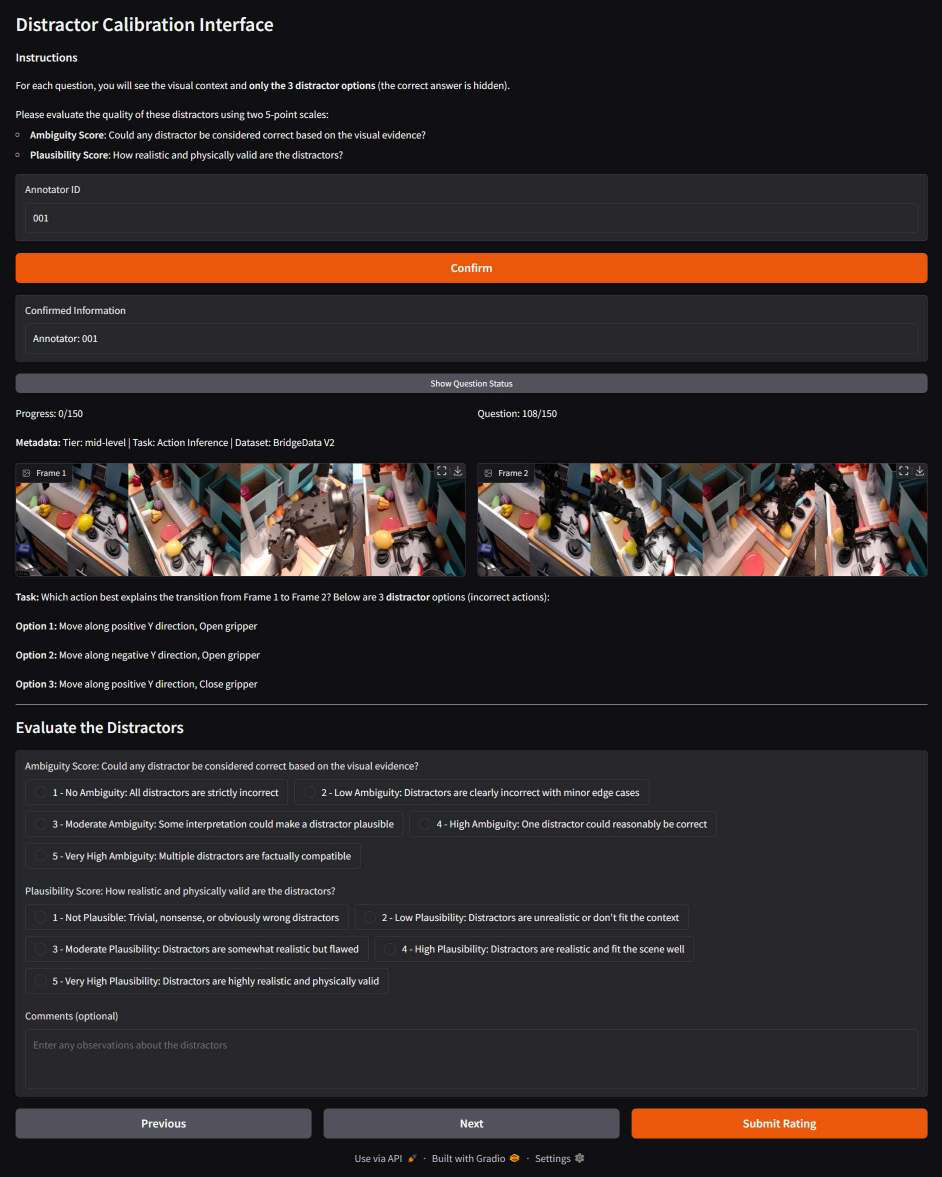
The paper reports κ=0.944 using an assumed chance agreement of 0.25. Standard Cohen’s kappa uses annotator-specific marginal frequencies; those marginals are not supplied. The high observed agreement is useful evidence, but two trained annotators are a reference baseline rather than a population-wide human ceiling. Table 21 and all six original interface screenshots are preserved.
C.4 Distractor calibration
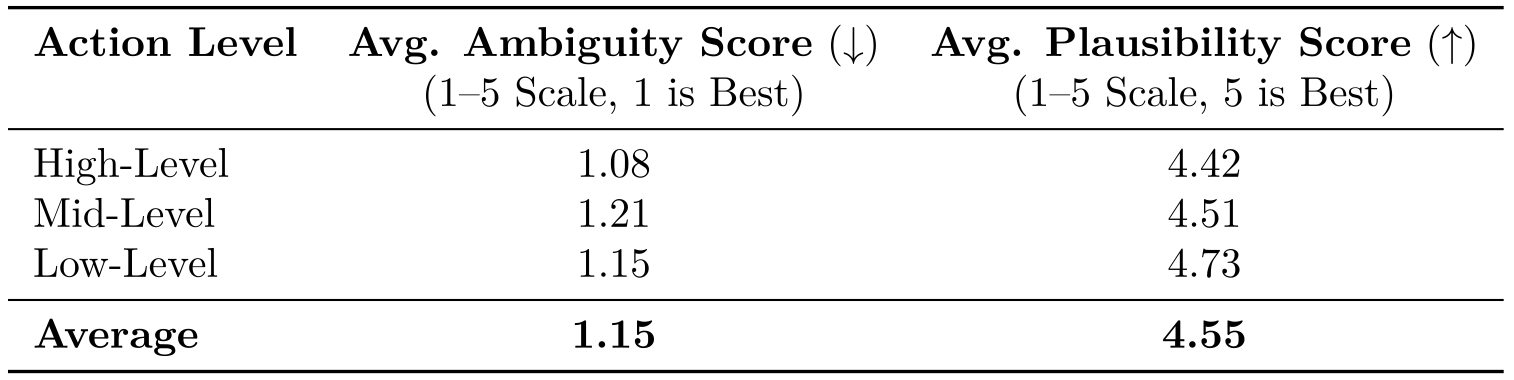
Three professional annotators independently rate a stratified 150-question sample, fifty per level and twenty-five per direction within each level. Mean ambiguity is 1.15/5 and plausibility 4.55/5.
These judgments support relatively clear, nontrivial distractors in the sample. They are rating averages, not measured error probabilities, and no uncertainty or inter-rater agreement for these scales is reported. The calibration interface is retained.
C.5 Synchronized stereo study
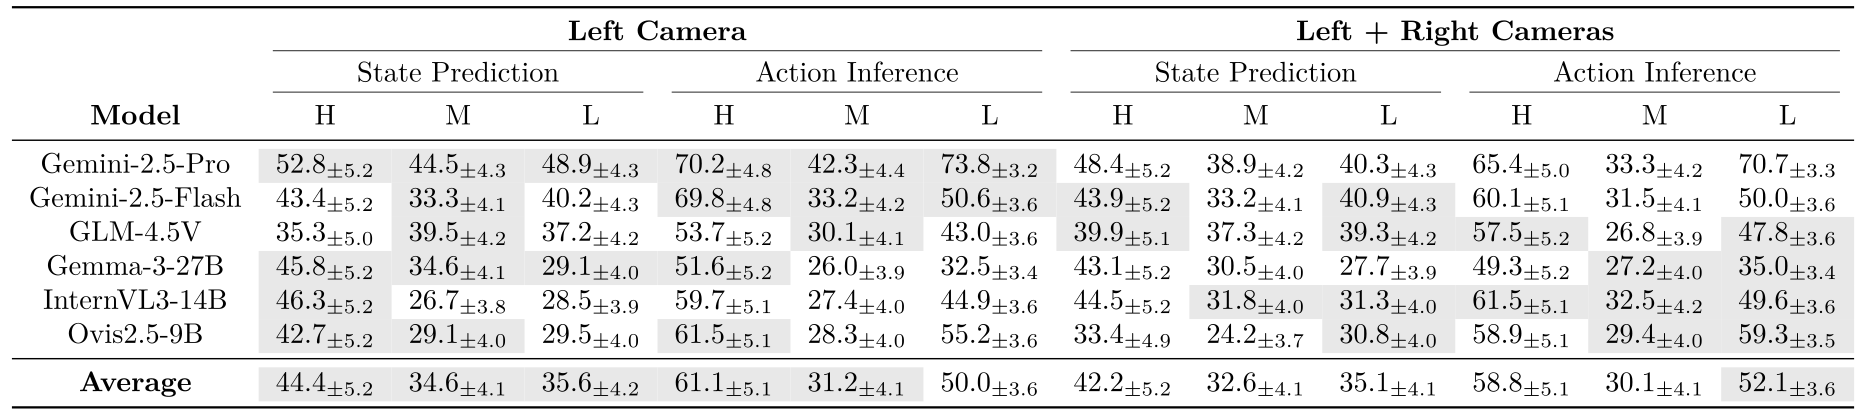
A DROID stereo ablation uses synchronized, rectified left/right images. Gemini-2.5-Pro falls from 52.8% to 48.4% on high-level prediction and 48.9% to 40.3% on low-level prediction; the six-model mean declines in five of six categories.
Several individual models/categories improve. Synchronization reduces one possible data-quality confound, but this experiment does not directly prove cognitive overload or eliminate every preprocessing and representation confound. Table 23 retains all comparisons and intervals.
C.6.1 High-level prediction errors
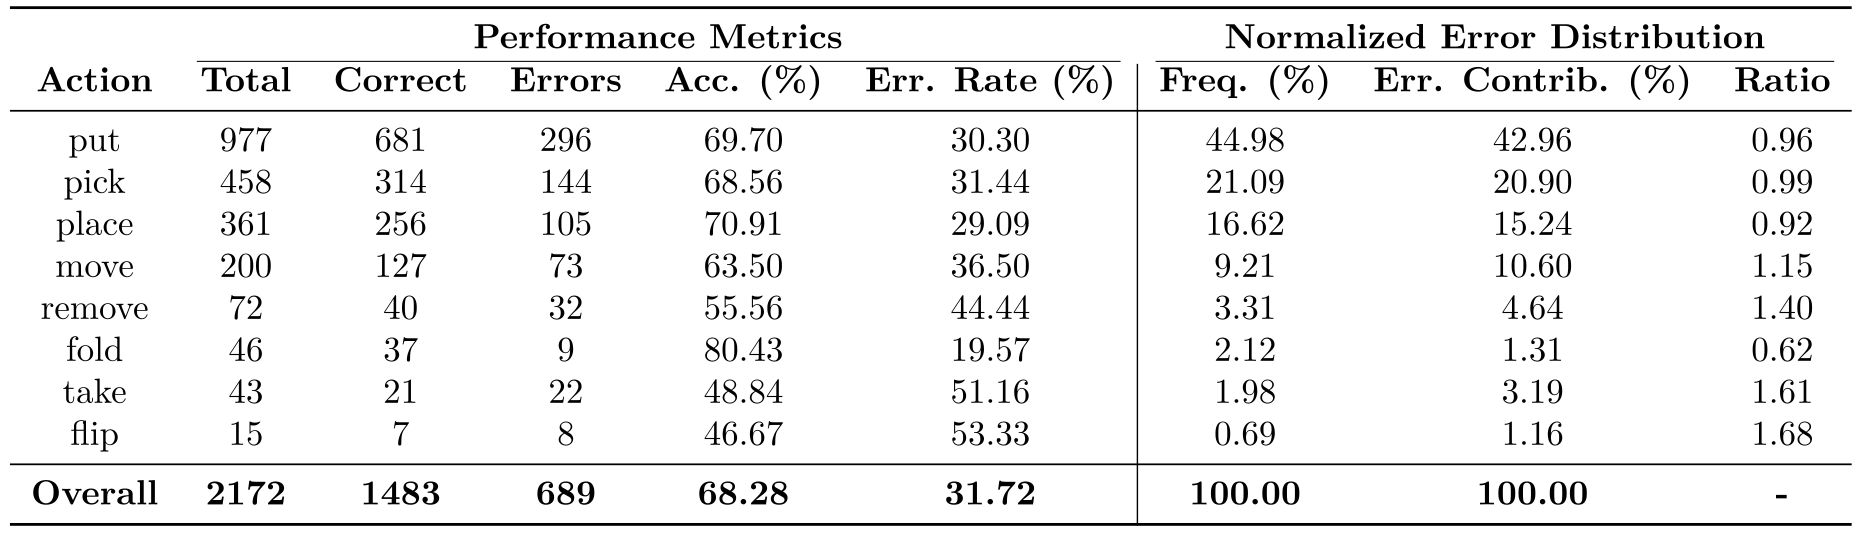
For Gemini-2.5-Pro, the appendix reports relatively high error contribution for flip, take and remove; folding is easier in this sample. Flip accuracy is 46.67% on only fifteen items, and take is 48.84% on forty-three.
The proposed explanations—rotational complexity, occlusion and visual salience—are hypotheses. Table 24 uses 2,172 high-level prediction entries, while the main benchmark lists 1,891; its population difference is unresolved.
C.6.2 Mid-level prediction errors
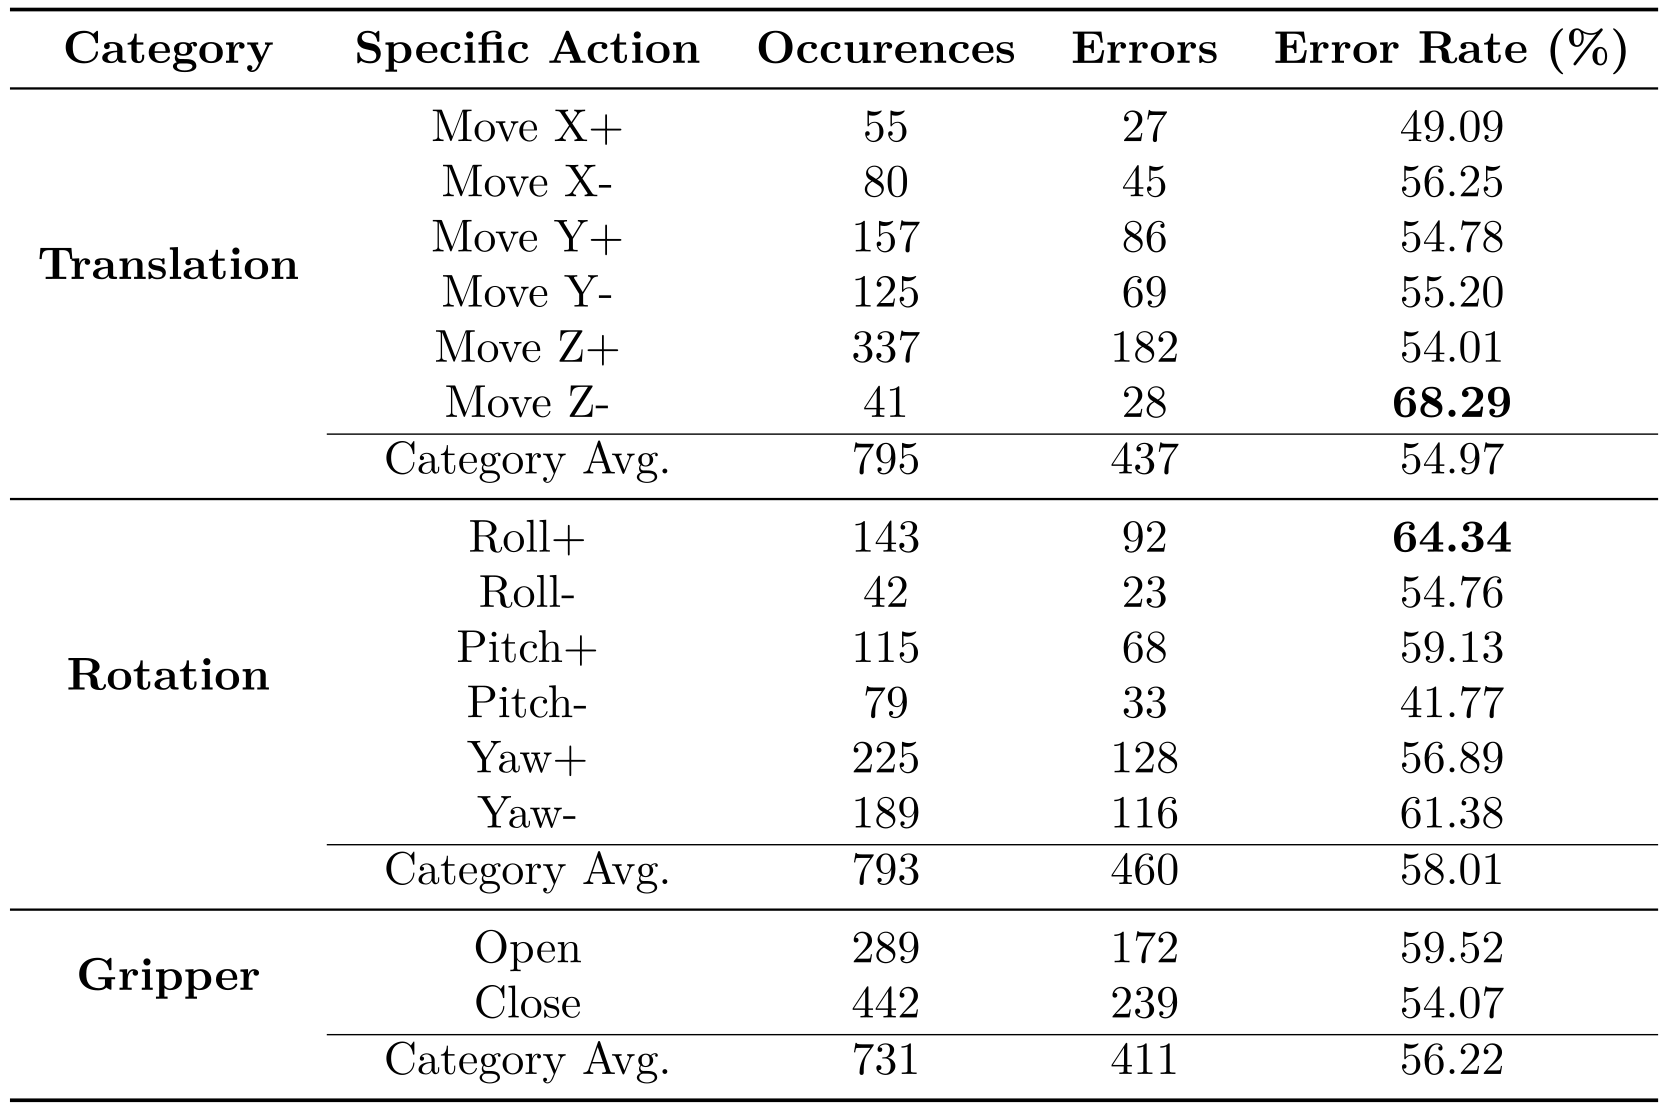
Mid-level prediction error rates are 58.01% for rotation, 54.97% for translation and 56.22% for gripper components. Downward Z motion and positive roll are particularly difficult in the reported sample.
These raw per-component rates differ from the normalized shares in Figure 6b. A question may contribute to more than one component, and the proposed depth/contact explanations are observational interpretations.
C.6.3 Low-level prediction errors
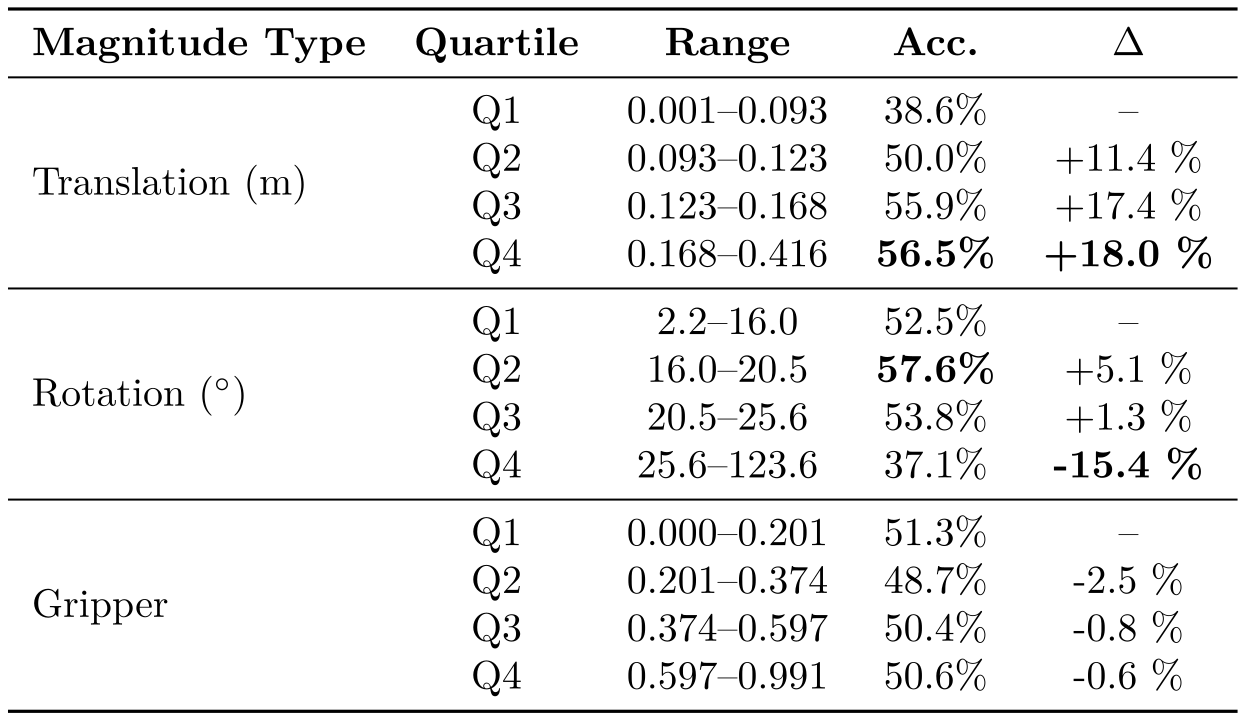
Translation accuracy rises from 38.6% in the smallest-magnitude quartile to 56.5% in the largest. Rotation peaks at 57.6% in the second quartile and falls to 37.1% in the largest, while gripper accuracy changes little.
Table 26 and Figure 21 preserve all ranges and distributions. These associations do not establish that size alone causes success or that the model internally represents gripper motion as binary; action content, scene and visibility also vary.
C.7 Contamination and failure mechanisms
The authors argue that the new fourteen-label taxonomy and bidirectional questions demand reasoning beyond source-dataset memorization. A consistent mid-level gap is evidence of task difficulty, but is not a training-data audit and cannot rule out prior image or trajectory exposure.
The proposed explanation involving two-dimensional visual backbones and weak geometric inductive biases remains a hypothesis. No architecture-controlled intervention demonstrates that mechanism here [21] [70].
C.8 Individual strengths and scaling
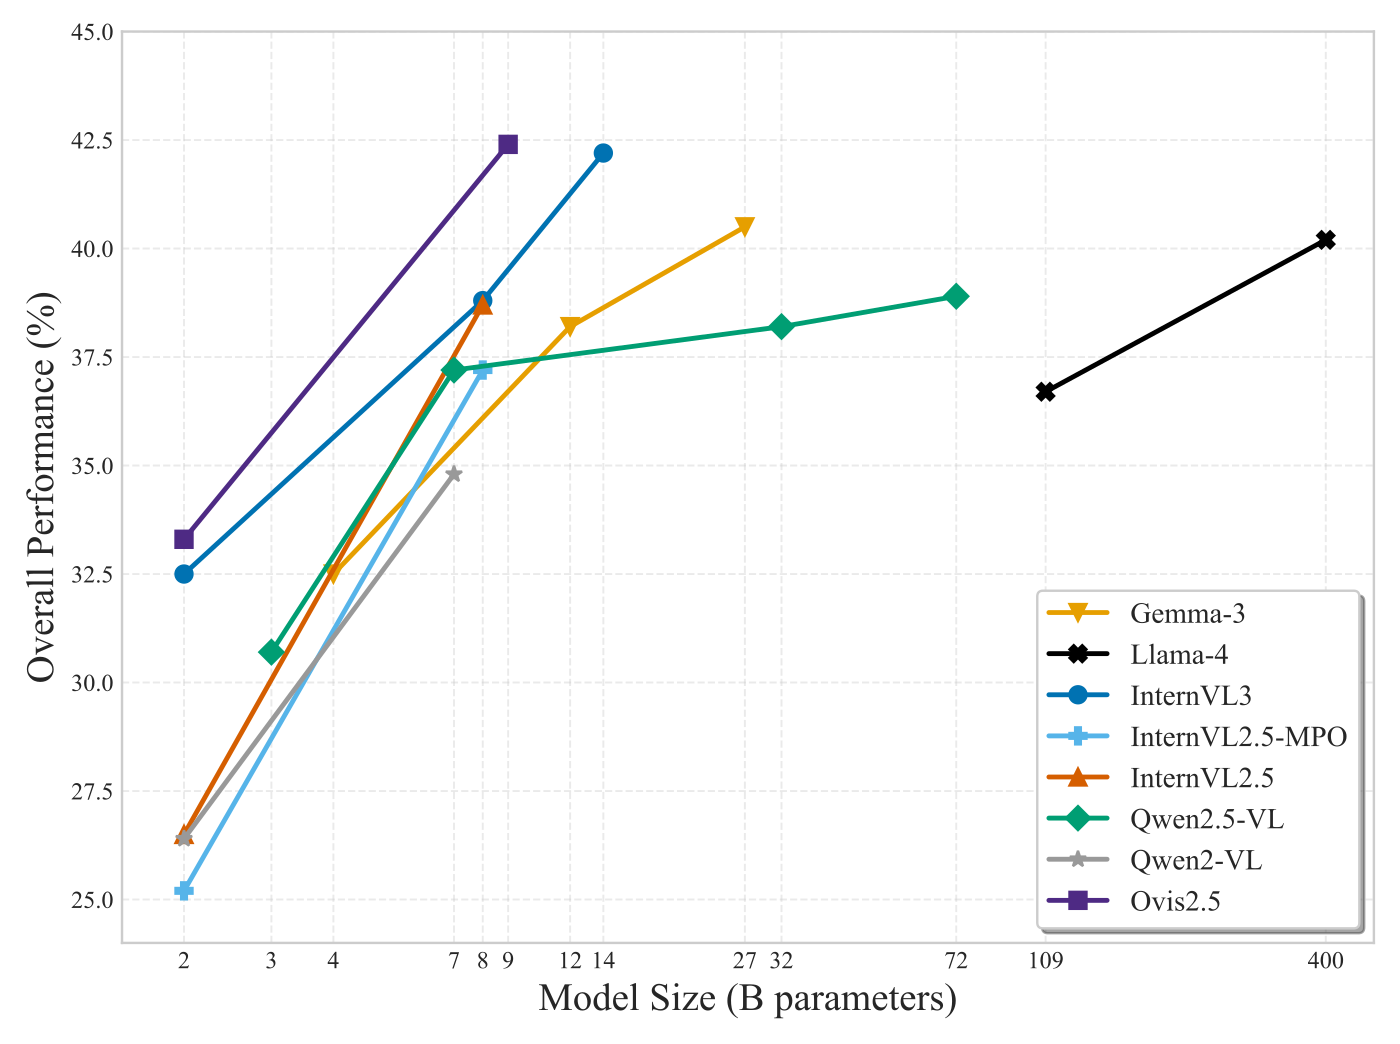
Larger variants generally improve within model families, while individual models specialize: Claude-Opus-4 is strong on low-level inference and GPT-4.1 on BridgeData V2 high-level prediction. Figure 22 retains the scaling curves.
Some appendix rank claims conflict with Table 1: GPT-4.1’s BridgeData average of 51.2% is below Gemini-2.5-Pro’s 60.4%, and Qwen2.5-VL-72B’s RT-1 high-level inference score of 76.0% is below Qwen3-VL-8B’s 78.0%. Use the complete table for model-specific comparisons.
C.8 Dataset variation and direction
Scores vary across sources with different scenes, vocabulary and task coverage. RT-1 averages cover only high-level tasks, so comparing them directly with six-task DROID/BridgeData averages confounds dataset and task difficulty.
Figure 23 retains the six category averages. The inference advantage remains a model-dependent trend; the appendix’s GLM direction summary conflicts with Table 1 and should not be used to claim that every model favors inference.
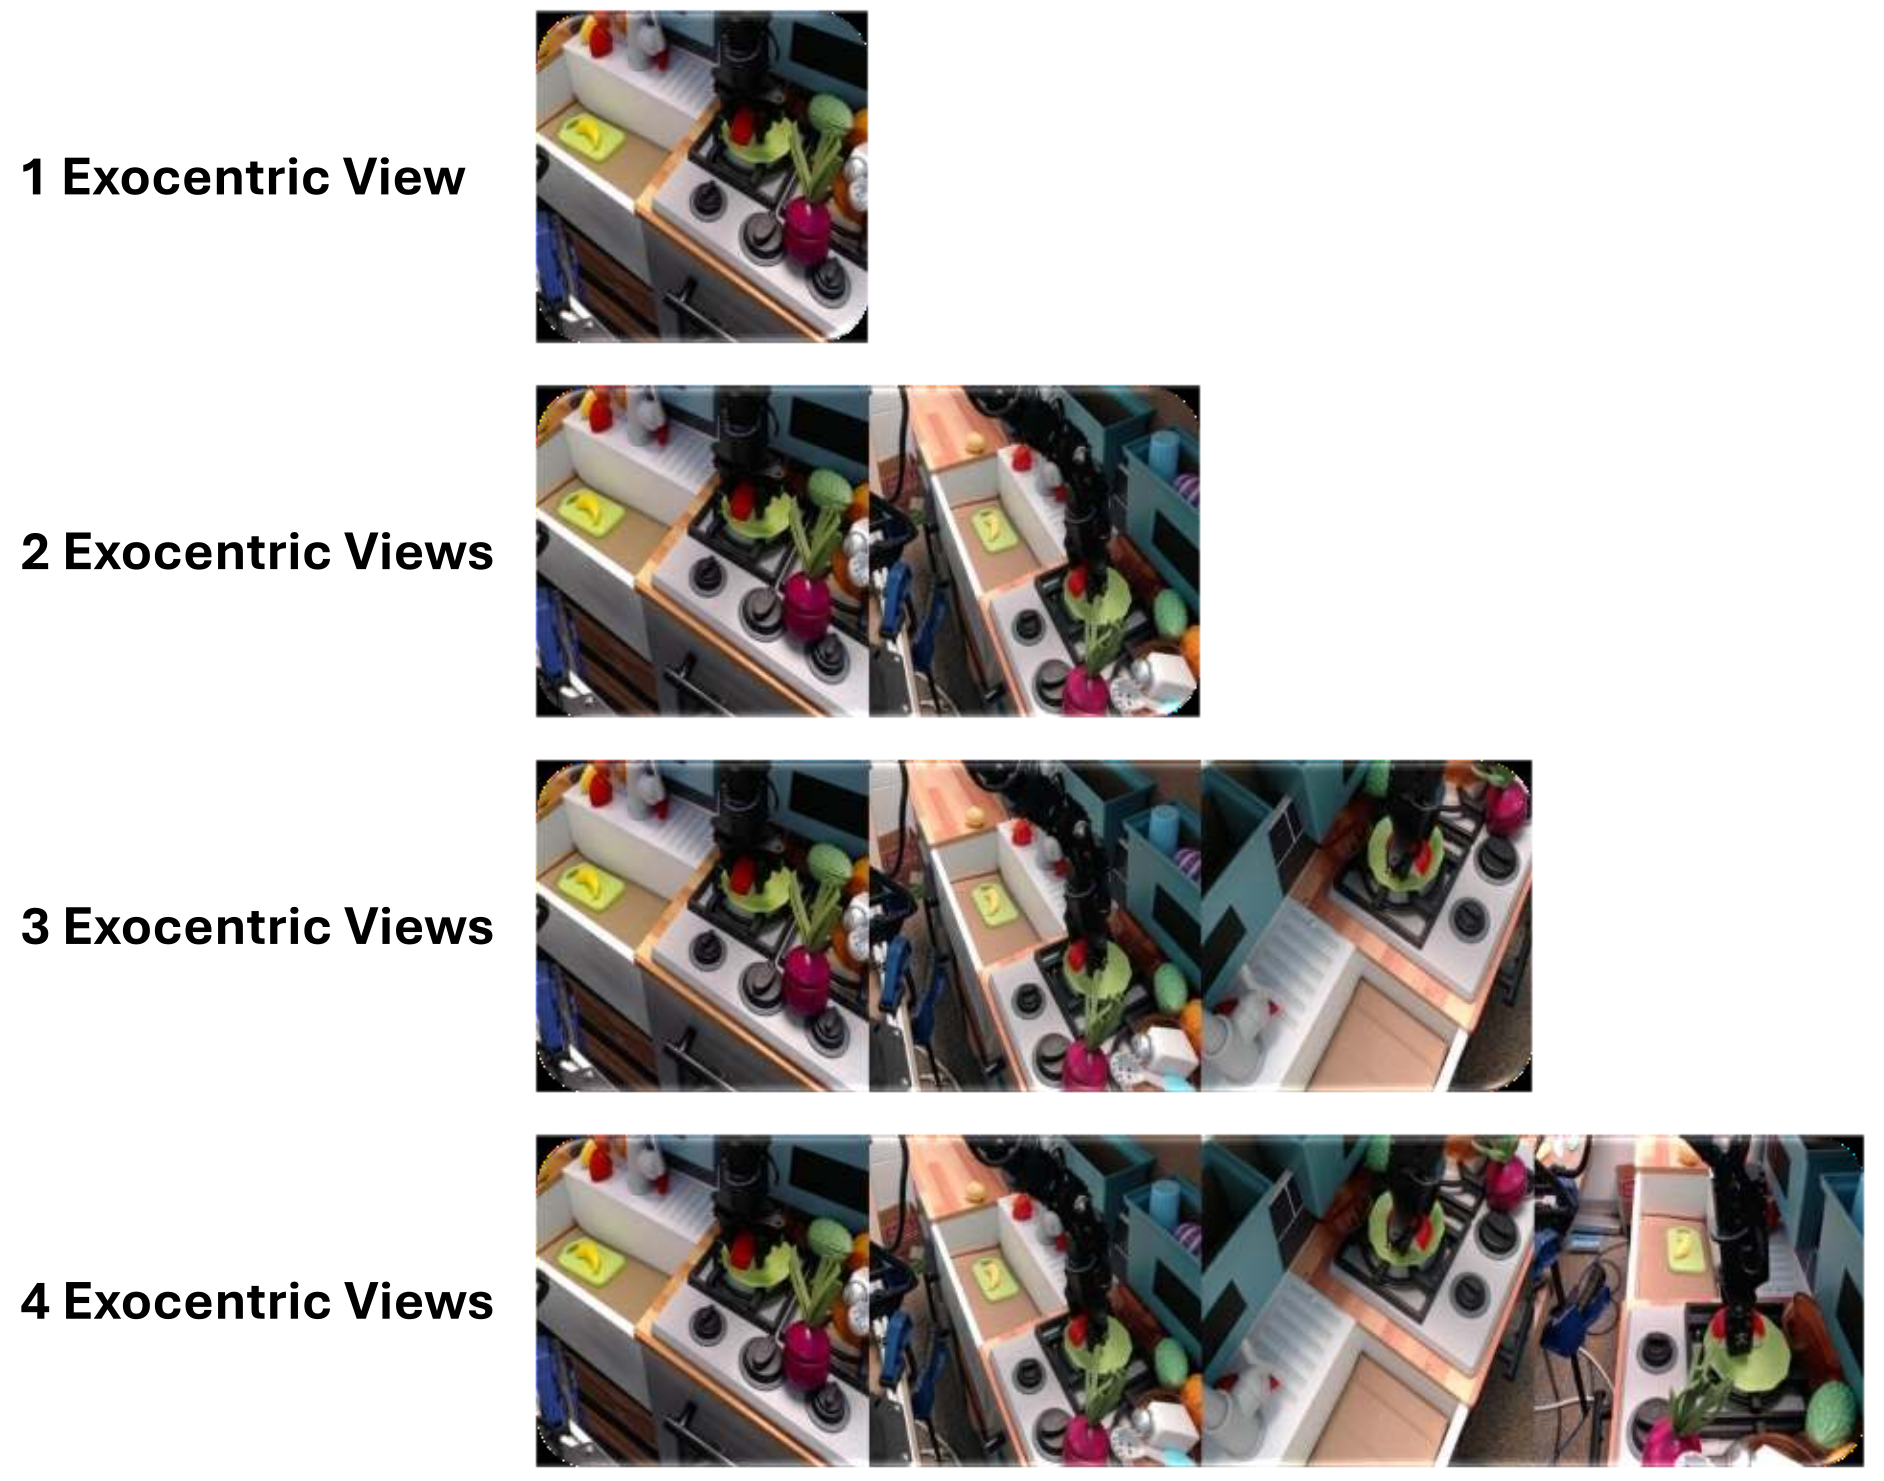
C.9 Exocentric-view setup
BridgeData inputs concatenate one to four 256×256 images into 256×256, 512×256, 768×256 and 1024×256 composites. Figure 24 retains the exact example arrangements. Image area and aspect ratio both change; the model’s subsequent default preprocessing remains part of the evaluation.
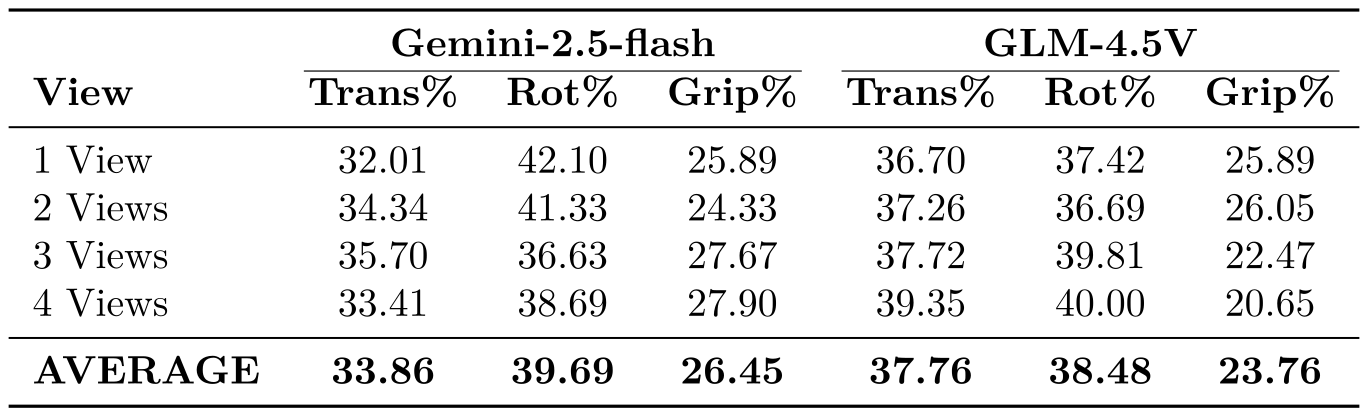
C.9 Normalized error proportions
For each action type, divide its error count by the number of questions involving it. Then divide that rate by the sum of rates across translation, rotation and gripper. The resulting three shares sum to 100%.
A falling share does not necessarily mean falling absolute error. Tables 27–28 retain the individual and combined proportions; a question can contain several action types. The original table values are preserved despite differing endpoint descriptions in the main prose.
C.10 Perspective setup
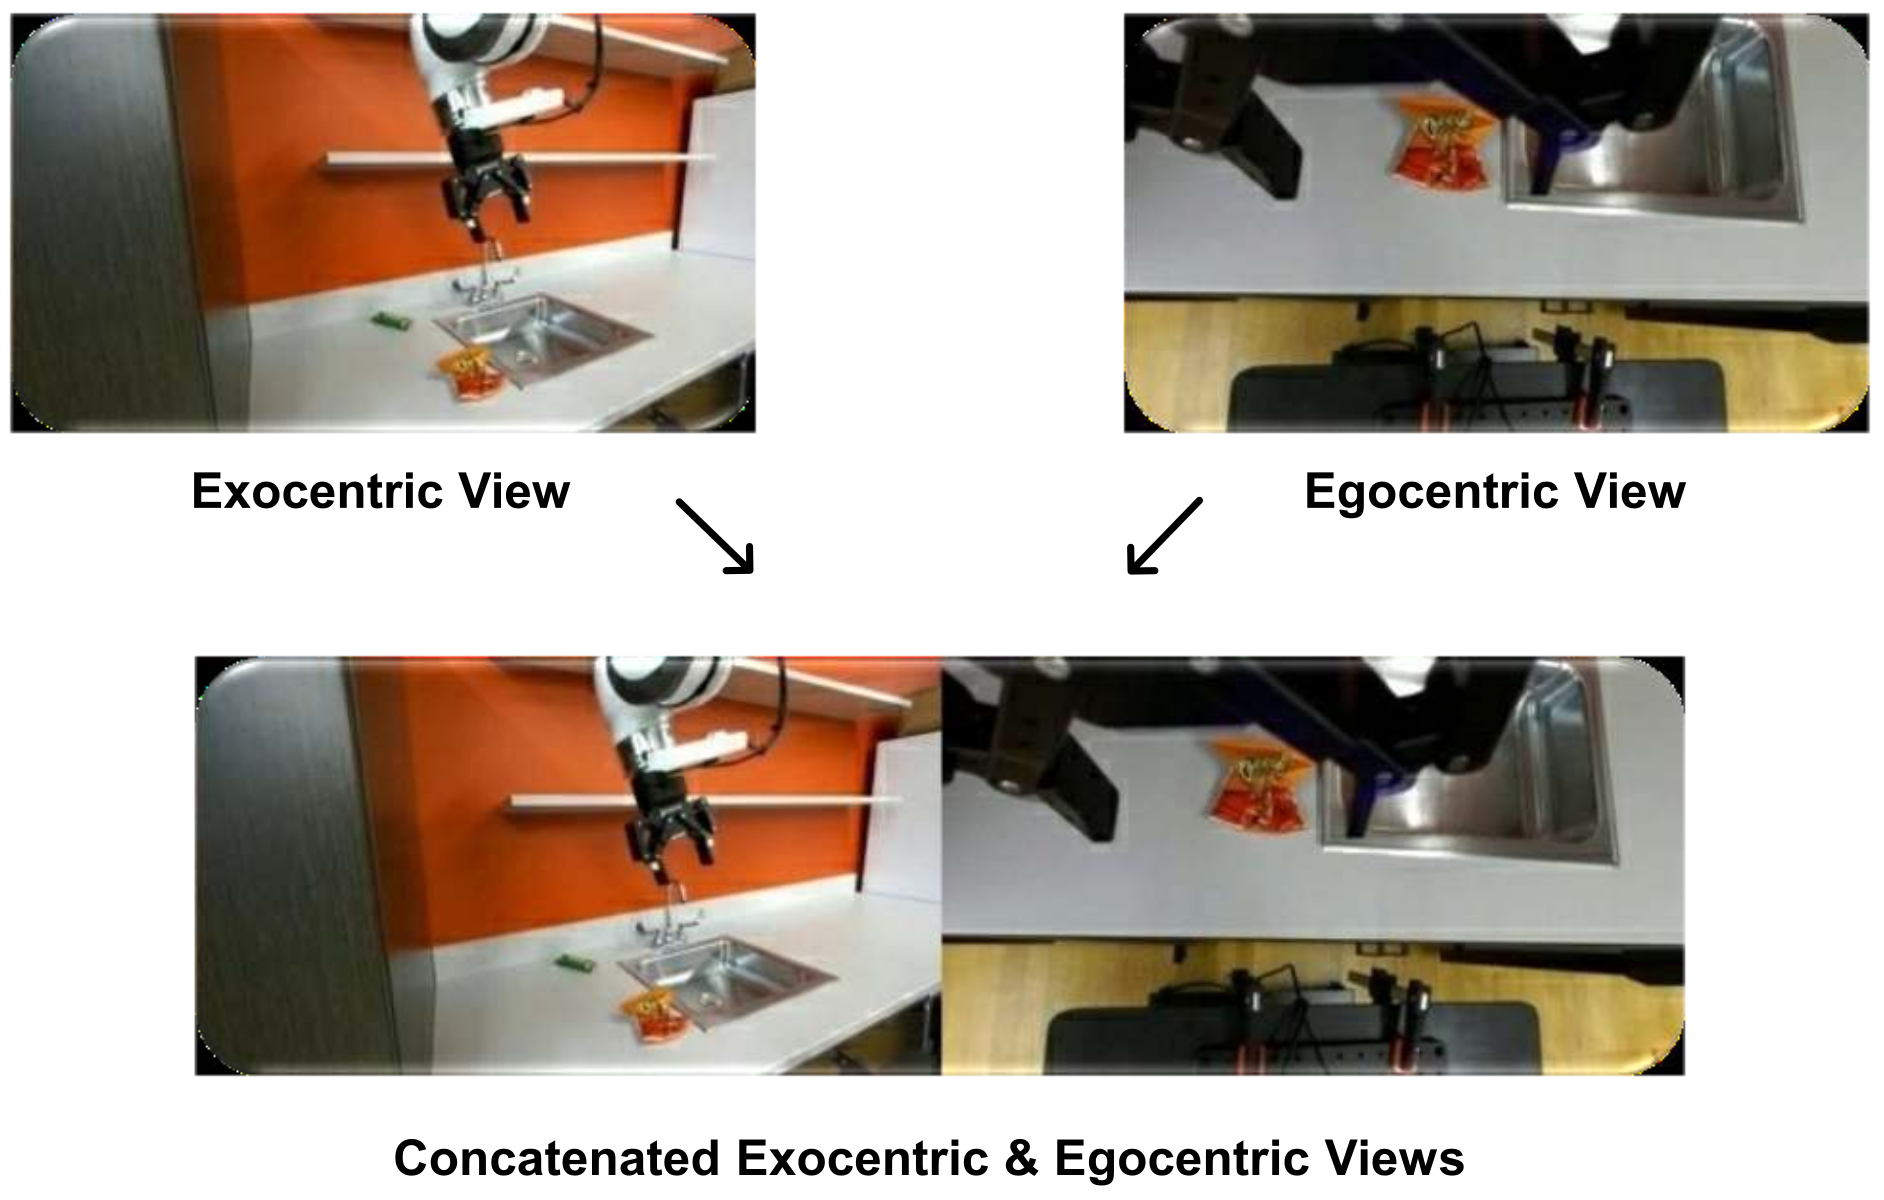
DROID single views are 320×180; the combined wrist/external input is 640×180. Figure 25 shows the camera images and horizontal concatenation. This tests that specific presentation, with different total input width, rather than an optimized learned fusion module.
C.11 Hierarchy significance tests
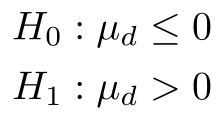
Appendix C.11 averages prediction/inference on DROID and BridgeData V2 for each of 34 models, excluding RT-1. One-sided paired tests report t=14.34 for high versus mid and t=7.40 for low versus mid, both p<0.001; paired effect sizes are 2.46 and 1.27.
The unit of this test is a model, not an independent episode. Shared model families, training data and benchmark items limit a population interpretation of those p-values. Equations 3–4 and Table 29 remain exact.
Equations


C.12 Direction significance test
Appendix C.12 averages seven dataset/task cells per direction for each model, then tests their paired difference. It reports a 4.31-point inference advantage, t=5.51, one-sided p=2.84×10⁻⁶ and paired d=0.95.
This aggregation differs from the main hierarchical overall score and from pooled accuracy. Shared models/items and unequal modality or distractor difficulty remain relevant when interpreting the direction gap. Equations 5–6 and Table 30 preserve the calculation.
Equations


C.13 Rotation significance test
Appendix C.13 treats the four view configurations as paired observations of normalized rotation-minus-translation error shares. Differences are 5.40, 3.21, 1.51 and 2.97 points; the reported mean is 3.2725, t=4.08, one-sided p=0.013 and d=2.04.
Although the underlying task has 890 questions, this test has n=4 and three degrees of freedom. The four configurations reuse models and data, so they are not four independent benchmark replications. All hypotheses, displayed values, Equations 7–10 and Table 31 are retained.

Equations





C.14 Viewpoint significance tests
The appendix combines levels with question-count weights, giving wrist-minus-external differences of 4.10 points for prediction and 8.44 for inference. It reports two-proportion Z-test p-values 0.0139 and below 10⁻⁵.
These tests use aggregate model accuracies with one sample count per view and do not model the paired predictions or dependence across models/episodes. The descriptive differences are clear; the reported inferential precision should be read with that limitation. Equations 11–12 and Table 32 remain unchanged.

Equations


C.15 Prompt strategies
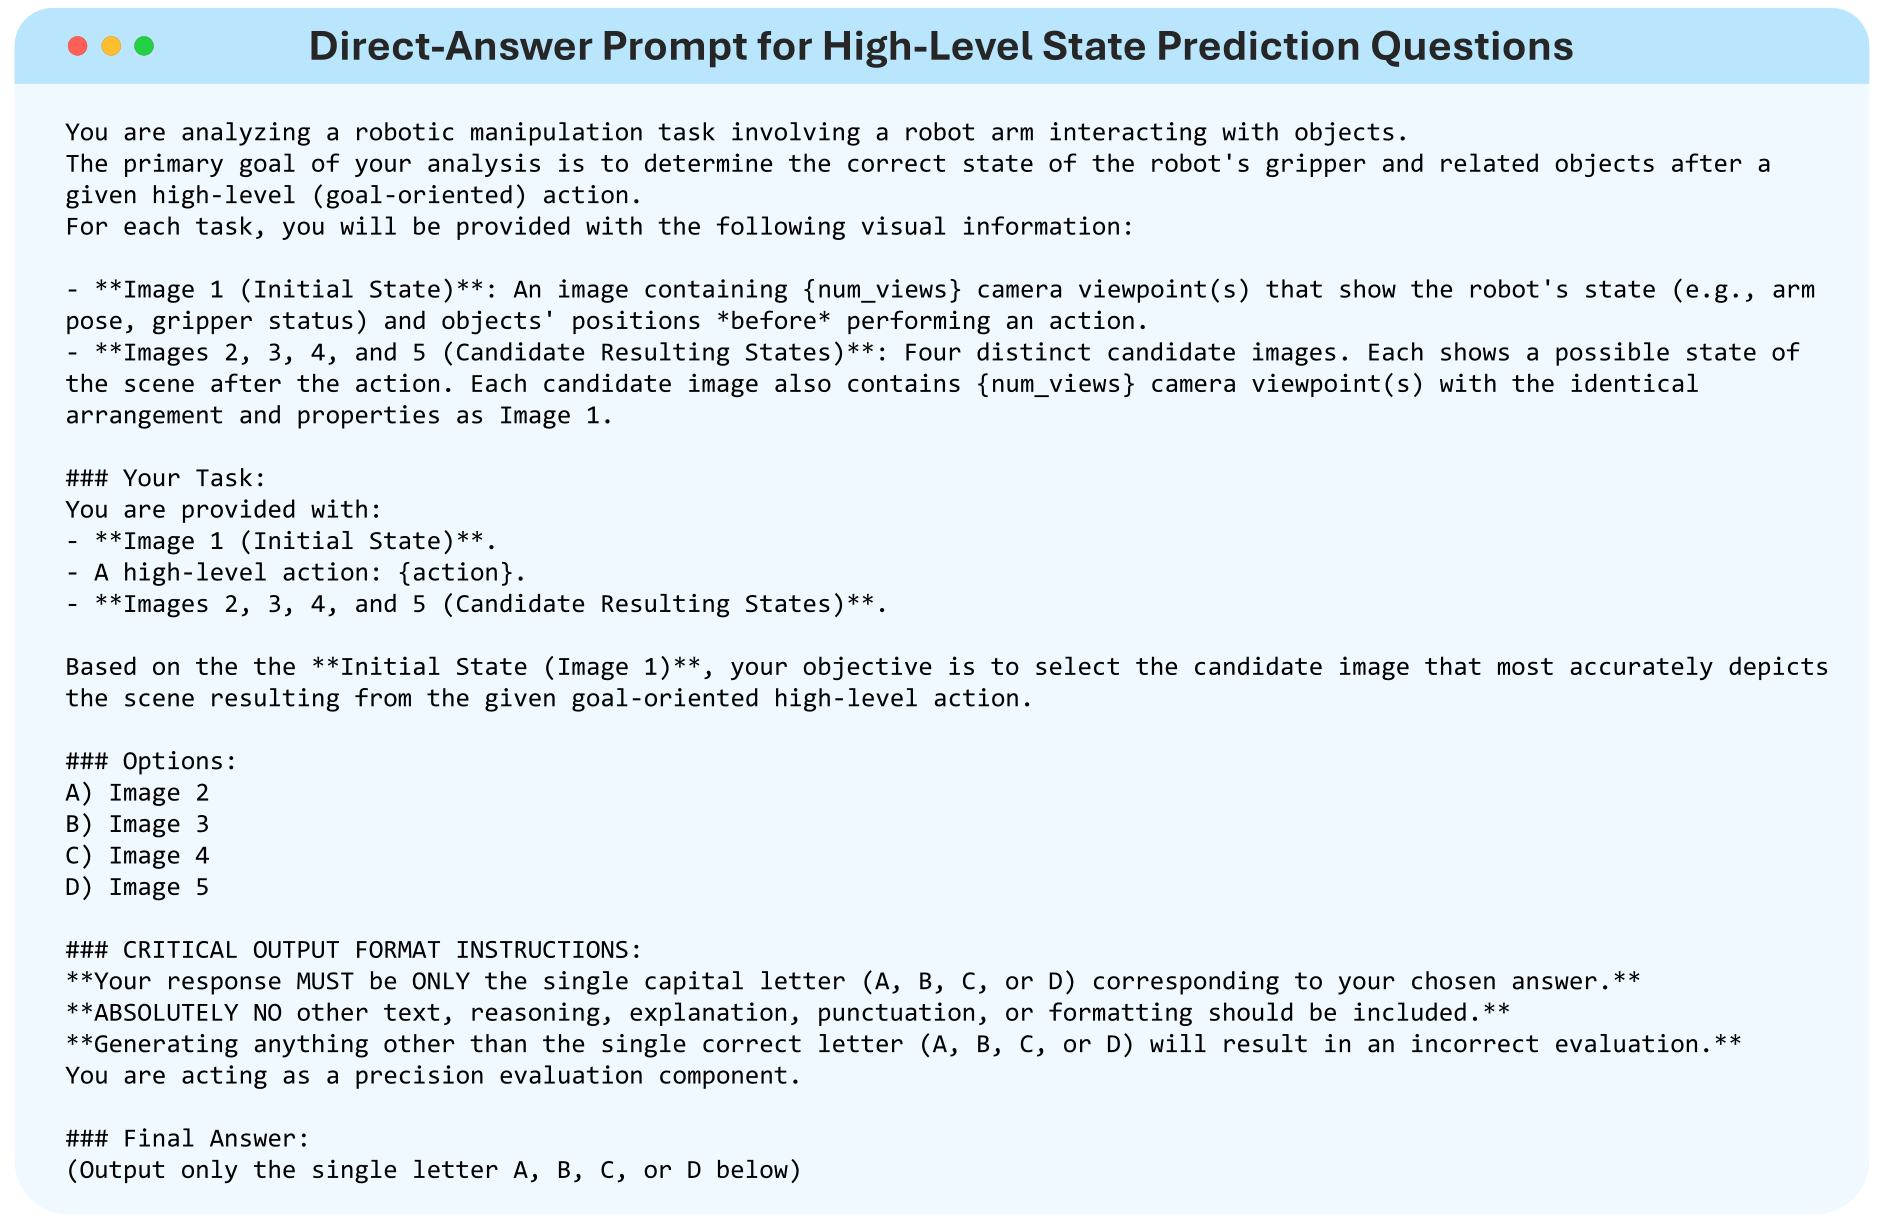
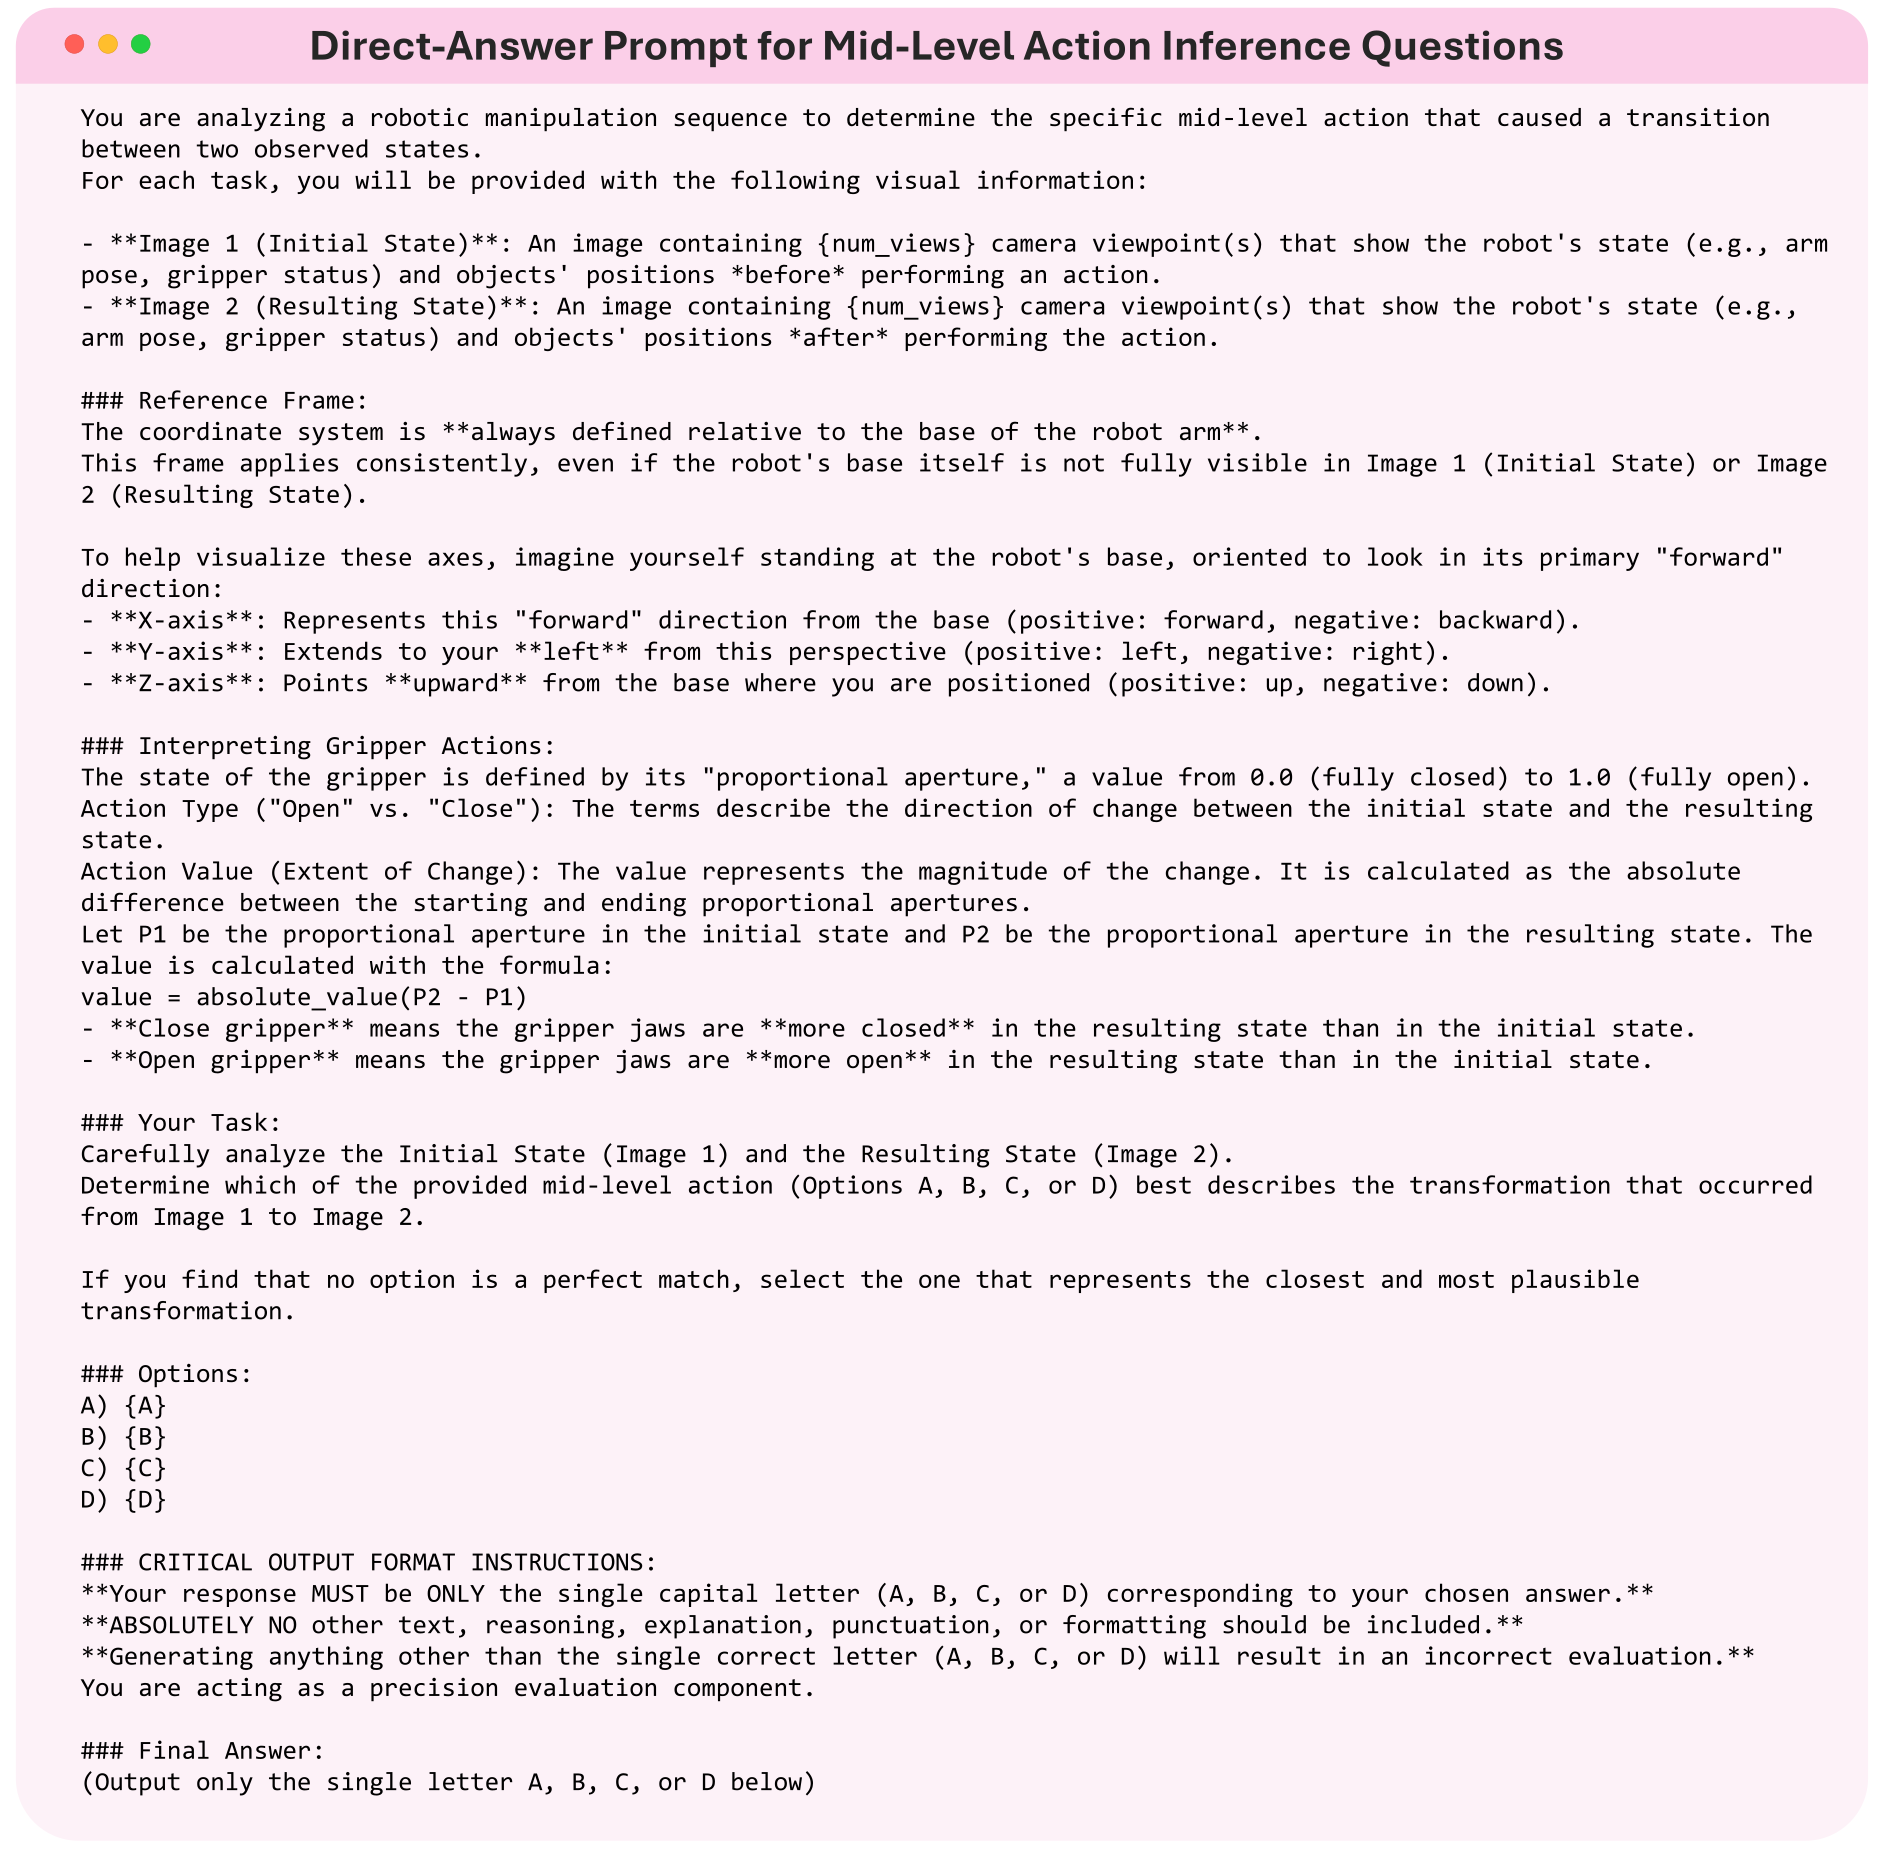
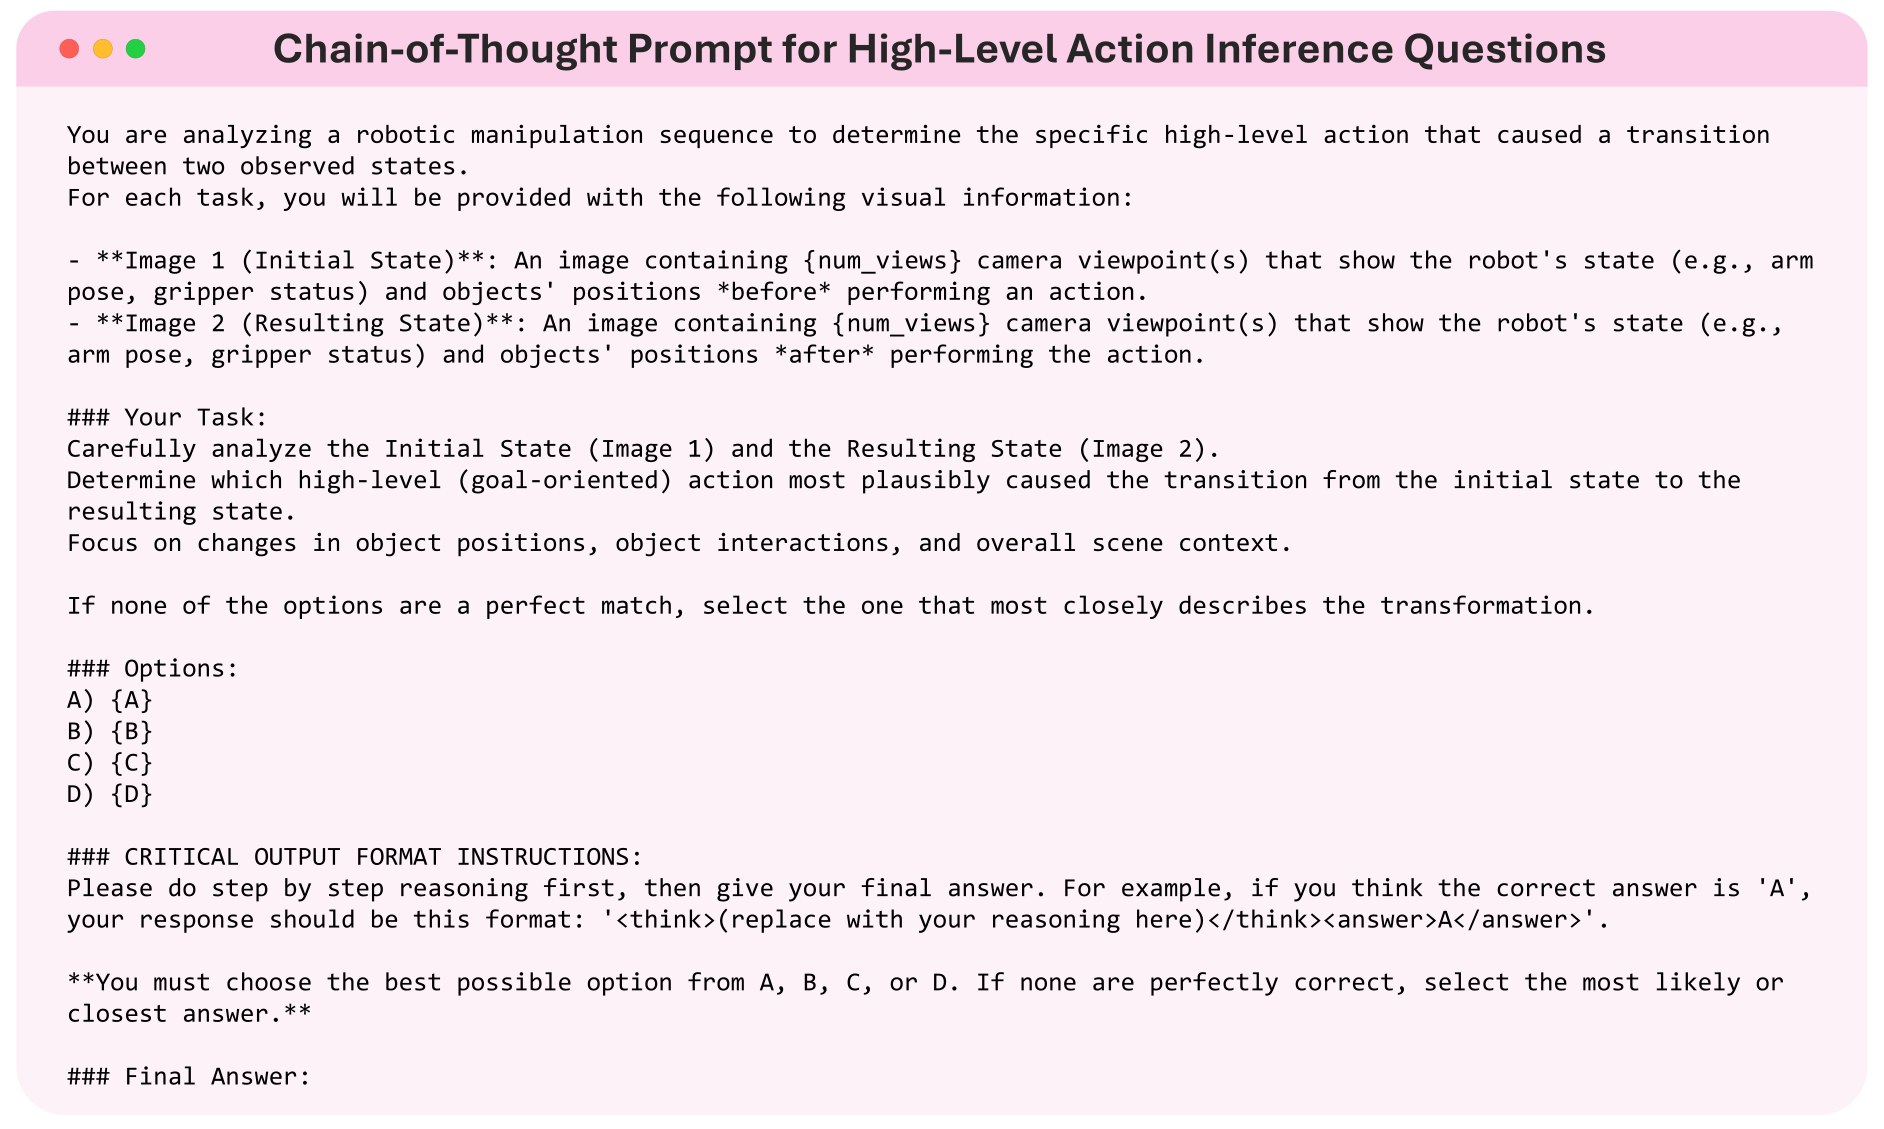
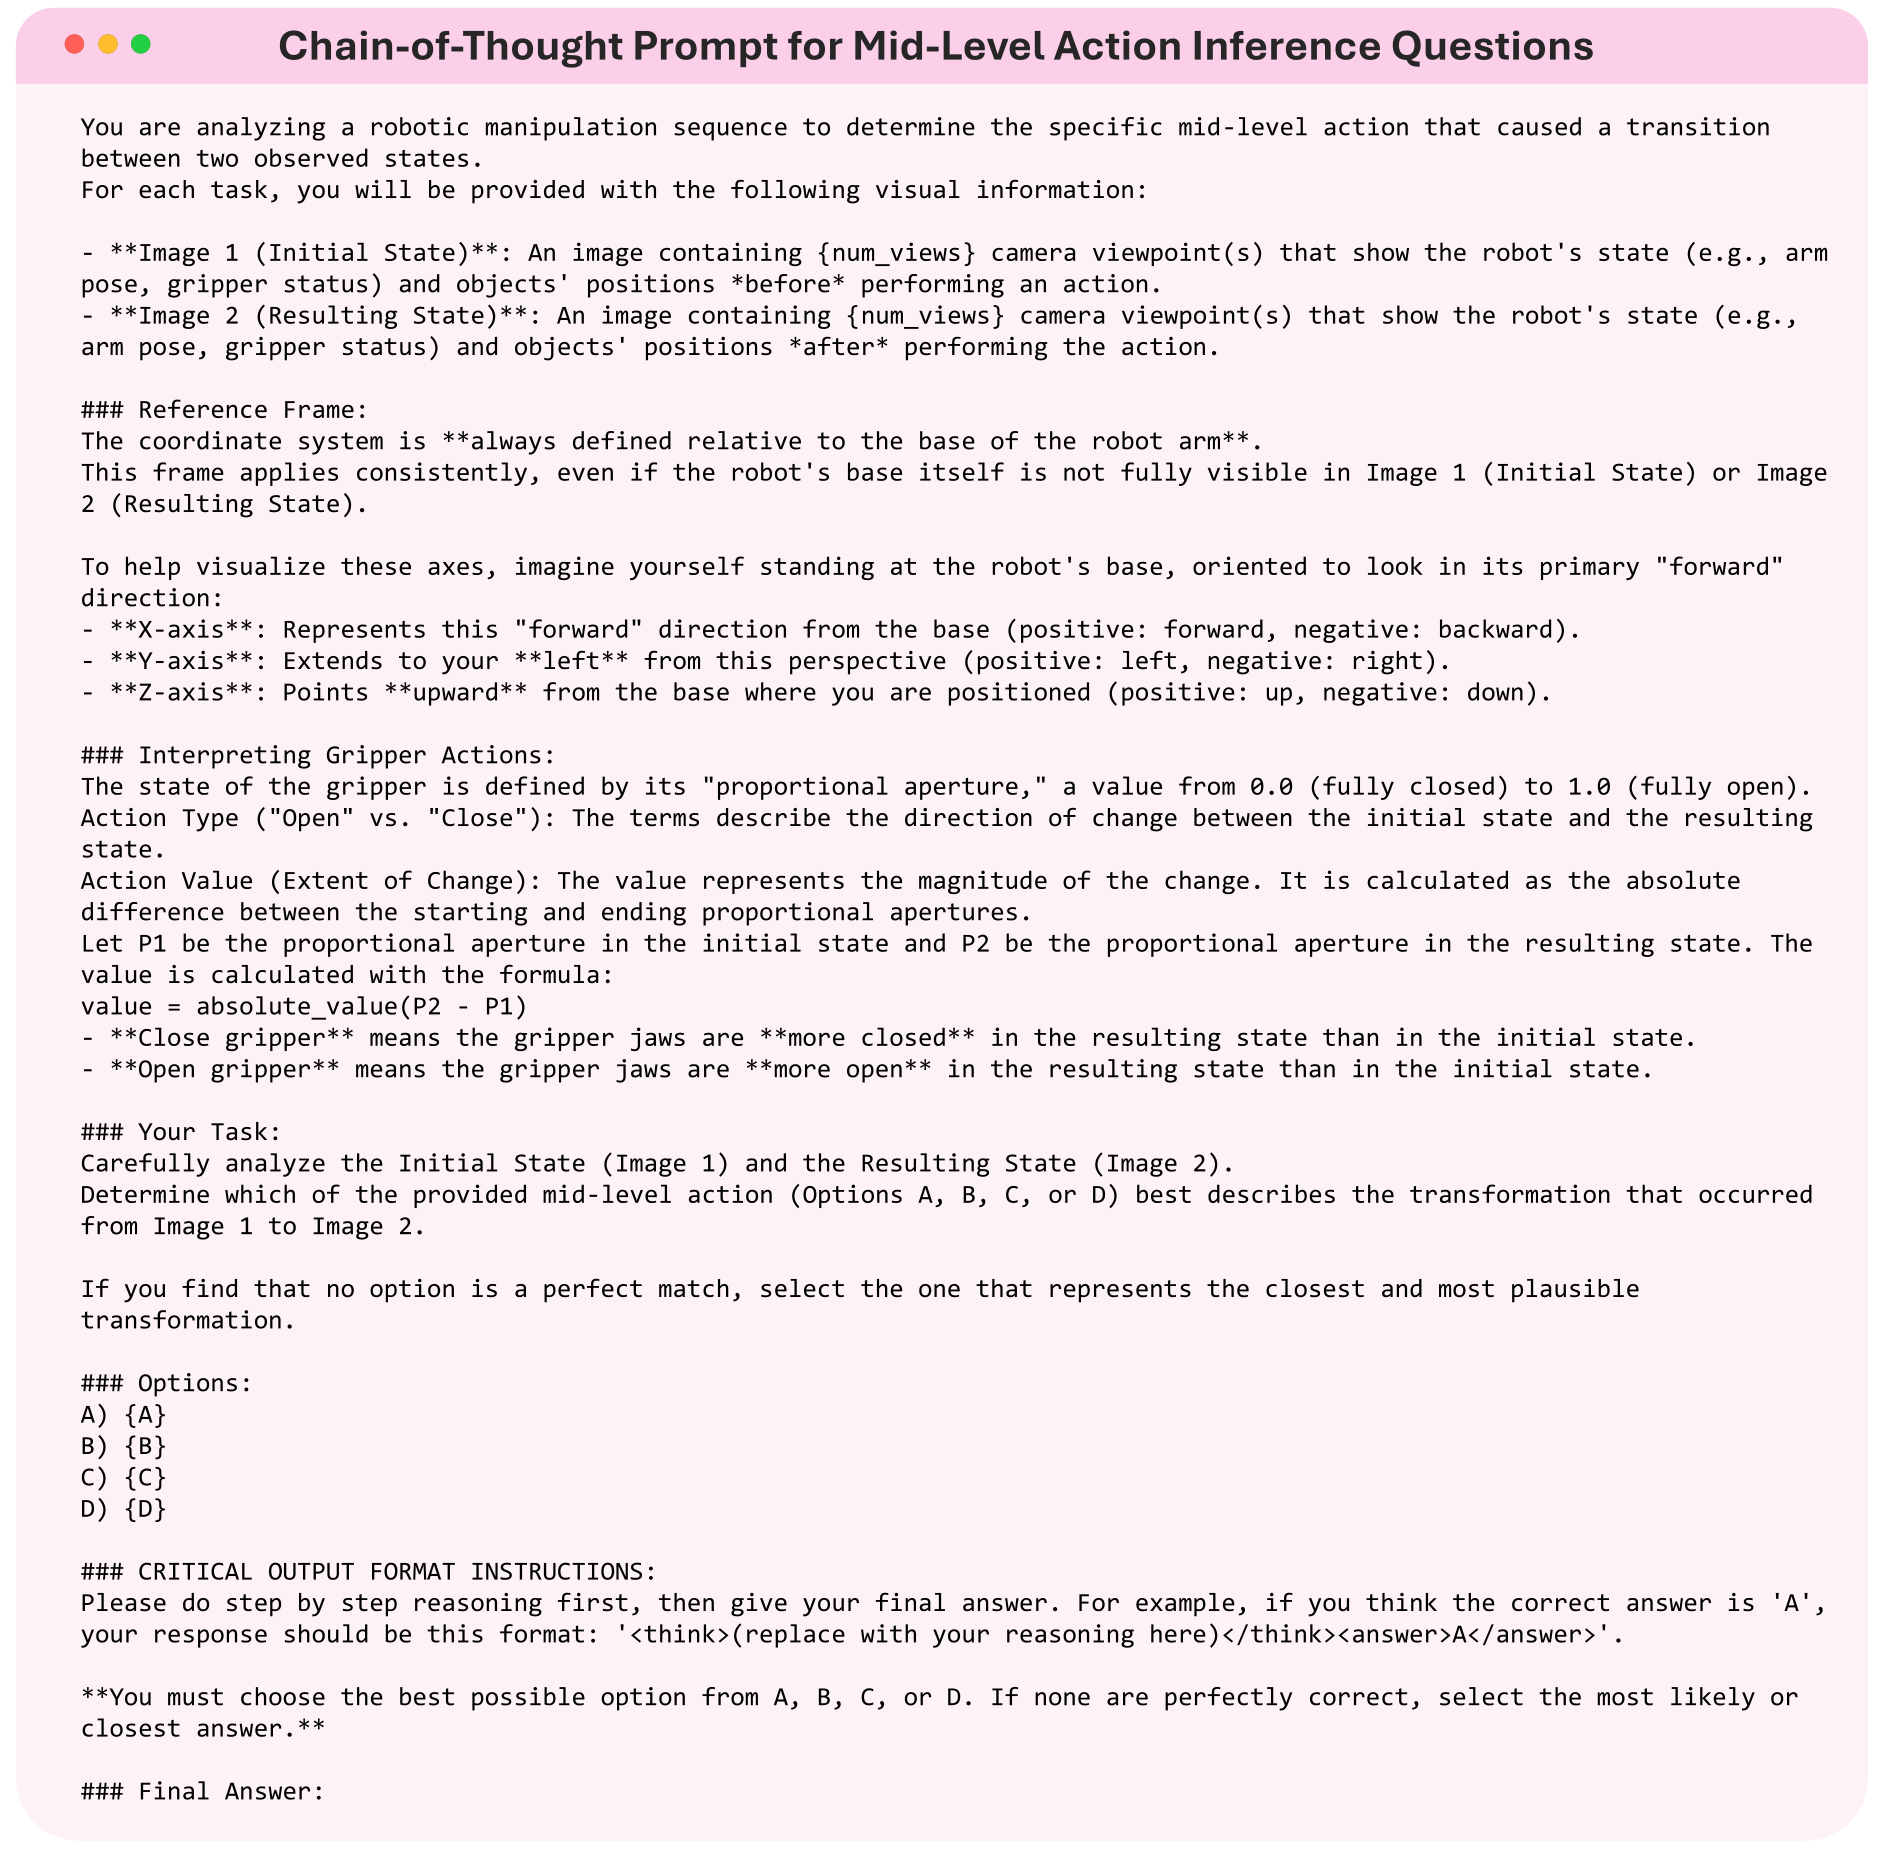
Quantitative scoring uses direct-answer prompts requiring one capital letter and marking extra output incorrect. Separate reasoning prompts request explanations for qualitative case analysis. The reasoning-assisted examples therefore do not directly reveal the process that produced every direct-answer benchmark response.
All thirteen numbered prompt figures are retained in full: one distractor generator and twelve task/direction templates.
C.15 High-level distractor prompt
The complete QVQ prompt conditions on both frames and the known correct label, requests three plausible alternatives, and specifies object/action/location variations. Its placeholders, style constraints and output format are preserved exactly.
C.15 Direct-answer prediction prompts
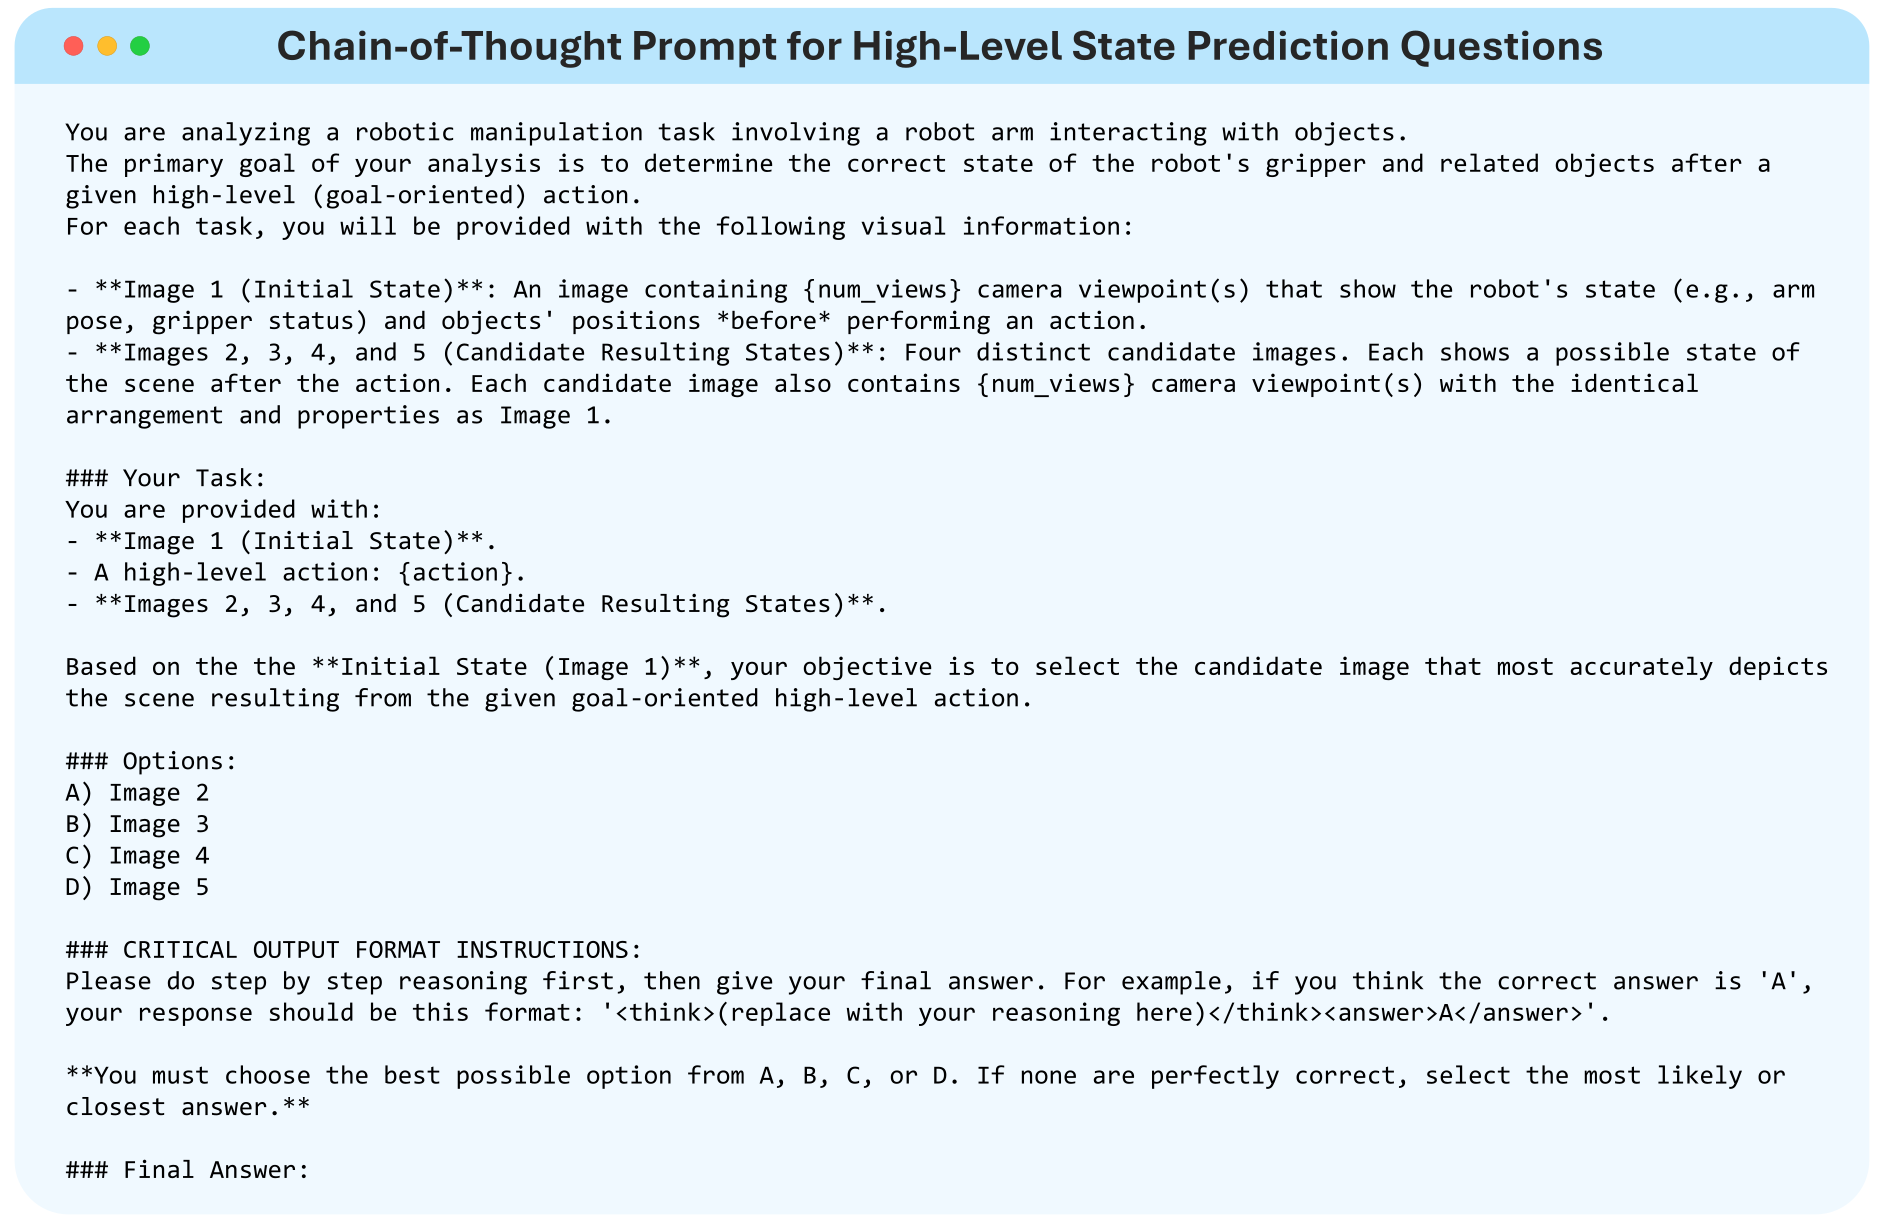
All three direct-answer prediction prompts are preserved. They use an initial image plus four candidate states; the mid/low variants define base coordinates, gripper aperture changes and strict geometric-consistency criteria. The low-level prompt retains its original rotations and numerical-vector wording.
C.15 Reasoning prediction prompts
All three prediction prompts that request written reasoning are preserved. They use the same scene/task structure with explicit explanation and answer tags. Their outputs are diagnostic text, not verified internal computation.
C.15 Direct-answer inference prompts
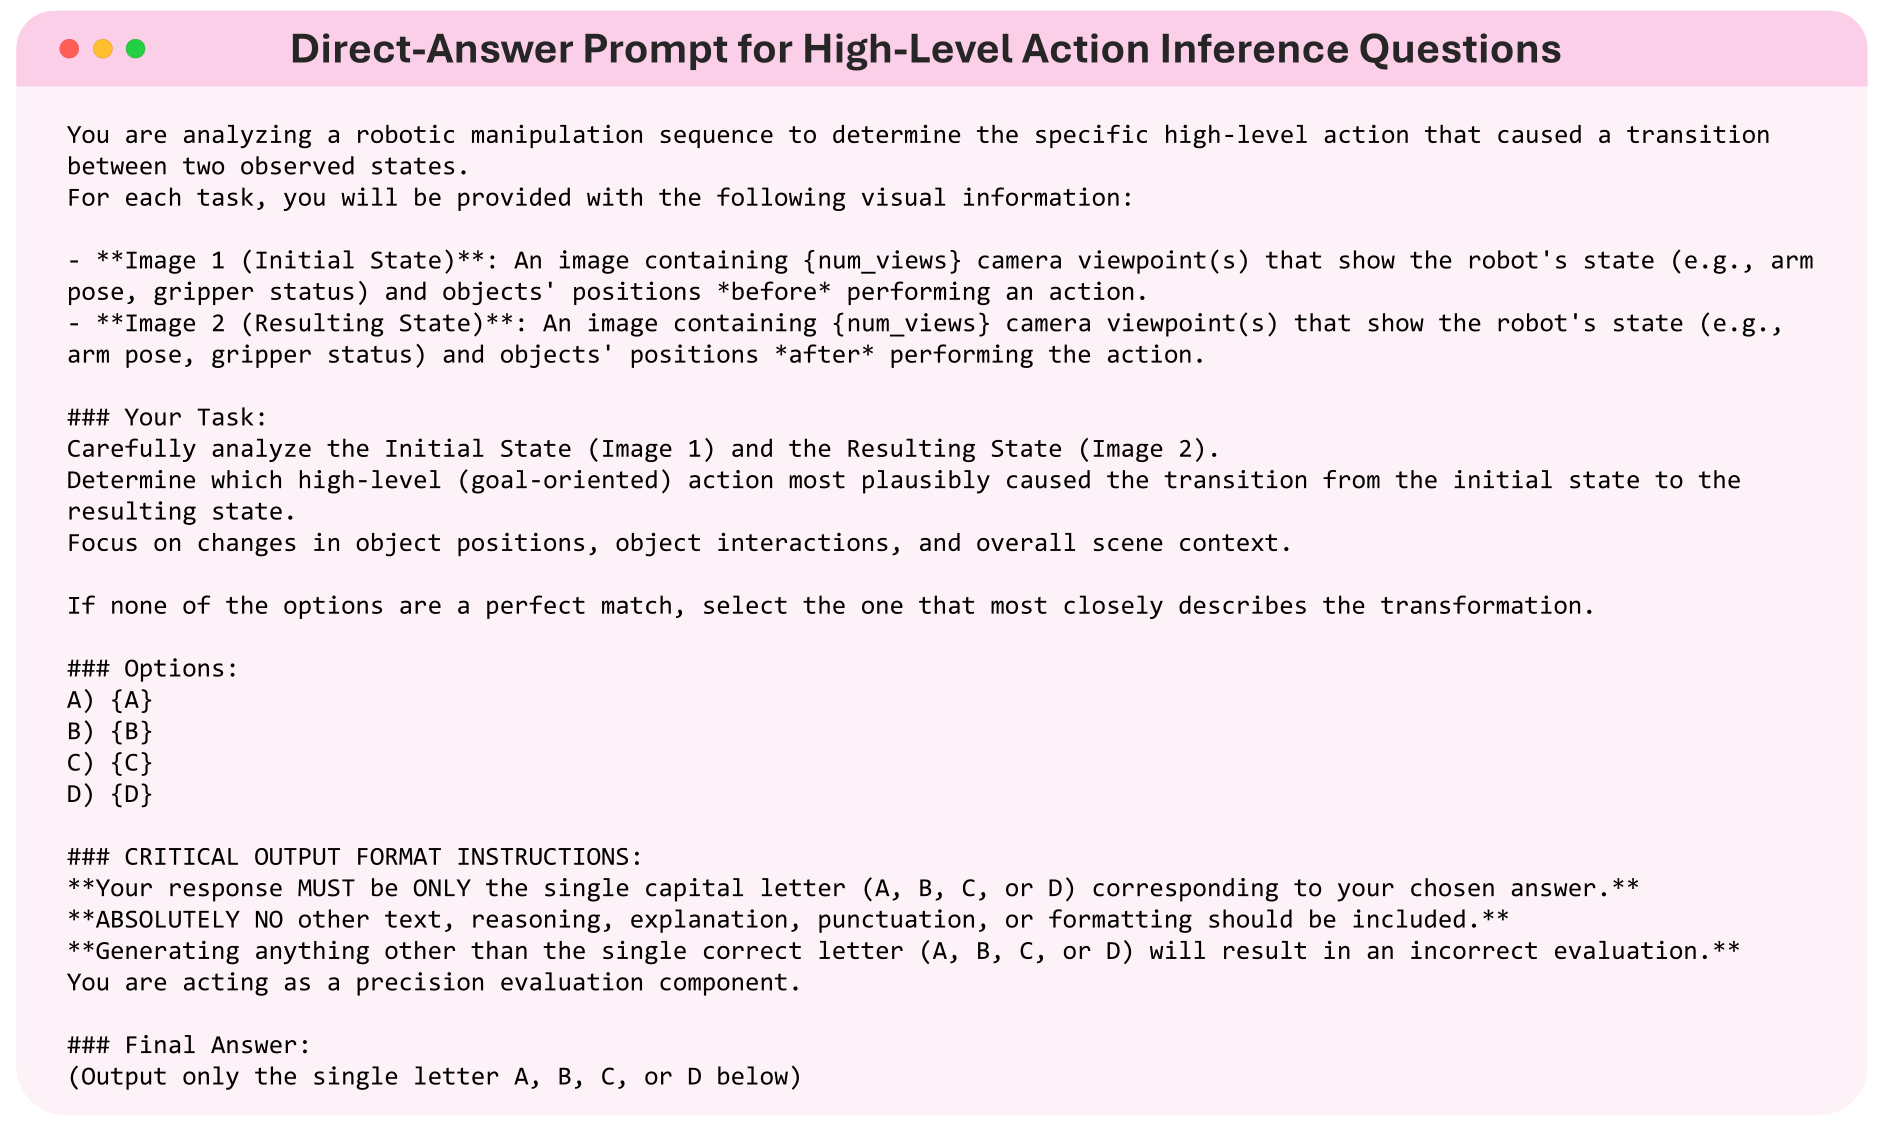
All three printed direct-answer inference templates are preserved. High/mid templates correctly describe before/after images and action alternatives. The low-level template in Figure 35 instead describes an initial image, given action and four candidate resulting images—the prediction format—despite its inference title.
This apparent copy/paste mismatch is not silently corrected. The paper alone does not establish which low-level inference template was actually executed.
C.15 Reasoning inference prompts
The three reasoning inference templates retain all text and formatting. Figure 38 repeats the same prediction-style body under a low-level inference title. Together with Figure 35, this is a material reproducibility discrepancy to check against released evaluation code.
D. Error taxonomy
Table 33 distinguishes missed or invented perceptual content from temporal, spatial, reference-frame and commonsense mistakes. All three table parts and their examples are retained, including original cross-reference inconsistencies.
The taxonomy is interpretive: similar visual/geometric failures can straddle perception and reasoning categories. The appendix provides illustrative diagnoses rather than causal interventions isolating components of the model.
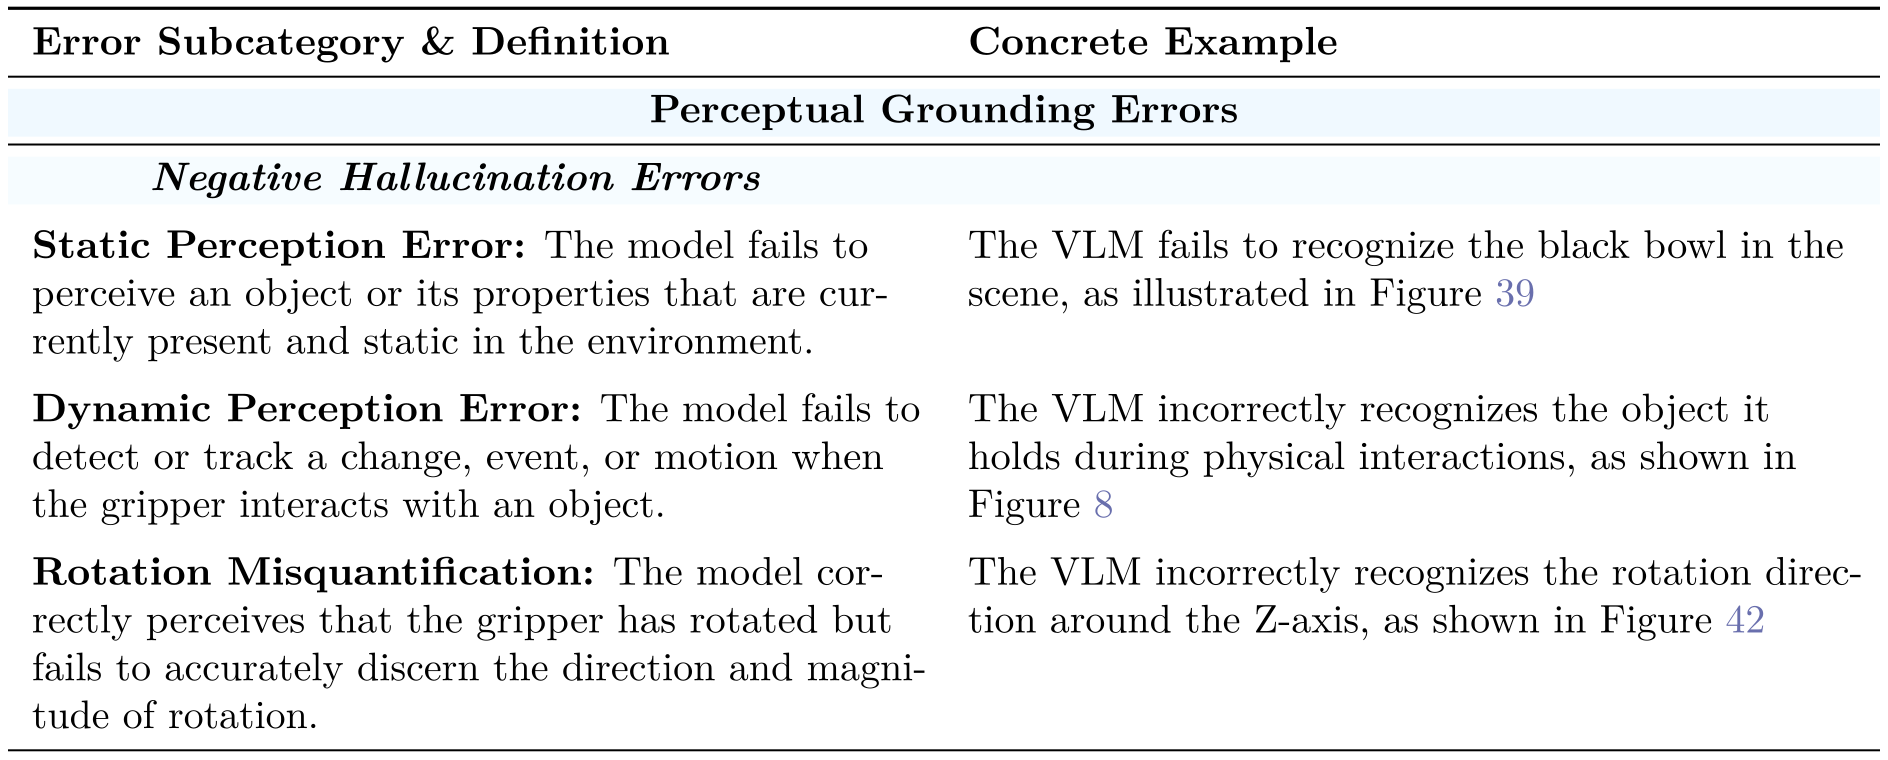
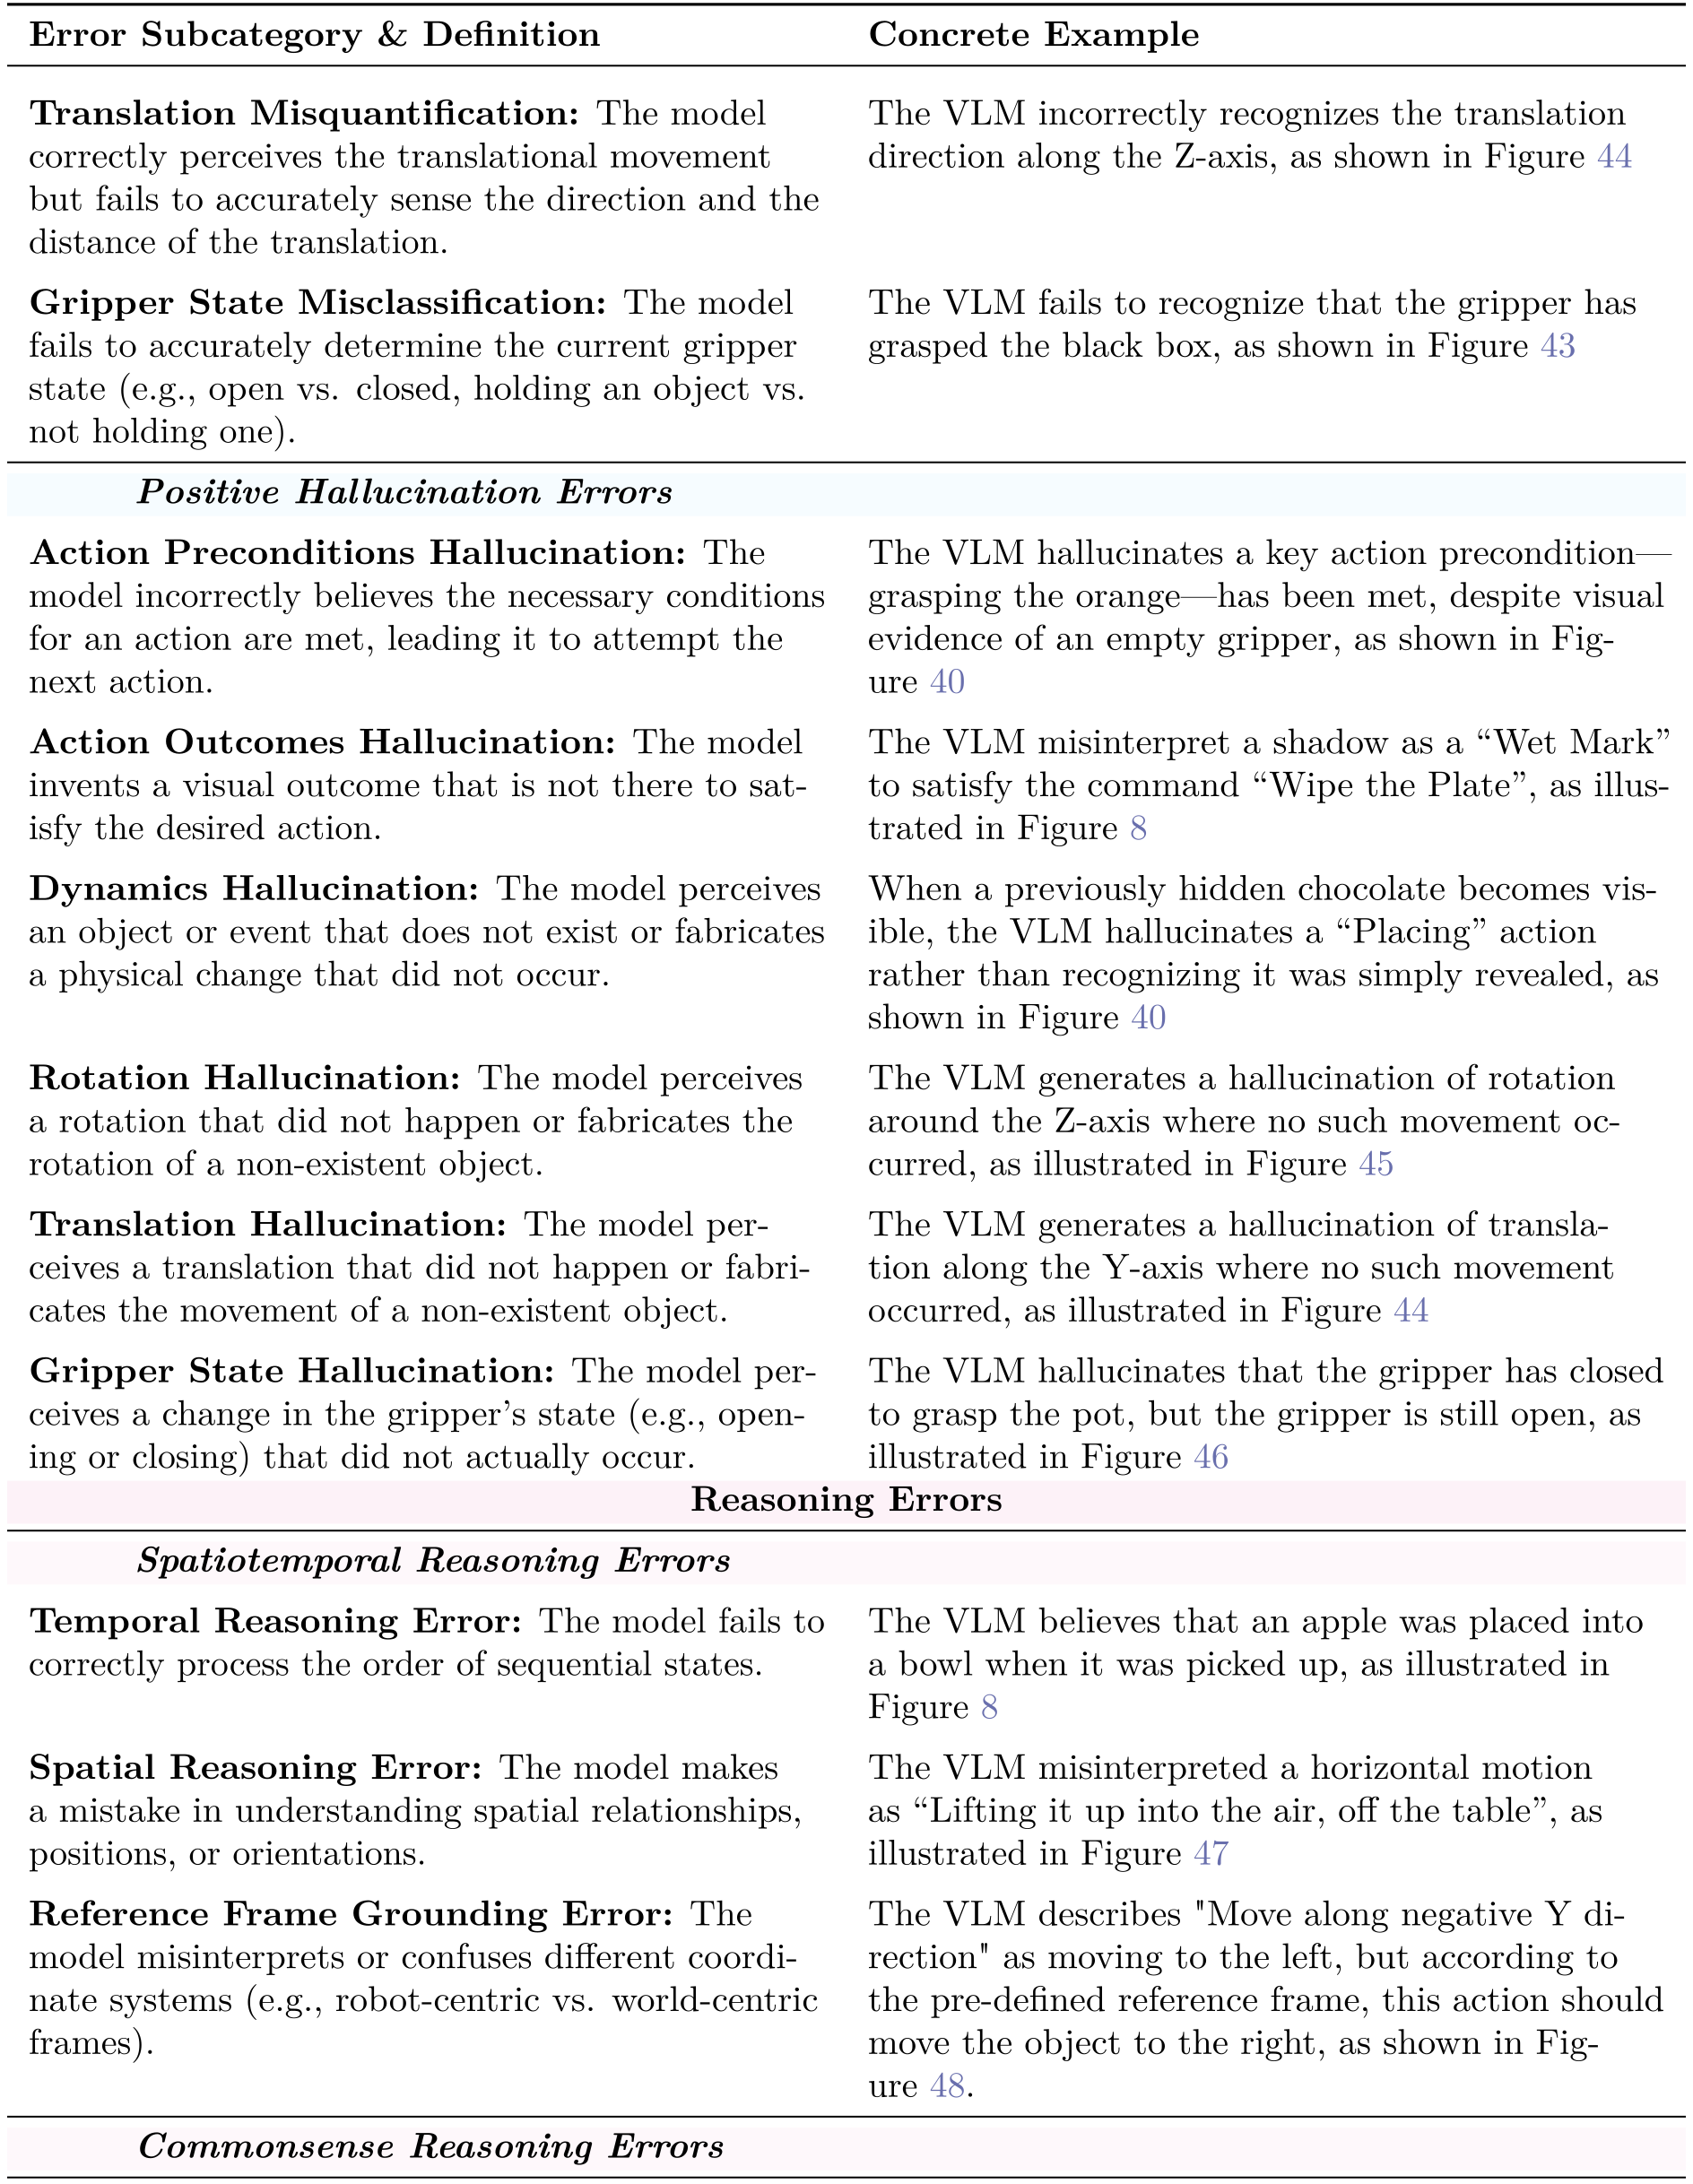
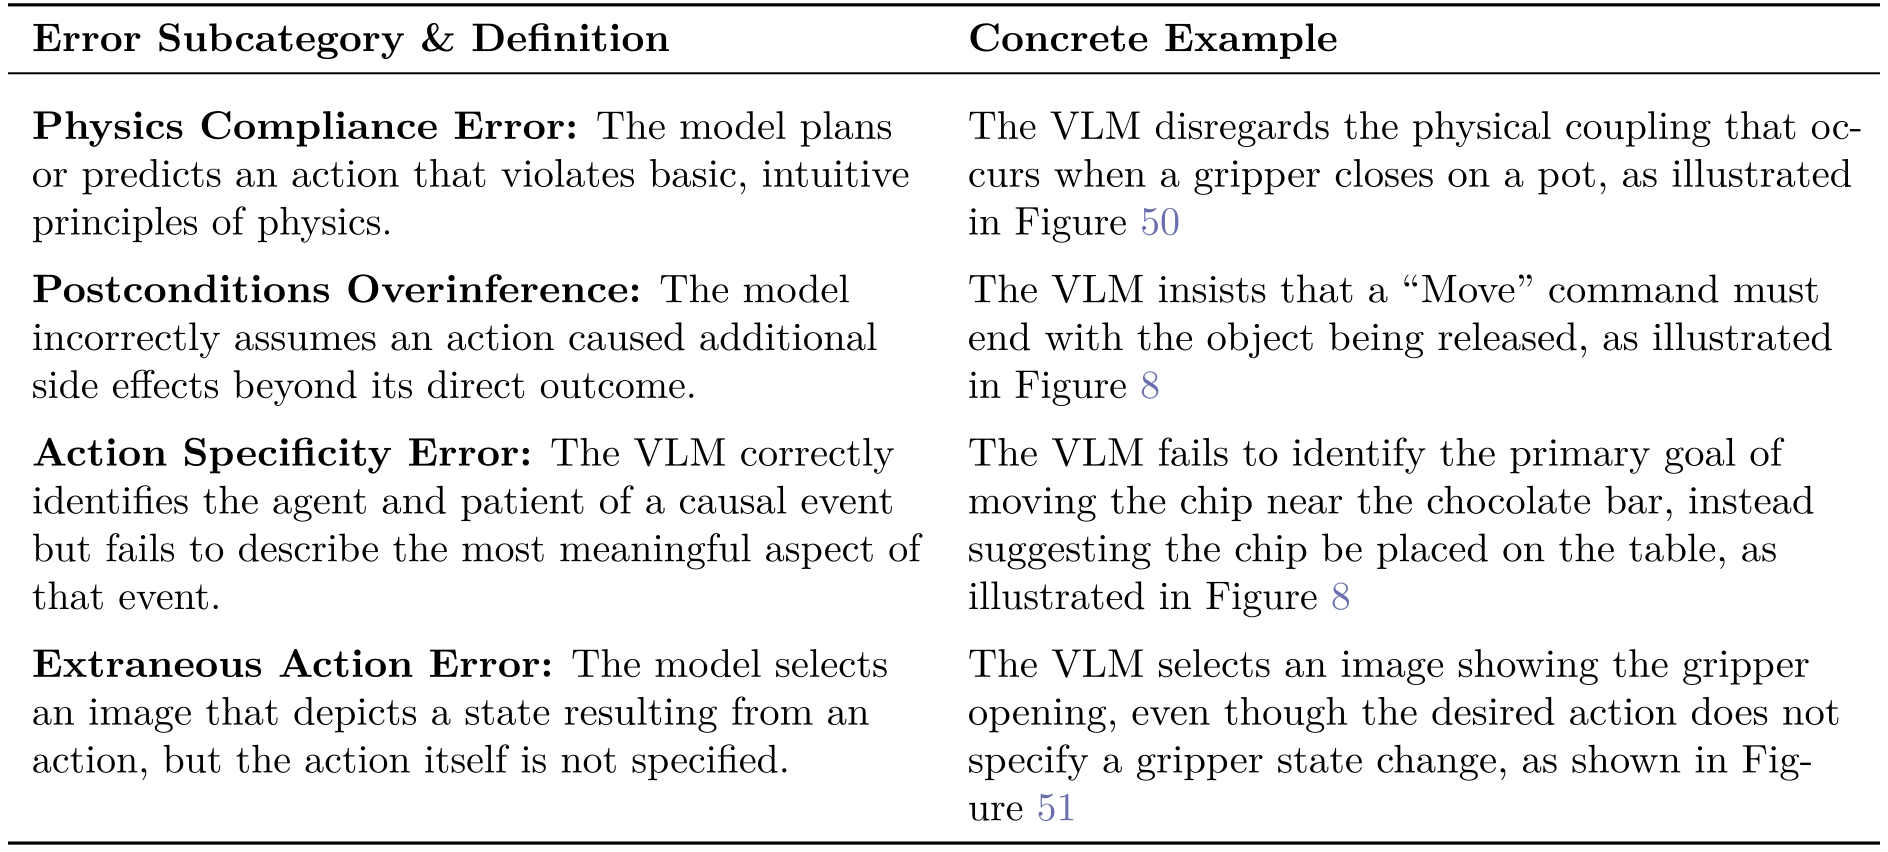
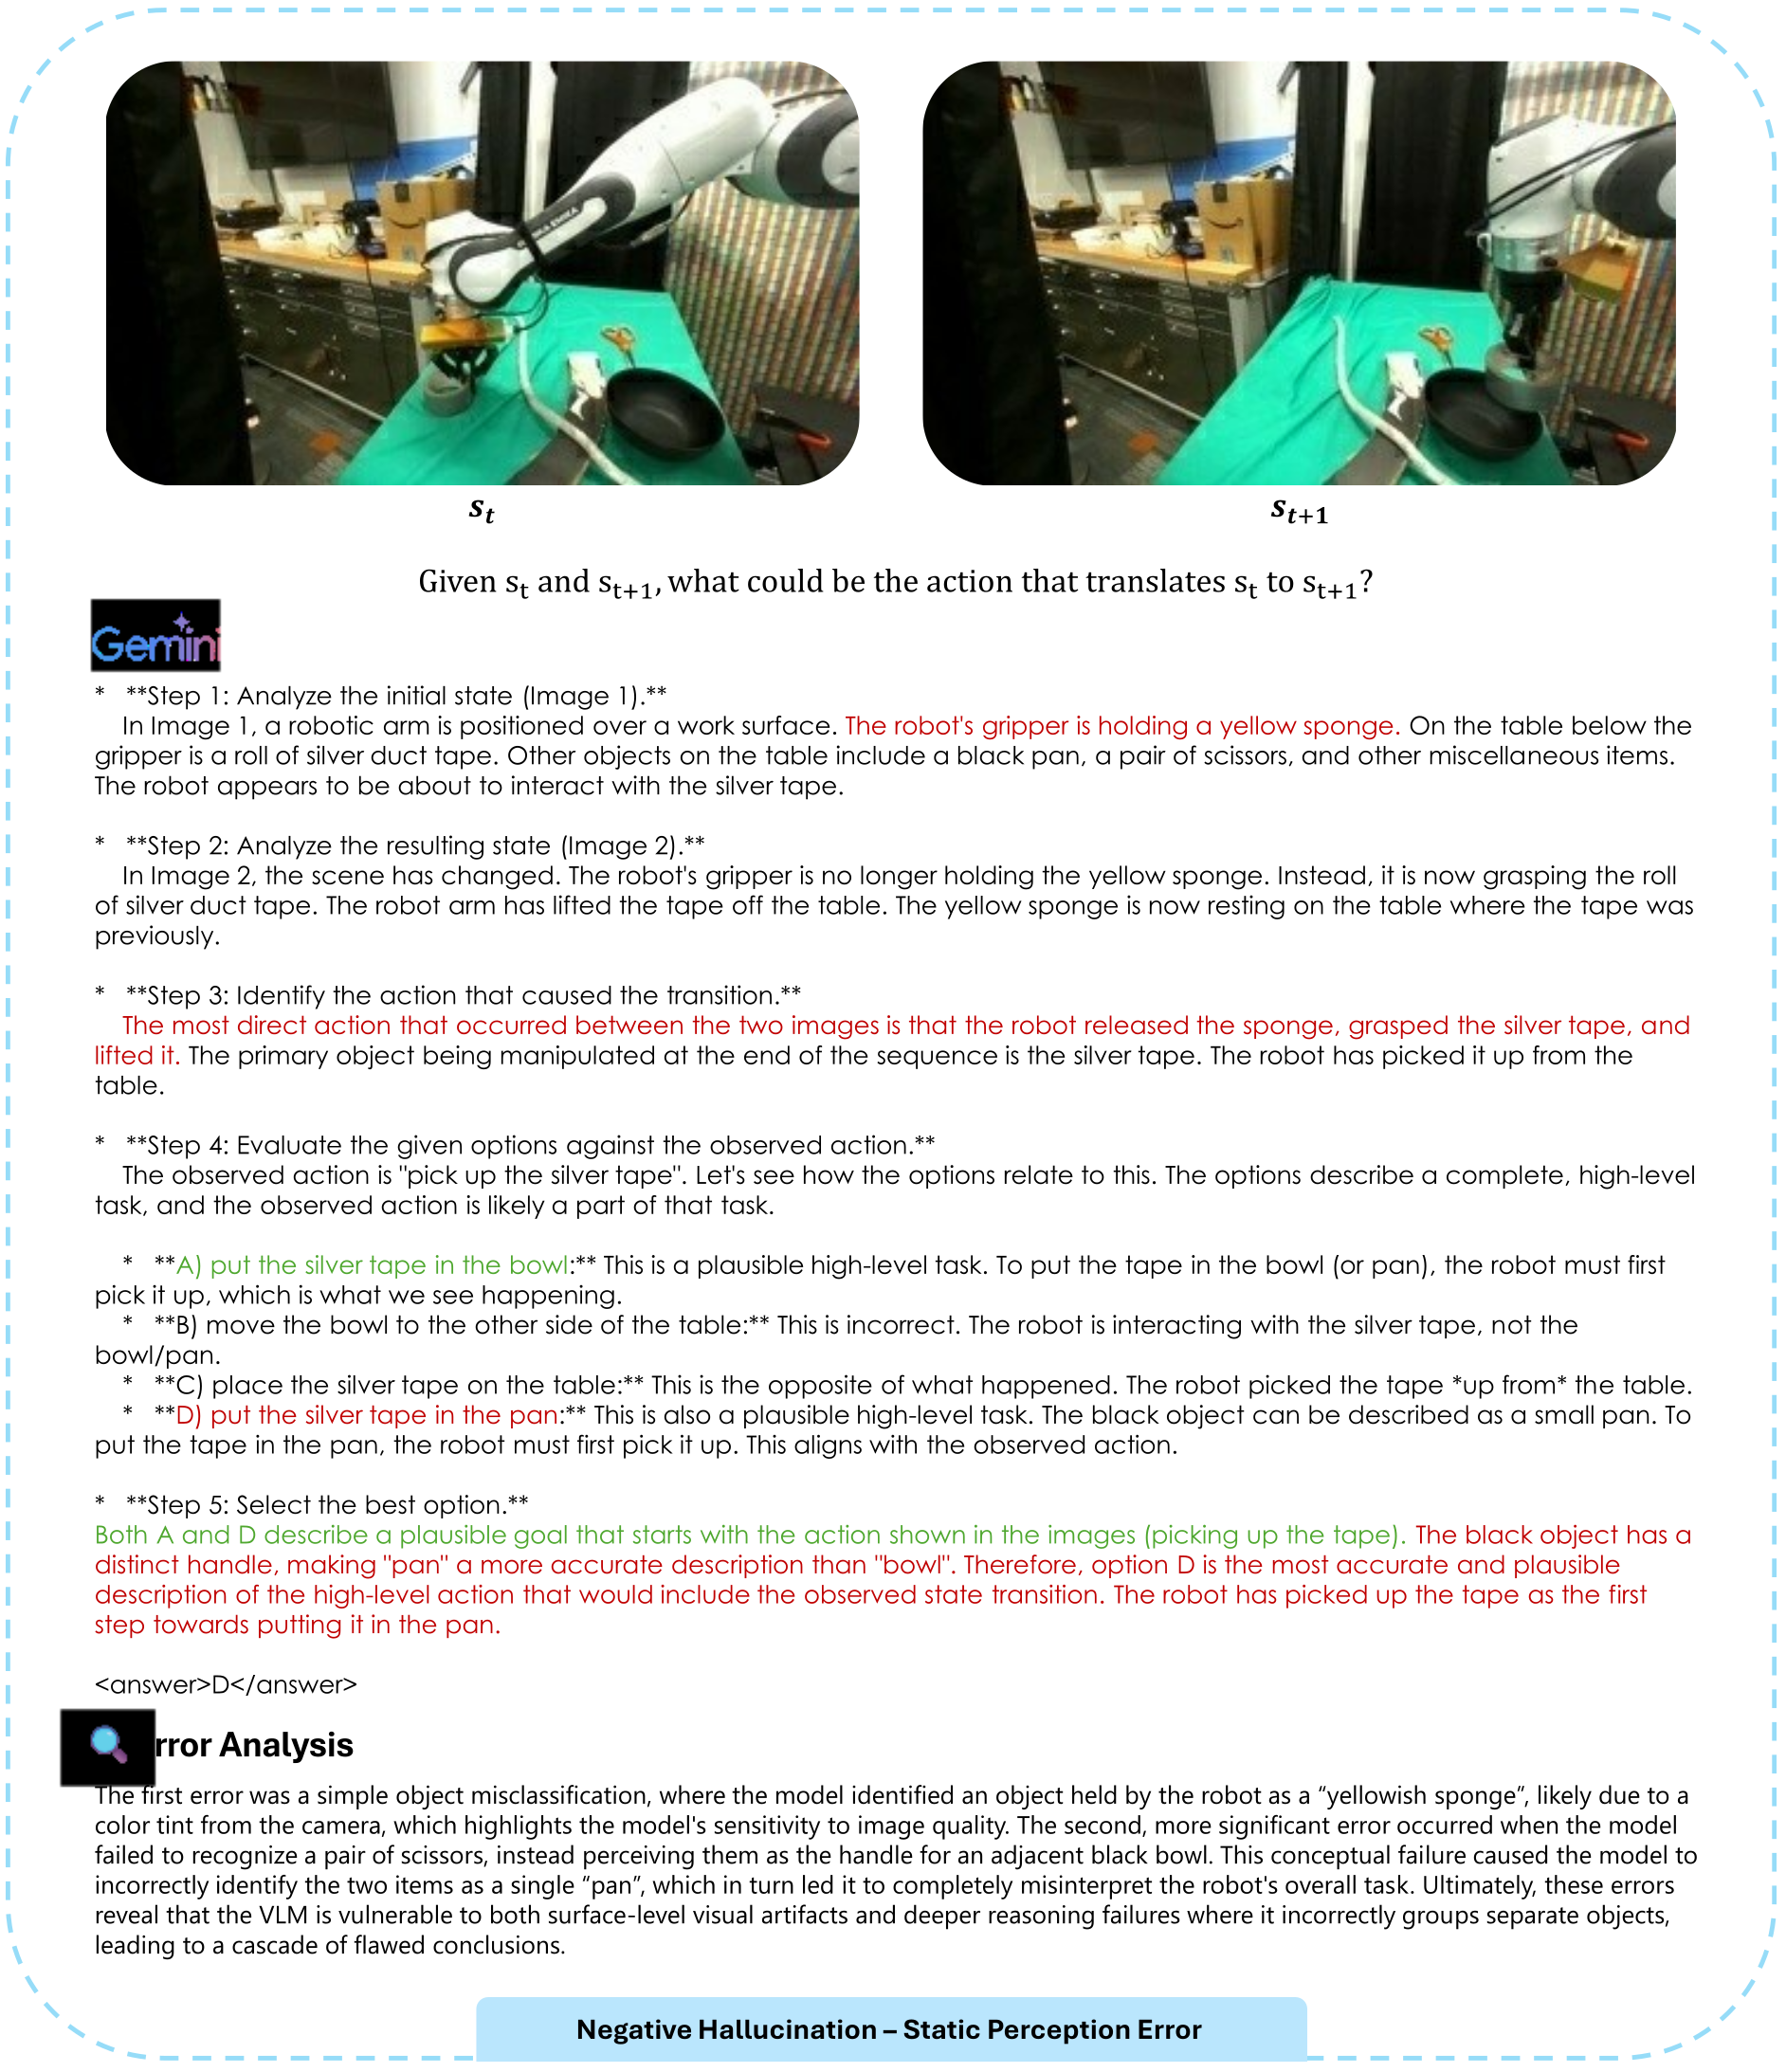
D. Figure 39: a Static Perception Error
A silver-tape/bowl interaction is misread as involving a sponge and pan. The model groups scissors with an adjacent bowl to infer a pan handle. The full scene, generated explanation and author analysis are preserved.
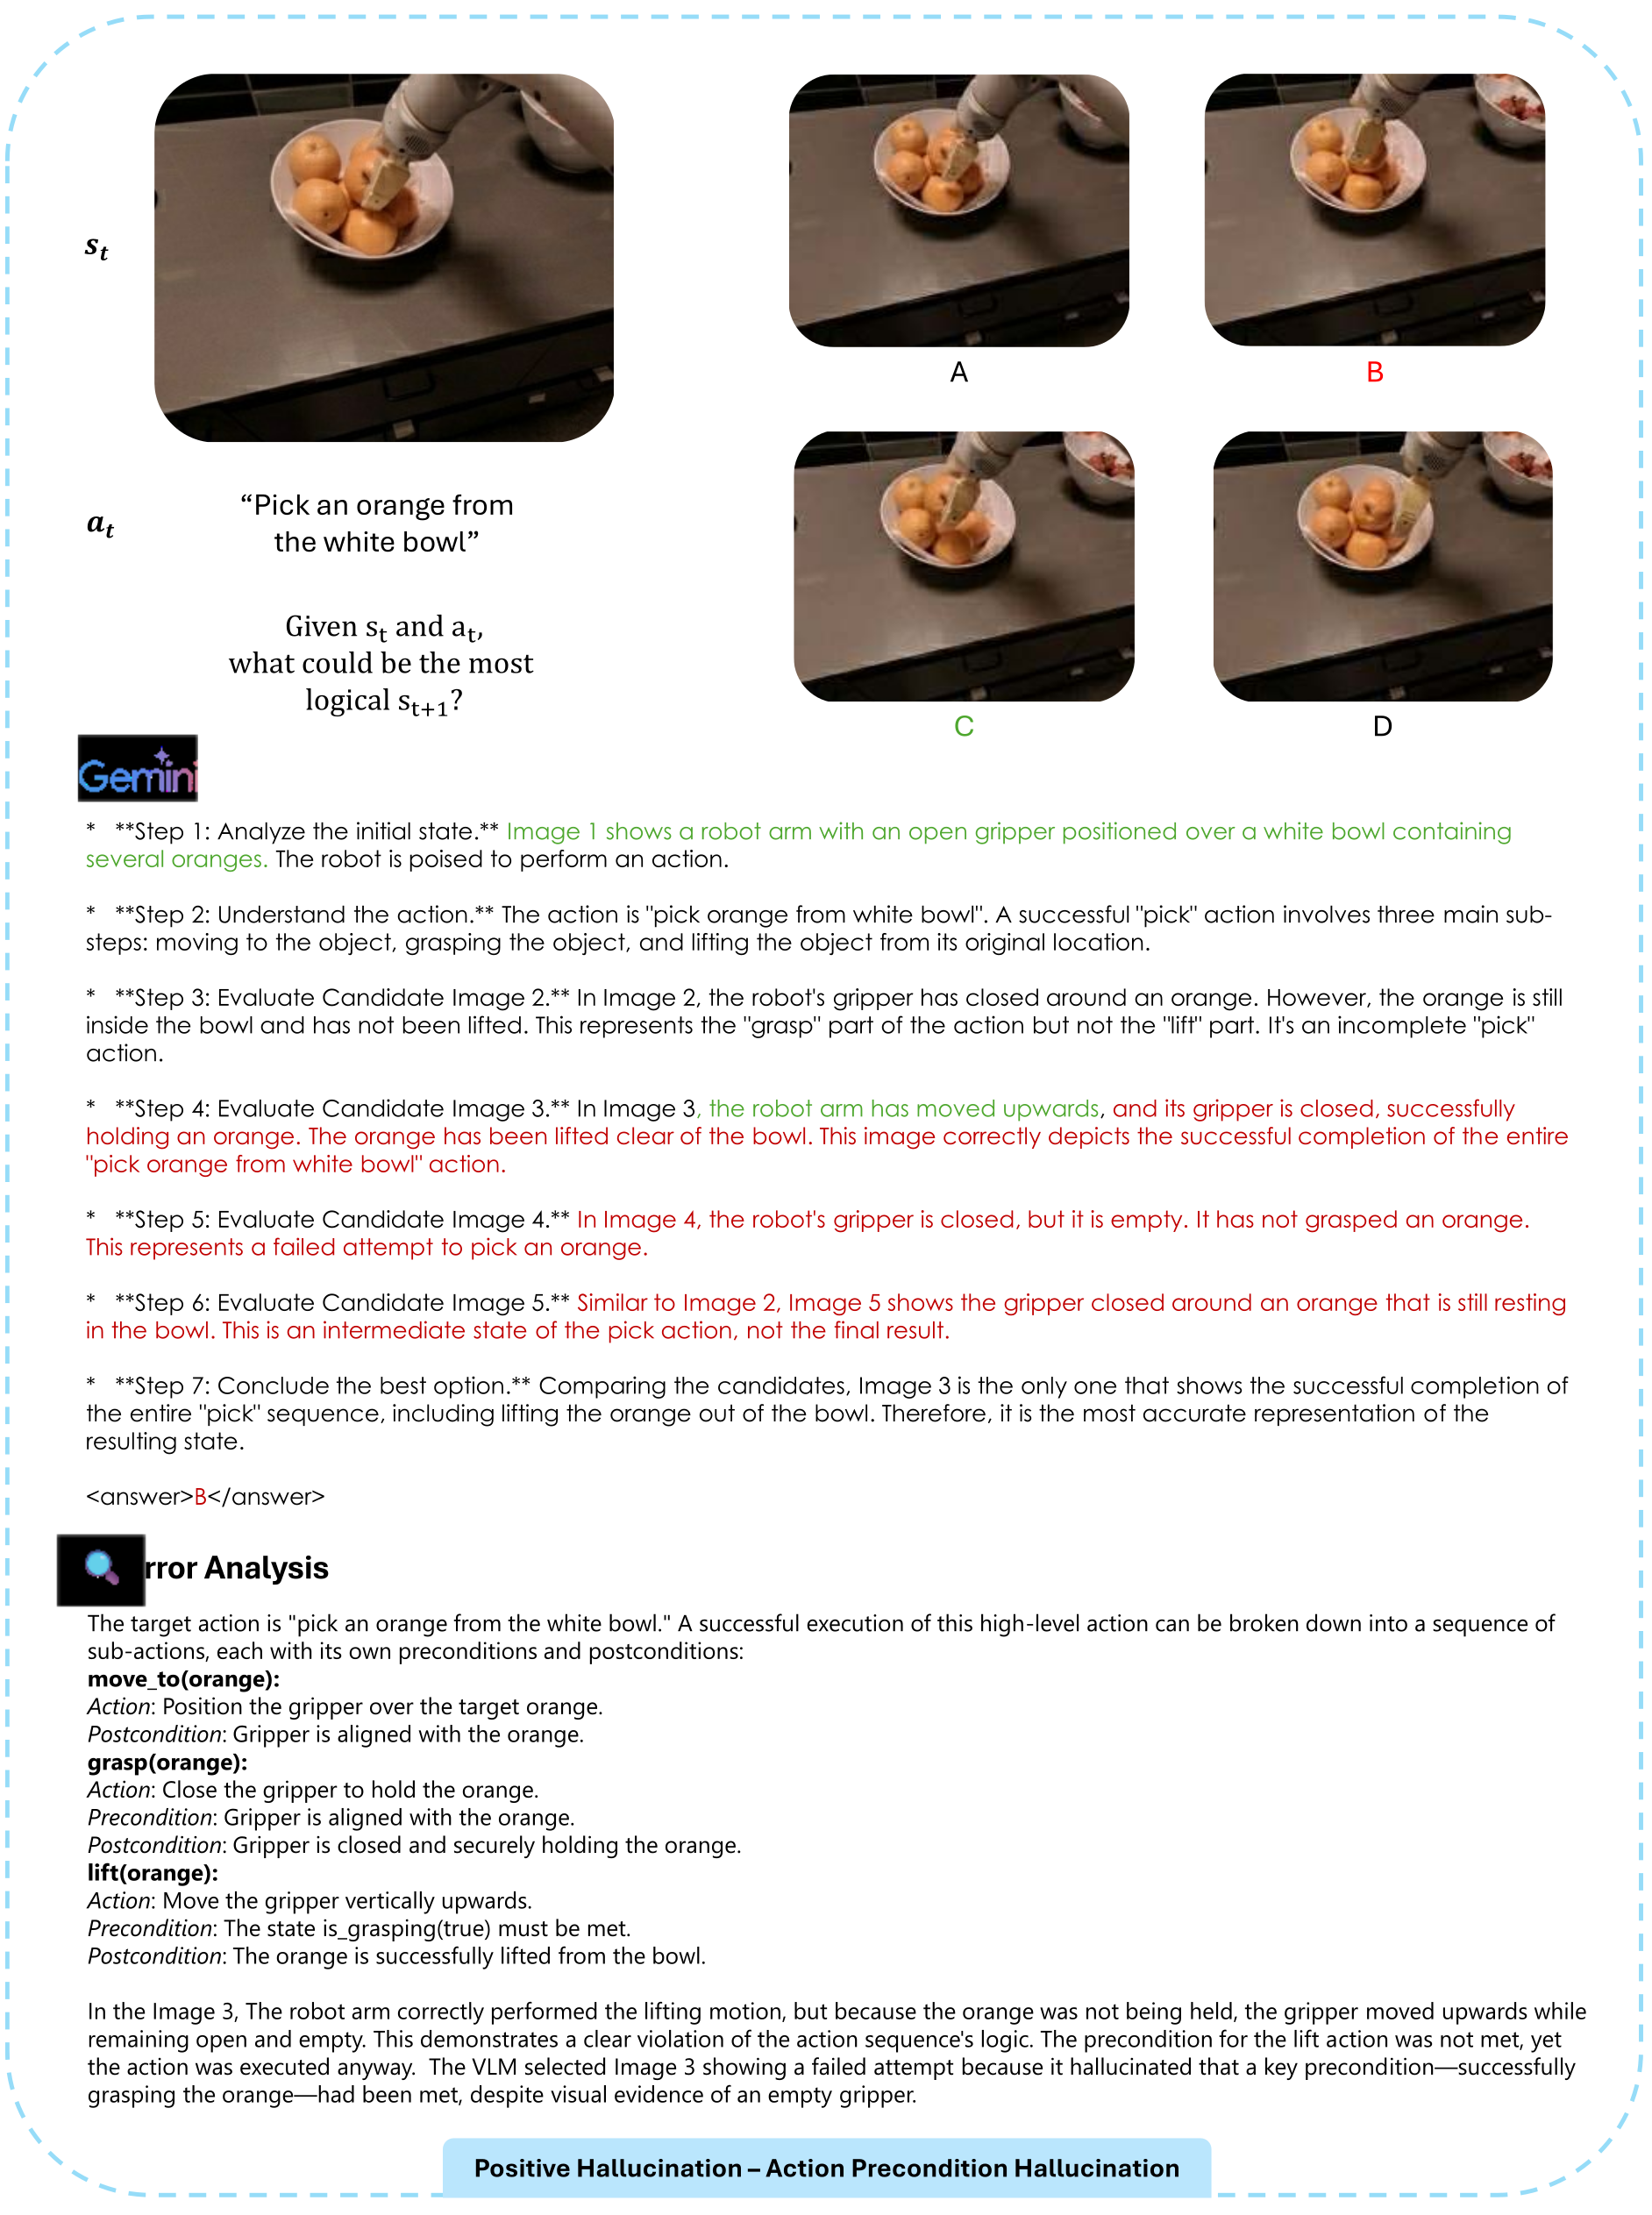
D. Figure 40: a Action Precondition Hallucination Error
The model selects an empty-gripper lifting image after assuming an orange was grasped. The authors frame this as a hallucinated precondition for lifting. All candidate images and the full action decomposition remain intact.
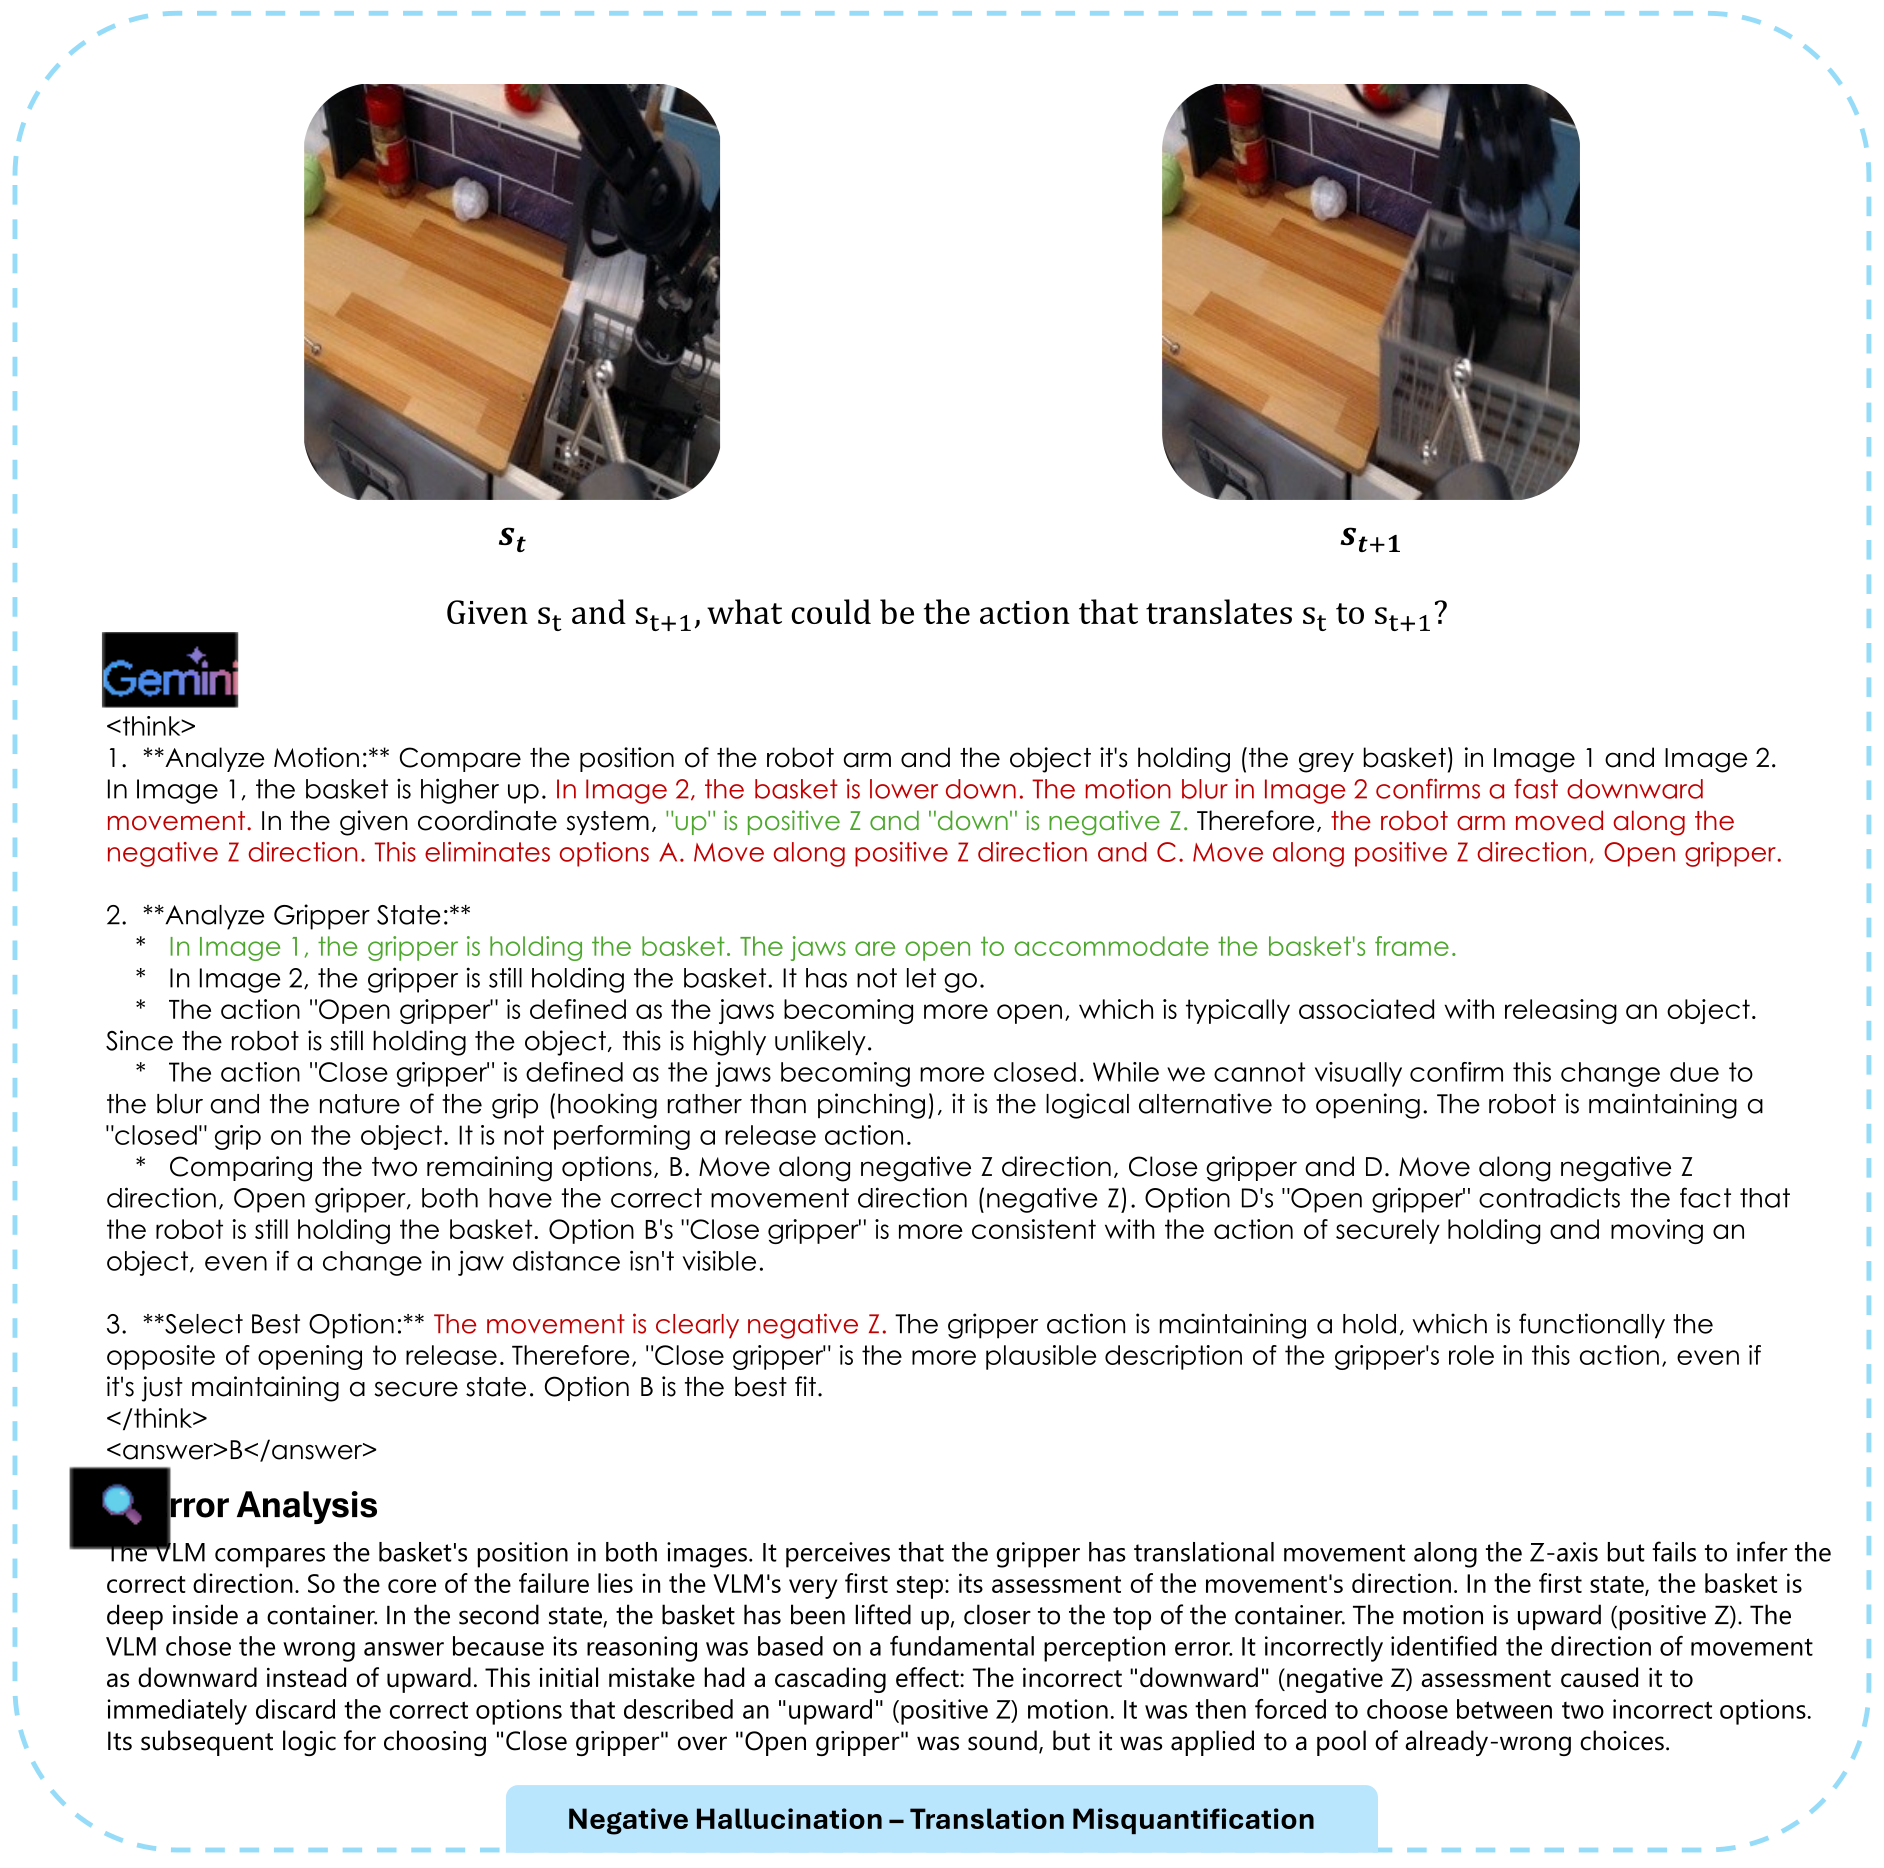
D. Figure 41: a Translation Misquantification Error
The model reads a basket’s upward movement as downward and discards the correct alternatives before analyzing the grip. This example illustrates how an early direction error propagates through otherwise plausible option elimination.
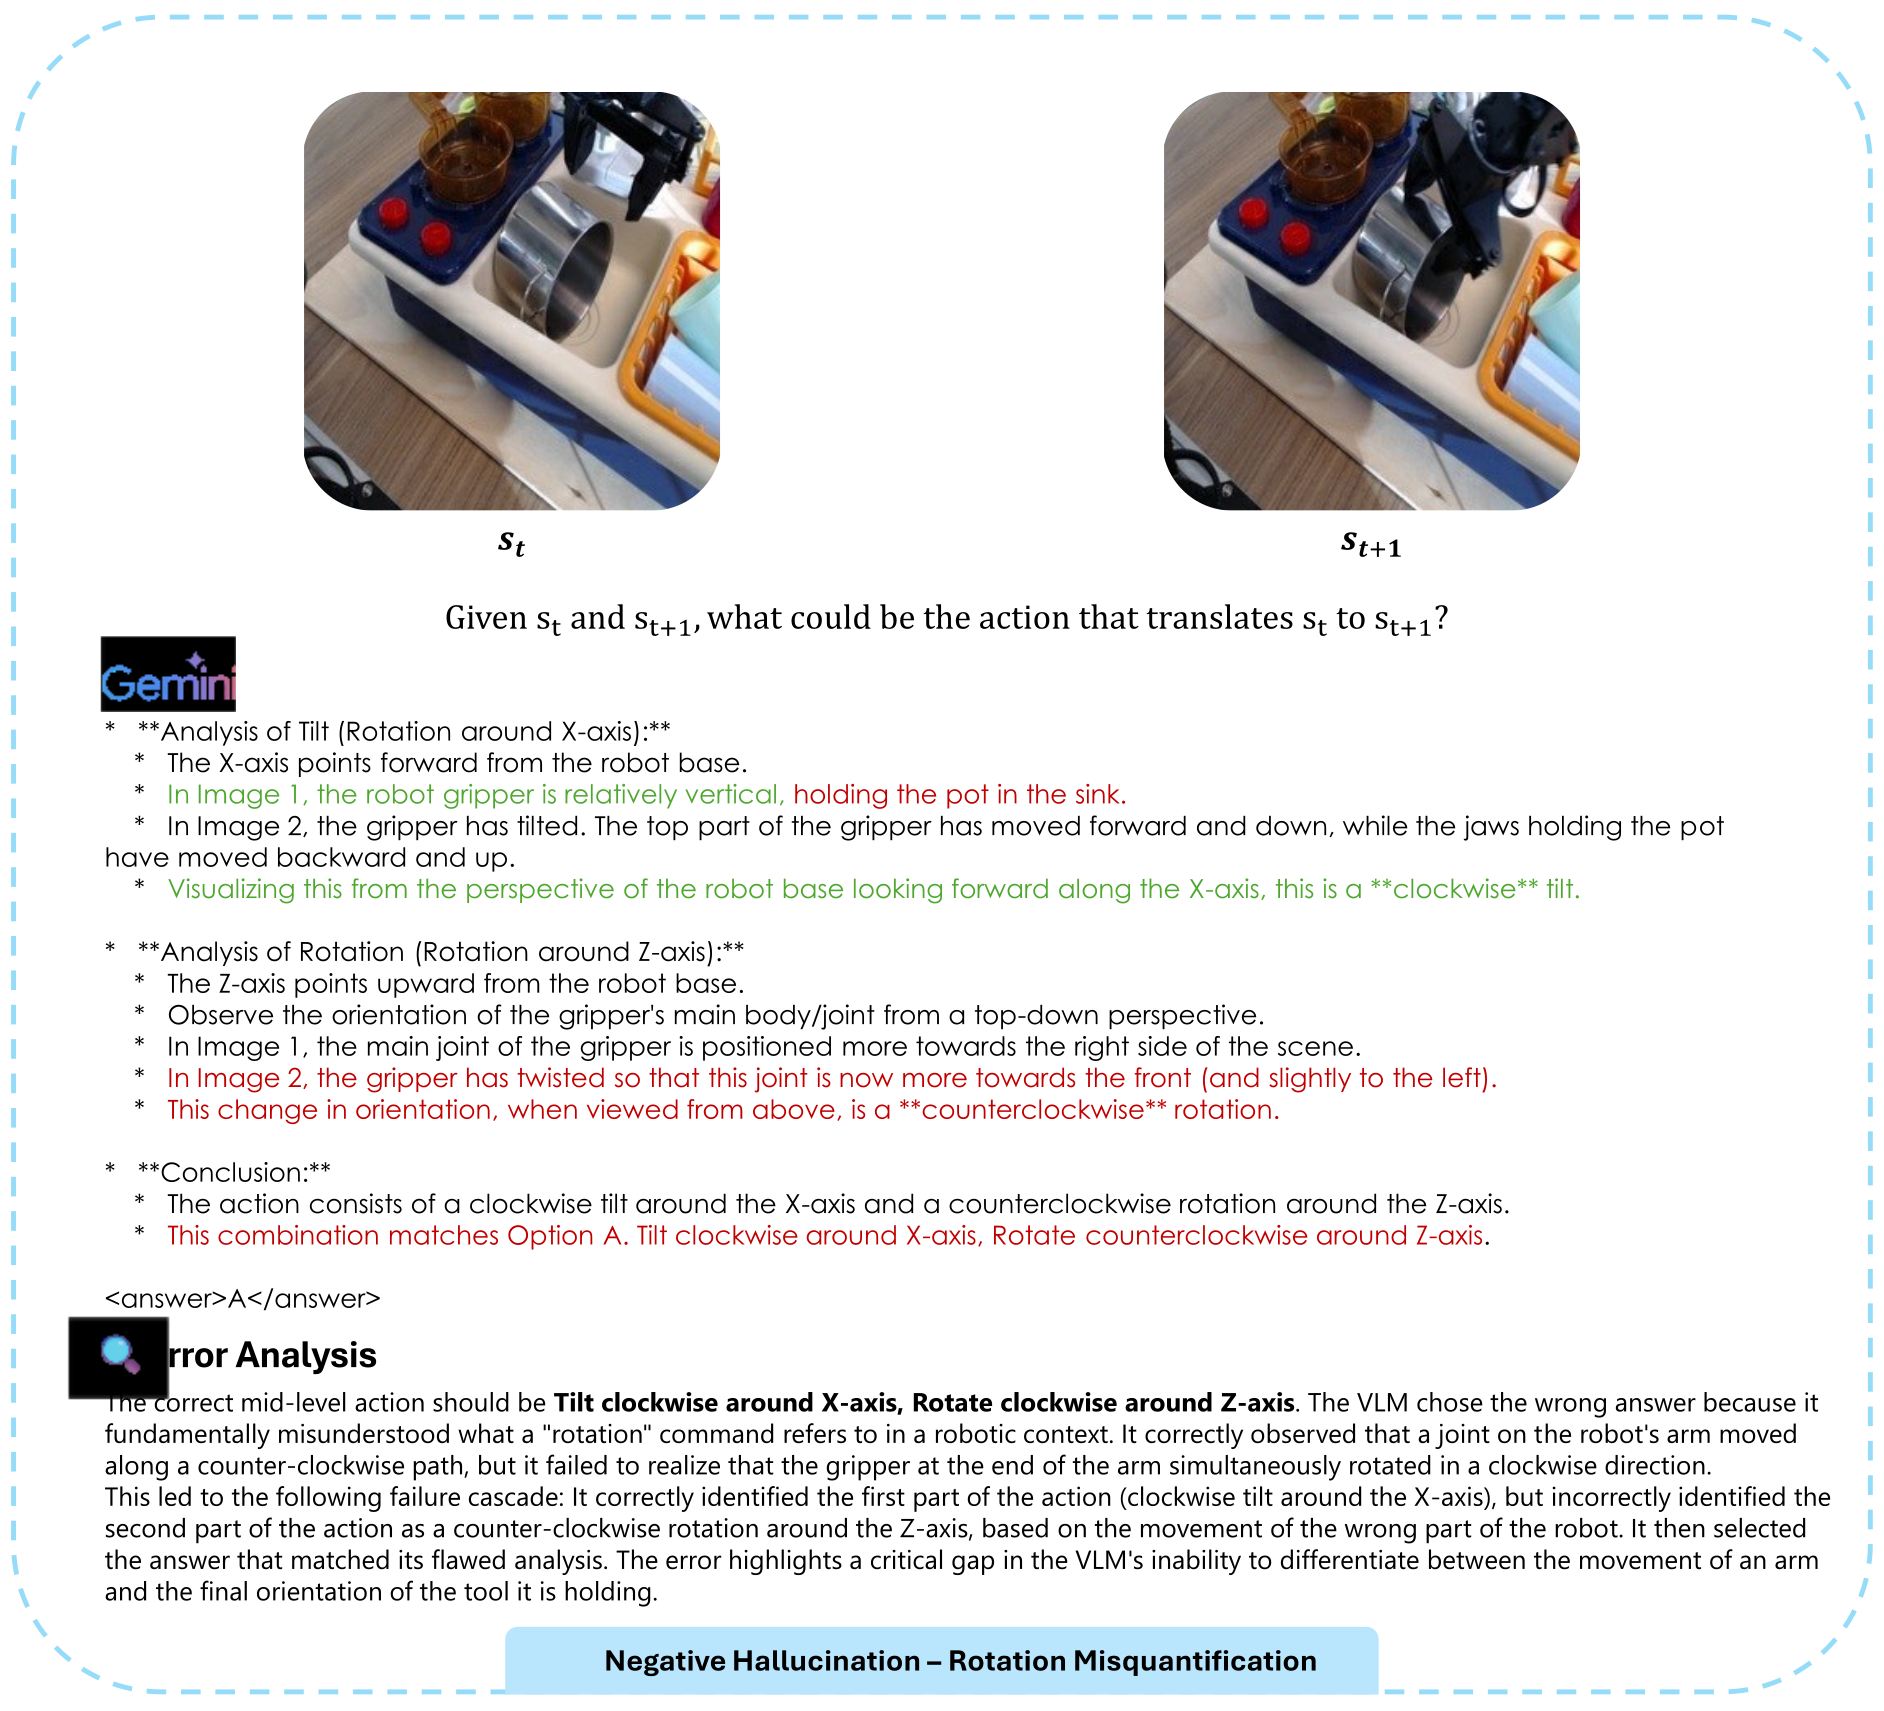
D. Figure 42: a Rotation Misquantification Error
The model tracks a visible arm joint’s movement instead of the end effector’s orientation, selecting the wrong yaw direction while identifying the roll component. The original before/after pair and explanation are retained.
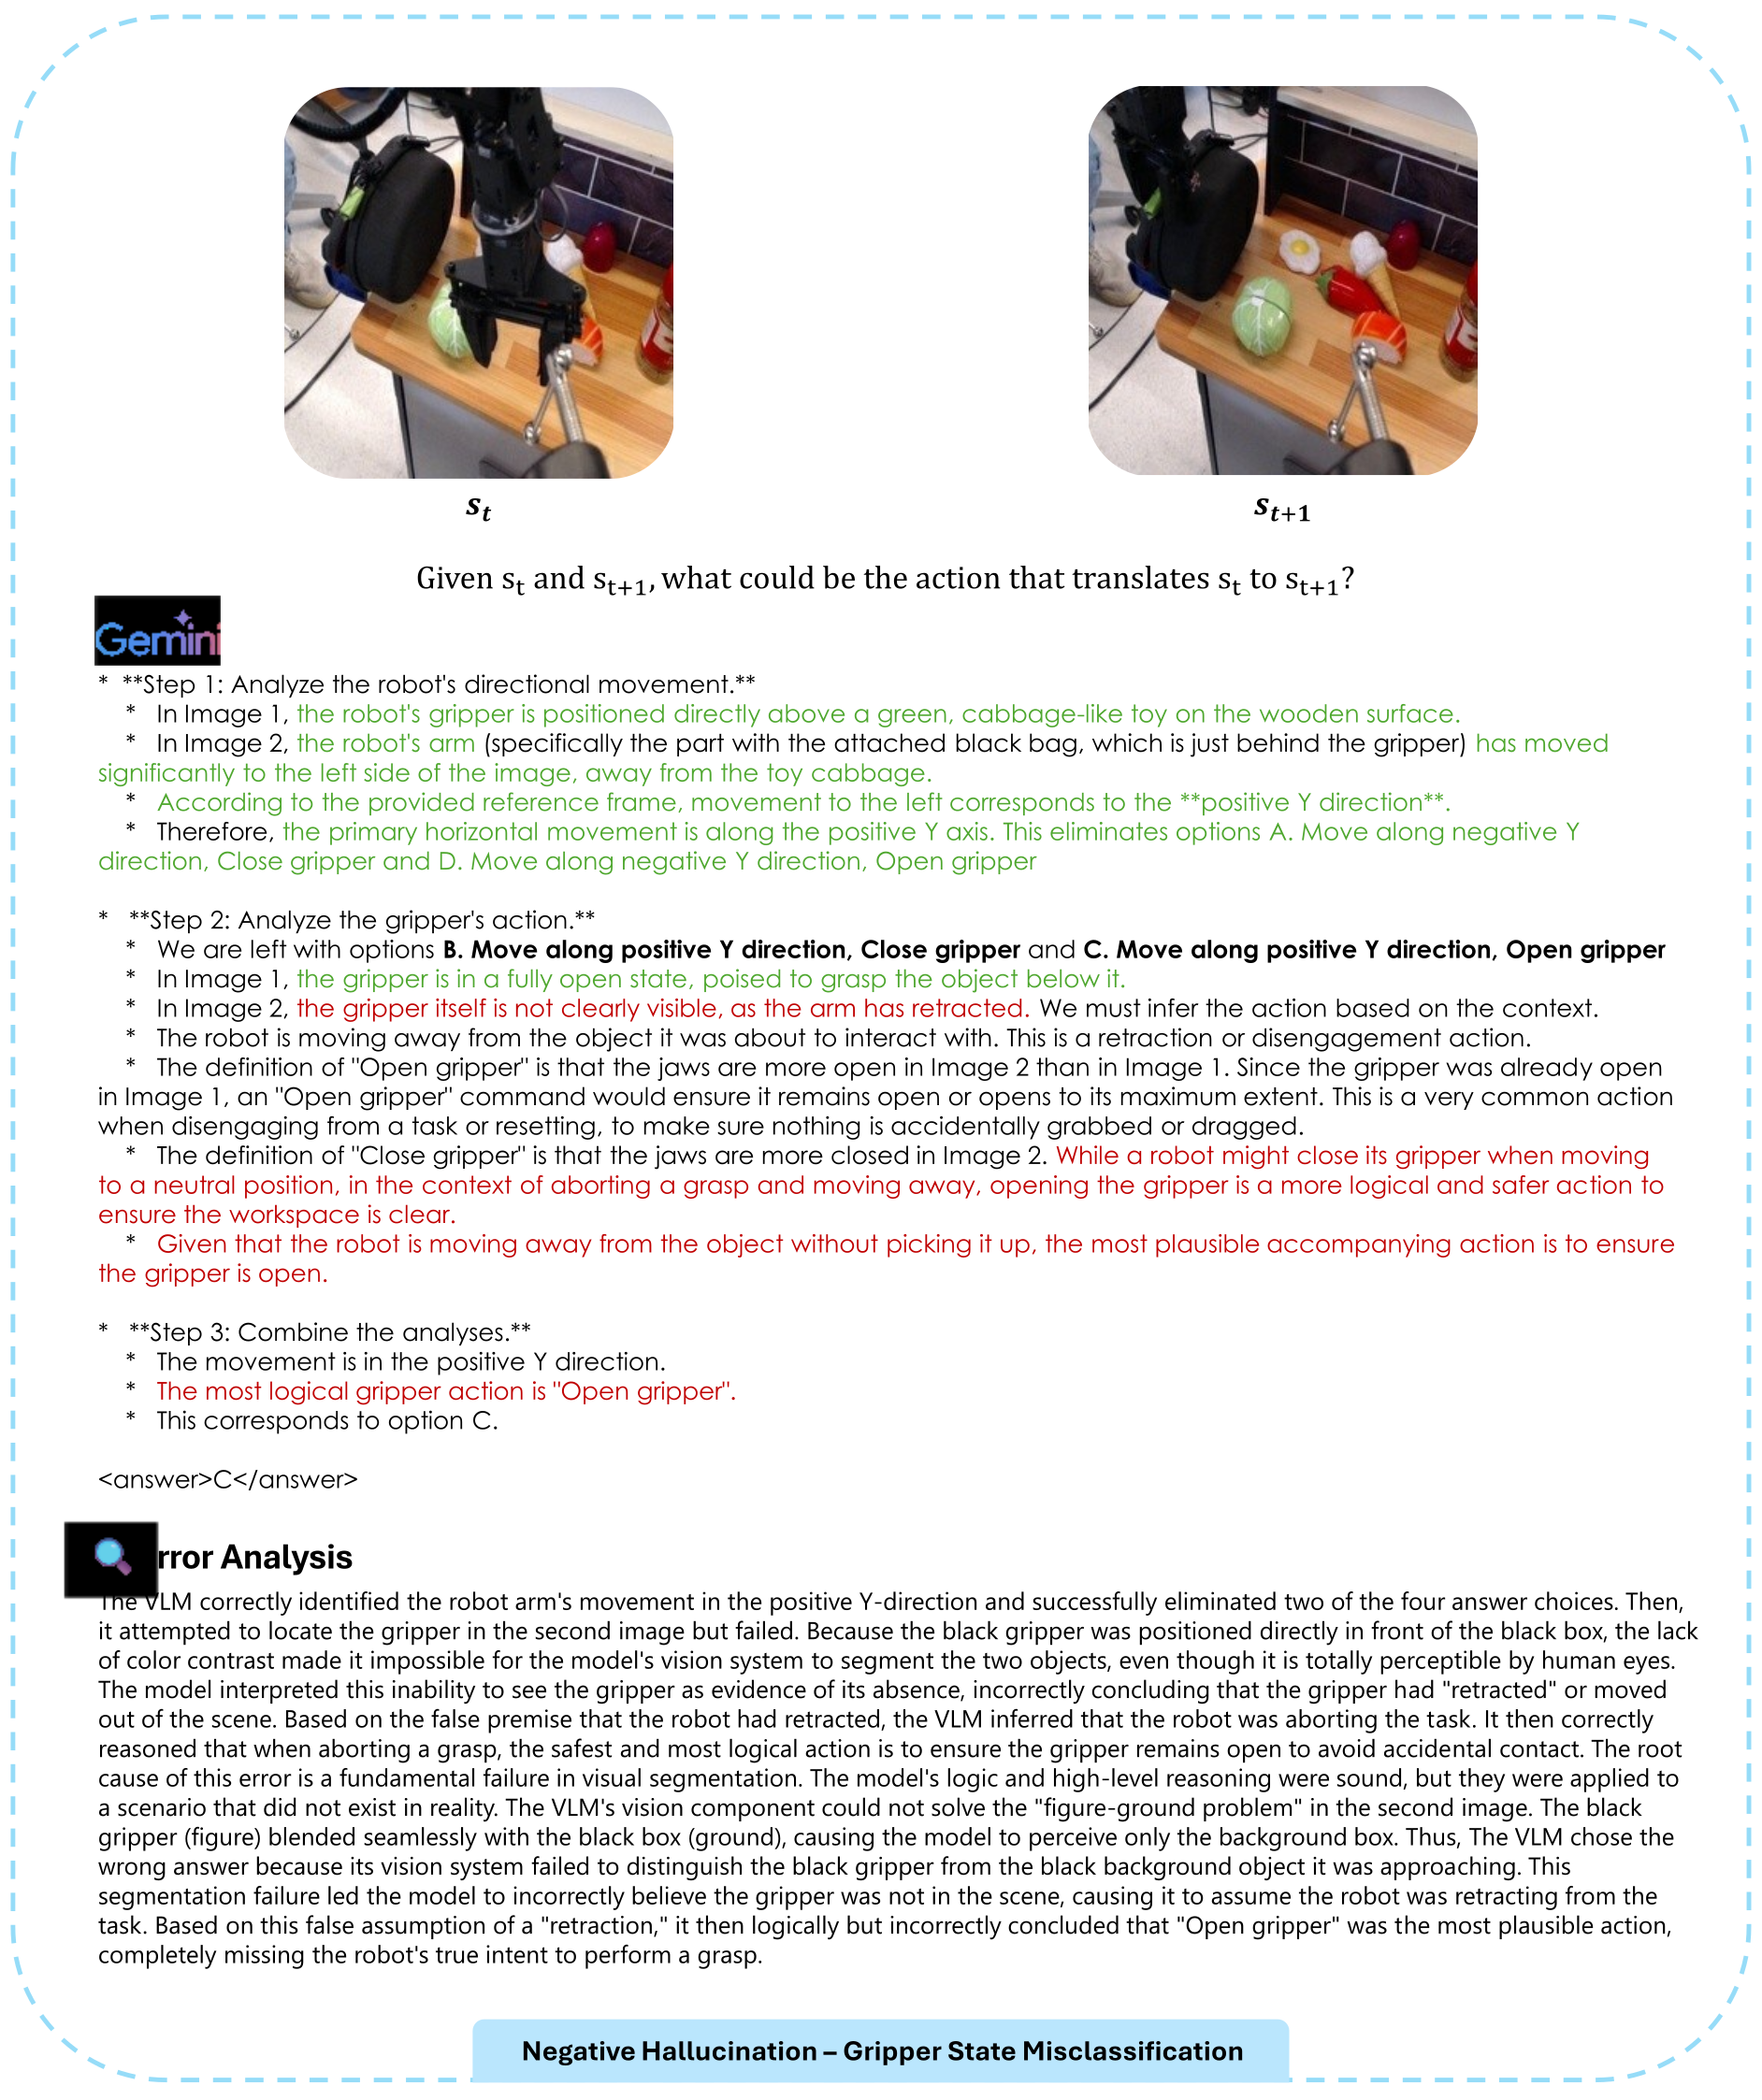
D. Figure 43: a Gripper State Classification Error
A black gripper blends with a black object, and the model interprets its apparent absence as retraction. It then infers an opening action from that incorrect scene description. The segmentation explanation is the authors’ diagnosis, not an independently measured visual-module failure.
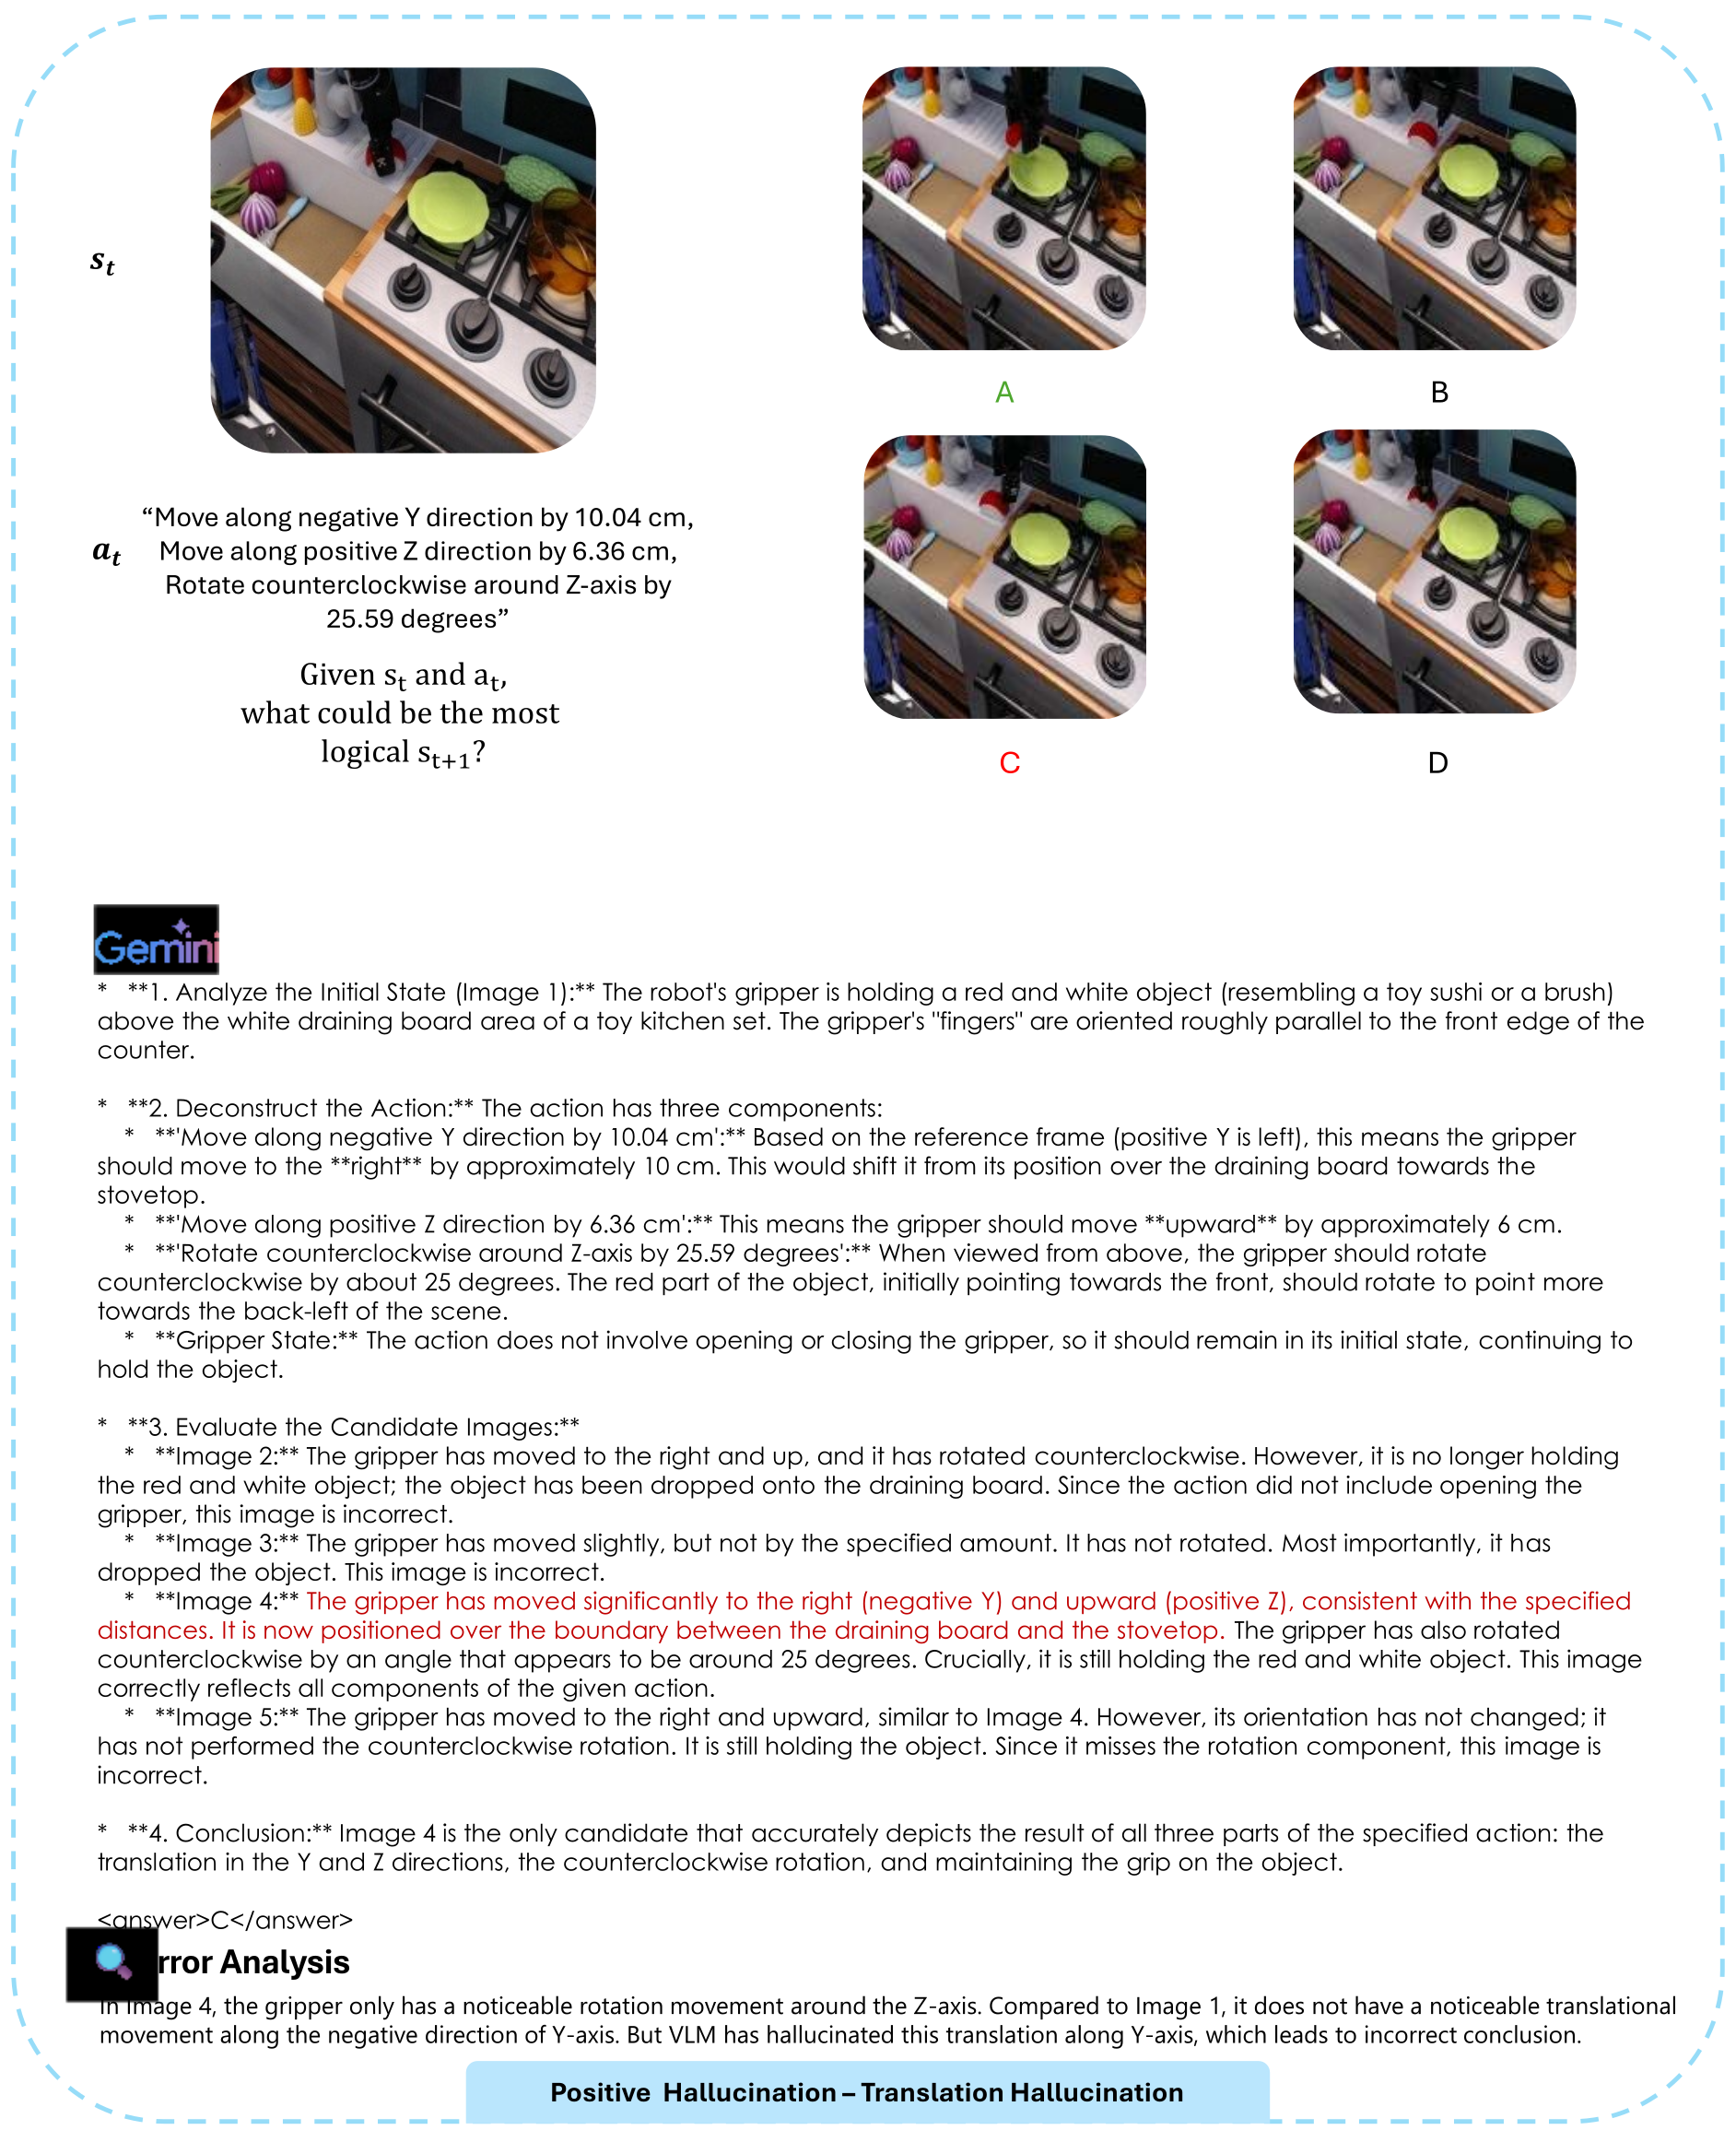
D. Figure 44: a Translation Hallucination Error
A candidate with rotation but no substantial commanded Y translation is selected after the explanation invents that translation. The entire multi-component command, candidate set and analysis are preserved.
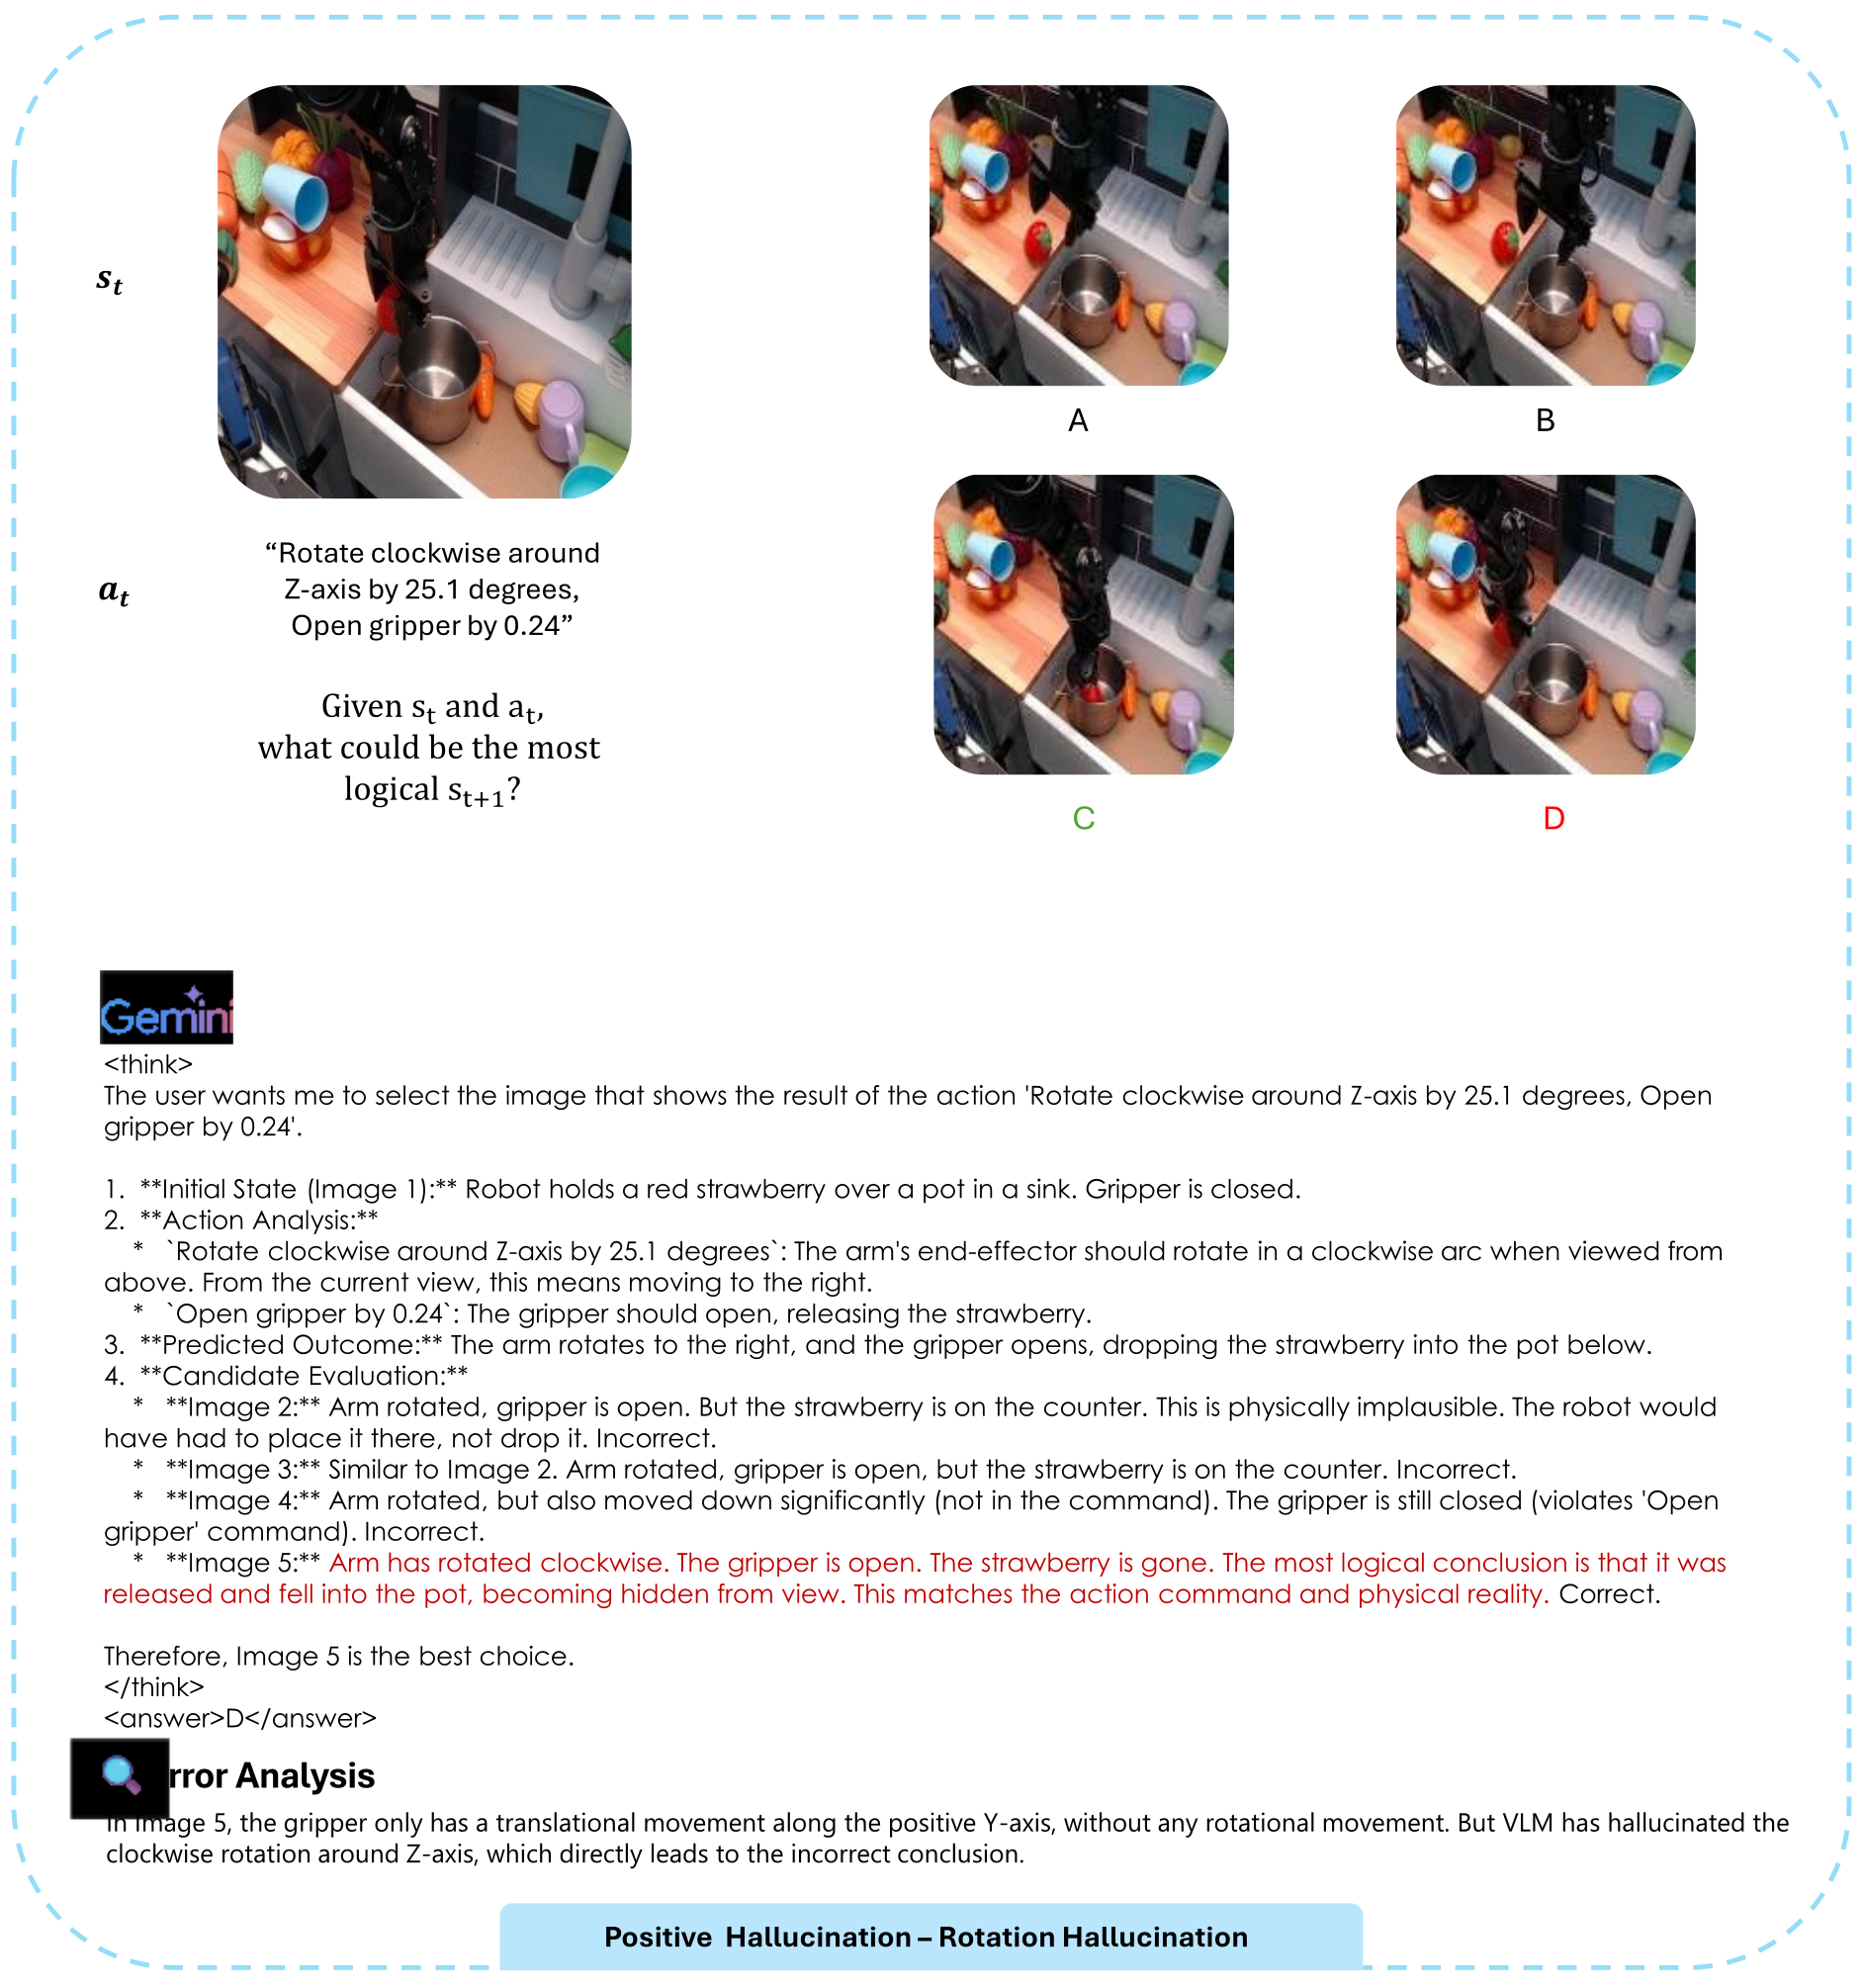
D. Figure 45: a Rotation Hallucination Error
The model attributes a commanded yaw rotation to an image showing translation and reasons about a dropped strawberry. The full panel preserves the distinction between the stated command and what is visible.
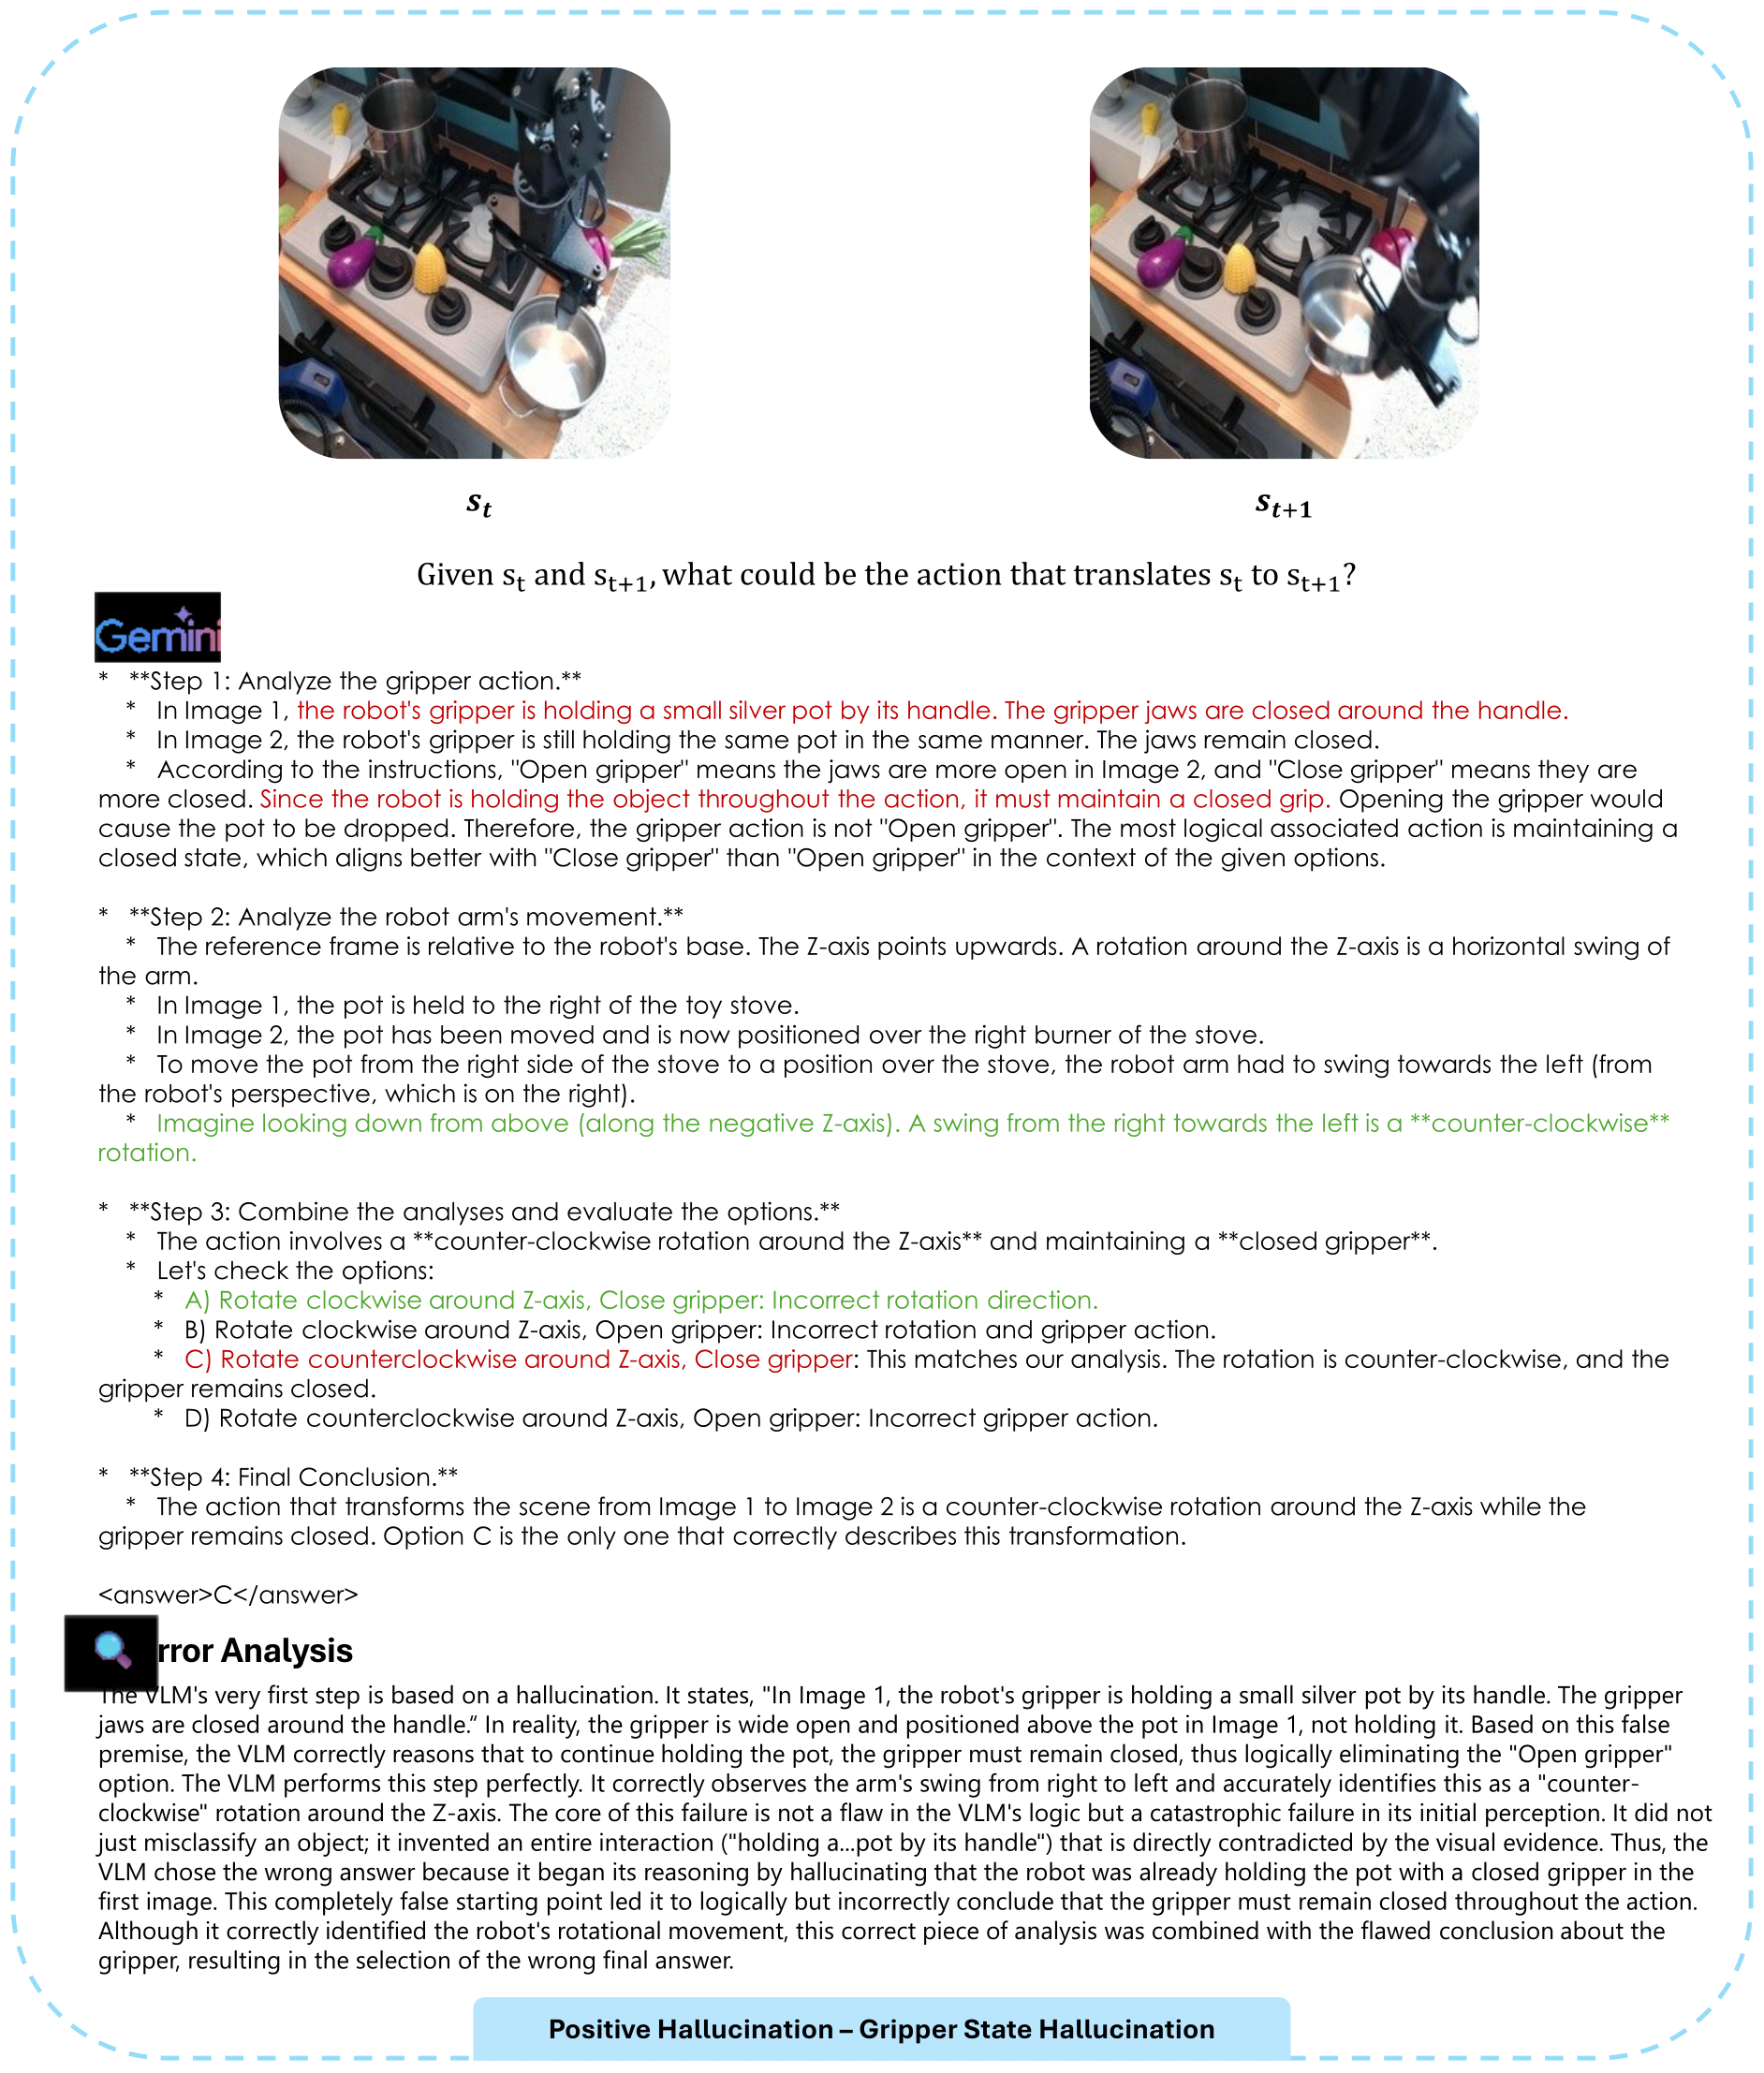
D. Figure 46: a Gripper State Hallucination Error
The explanation starts by assuming a pot is already held with a closed gripper, although the initial gripper is open. This incorrect starting state drives elimination of opening alternatives. The authors’ claim that later logic is sound remains an interpretation of the generated text.
D. Figure 47: a Spatial Reasoning Error
A horizontal bottle movement is described as lifting. The model then finds no exact answer and selects a “best fit,” with further object confusion. The example connects geometric error with unstable option matching.
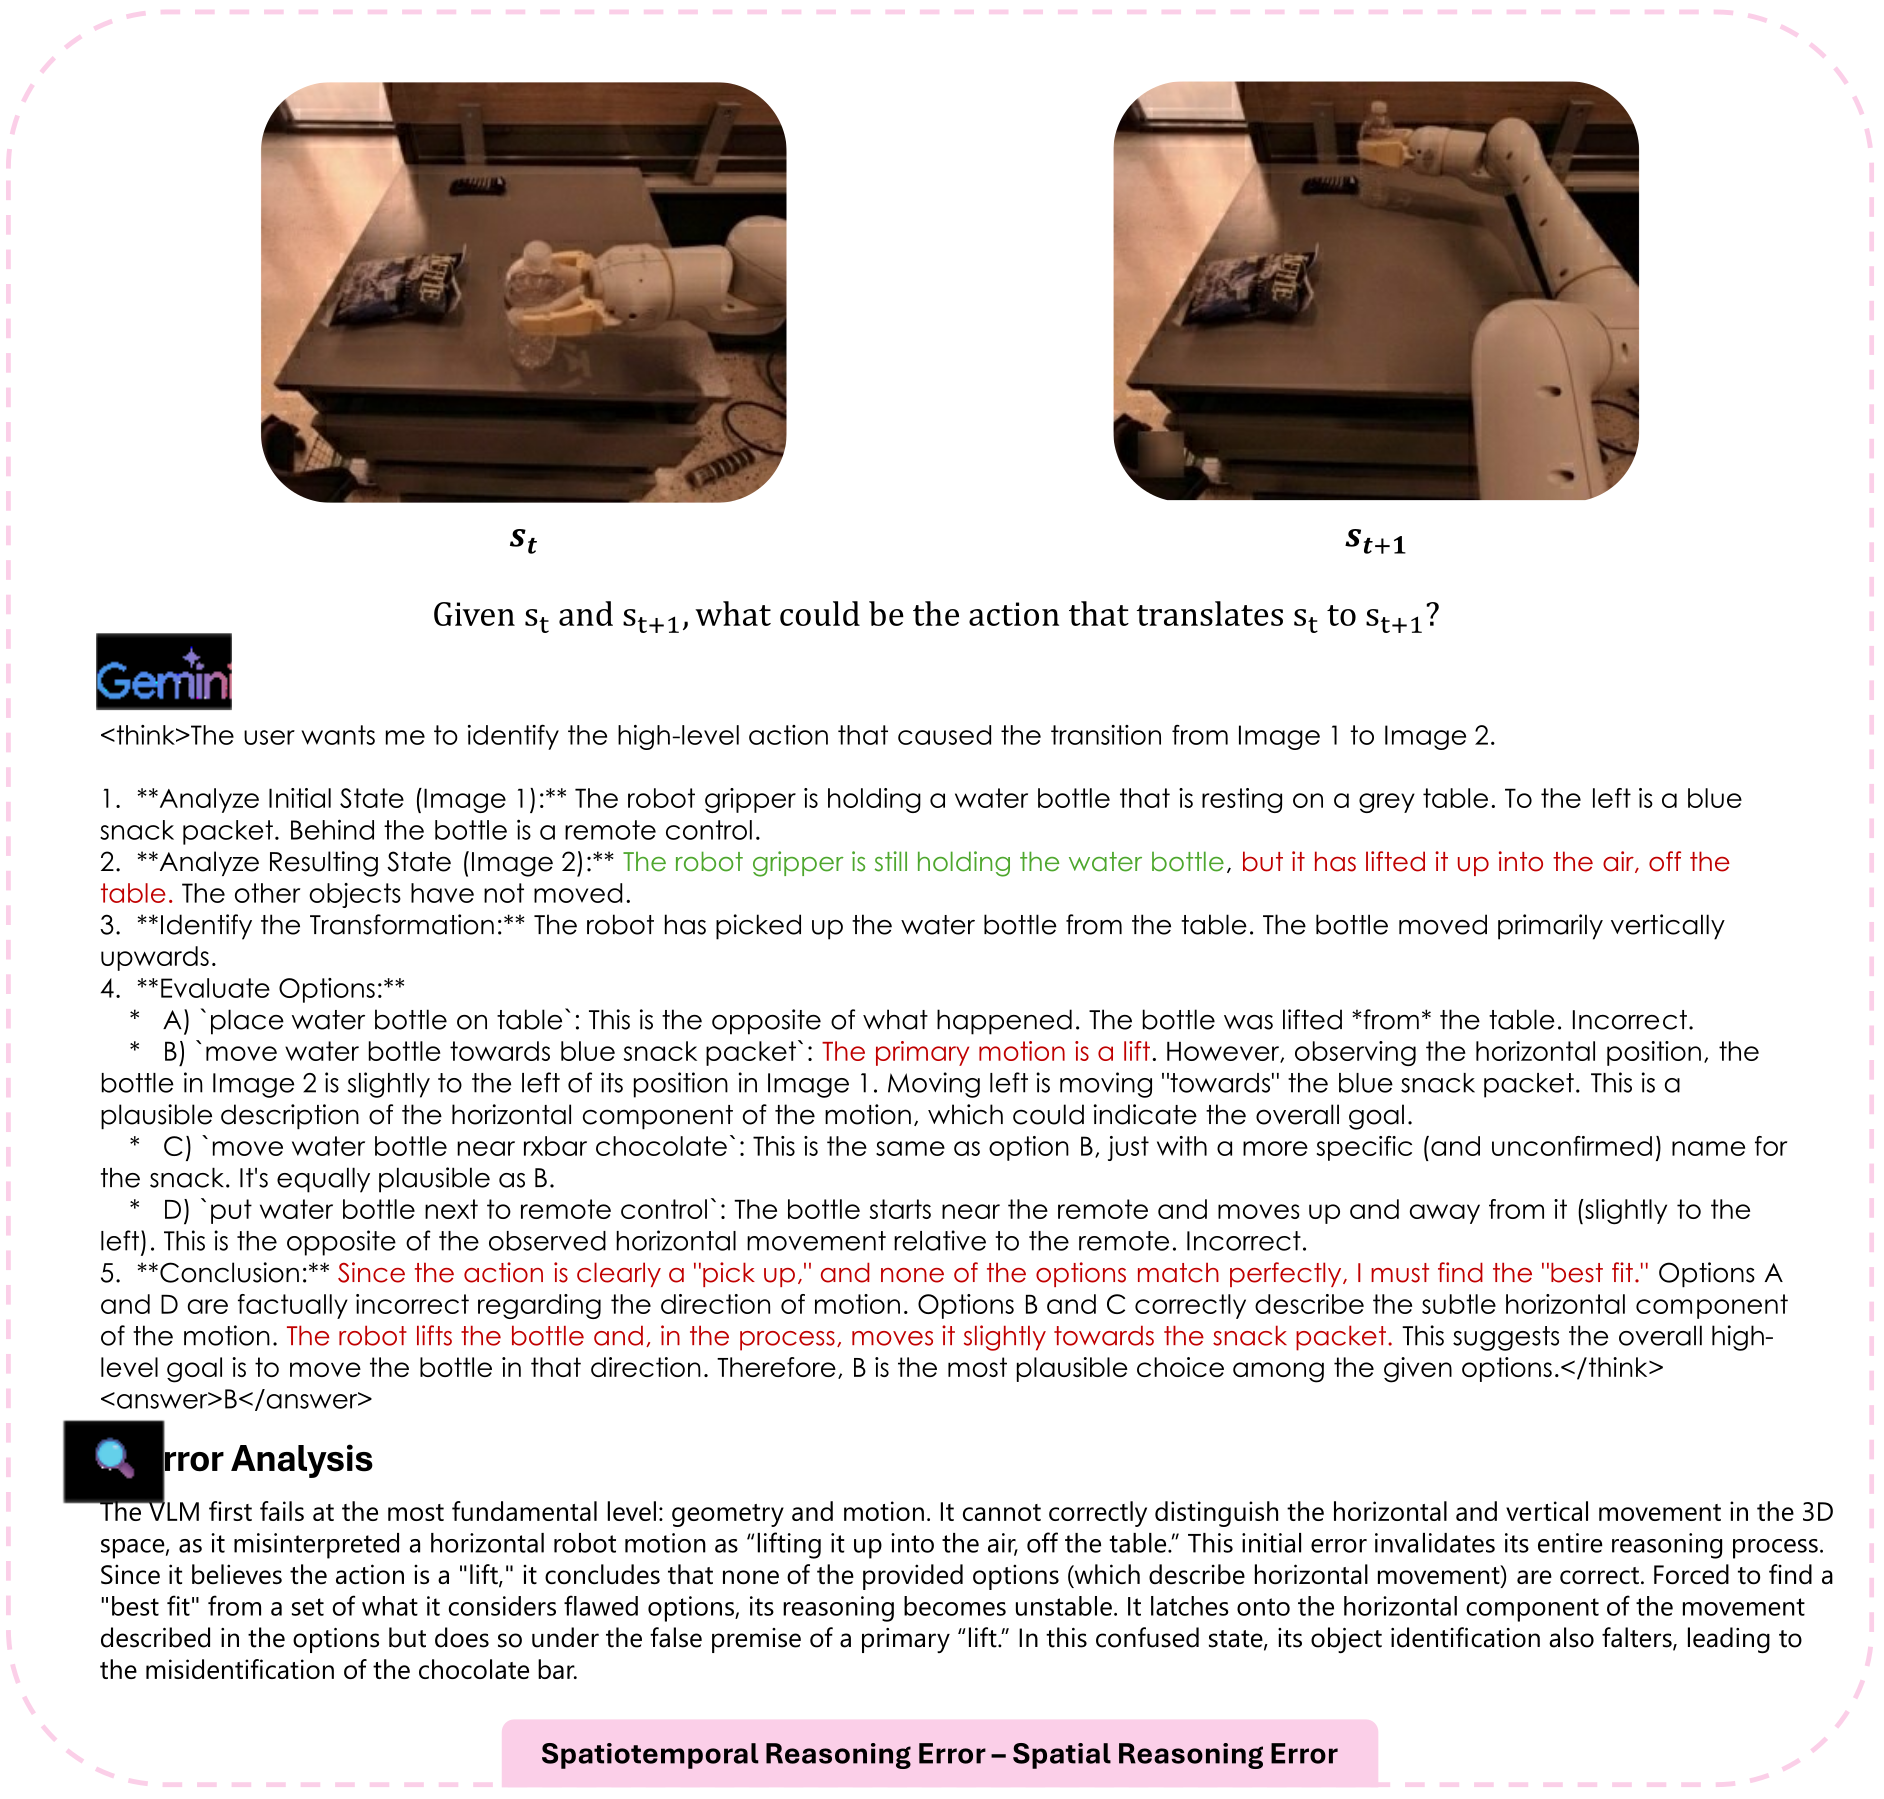
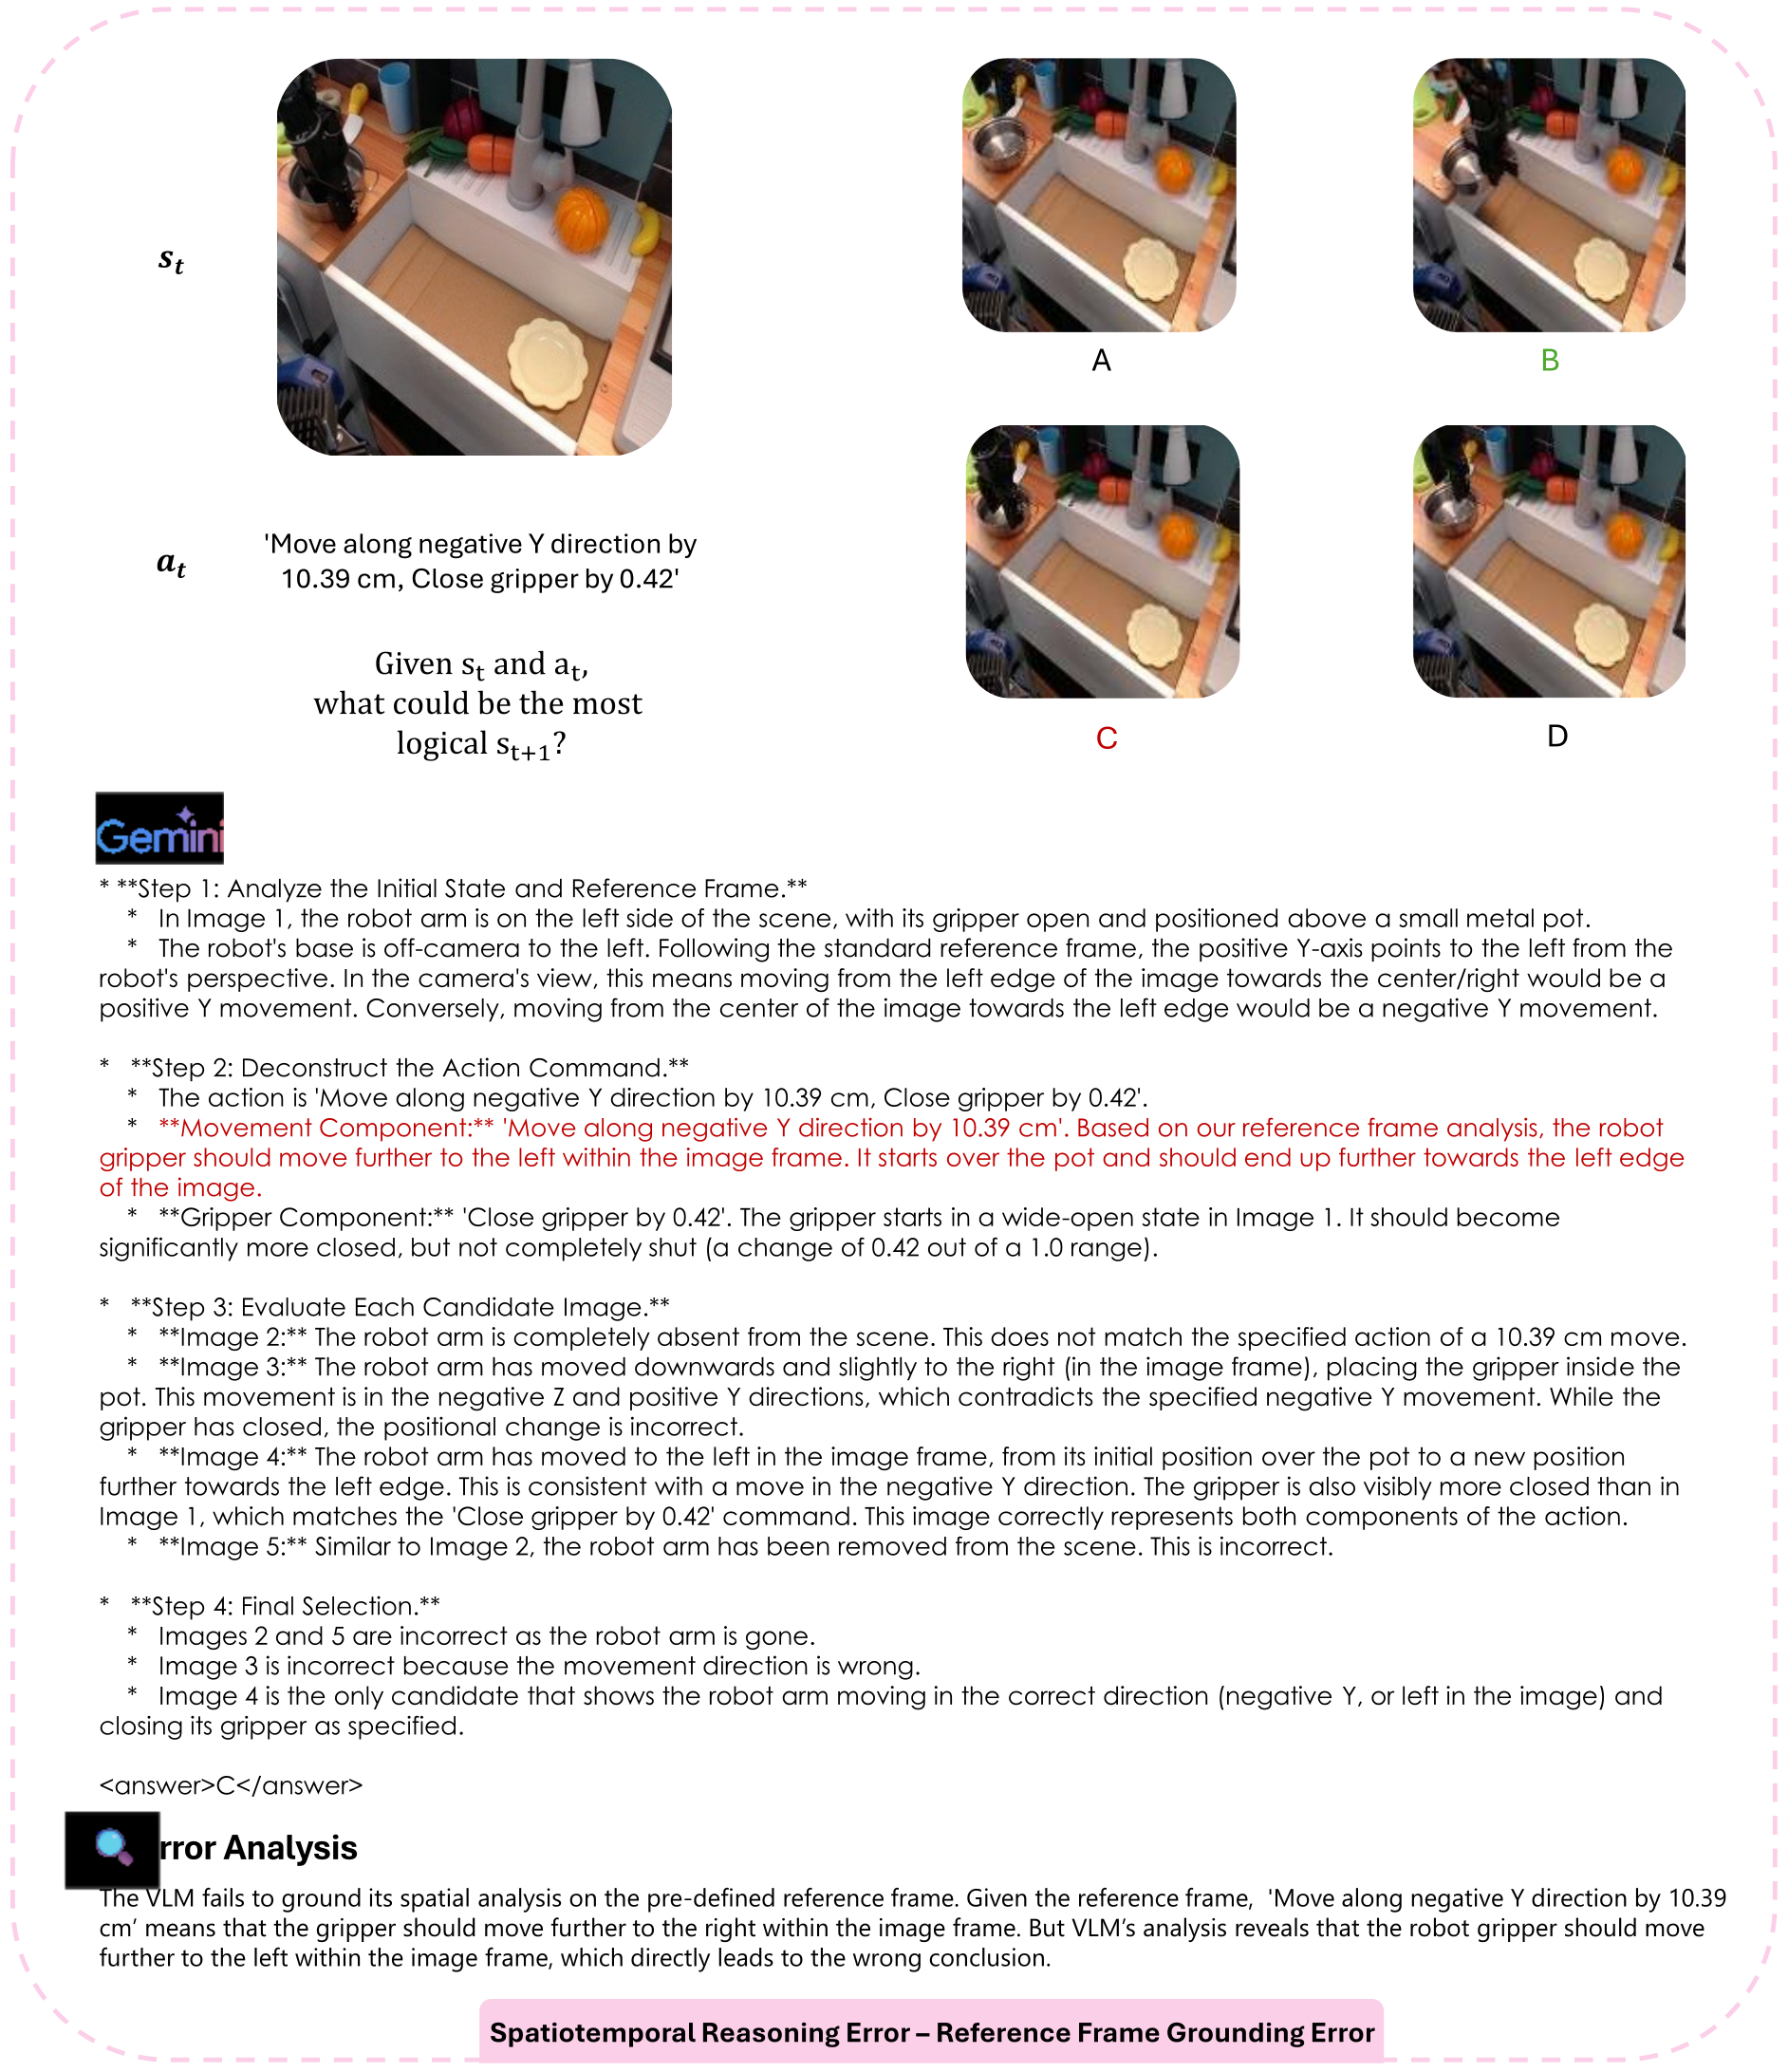
D. Figure 48: a Reference Frame Grounding Error
The explanation maps the requested negative-Y motion to the wrong image direction under the specified base frame. The full candidate images and original diagnosis show the coordinate-grounding issue.
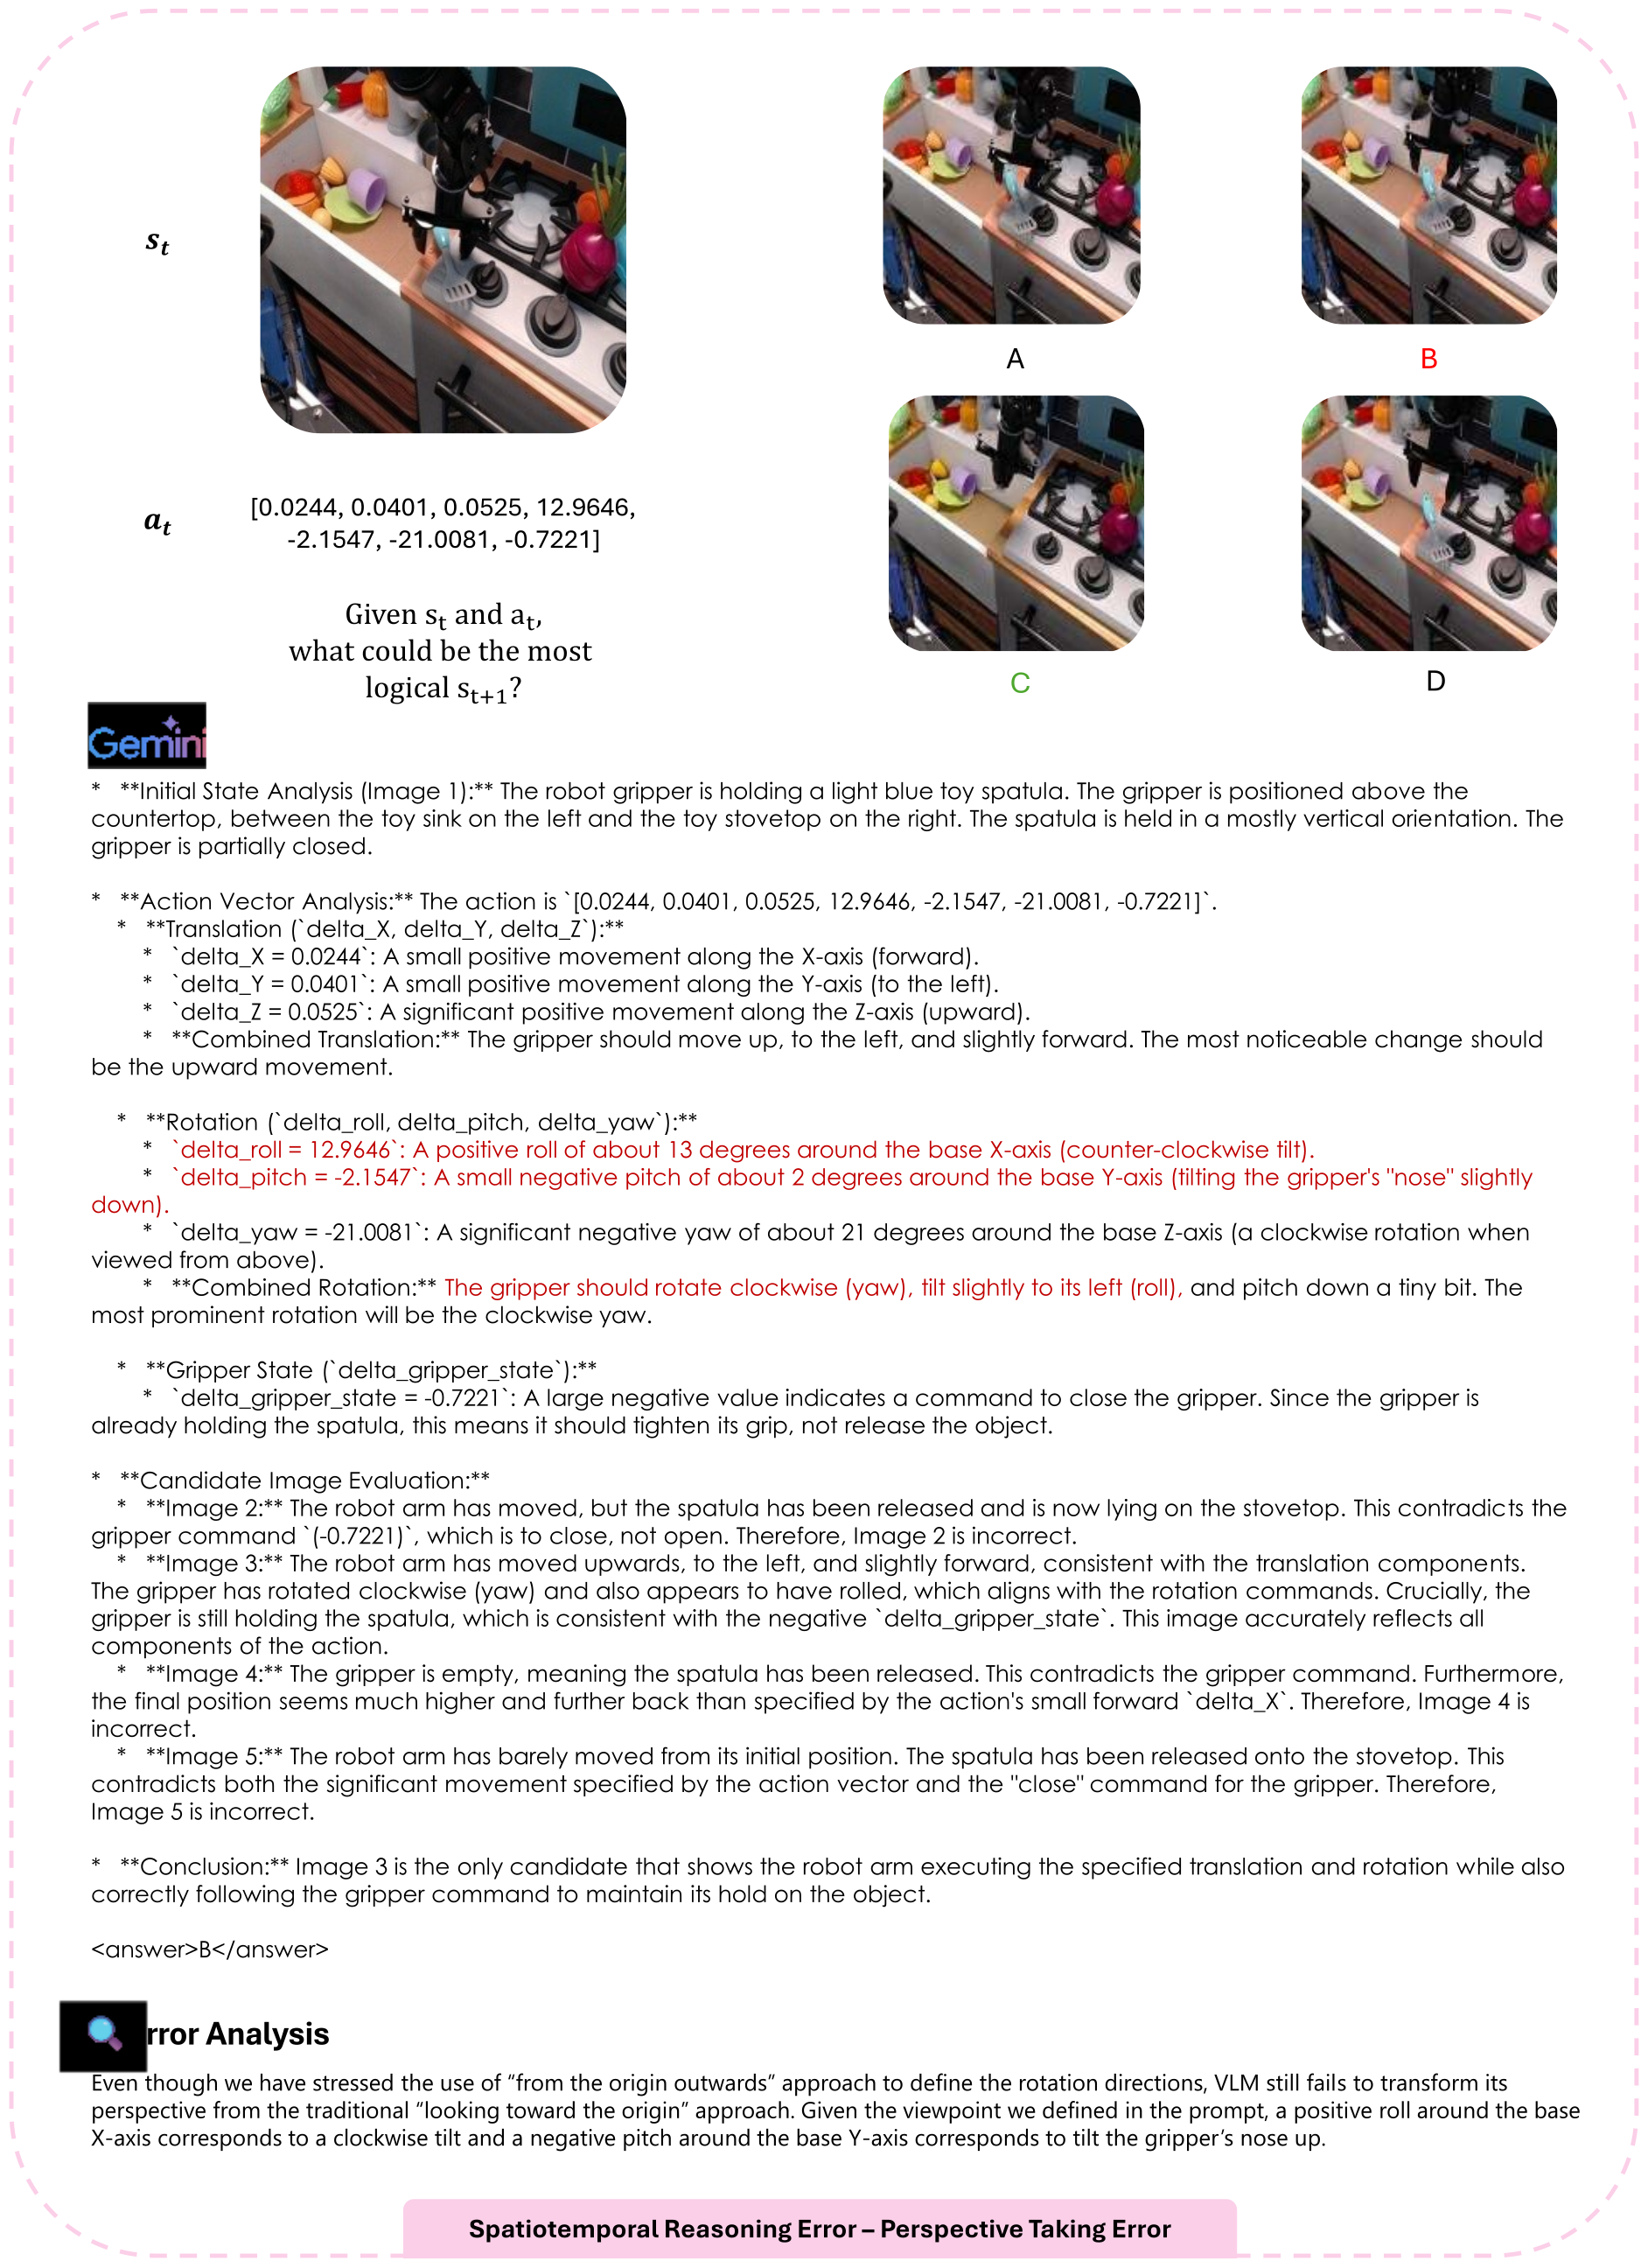
D. Figure 49: a Perspective Taking Error
The model applies a different viewing convention to roll/pitch from the one stated in the prompt. All numerical action components, candidates and the author’s perspective-taking critique are preserved; this case should be read alongside the prompt convention ambiguity.
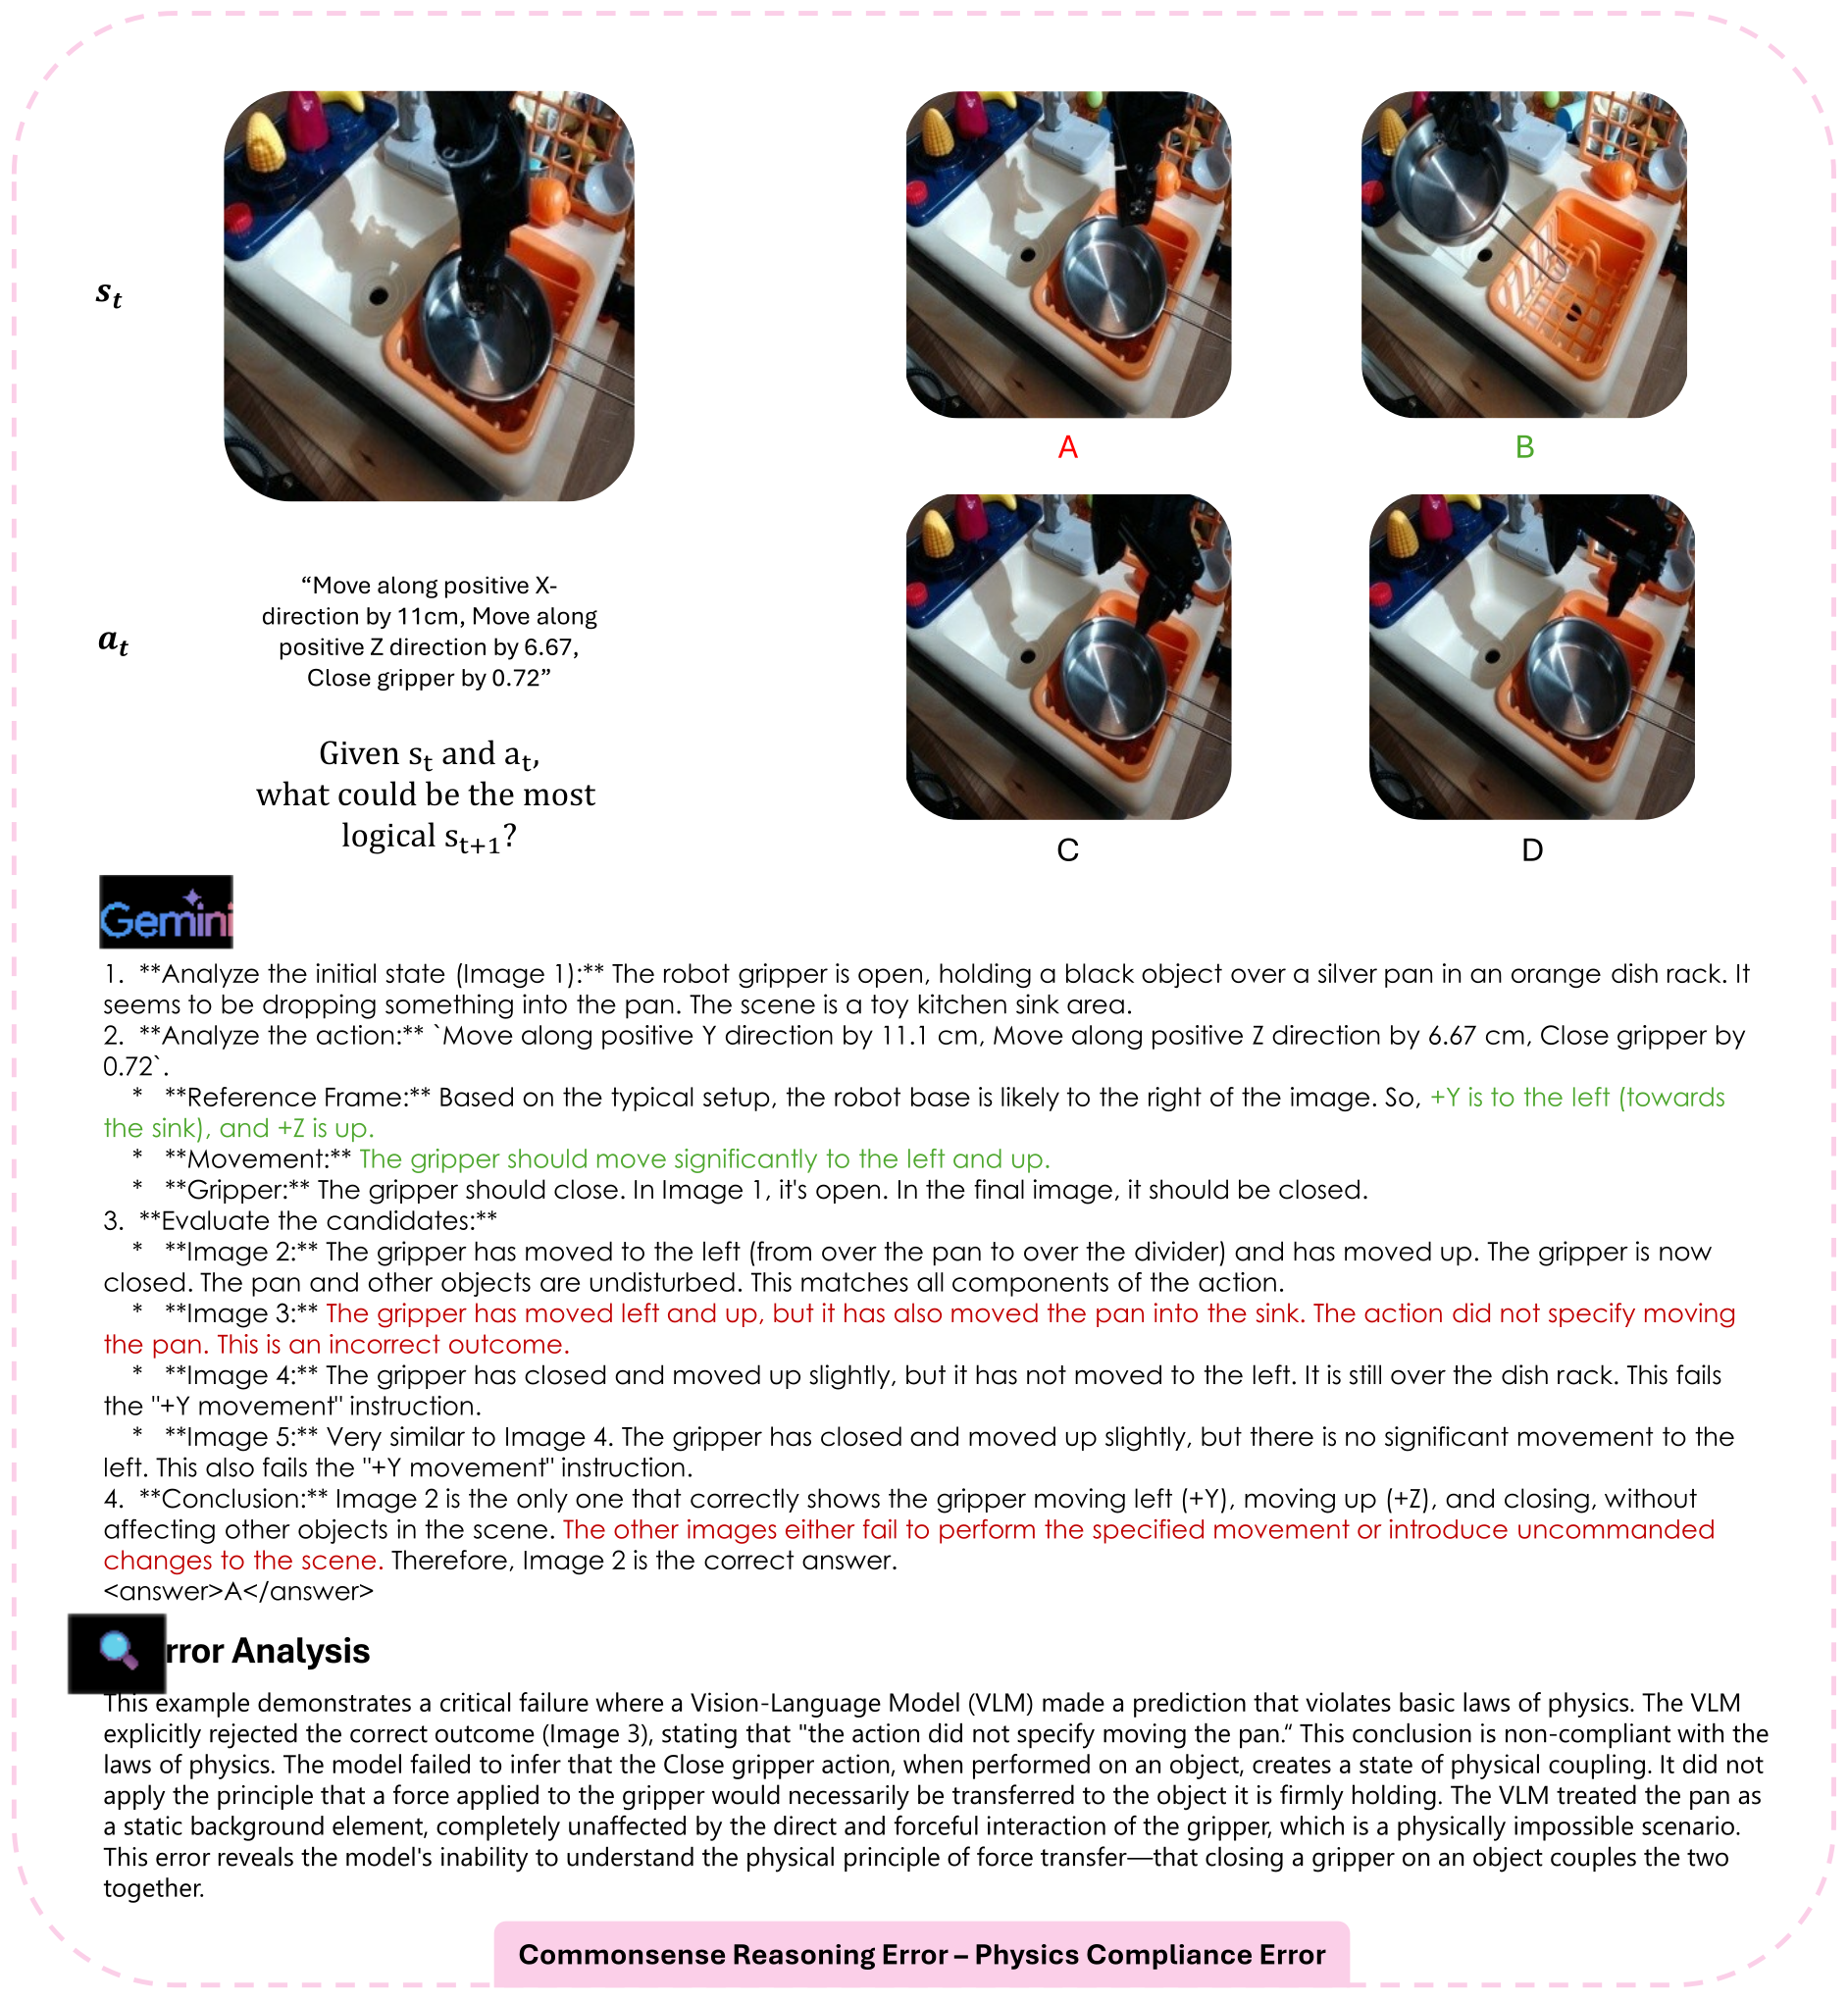
D. Figure 50: a Physics Compliance Error
The model rejects movement of a pot as an uncommanded side effect, missing the coupling produced by grasping. The full example is retained. Its scene command says positive X while the quoted generated explanation analyzes positive Y, an additional mismatch in the printed panel.
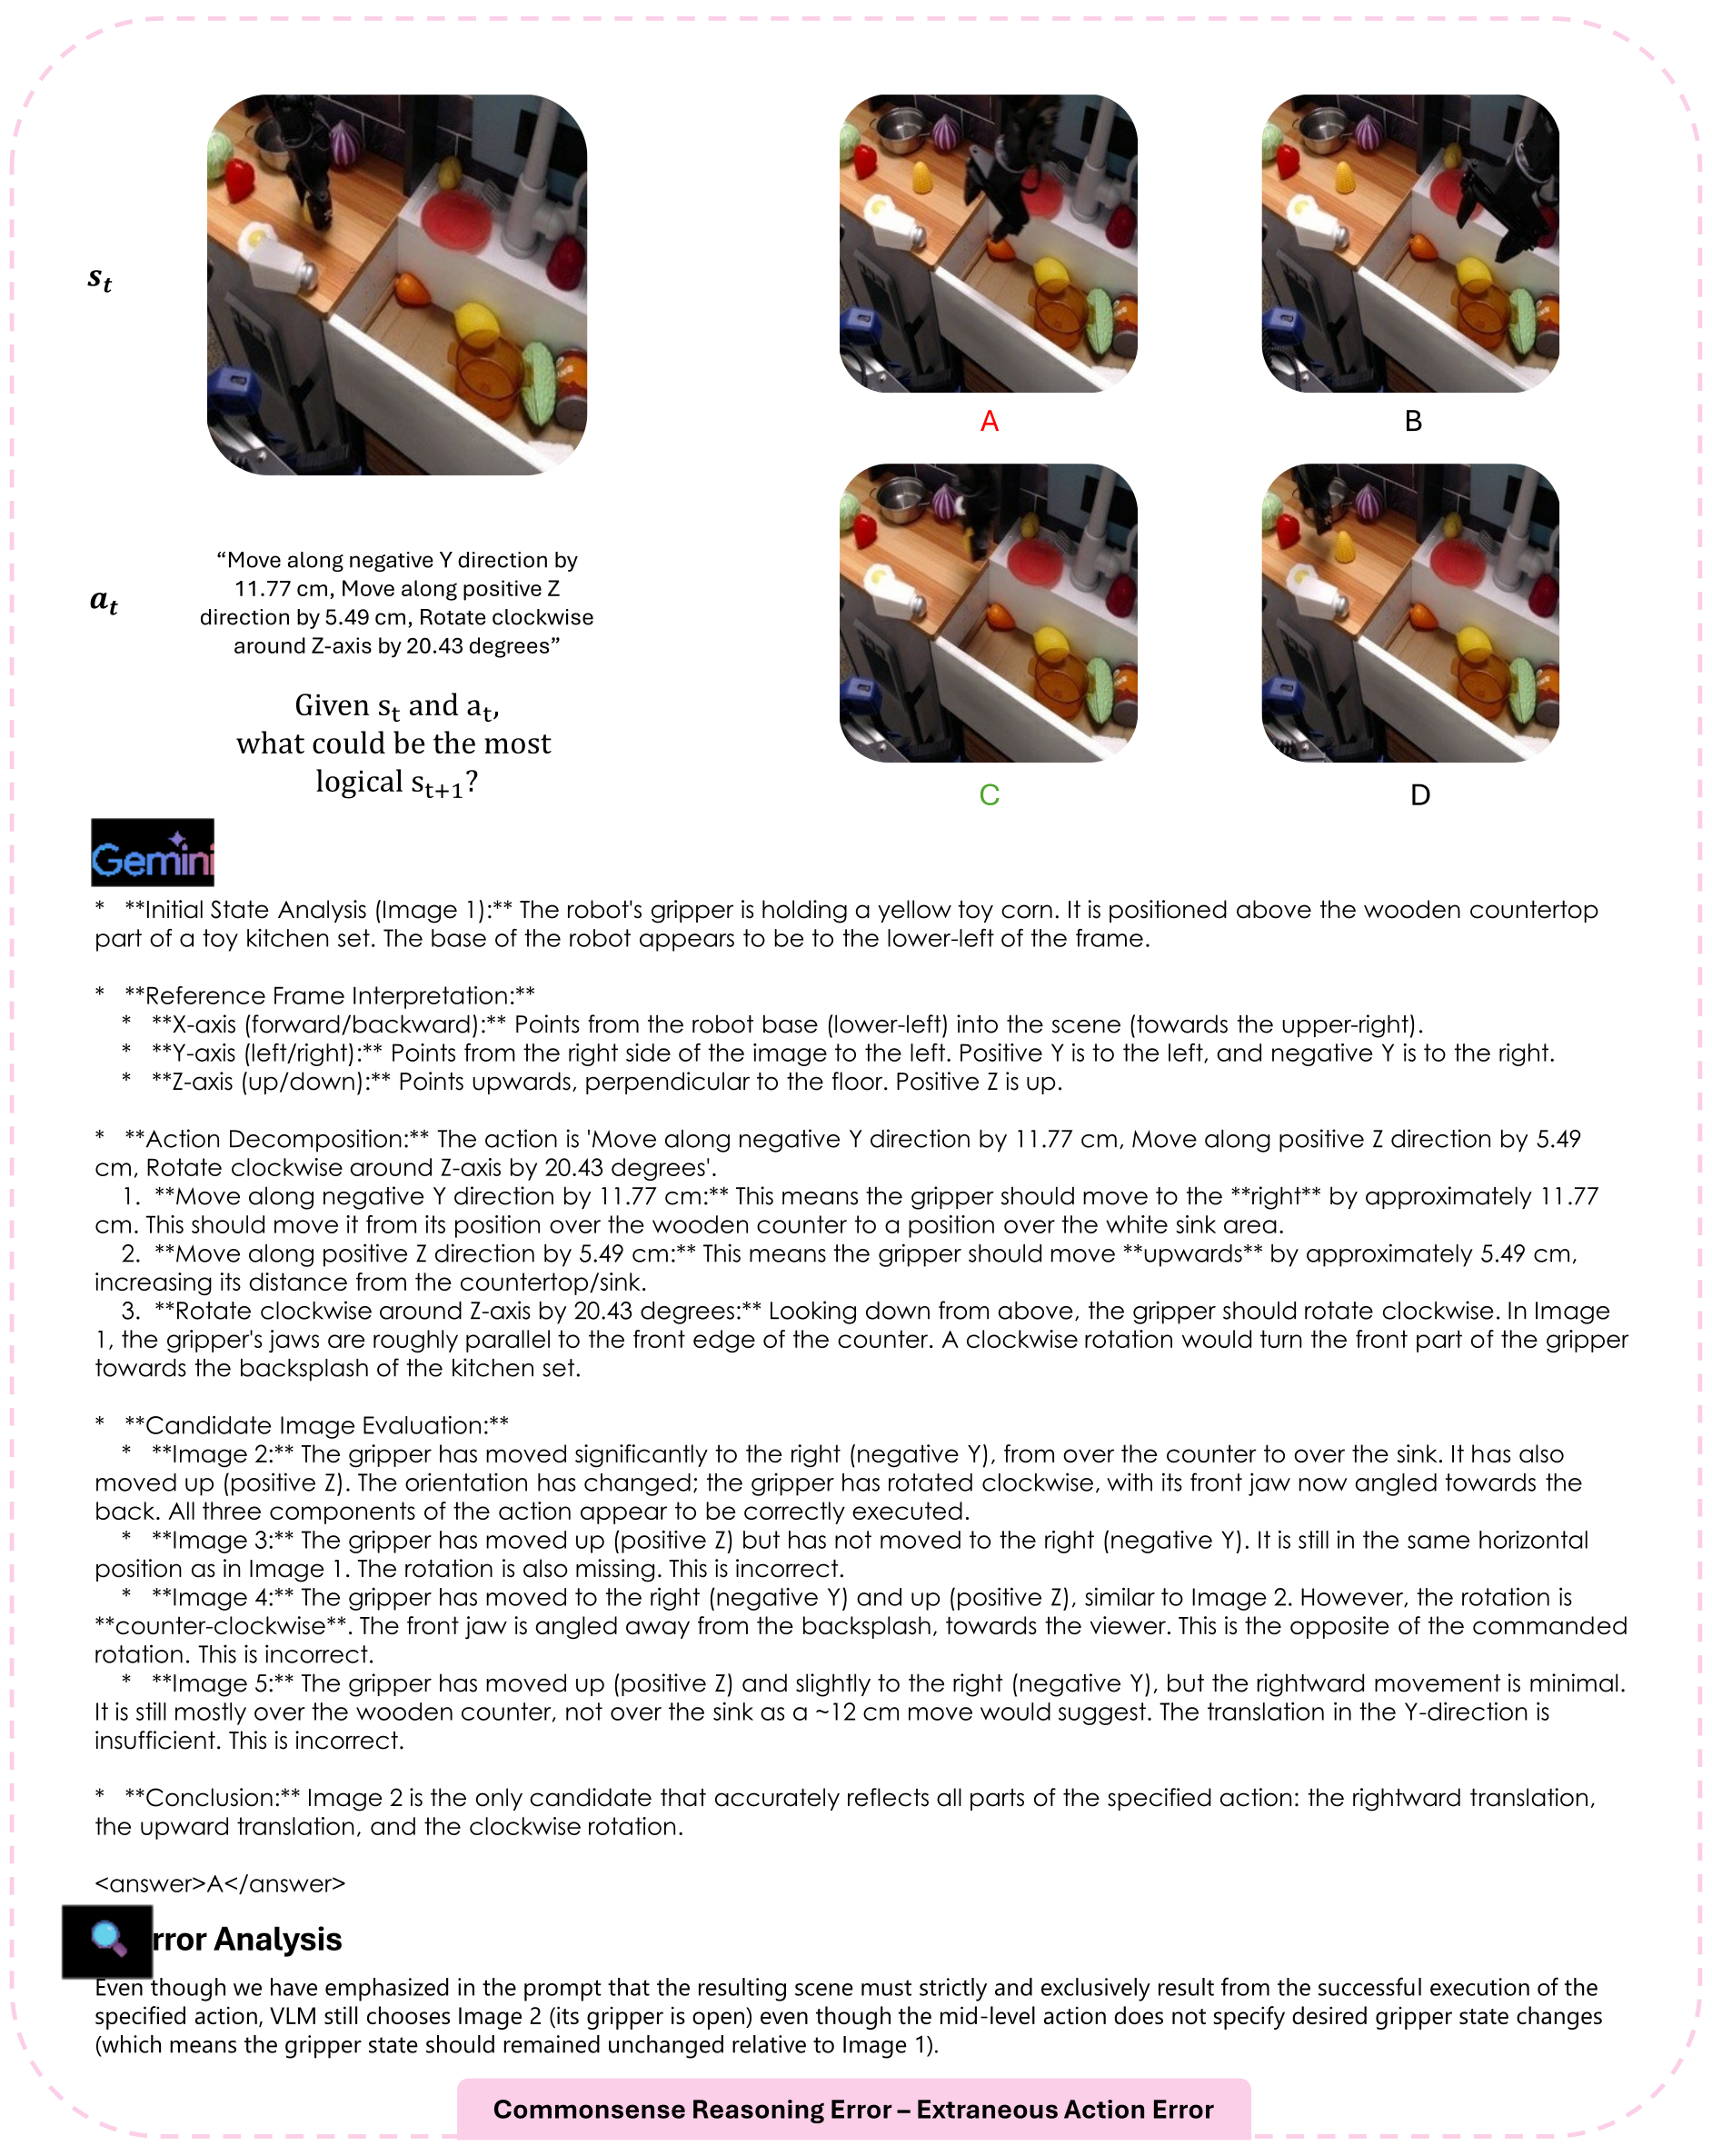
D. Figure 51: an Extraneous Action Error
The selected image opens the gripper even though the command changes only translation and rotation. The example illustrates failure to preserve an unspecified state component. All candidates, explanation and analysis remain intact.
E.1 Benchmark limitations
The benchmark measures multiple-choice recognition, with a fixed fourteen-label mid-level taxonomy and selected visible manipulation transitions. It does not directly evaluate continuous policies, closed-loop recovery or combined mobile-base/arm control.
Elementwise Euler-angle subtraction is only an approximation and can be ambiguous near coordinate singularities; it does not represent general composition on the rotation group. The authors propose more physically grounded orientation representations. These representation limitations matter when interpreting a geometric-reasoning bottleneck.
E.2 Future directions
Proposed extensions add an intermediate subtask-decomposition layer, expand action granularity, improve three-dimensional representations and investigate selective multi-view fusion. These are research directions rather than methods validated in this paper.
Original resources: project and interactive dataset viewer, publication discussion, and the complete author-hosted PDF.