Abstract
EchoGraph adapts SciBERT to extract clinically meaningful entities and relations from echocardiography reports, then uses a measurement-weighted graph-matching score to assess generated text. It trains on densely annotated Mayo reports and evaluates extraction on an external MIMIC sample.
The new score responds more strongly than RadGraph F1 to deliberately corrupted measurements, directions, and severity terms. This establishes sensitivity to controlled errors, not prospective clinical usefulness or a complete evaluation of naturally generated reports.
Introduction
Generic text metrics can reward fluent but clinically incorrect reports. RadGraph [3] provides entity-and-relation-based evaluation for radiology, but its scoring is insufficiently sensitive to numerical errors in echo reports, as also observed in the EchoGPT study [16].
EchoGraph extends the extraction schema with measurement entities and Gauge relations, and weights linked clinical information more heavily. The aim is to make report-comparison scores reflect errors in quantities and their relationships.
Results
Dataset
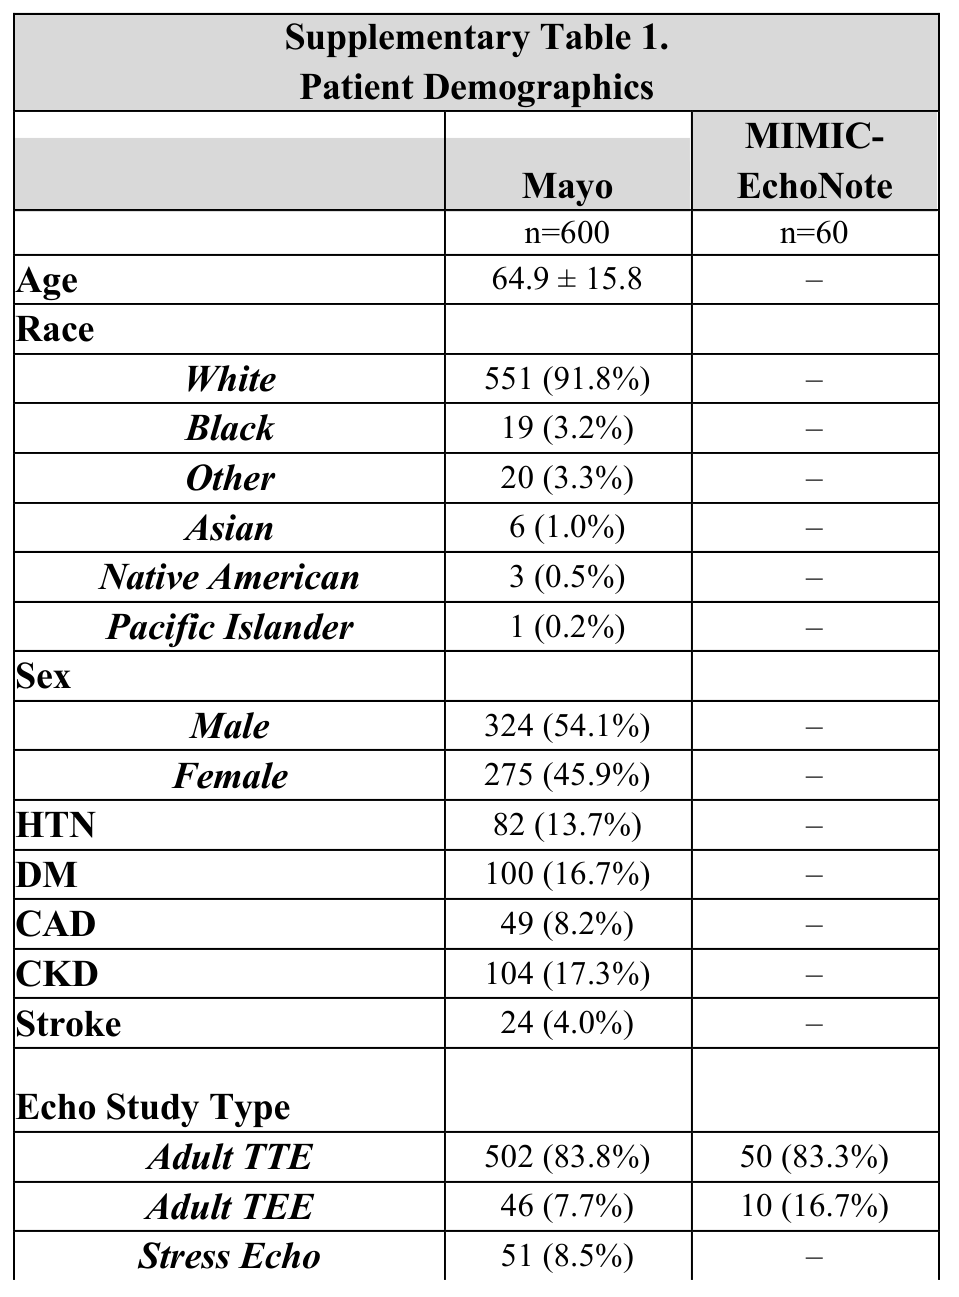
The annotated development dataset contains 600 Mayo patients from 2017, with mean age 64.9 years and a predominantly white population. Most studies are transthoracic. External extraction evaluation uses 60 MIMIC-EchoNotes reports with no available patient demographics.
A separate contemporary cohort contains 150 consecutive Mayo Clinic Health System studies from 2023. These reports support the human error-annotation experiment after synthetic corruption. They are separate from the 2017 model-training cohort.
Dataset annotation
The Mayo reports contain 48,256 annotated entities and 29,731 relations; the 60 MIMIC reports contain 3,672 and 2,360. Measurements are less frequent in MIMIC, and several categories are rare. The random Mayo test split contains no uncertain-observation examples, limiting evaluation of that category. Table 1 retains the complete class counts.
Entity | Mayo (n = 600) | MIMIC-EchoNotes (n = 60) | Relation | Mayo (n = 600) | MIMIC-EchoNotes (n = 60) |
|---|---|---|---|---|---|
Count (%) | Count (%) | ||||
Total | 48256 (100%) | 3672 (100%) | Total | 29731 (100%) | 2360 (100%) |
Anatomy | 14606 (30.3%) | 1287 (35.0%) | Gauge | 3345 (11.3%) | 84 (3.6%) |
Measurement | 14146 (29.3%) | 618 (16.8%) | Modify | 25625 (86.2%) | 2156 (91.4%) |
Observation-definitely present | 14122 (29.3%) | 1449 (39.5%) | Located at | 597 (2.0%) | 92 (3.9%) |
Observation-definitely absent | 3118 (6.5%) | 249 (6.8%) | Suggestive of | 164 (0.6%) | 28 (1.2%) |
Observation-uncertain | 28 (0.1%) | 10 (0.3%) | |||
Out-of-scope* | 2236 (4.6%) | 59 (1.6%) | |||
Schema coverage
The schema covers 79.8% of Mayo tokens and 73.6% of MIMIC tokens on average. Report and sentence lengths differ between datasets. Table 2 retains the coverage and length statistics; coverage is not itself extraction accuracy.
Mayo | MIMIC-EchoNotes | |
|---|---|---|
Dataset | n = 600 | n = 60 |
Tokens per report | 216.3 ± 54.2 | 155.2 ± 43.0 |
Sentence length | 8.1 ± 5.6 | 7.8 ± 6.8 |
Annotated tokens per report | 172.3 ± 42.2 | 113.5 ± 30.9 |
Percentage of annotated tokens | 79.8 ± 3.9% | 73.6 ± 7.1% |
Interobserver agreement
Three annotators independently label ten Mayo reports. Mean exact-match agreement rises after expert review and consensus from 0.82 to 0.91 for entities and from 0.60 to 0.71 for relations. Agreement is estimated on this small shared sample.
Model performance
Mayo test micro F1 is 0.85 for entities and 0.70 for relations. External entity micro F1 is 0.80. Table 3 reports external relation micro F1 as 0.56, whereas the abstract states 0.52; both original values are retained here without silently resolving the discrepancy.
Common categories perform better than rare ones. On MIMIC, measurement extraction falls to 0.69 F1, Located at relations to 0.24, and Suggestive of relations to 0.00. Table 4 retains category-level precision, recall, and F1, including the untested Mayo uncertain-observation category.
Metric | Category | Train | Val | Test | MIMIC-EchoNotes |
|---|---|---|---|---|---|
Precision (PPV) | Entity | 0.98 | 0.83 | 0.86 | 0.82 |
Recall (Sensitivity) | Entity | 0.98 | 0.81 | 0.84 | 0.78 |
Micro F1 score | Entity | 0.98 | 0.82 | 0.85 | 0.80 |
Precision (PPV) | Relation | 0.98 | 0.85 | 0.72 | 0.64 |
Recall (sensitivity) | Relation | 0.97 | 0.84 | 0.69 | 0.50 |
Micro F1 Score | Relation | 0.98 | 0.84 | 0.70 | 0.56 |
Entities | Relations | ||||||||
|---|---|---|---|---|---|---|---|---|---|
Located at | Modify | Gauge | Suggestive of | ||||||
Mayo | |||||||||
Precision | 0.83 | 0.86 | 0.89 | 0.82 | — | 0.73 | 0.71 | 0.79 | 0.40 |
Recall | 0.82 | 0.86 | 0.85 | 0.83 | — | 0.70 | 0.68 | 0.77 | 0.33 |
Micro F1 | 0.82 | 0.86 | 0.87 | 0.82 | — | 0.71 | 0.70 | 0.78 | 0.36 |
MIMIC EchoNotes | |||||||||
Precision | 0.85 | 0.69 | 0.87 | 0.67 | 0.0 | 0.42 | 0.64 | 0.60 | 0.0 |
Recall | 0.80 | 0.69 | 0.82 | 0.66 | 0.0 | 0.17 | 0.51 | 0.43 | 0.0 |
Micro F1 | 0.82 | 0.69 | 0.85 | 0.67 | 0.0 | 0.24 | 0.57 | 0.50 | 0.0 |
Error analysis
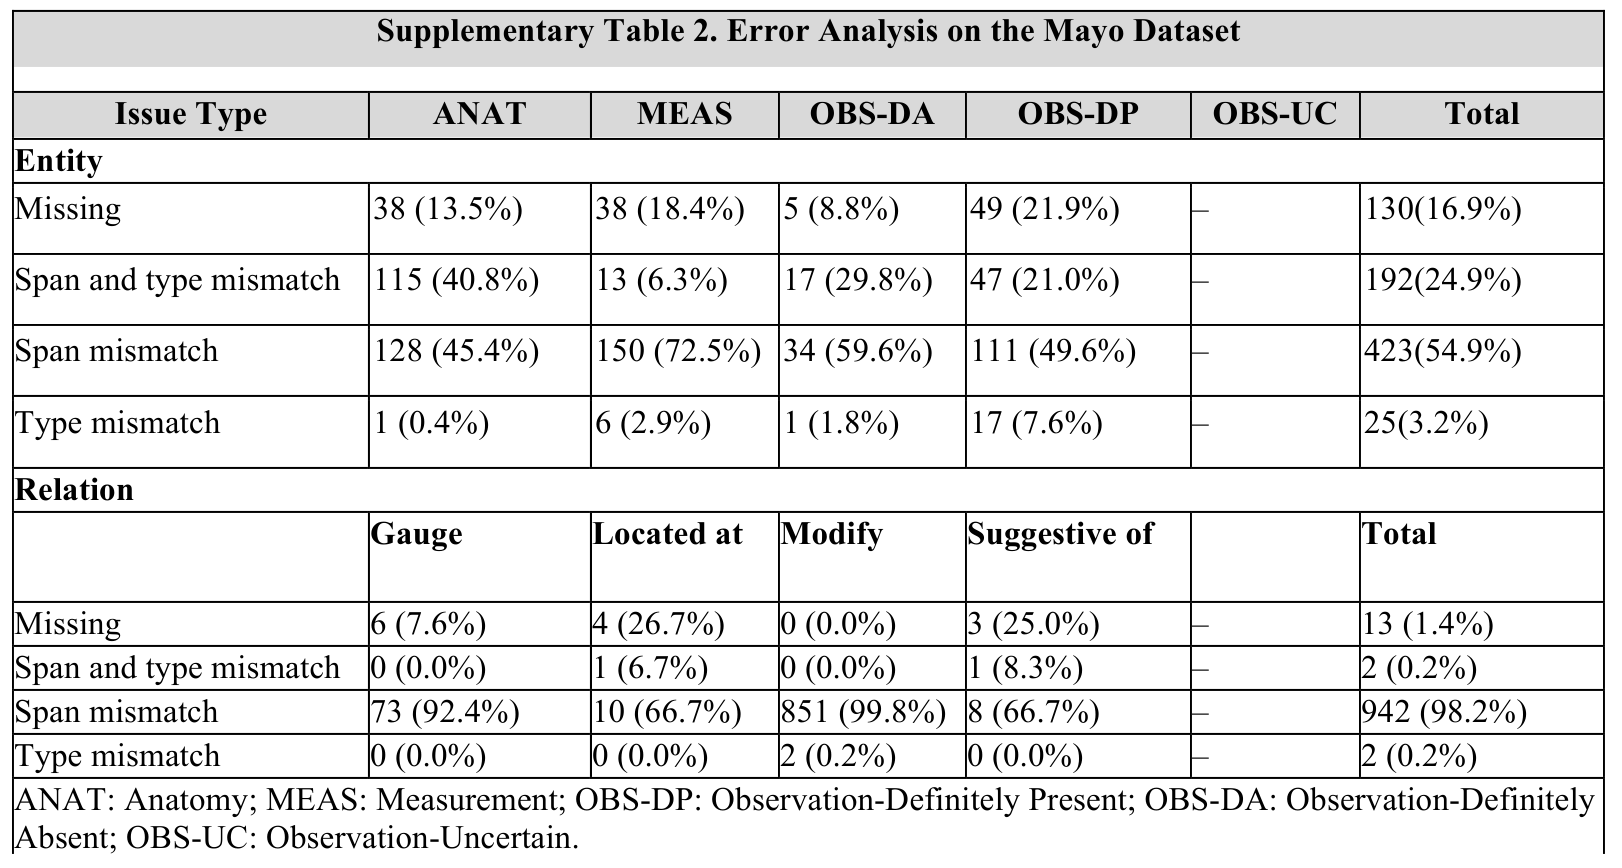
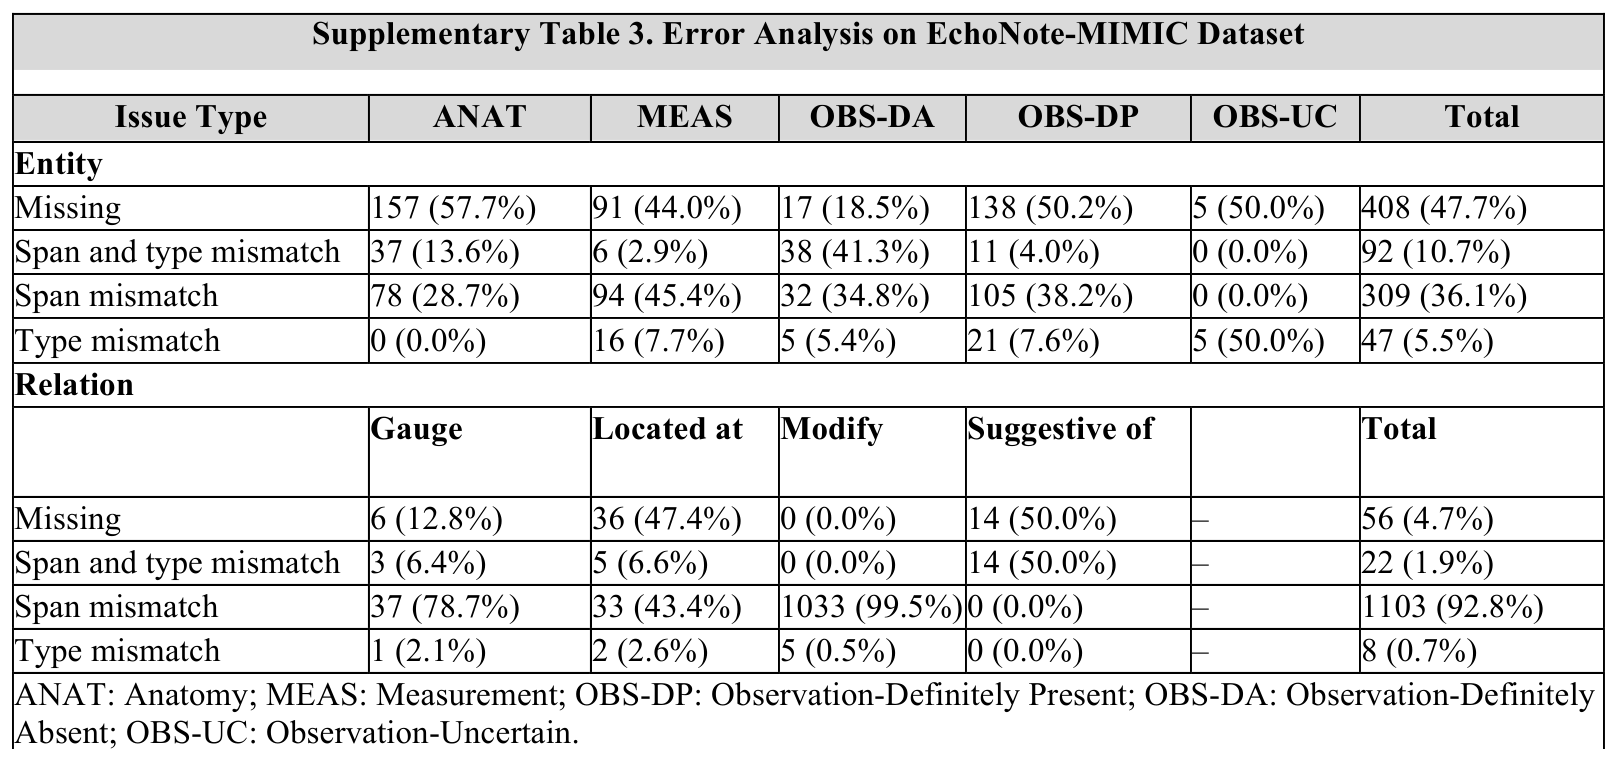
Span-boundary mismatches dominate Mayo entity errors (54.9%) and relation errors (98.2%). On MIMIC, missing entities are the largest entity-error group (47.7%), while span mismatch still accounts for 92.8% of relation errors. The full supplementary tables distinguish missing predictions, wrong spans, wrong types, and combined errors.
EchoGraph F1’s performance on corrupted synthetic echo reports
On 1,000 Arizona reports, replacing all directional terms or measurement values lowers EchoGraph F1 by roughly 50% or 60%, respectively. RadGraph F1 declines by about 6% or 12%. Both score 1.0 when a report is compared with itself. Figure 1 retains the curves at all tested corruption levels.
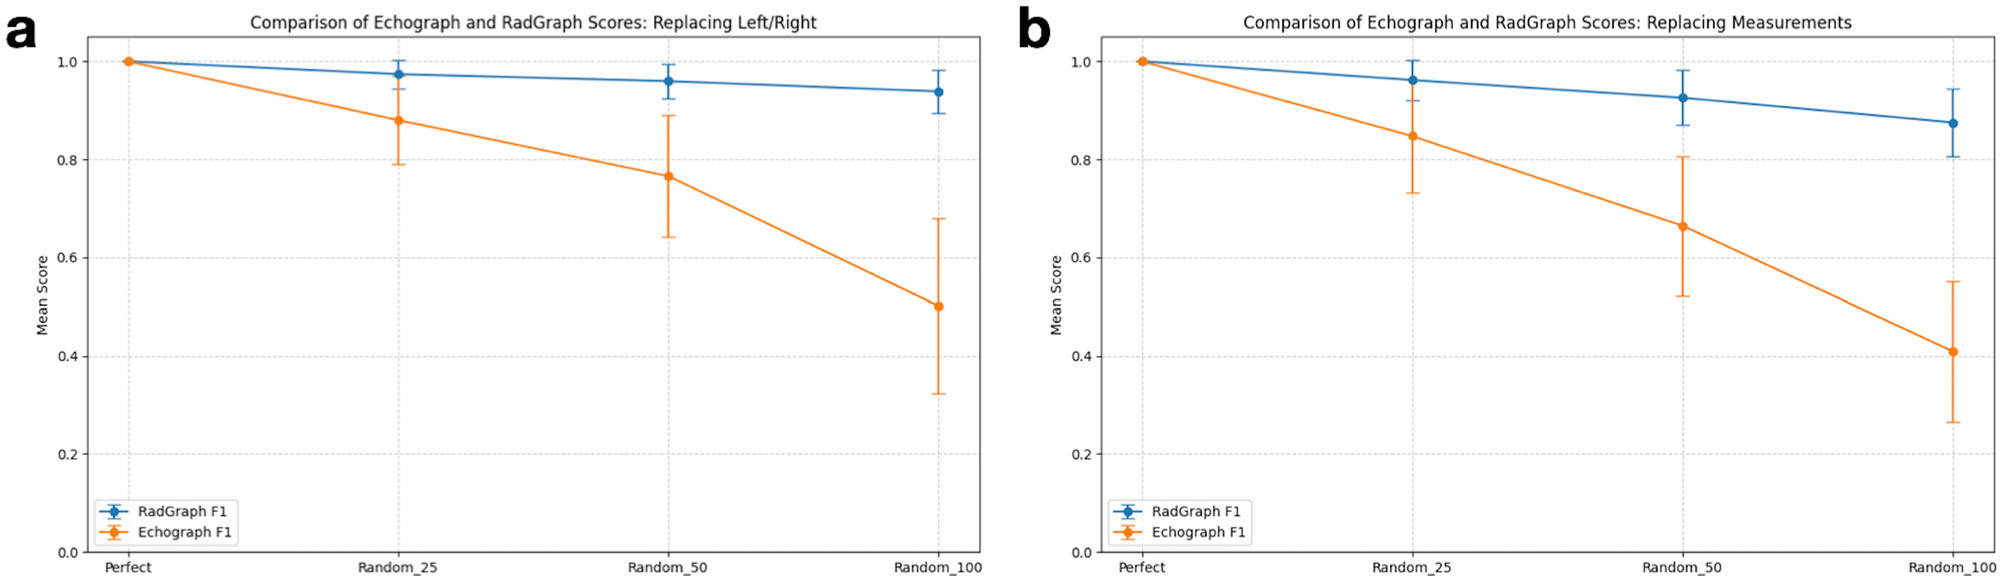
a Performance on reports with randomly replaced left and right modifiers. EchoGraph F1 showed high sensitivity to corrupted modifiers (50% drop) while RadGraph F1 maintained near-perfect scores with minimal sensitivity (6% drop). b Performance on reports with randomly replaced measurements. EchoGraph F1 demonstrated significant sensitivity to number corruption (60% drop) while RadGraph F1 showed only a modest reduction (12% drop).
Human expert error annotation study
Two experts identify an average of 96% of inserted errors, missing 0.35 ± 0.76 per report on average. Against the corruption ratio, EchoGraph has a regression slope of −0.817 versus RadGraph’s −0.291, R² of 0.803 versus 0.578, and Spearman correlation −0.836 versus −0.715.
These are associations with known synthetic errors and expert error counts. Although the discussion calls the outcome human preference, the described study does not directly measure a preference between freely generated reports. Table 5 retains all evaluation variants.
Error count (Annotator#1) | Error count (Annotator#2) | Averaged error count | Error ratio* | Ground truth error count** | ||
|---|---|---|---|---|---|---|
EchoGraph F1 | Spearman’s ρ | −0.795 | −0.800 | −0.800 | −0.836 | −0.800 |
Slope | −0.053 | −0.052 | −0.053 | −0.817 | −0.050 | |
R2 | 0.608 | 0.622 | 0.623 | 0.803 | 0.625 | |
RadGraph F1 | Spearman’s ρ | −0.727 | −0.739 | −0.737 | −0.715 | −0.740 |
Slope | −0.020 | −0.019 | −0.020 | −0.291 | −0.019 | |
R2 | 0.484 | 0.499 | 0.497 | 0.578 | 0.494 |
Discussion
The contribution combines a domain-specific extraction model with a weighted evaluation score. Its strongest evidence is improved sensitivity to the deliberately introduced error types. Extraction errors, especially under a new reporting style, remain a separate limitation.
Pros and cons of expanded schema
Phrase-level annotation is practical for long reports but creates ambiguity about how much text belongs in one entity. This contributes to strict span-match errors even when a category is correct. The additional measurement class also changes the classification problem relative to RadGraph.
The paper compares reported performance with earlier RadGraph systems, but does not provide a matched head-to-head training study isolating the effect of each schema change. Rare classes and terminology differences contribute to the larger external relation drop.
An automatic factual correctness metric for AI-generated echo reports
A graph score can better connect a measurement with the anatomy or observation it describes, reducing accidental credit for an unrelated matching term. Its proposed uses include assessing generated reports and preparing labeled text for vision-language research.
Limitations include retrospective sampling, two tertiary-center sources, small densely annotated cohorts, English-only text, and expansion of standard abbreviations before processing. The metric also depends on exact wording and text order, so clinically equivalent statements can receive low scores. Prospective workflow effects and broad clinical validity are not demonstrated.
Methods
Mayo Clinic echo reports
The authors randomly select Findings sections from 600 non-duplicate adult Mayo patients in 2017, remove subheadings, and split patients 70:20:10 into training, validation, and testing. An additional 1,000 Arizona reports support the directional/numerical corruption study, while 150 consecutive 2023 reports support the contemporary error study.
MIMIC-III ECHO-NOTE2NUM reports
The external cohort samples 60 reports from the public MIMIC-III ECHO-NOTE2NUM dataset [17], whose source reports come from intensive-care patients during 2001–2012. Findings are annotated and common abbreviations expanded.
Dense named entity and relation annotation
Entities are anatomy, measurements, and observations marked definitely present, definitely absent, or uncertain. Relations are Modify, Gauge, Located at, and Suggestive of. Only within-sentence relations are annotated. Phrase-level spans simplify labeling of long reports.
Non-diagnostic content is labeled out of scope, then used as negative training examples without an output category. Table 6 retains the full schema and examples; Figure 2 shows the corresponding graph.
Category | Example |
|---|---|
Named entities | |
Observation-definitely present (OBS-DP) | “There is severe mitral regurgitation.” “Findings consistent with cardiac amyloidosis.” |
Observation-definitely absent (OBS-DA) | “No regional wall motion abnormality”; “No evidence of hypertrophic cardiomyopathy.” |
Observation-uncertain (OBS-UC) | Possible foramen ovale. |
Anatomy (ANAT) | Left ventricle, Right ventricle. |
Measurements (MEAS) | Ejection fraction, size, and severity of valvular heart diseases. |
Out of scope* | “The study was performed at the bedside.” “Study performed per LV function protocol.” |
Relations | |
Modify | “Left ventricle” modifies “size” |
Gauge | “55%” gauge “ejection fraction” |
Located at | “Mass” located in “left ventricle” |
Suggestive of | “Grade 1/3” suggestive of “normal filling pressure” |
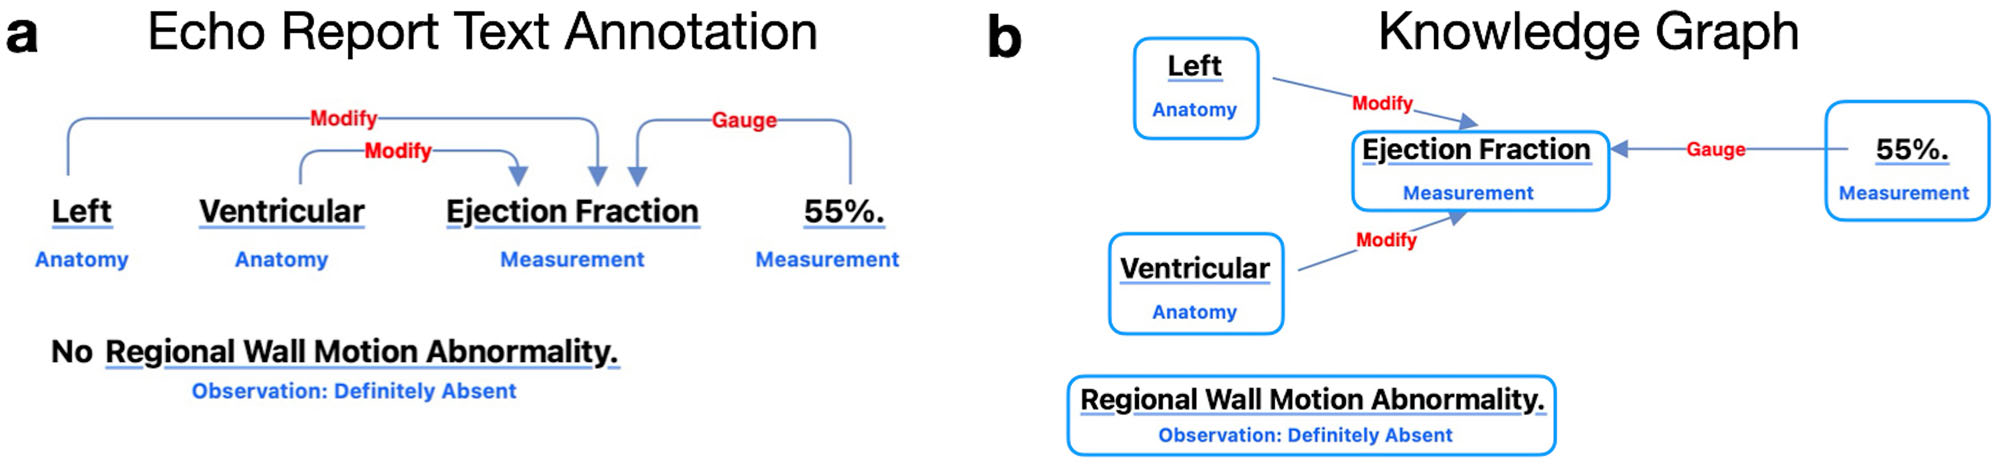
a Illustrates the annotation of two sentences: “left ventricular ejection fraction 55%” and “no regional wall motion abnormality.” Here, “left” and “ventricular” are annotated as anatomy entities, while “ejection fraction” and “55%” are annotated as measurement entities. “No regional wall motion abnormality” is annotated as Observation: Definitely Absent. The relations between entities are marked as “Modify” and “Gauge.” b Shows the corresponding knowledge graph for this annotation. Notably, “regional wall motion abnormality” is isolated from other entities, as no relations are annotated between the two sentences.
Annotating consistency and interobserver agreement
Annotation consistency is assessed on ten jointly labeled reports, followed by senior-cardiologist review and group revision. Entity agreement requires identical start/end word positions and category; relation agreement also requires matching both endpoint spans and the relation type.
Model training
A pretrained SciBERT model [24] is fine-tuned within DyGIE++ for joint extraction. Training runs for 50 epochs with learning rate 0.00005, weight decay 0.01, and batch size 1 on a single 24 GB graphics card.
Model performance evaluation
The study reports micro-averaged F1 because class frequencies are imbalanced. Correct entity predictions require exact span boundaries and type; correct relations require exact endpoint spans and relation type. These strict criteria penalize boundary differences as well as clinical labeling errors.
EchoGraph F1 score
The reward groups a central entity, defined as having no outgoing relations, with its incoming-related entities. An enriched unit receives weight α when it or an incoming-related entity has the measurement label; otherwise it receives weight 1. The experiments use α = 5.
Precision divides matched weighted units by hypothesis weighted units; recall uses reference weighted units. Their harmonic mean gives the final score. Figure 3 contrasts this grouping with independent entity scoring. The four original printed equations are retained below, including the source’s compressed typography in Equation 1.
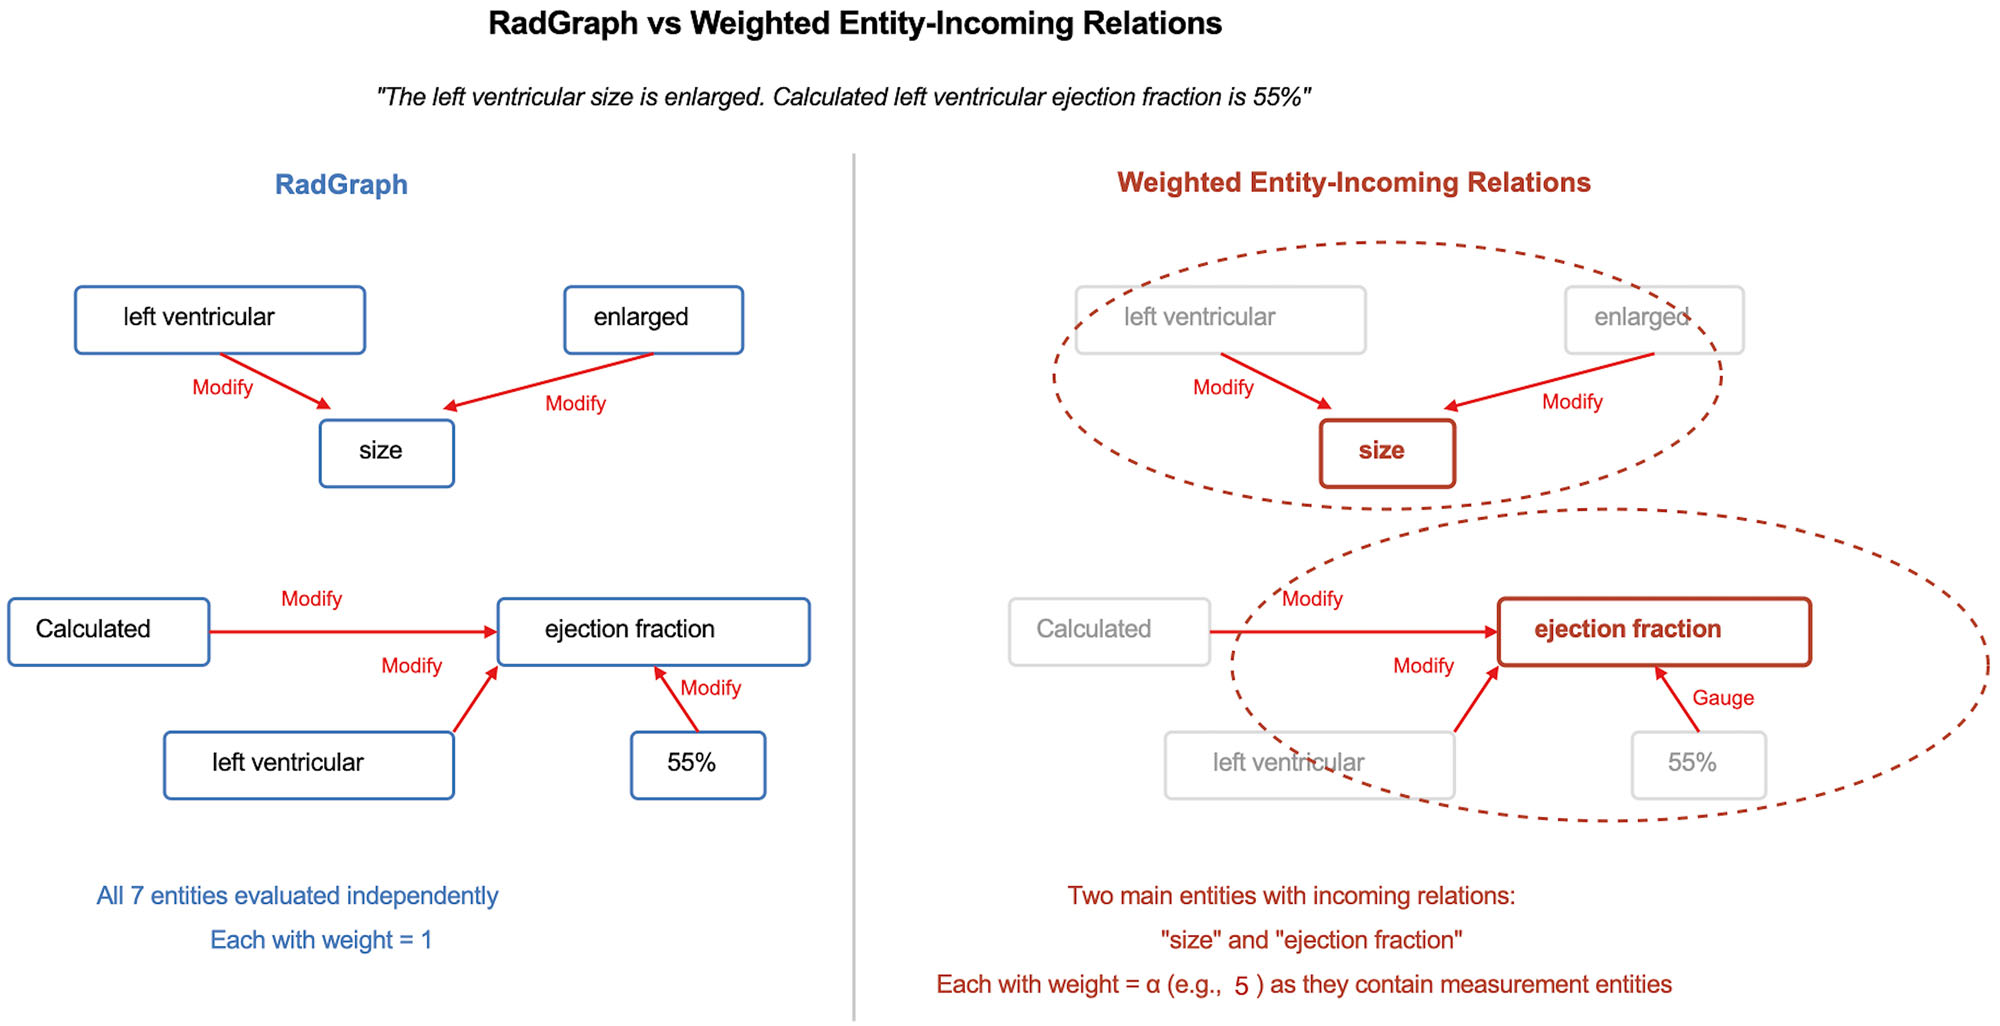
Using a sample sentence describing left ventricular size and ejection fraction measurements, RadGraph evaluates detected entities independently without additional weighting. In contrast, EchoGraph identifies main entities (typically measurements) and assigns a desired weight (here = 5) to their incoming relations during reward calculation.
Equations




The impact of data corruption on evaluation metrics in echo reports
The 1,000-report Arizona corruption experiment replaces measurement values and left/right modifiers at 25%, 50%, and 100% rates, then compares each altered report with its original. This tests controlled sensitivity to specified errors rather than the full distribution of mistakes made by a deployed generator.
Error analysis
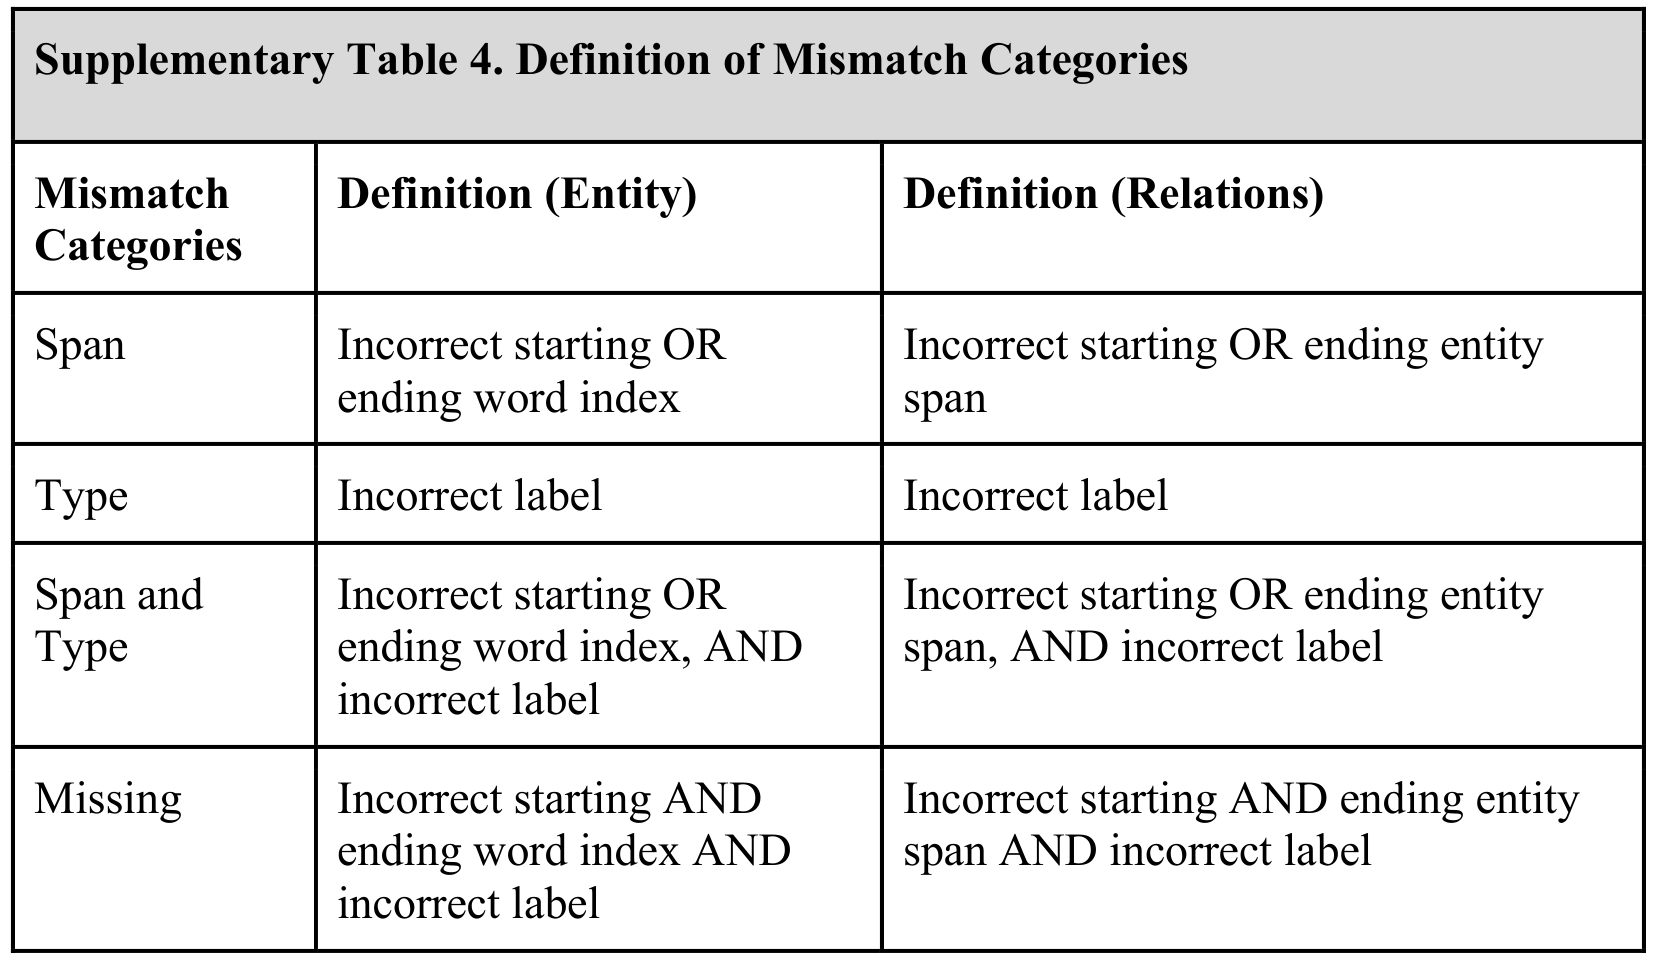
Extraction errors are divided into missing predictions, span mismatch, type mismatch, or both. Supplementary Tables 2–4 retain the counts and exact operational definitions.
Human expert error annotation study
The contemporary experiment modifies 0%, 50%, 75%, or 100% of selected measurement values, normal/abnormal classifications, and severity descriptors. Two cardiology experts count errors relative to the original reports. Evaluation uses correlation, regression slopes, and explained variance for the resulting scores.
Ethical review and approval
Mayo retrospective use was approved under the reported institutional protocol. MIMIC is de-identified and publicly available under its established research approvals.
Data availability
The authors release annotated MIMIC-EchoNotes data. Mayo reports remain restricted by patient privacy, with access considered on reasonable request to the corresponding author.
Code availability
The EchoGraph repository provides the model.
Acknowledgements
Chieh-Ju Chao reports support from Mayo cardiovascular and AI/ML research awards; the other authors report no relevant funding for this work.
Ethics declarations
Competing interests
The authors declare no competing interests.
Supplementary tables
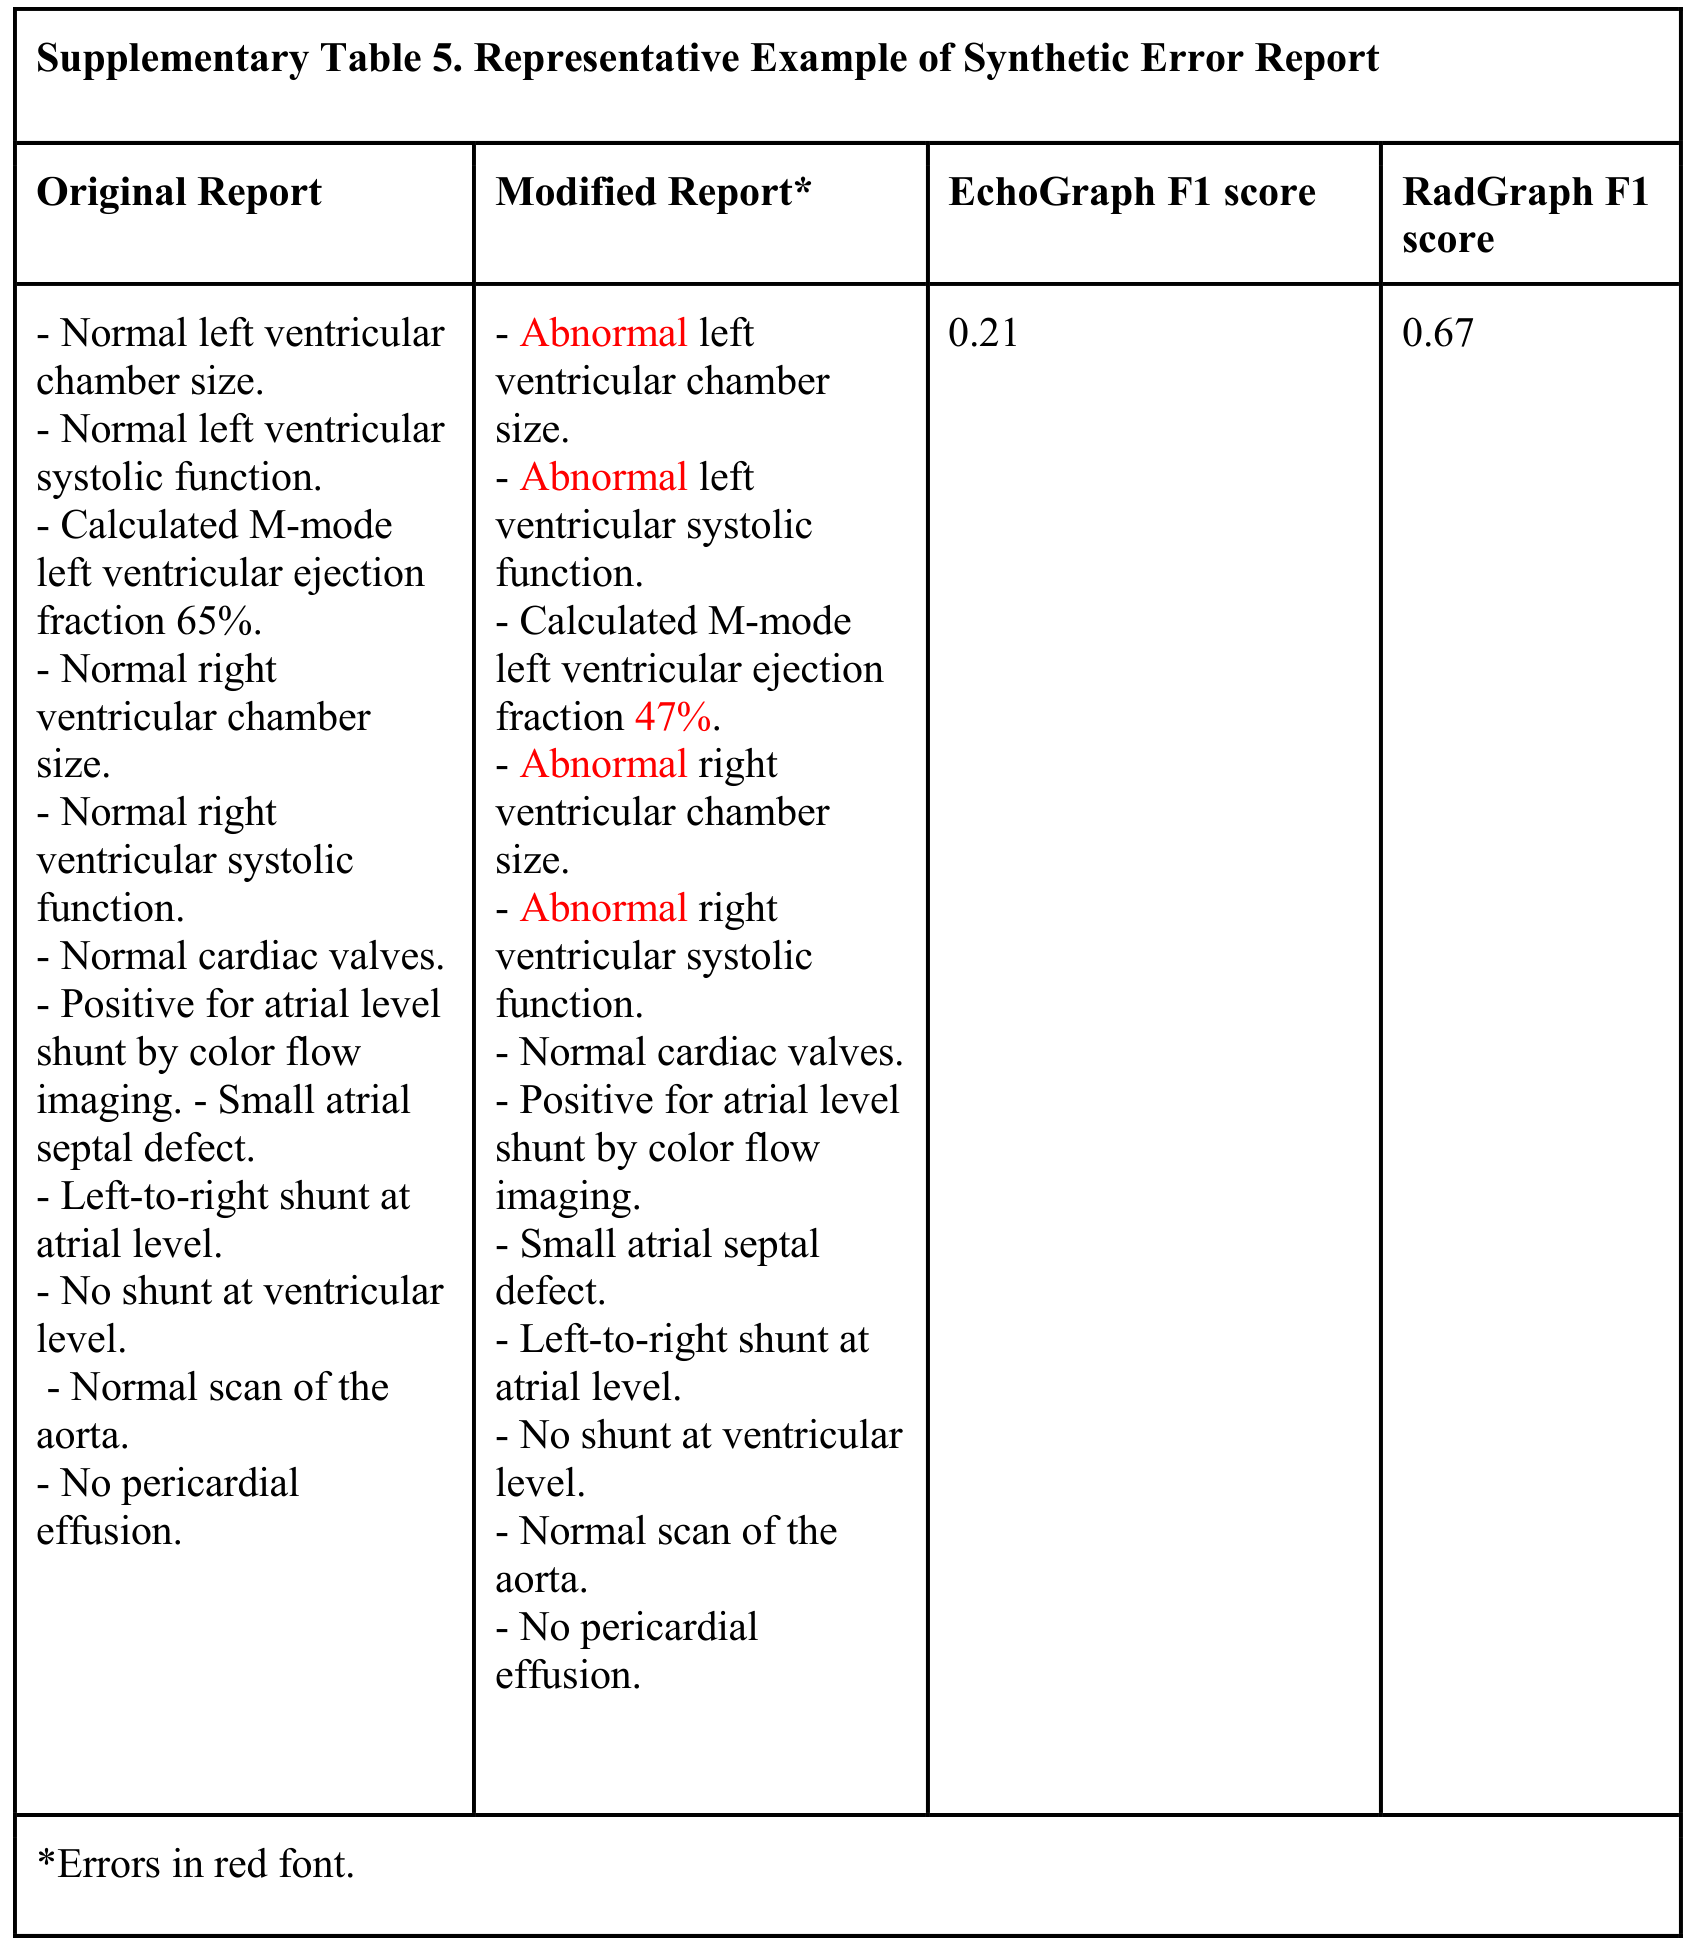
All five supplementary tables are retained: demographics, Mayo and MIMIC extraction errors, mismatch definitions, and a representative corrupted report. The example scores 0.21 with EchoGraph and 0.67 with RadGraph. The demographic table’s displayed sex and modality counts each sum to 599, although the cohort is labeled n = 600; the original values are preserved.