Abstract
Fine-tuning SAM on cardiac ultrasound yields a useful left-ventricle segmenter and improves transfer to some external datasets. This is a study of adapting an existing foundation model, with no new architecture.
The results depend on the metric and comparison: fine-tuned SAM performs well on overlap scores, while MedSAM often gives better boundary distances. A three-person annotation study roughly halves annotation time while preserving segmentation quality. The retrospective results do not establish clinical effectiveness in deployment.
Introduction
Left-ventricle measurements inform cardiac assessment, but expert tracing is expensive and varies between observers. The study compares adapting a broadly pretrained segmentation model with using a medical foundation model [26] or a specialized echocardiography model [3].
The main question is whether representative task-specific training data can make SAM competitive with MedSAM and EchoNet, and whether its promptable interface helps human annotators. External evaluation includes different institutions, ultrasound devices, and cardiac views.
Results
SAM’s zero-shot performance on echocardiography and POCUS
Zero-shot SAM achieves mean Dice similarity of 0.863 on the EchoNet test set, 0.882 on Mayo transthoracic studies, and 0.861 on Mayo point-of-care ultrasound. End-diastolic frames generally segment better than end-systolic frames. CAMUS scores are 0.866 for four-chamber and 0.852 for two-chamber views.
These results use bounding boxes derived from reference masks, so zero-shot here describes the model weights rather than fully autonomous object localization. Tables 1–2 preserve overlap and boundary-distance comparisons; MedSAM often performs better on boundary distances.
Dataset | Phase | ||||||||||
|---|---|---|---|---|---|---|---|---|---|---|---|
SAM112 (fine-tuned) | SAM (zero-shot) | EchoNet | U-Net | SAM112 (fine-tuned) | SAM (zero-shot) | EchoNet | U-Net | ||||
EchoNet-test | Overall | 0.911 ± 0.045*†∅+ | 0.863 ± 0.053 | 0.872 ± 0.056 | 0.915 ± 0.047 | 0.640 ± 0.151 | 0.840 ± 0.071*†∅+ | 0.763 ± 0.077 | 0.777 ± 0.083 | 0.847 ± 0.072 | 0.488 ± 0.157 |
0.929 ± 0.030*†∅+ | 0.878 ± 0.040 | 0.893 ± 0.040 | 0.903 ± 0.052 | 0.675 ± 0.134 | 0.868 ± 0.050*†∅+ | 0.784 ± 0.062 | 0.809 ± 0.062 | 0.826 ± 0.078 | 0.524 ± 0.148 | ||
0.894 ± 0.050*†∅+ | 0.849 ± 0.060 | 0.850 ± 0.061 | 0.928 ± 0.038 | 0.606 ± 0.160 | 0.812 ± 0.077*†∅+ | 0.742 ± 0.084 | 0.744 ± 0.088 | 0.868 ± 0.059 | 0.453 ± 0.159 | ||
Mayo- TTE | Overall | 0.902 ± 0.032*∅+ | 0.882 ± 0.036 | 0.883 ± 0.039 | 0.893 ± 0.090 | 0.597 ± 0.169 | 0.822 ± 0.051*∅+ | 0.790 ± 0.056 | 0.792 ± 0.061 | 0.814 ± 0.093 | 0.444 ± 0.162 |
0.916 ± 0.024*∅+ | 0.889 ± 0.037 | 0.903 ± 0.027 | 0.916 ± 0.031 | 0.634 ± 0.162 | 0.846 ± 0.040*∅+ | 0.802 ± 0.058 | 0.825 ± 0.044 | 0.846 ± 0.051 | 0.482 ± 0.161 | ||
0.887 ± 0.032*∅+ | 0.875 ± 0.033 | 0.862 ± 0.039 | 0.870 ± 0.119 | 0.561 ± 0.169 | 0.799 ± 0.050*∅+ | 0.779 ± 0.052 | 0.760 ± 0.059 | 0.782 ± 0.113 | 0.408 ± 0.156 | ||
Mayo- POCUS | Overall | 0.857 ± 0.047†+ | 0.861 ± 0.043 | 0.846 ± 0.072 | 0.667 ± 0.279 | 0.396 ± 0.239 | 0.753 ± 0.070†+ | 0.758 ± 0.066 | 0.740 ± 0.102 | 0.554 ± 0.265 | 0.275 ± 0.192 |
0.878 ± 0.036†+ | 0.876 ± 0.032 | 0.868 ± 0.064 | 0.717 ± 0.255 | 0.463 ± 0.232 | 0.785 ± 0.056†+ | 0.781 ± 0.051 | 0.772 ± 0.092 | 0.607 ± 0.253 | 0.329 ± 0.194 | ||
0.836 ± 0.047†+ | 0.846 ± 0.048 | 0.825 ± 0.074 | 0.617 ± 0.295 | 0.330 ± 0.229 | 0.720 ± 0.069†+ | 0.735 ± 0.072 | 0.708 ± 0.103 | 0.501 ± 0.270 | 0.221 ± 0.175 | ||
Overall | 0.891 ± 0.040*†∅+ | 0.852 ± 0.048 | 0.857 ± 0.057 | 0.752 ± 0.196 | 0.460 ± 0.154 | 0.805 ± 0.062*†∅+ | 0.745 ± 0.069 | 0.754 ± 0.081 | 0.633 ± 0.196 | 0.311 ± 0.130 | |
0.897 ± 0.037*†∅+ | 0.860 ± 0.042 | 0.877 ± 0.040 | 0.754 ± 0.196 | 0.458 ± 0.135 | 0.815 ± 0.059*†∅+ | 0.756 ± 0.062 | 0.783 ± 0.060 | 0.635 ± 0.197 | 0.307 ± 0.116 | ||
0.885 ± 0.041*†∅+ | 0.845 ± 0.052 | 0.838 ± 0.065 | 0.751 ± 0.196 | 0.461 ± 0.172 | 0.795 ± 0.064*†∅+ | 0.734 ± 0.073 | 0.725 ± 0.088 | 0.632 ± 0.196 | 0.315 ± 0.144 | ||
Overall | 0.897 ± 0.036*†∅+ | 0.866 ± 0.039 | 0.877 ± 0.044 | 0.850 ± 0.097 | 0.418 ± 0.159 | 0.815 ± 0.058*†∅+ | 0.766 ± 0.059 | 0.784 ± 0.066 | 0.749 ± 0.117 | 0.277 ± 0.128 | |
0.904 ± 0.033 *†∅+ | 0.873 ± 0.037 | 0.890 ± 0.035 | 0.850 ± 0.098 | 0.428 ± 0.139 | 0.827 ± 0.054*†∅+ | 0.776 ± 0.056 | 0.804 ± 0.055 | 0.749 ± 0.119 | 0.282 ± 0.114 | ||
0.889 ± 0.038 *†∅+ | 0.860 ± 0.041 | 0.864 ± 0.048 | 0.850 ± 0.096 | 0.409 ± 0.176 | 0.803 ± 0.060*†∅+ | 0.756 ± 0.061 | 0.763 ± 0.070 | 0.749 ± 0.115 | 0.272 ± 0.140 | ||
Dataset | Phase | ||||||||||
|---|---|---|---|---|---|---|---|---|---|---|---|
SAM112 (fine-tuned) | SAM (zero-shot) | EchoNet | U-Net | SAM112 (fine-tuned) | SAM (zero-shot) | EchoNet | U-Net | ||||
EchoNet-test | Overall | 4.408 ± 1.999*†∅+ | 7.780 ± 3.155 | 6.381 ± 2.143 | 9.196 ± 2.929 | 13.596 ± 6.131 | 0.156 ± 0.133*†∅+ | 0.350 ± 0.211 | 0.286 ± 0.181 | 0.753 ± 0.371 | 1.785 ± 1.429 |
4.425 ± 2.066*†∅+ | 8.320 ± 3.274 | 6.490 ± 2.272 | 9.715 ± 2.966 | 14.060 ± 6.637 | 0.123 ± 0.098*†∅+ | 0.338 ± 0.202 | 0.240 ± 0.150 | 0.860 ± 0.395 | 1.668 ± 1.340 | ||
4.390 ± 1.931*†∅+ | 7.239 ± 2.935 | 6.271 ± 2.000 | 8.678 ± 2.799 | 13.132 ± 5.543 | 0.188 ± 0.154*†∅+ | 0.361 ± 0.219 | 0.331 ± 0.198 | 0.646 ± 0.309 | 1.903 ± 1.505 | ||
Mayo- TTE | Overall | 7.543 ± 4.780*†+ | 8.581 ± 4.495 | 4.435 ± 1.275∅ | 23.714 ± 6.585 | 13.896 ± 5.261 | 0.814 ± 0.930*†+ | 0.854 ± 0.928 | 0.401 ± 0.147∅ | 5.705 ± 2.984 | 1.877 ± 1.425 |
7.855 ± 5.225*†+ | 9.127 ± 4.847 | 4.920 ± 1.402∅ | 26.539 ± 6.527 | 13.067 ± 4.669 | 0.903 ± 1.061*†+ | 0.927 ± 1.011 | 0.412 ± 0.165∅ | 5.337 ± 2.502 | 1.585 ± 1.214 | ||
7.241 ± 4.333*†+ | 8.054 ± 4.101 | 3.951 ± 0.914∅ | 20.938 ± 5.389 | 14.697 ± 5.701 | 0.728 ± 0.783†+ | 0.785 ± 0.843 | 0.390 ± 0.126∅ | 6.066 ± 3.375 | 2.159 ± 1.562 | ||
Mayo- POCUS | Overall | 8.804 ± 6.716*†+ | 9.072 ± 6.291 | 3.666 ± 1.041∅ | 19.821 ± 5.776 | 24.452 ± 23.324 | 1.202 ± 1.311†+ | 1.172 ± 1.297 | 0.436 ± 0.234∅ | 5.421 ± 2.655 | 4.911 ± 5.545 |
8.273 ± 6.395*†+ | 9.033 ± 5.851 | 3.858 ± 1.035∅ | 20.059 ± 5.617 | 20.855 ± 19.624 | 0.972 ± 1.113†+ | 1.065 ± 1.248 | 0.362 ± 0.150∅ | 4.889 ± 2.061 | 3.792 ± 4.414 | ||
9.335 ± 7.061†+ | 9.111 ± 6.776 | 3.475 ± 1.023∅ | 19.595 ± 5.983 | 28.050 ± 26.268 | 1.431 ± 1.462*†+ | 1.279 ± 1.351 | 0.511 ± 0.278∅ | 5.927 ± 3.058 | 6.029 ± 6.341 | ||
Overall | 5.624 ± 2.121*†+ | 5.842 ± 2.081 | 5.169 ± 2.354∅ | 6.962 ± 3.951 | 18.709 ± 7.665 | 0.237 ± 0.147*†+ | 0.257 ± 0.154 | 0.220 ± 0.214∅ | 0.469 ± 0.482 | 3.277 ± 2.000 | |
6.120 ± 2.198*+ | 6.302 ± 2.071 | 5.294 ± 2.365∅ | 6.653 ± 3.676 | 20.610 ± 8.075 | 0.236 ± 0.155*†+ | 0.252 ± 0.131 | 0.193 ± 0.155∅ | 0.384 ± 0.294 | 3.412 ± 1.907 | ||
5.129 ± 1.920*†+ | 5.382 ± 1.990 | 5.043 ± 2.339∅ | 7.270 ± 4.190 | 16.808 ± 6.720 | 0.237 ± 0.139*†+ | 0.262 ± 0.173 | 0.248 ± 0.257∅ | 0.555 ± 0.603 | 3.142 ± 2.081 | ||
Overall | 5.001 ± 1.728*†+ | 5.601 ± 1.926 | 4.826 ± 2.515∅ | 5.763 ± 2.519 | 19.748 ± 7.868 | 0.205 ± 0.117*†+ | 0.230 ± 0.124 | 0.176 ± 0.173∅ | 0.370 ± 0.267 | 3.717 ± 1.938 | |
5.367 ± 1.850*†+ | 6.085 ± 1.919 | 5.223 ± 2.895∅ | 5.838 ± 2.523 | 21.822 ± 8.322 | 6.120 ± 2.198+ | 6.302 ± 2.071 | 5.294 ± 2.365∅ | 6.653 ± 3.676 | 20.610 ± 8.075 | ||
4.635 ± 1.512*†+ | 5.118 ± 1.809 | 4.428 ± 1.990∅ | 5.687 ± 2.515 | 17.674 ± 6.787 | 5.129 ± 1.920*†+ | 5.382 ± 1.990 | 5.043 ± 2.339∅ | 7.270 ± 4.190 | 16.808 ± 6.720 | ||
SAM’s fine-tuned performance on echocardiography and POCUS
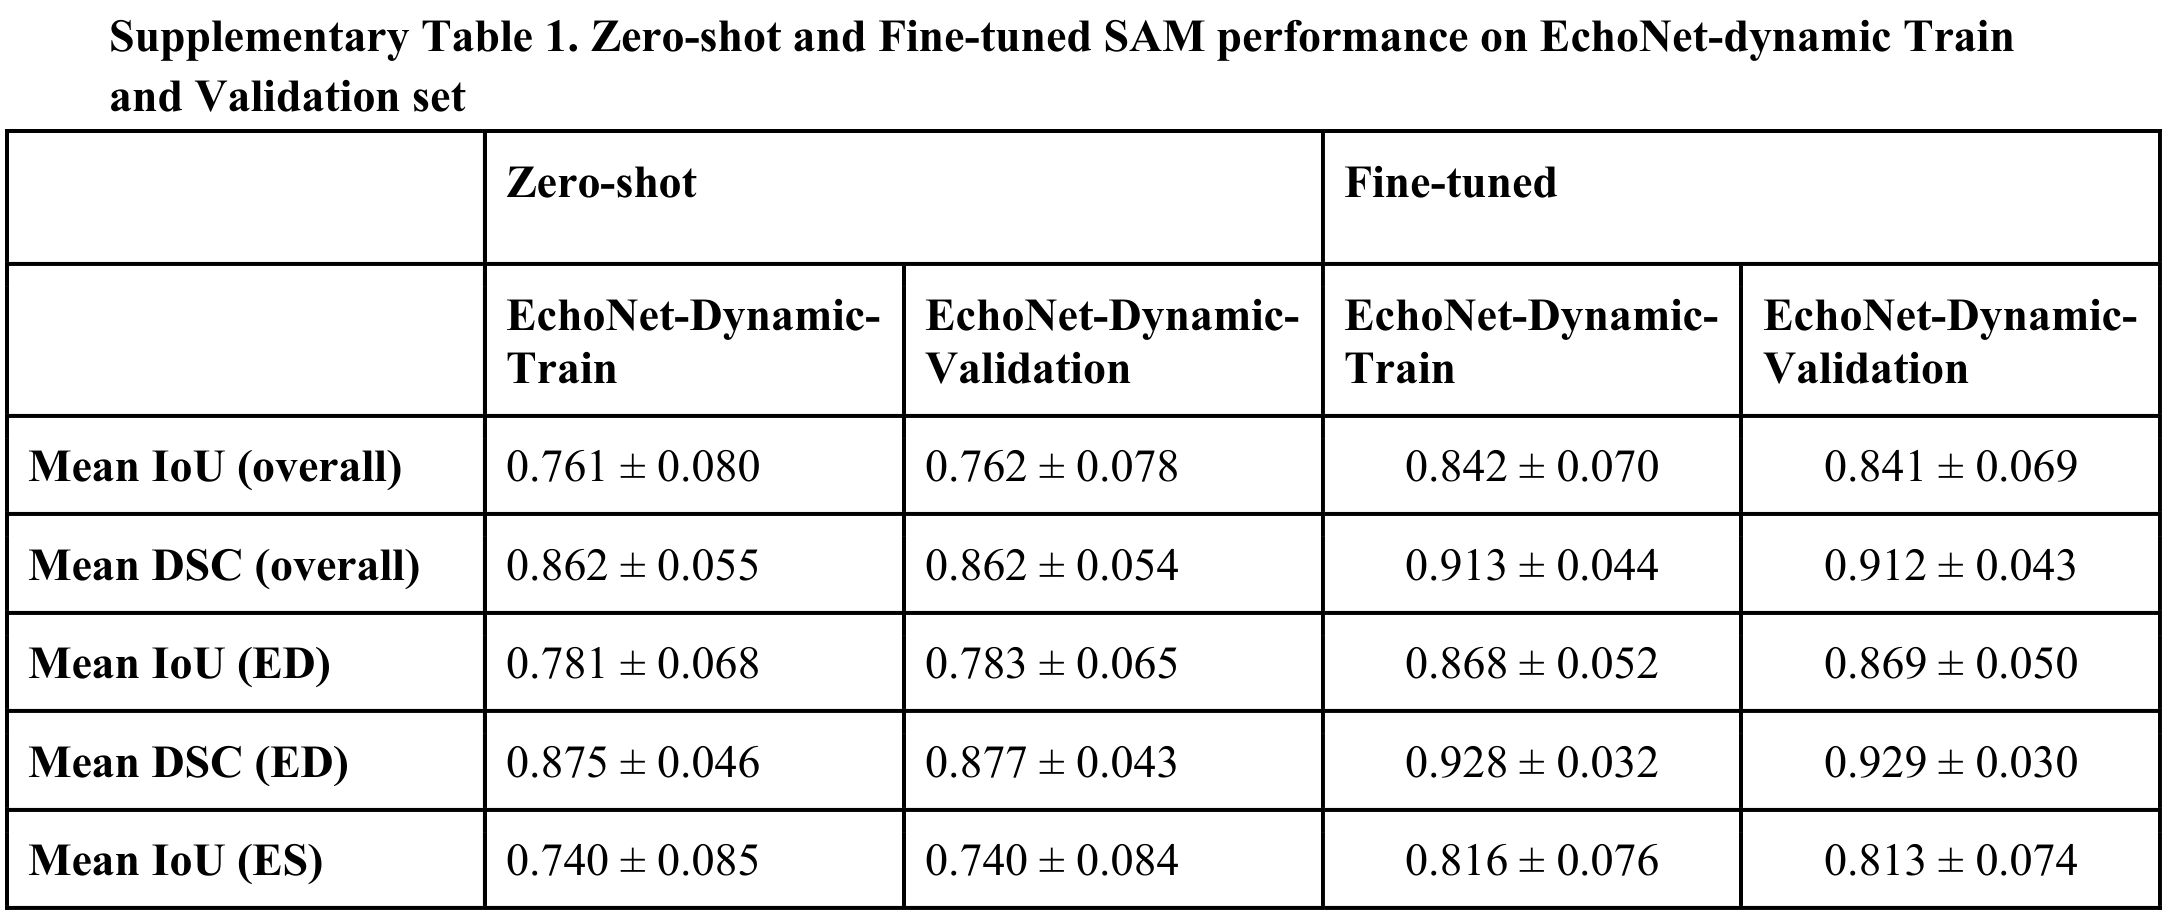
Fine-tuned SAM at 112-pixel input reaches Dice similarity 0.911 on EchoNet and 0.902 on Mayo transthoracic images. On Mayo point-of-care ultrasound it reaches 0.857, which does not improve on the zero-shot 0.861. Comparison to a second observer gives a numerical improvement to 0.876, but the corresponding test in Table 3 is not significant.
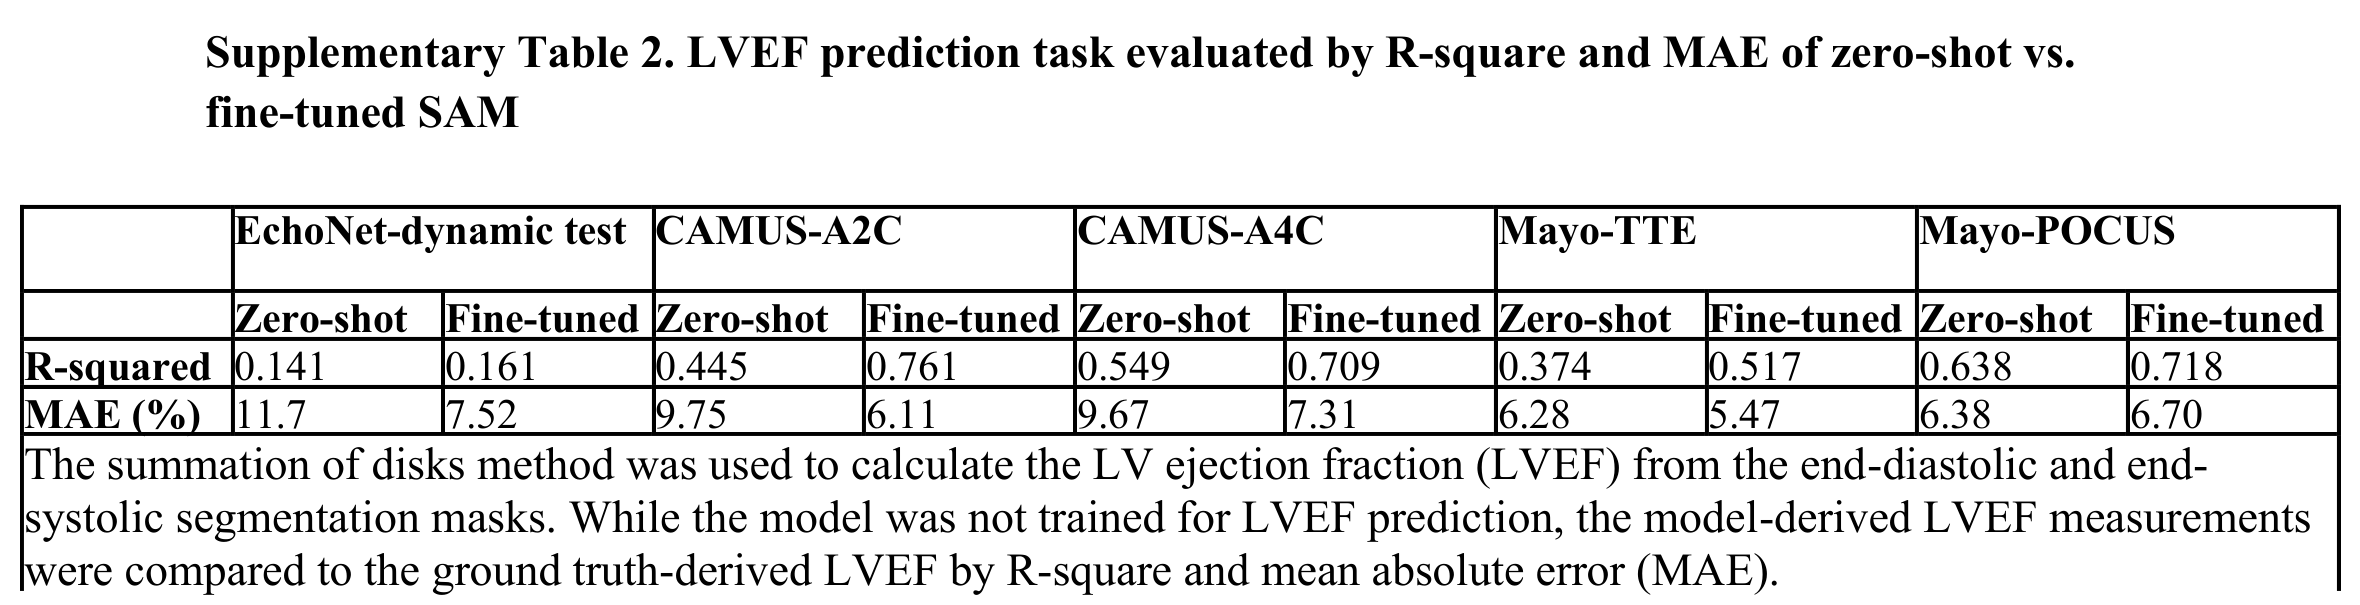
Ejection-fraction mean absolute error improves from 11.7 to 7.52 percentage points on EchoNet and 6.28 to 5.47 on Mayo transthoracic images, but worsens from 6.38 to 6.70 on point-of-care ultrasound. Figures 1–2 retain both successful and poor-quality cases; weak borders, off-axis views, and imperfect reference labels affect performance.
TTE (n = 33) | POCUS (n = 19) | |||||
|---|---|---|---|---|---|---|
Zero-shot | Fine-tuned SAM112 | p-value | Zero-shot | Fine-tuned SAM112 | p-value | |
Mean IoU (overall) | 0.776 ± 0.063 | 0.828 ± 0.061 | <0.0001 | 0.755 ± 0.067 | 0.781 ± 0.059 | 0.0551 |
Mean DSC (overall) | 0.873 ± 0.040 | 0.905 ± 0.038 | <0.0001 | 0.859 ± 0.046 | 0.876 ± 0.038 | 0.0591 |
0.781 ± 0.057 | 0.864 ± 0.033 | <0.0001 | 0.773 ± 0.051 | 0.799 ± 0.052 | 0.1964 | |
0.876 ± 0.037 | 0.927 ± 0.019 | <0.0001 | 0.871 ± 0.033 | 0.887 ± 0.032 | 0.2037 | |
0.771 ± 0.068 | 0.793 ± 0.062 | 0.1065 | 0.738 ± 0.078 | 0.763 ± 0.061 | 0.1721 | |
0.869 ± 0.043 | 0.883 ± 0.039 | 0.1044 | 0.847 ± 0.055 | 0.864 ± 0.041 | 0.1794 | |
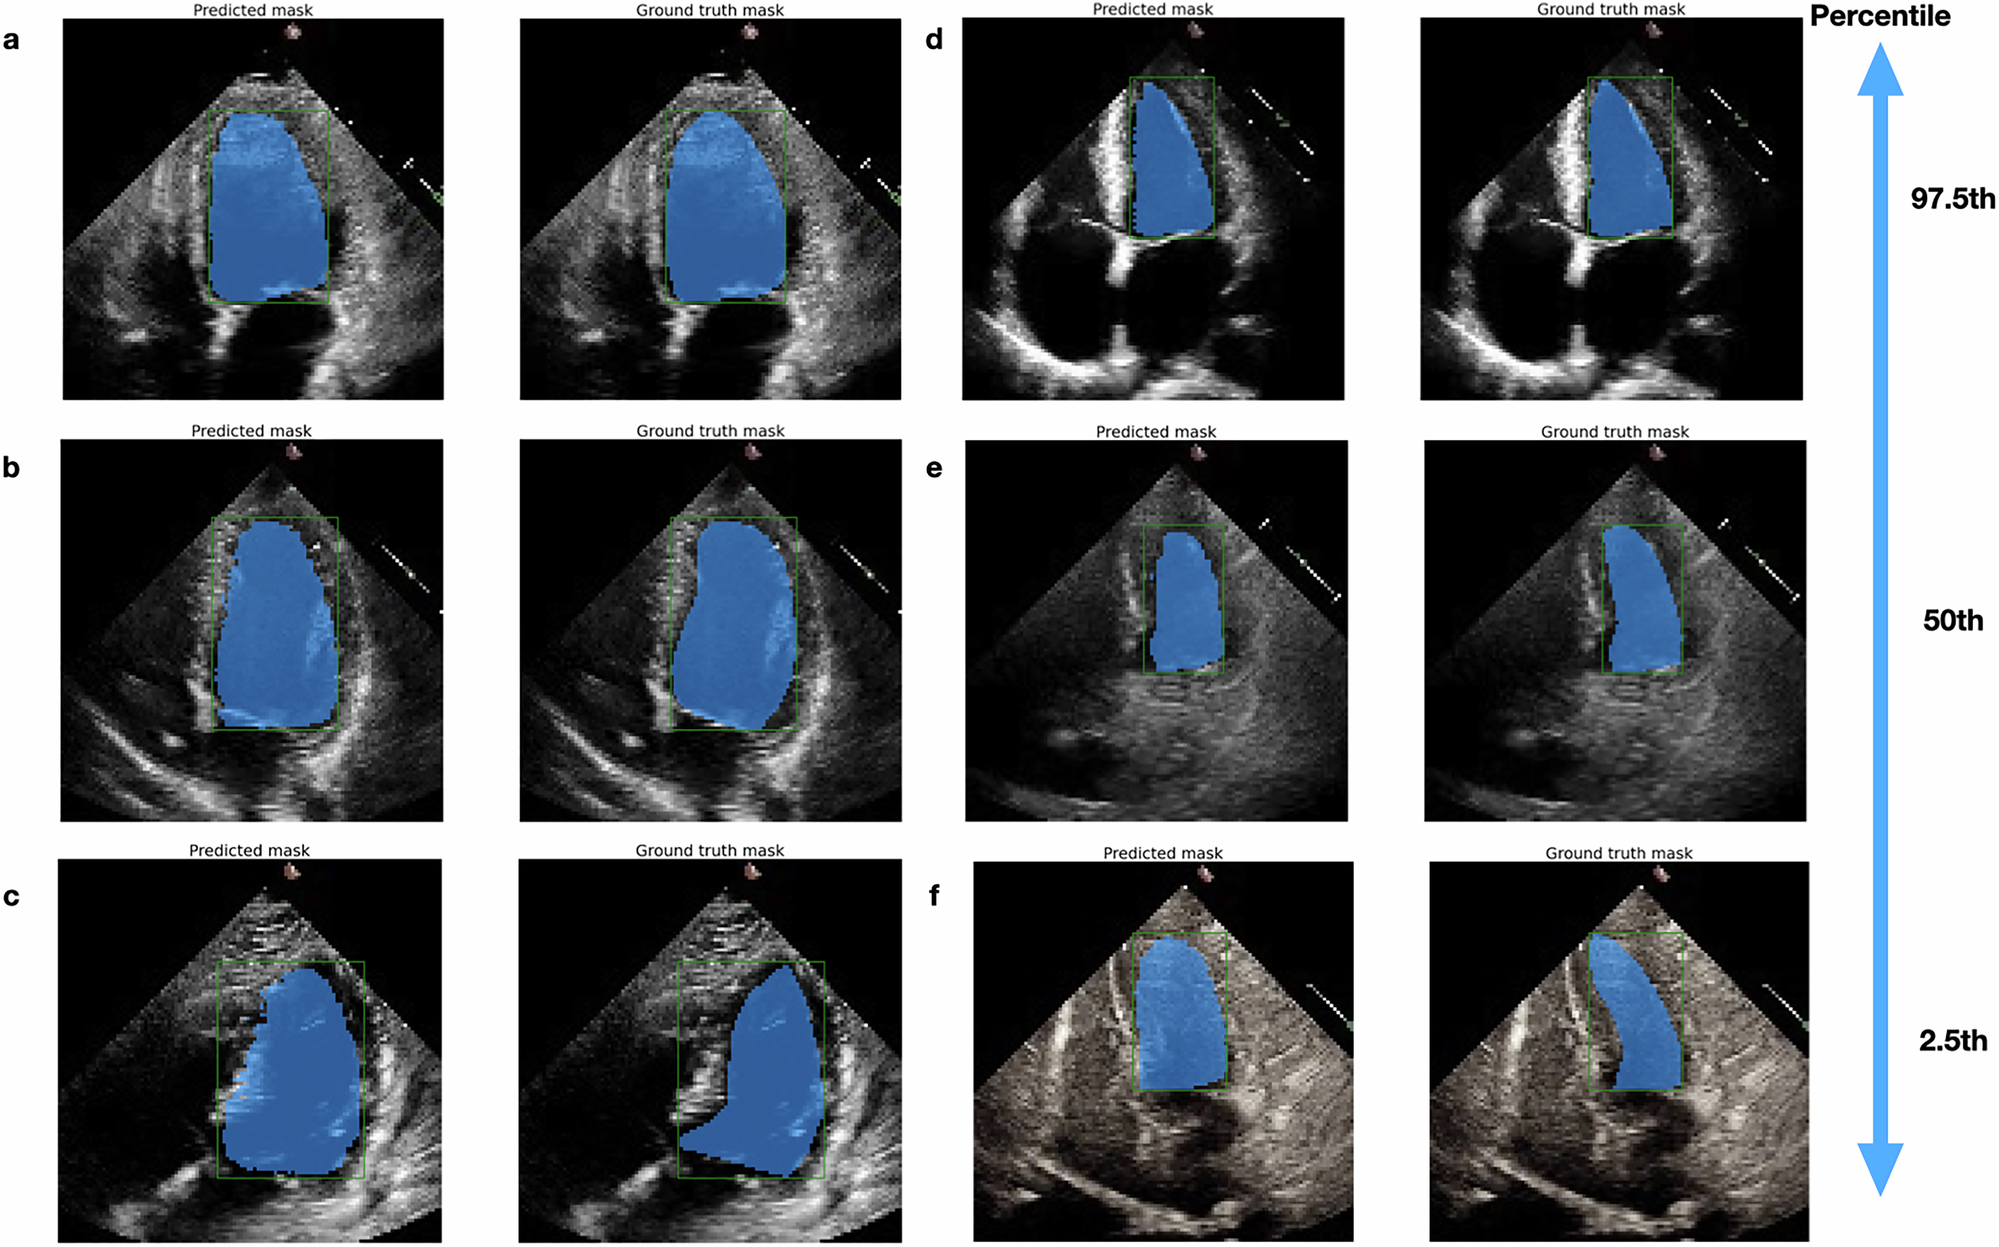
From top to bottom: 97.5th to 2.5th percentile of DSC. Panels a, b, and c are end-diastolic frames, and Panels d, e, and f are end-systolic frames. We observed that many of the poor-performance cases had suboptimal image qualities, such as weak LV endocardial borders or off-axis views (Panels c and f, suggesting the importance of good input image quality on model performance. Additionally, end-diastolic frames usually have a better delineation of borders than end-systolic frames, which is consistent with the model performance (end-diastolic slightly better than end-systolic).
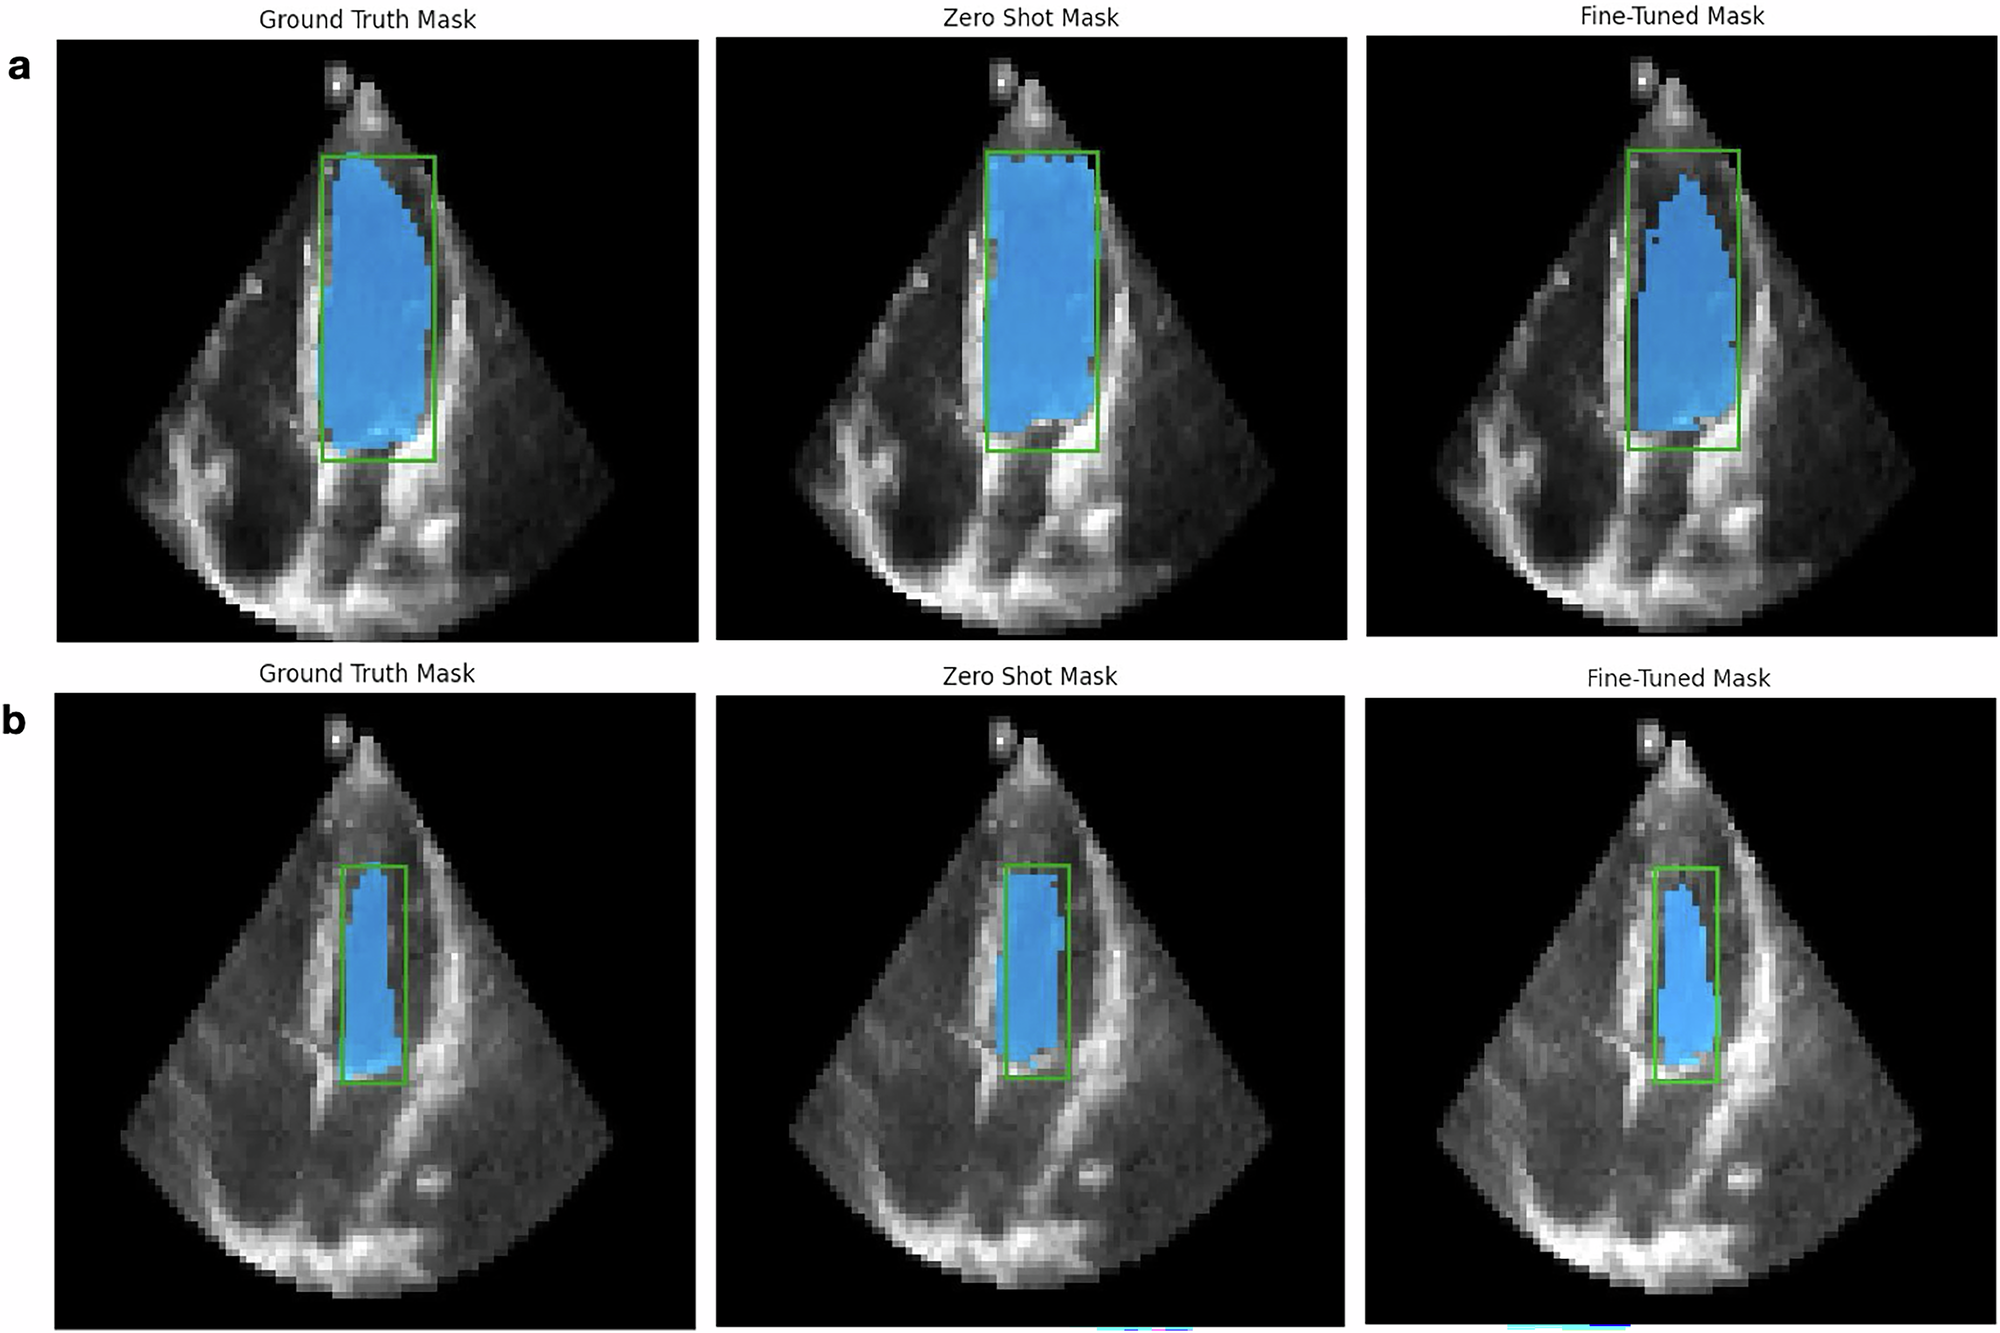
Panel a. end-diastolic frame, Panel b. end-systolic frame. From left to right are the ground truth, zero-shot, and fine-tuned mask, with an overlay of bounding boxes (green-colored) and mask (blue-colored), on the original POCUS image. Fine-tuned masks were more consistent with the anticipated left ventricular geometry on visualization. Note that POCUS images generally had worse quality compared to transthoracic echocardiography images.
Comparison of SAM, MedSAM, EchoNet, and U-Net models
Fine-tuned SAM generalizes better than EchoNet to the tested two-chamber and point-of-care images: Dice similarity is 0.891 versus 0.752 on CAMUS two-chamber views and 0.857 versus 0.667 on Mayo point-of-care images. It does not lead every comparison: EchoNet scores 0.915 versus SAM’s 0.911 on its own test distribution. MedSAM often leads on boundary-distance metrics, and CAMUS was included in MedSAM training.
With matched 1024-pixel fine-tuning, SAM and MedSAM reach nearly identical EchoNet Dice scores, 0.935 and 0.936. Both show some external-performance reductions relative to other configurations. Table 4 retains the full comparison.
Reported inference throughput is about 7.3 images/second for SAM, 5.0 for MedSAM, 153.3 for EchoNet, and 26 for U-Net. EchoNet throughput is averaged over video frames, so model inputs and execution modes differ.
Dataset | Phase | ||||||||
|---|---|---|---|---|---|---|---|---|---|
SAM1024 (fine-tuned) | MedSAM (fine-tuned) | SAM1024 (fine-tuned) | MedSAM (fine-tuned) | SAM1024 (fine-tuned) | MedSAM (fine-tuned) | SAM1024 (fine-tuned) | MedSAM(fine-tuned) | ||
EchoNet-test | Overall | 0.935 ± 0.031 | 0.936 ± 0.030* | 0.879 ± 0.051 | 0.881 ± 0.050* | 0.089 ± 0.071 | 0.087 ± 0.061 | 3.041 ± 1.158 | 3.016 ± 1.105 |
0.946 ± 0.021 | 0.947 ± 0.020* | 0.898 ± 0.036 | 0.900 ± 0.035* | 0.074 ± 0.044 | 0.071 ± 0.042* | 3.084 ± 1.105 | 3.046 ± 1.095 | ||
0.924 ± 0.035 | 0.924 ± 0.034 | 0.861 ± 0.057 | 0.861 ± 0.055 | 0.104 ± 0.088 | 0.103 ± 0.072 | 2.998 ± 1.206 | 2.986 ± 1.115 | ||
Mayo- TTE | Overall | 0.899 ± 0.026 | 0.894 ± 0.029 | 0.817 ± 0.042 | 0.810 ± 0.046 | 0.136 ± 0.044 | 0.142 ± 0.052 | 3.232 ± 0.743 | 3.294 ± 0.763 |
0.913 ± 0.016 | 0.911 ± 0.017 | 0.839 ± 0.026 | 0.838 ± 0.028 | 0.116 ± 0.028 | 0.117 ± 0.026 | 3.127 ± 0.715 | 3.220 ± 0.641 | ||
0.885 ± 0.027 | 0.877 ± 0.029 | 0.795 ± 0.044 | 0.782 ± 0.044 | 0.155 ± 0.048 | 0.167 ± 0.059 | 3.336 ± 0.763 | 3.369 ± 0.867 | ||
Mayo- POCUS | Overall | 0.842 ± 0.056 | 0.839 ± 0.062 | 0.731 ± 0.075 | 0.727 ± 0.086 | 0.229 ± 0.217 | 0.240 ± 0.244 | 3.289 ± 1.424 | 3.373 ± 1.645 |
0.860 ± 0.060 | 0.862 ± 0.052 | 0.758 ± 0.078 | 0.761 ± 0.071 | 0.223 ± 0.299 | 0.224 ± 0.321 | 3.317 ± 1.857 | 3.375 ± 2.134 | ||
0.824 ± 0.044 | 0.815 ± 0.063 | 0.703 ± 0.062 | 0.693 ± 0.086 | 0.235 ± 0.073 | 0.256 ± 0.128 | 3.260 ± 0.809 | 3.371 ± 0.962 | ||
Overall | 0.845 ± 0.063 | 0.872 ± 0.062* | 0.736 ± 0.088 | 0.777 ± 0.085* | 0.392 ± 0.320 | 0.288 ± 0.309* | 6.727 ± 2.983 | 5.758 ± 2.927* | |
0.861 ± 0.050 | 0.886 ± 0.043* | 0.760 ± 0.075 | 0.798 ± 0.066* | 0.364 ± 0.284 | 0.259 ± 0.228* | 7.008 ± 3.036 | 6.032 ± 3.035* | ||
0.828 ± 0.070 | 0.857 ± 0.073* | 0.712 ± 0.094 | 0.756 ± 0.096* | 0.420 ± 0.351 | 0.316 ± 0.371* | 6.446 ± 2.905 | 5.484 ± 2.791* | ||
Overall | 0.861 ± 0.051 | 0.880 ± 0.047* | 0.759 ± 0.075 | 0.790 ± 0.072* | 0.323 ± 0.261 | 0.255 ± 0.239* | 6.075 ± 2.812 | 5.419 ± 2.807* | |
0.869 ± 0.049 | 0.888 ± 0.045* | 0.772 ± 0.073 | 0.801 ± 0.069* | 0.336 ± 0.300 | 0.260 ± 0.271* | 6.709 ± 3.184 | 5.862 ± 3.196* | ||
0.853 ± 0.051 | 0.873 ± 0.049* | 0.747 ± 0.075 | 0.778 ± 0.073* | 0.311 ± 0.215 | 0.250 ± 0.202* | 5.440 ± 2.211 | 4.975 ± 2.272* | ||
Human Annotation Study
Two experts and one medical student each annotate the same 100 sampled images with and without SAM assistance. Mean time decreases from 11.6 to 5.7 seconds, while Dice-based annotation quality is maintained. Figure 3 separates the annotators and outcomes.
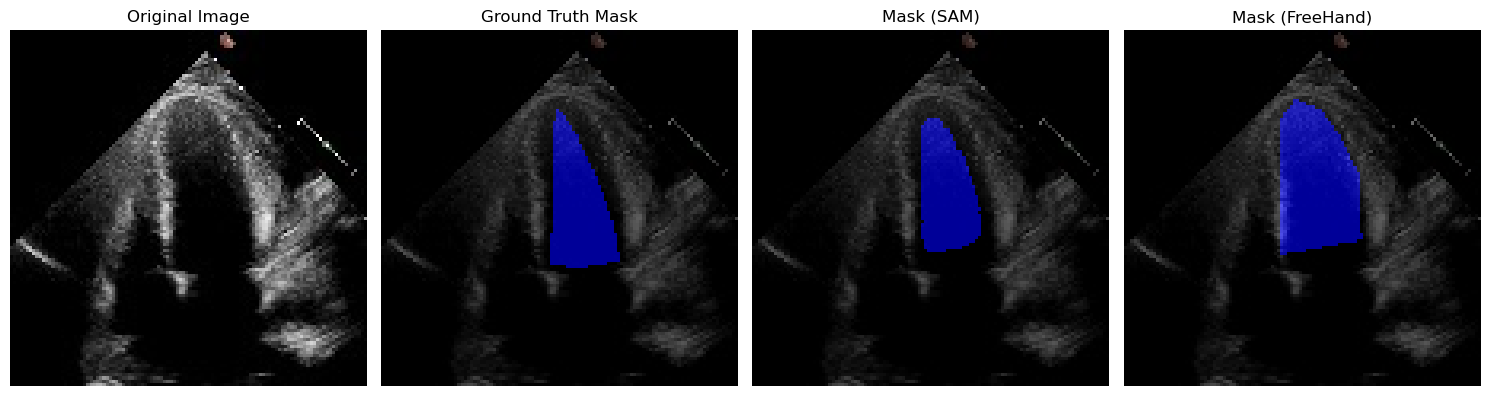
This is a small annotation-efficiency study rather than a prospective clinical trial. The supplementary example shows a reference-mask imperfection and a novice freehand error, illustrating why agreement scores alone do not fully capture annotation quality.
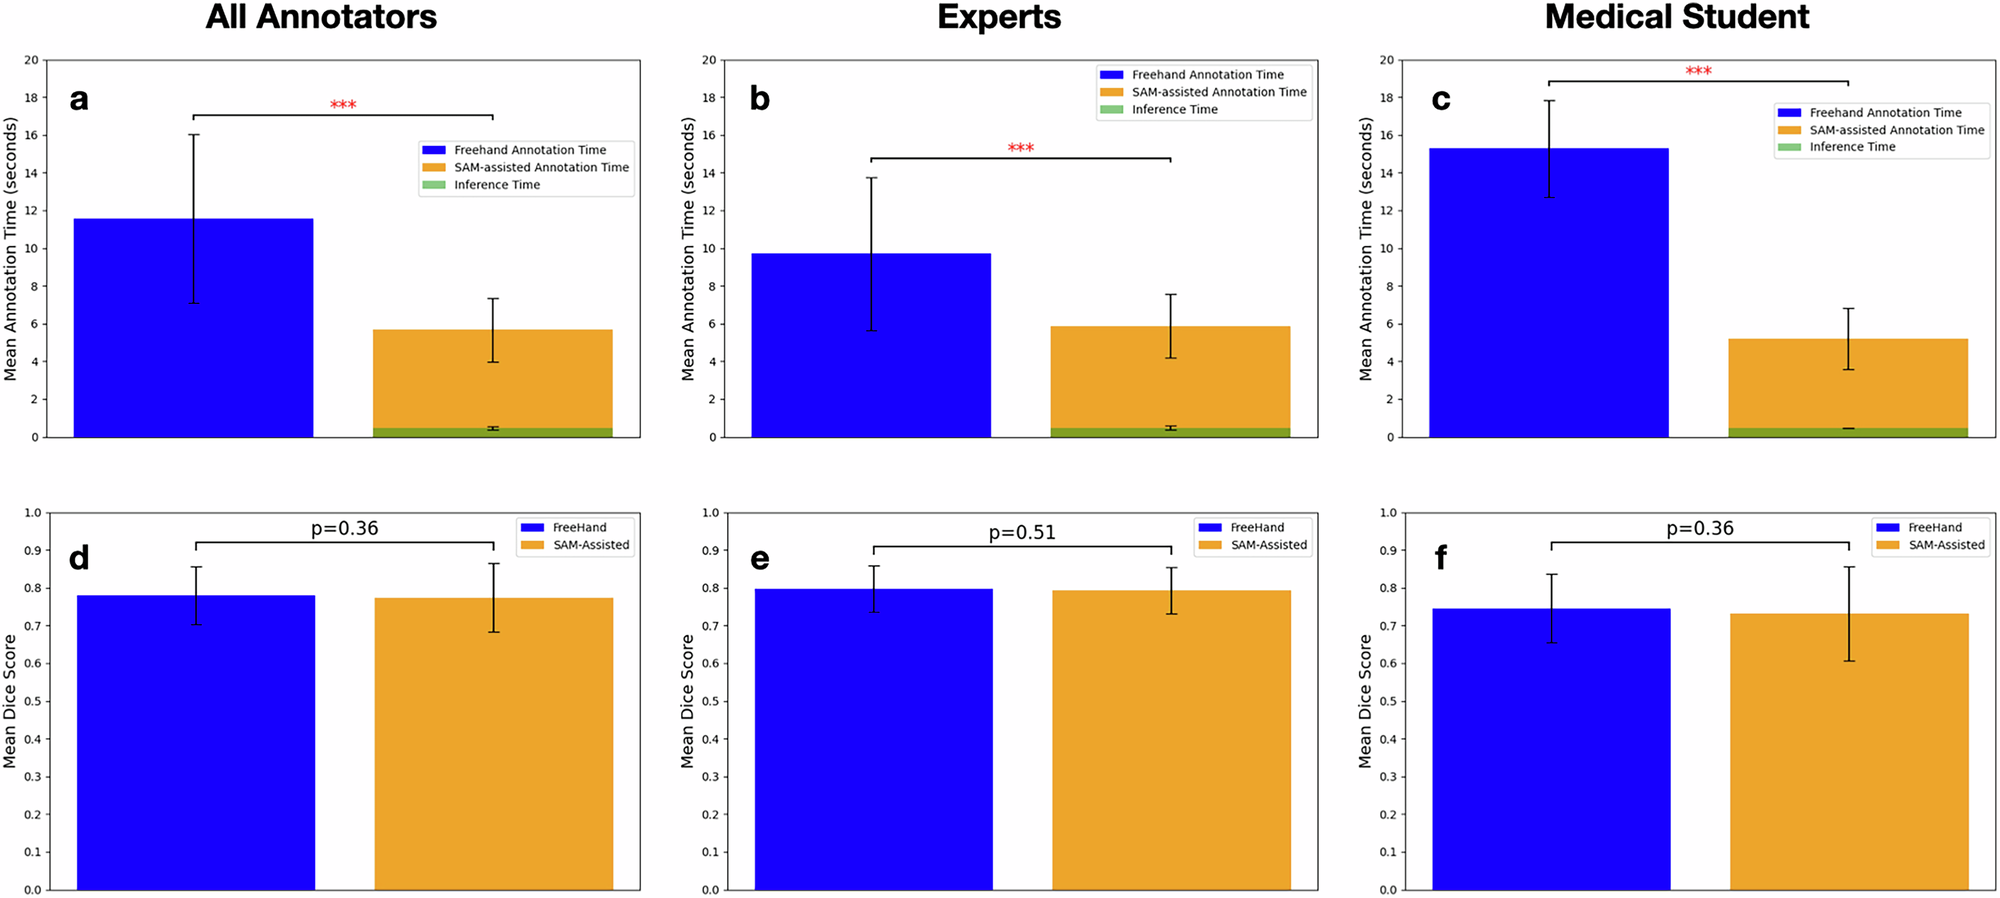
a With SAM’s assistance, the average annotation time significantly decreased by 50%. b Among experienced annotators, the workflow decreased annotation time by 39.2%; (c) It also reduced 66.0% annotation time for an inexperienced annotator. d–f No significant difference was observed in segmentation quality when measured by the Dice Similarity Score. ***p < 0.0001.
Discussion
Representative task-specific fine-tuning can make a general vision model competitive on this medical segmentation task. Its promptable interface can also reduce manual tracing time, with user refinement available when the first mask is unsatisfactory.
Important limits remain: retrospective sampling, selection bias, small external point-of-care data, imperfect labels, and evaluation of preselected end-diastolic/end-systolic frames rather than continuous video. Model architecture is unchanged; adapters, prospective workflow impact, and the full performance–generalization trade-off are not evaluated.
The discussion’s broad claim of superior frame-level performance should be read alongside Table 1, where EchoNet has slightly better overall EchoNet-test overlap. The text also refers to Supplementary Table 3 for boundary metrics, but the supplied Supplementary Table 3 lists excluded cases; boundary results appear in main Table 2.
Methods
Population and Data Curation
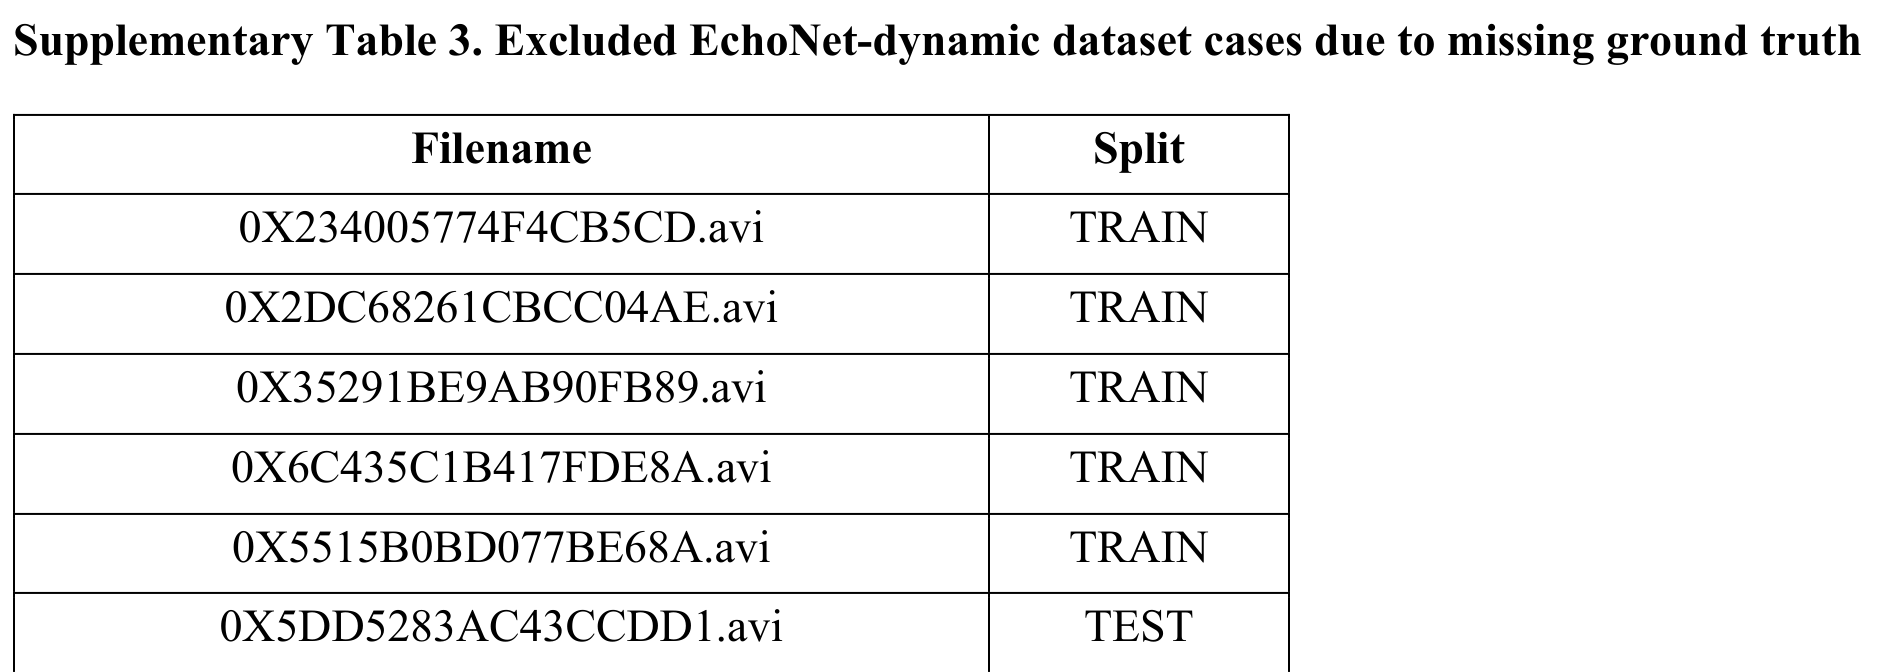
EchoNet-Dynamic contains 10,030 Stanford four-chamber videos, originally split into 7,465 training, 1,277 validation, and 1,288 test patients. Five training cases and one test case lack reference masks and are excluded; all six filenames are preserved in the supplement.
The Mayo external dataset contains 99 patients: 58 transthoracic and 41 point-of-care studies. Two observers independently trace 52 cases, including 33 transthoracic and 19 point-of-care studies. CAMUS contributes 500 French hospital cases with two- and four-chamber views. These cohorts differ in demographics, ejection fraction, modality, and image quality.
Segment Anything Model (SAM), MedSAM, and U-Net
SAM uses image and prompt encoders plus a mask decoder [24]. MedSAM adapts base SAM using more than 1.5 million medical image-mask pairs across multiple modalities. The U-Net comparison uses a ResNet-18 backbone [39] [40]; EchoNet is a video-based specialist model.
Data Preprocessing
The study extracts labeled end-diastolic and end-systolic frames and constructs masks from expert contours. EchoNet frames are 112 × 112 pixels. Mayo images are de-identified, horizontally flipped, and resized; CAMUS images are rotated and resized to match the EchoNet convention. SAM then applies its built-in longest-side resizing.
Zero-shot Evaluation
Zero-shot evaluation uses the original SAM ViT-base checkpoint without fine-tuning. Prompts are bounding boxes computed from ground-truth masks. Point prompts are not evaluated because weak ultrasound boundaries and the connection between atrium and ventricle can cause incorrect masks. The availability of reference-derived boxes is an evaluation condition, not a claim that localization is solved.
Model Fine-tuning
SAM trains on 7,460 EchoNet cases without augmentation, using Dice plus cross-entropy loss, Adam with zero weight decay, batch size 8, and a learning rate decreasing from 2×10⁻⁵ to 3×10⁻⁶ over 27 epochs. U-Net uses similar training without box prompts, with its best model at 23 epochs.
For a matched comparison with MedSAM, SAM and MedSAM are also fine-tuned with 1024-pixel inputs for 70 epochs. Reported training times are approximately 25 hours for SAM 112, 40 for SAM 1024, 50 for MedSAM, and 16 minutes for U-Net. The SAM run uses one 24 GB graphics card.
Validation and Generalization
Held-out EchoNet cases test within-dataset performance. CAMUS two- and four-chamber images and Mayo transthoracic/point-of-care images test transfer. CAMUS is not independent pretraining evidence for MedSAM because it was included in that model’s training.
Human Annotation Study
Each of three annotators labels 100 EchoNet test images in both workflows. With SAM they draw a bounding box and refine its mask; without SAM they trace the endocardium manually. Both workflows allow correction until satisfactory. Completion time and overlap against the reference mask are measured.
Statistical Model Performance Evaluation
Dice and intersection-over-union measure region overlap; Hausdorff and average surface distances measure boundaries. The supplement retains the four formulas, including the source’s one-direction average surface distance. Depending on distribution, comparisons use two-tailed paired t-tests or Wilcoxon tests, with p < 0.05 as the stated significance threshold.
Ethical review and approval
The retrospective datasets were used under institutional ethics approvals and de-identification procedures. Mayo includes patients who had consented to minimal-risk retrospective research; additional consent was waived under the reported protocol.
Data availability
EchoNet and CAMUS are public. The Mayo dataset is restricted by patient privacy rules and is available from the corresponding author upon reasonable request.
Code availability
The authors provide model checkpoints and fine-tuning, inference, and statistical-analysis code at SAM-Echo.
Acknowledgements
The authors acknowledge Stanford computational support and medical imaging infrastructure.
Ethics declarations
Competing interests
The authors declare no competing interests.
Supplementary results and metric definitions
The supplement preserves the full metric definitions, training/validation comparisons, derived ejection-fraction results, excluded cases, and the qualitative annotation example. Its ejection-fraction assessment is derived from segmentation masks; the models were not trained for that prediction task.
Equations S1–S4
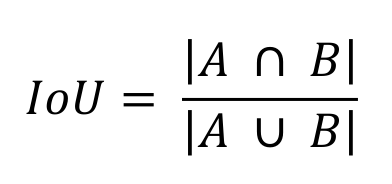
Intersection over Union. A is the predicted segmentation and B is the reference segmentation; the distance metrics compare their boundaries. The source defines ASD as the one-way mean distance from A to B.
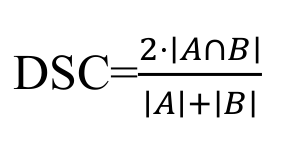
Dice similarity coefficient. A is the predicted segmentation and B is the reference segmentation; the distance metrics compare their boundaries. The source defines ASD as the one-way mean distance from A to B.

Hausdorff distance. A is the predicted segmentation and B is the reference segmentation; the distance metrics compare their boundaries. The source defines ASD as the one-way mean distance from A to B.
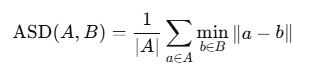
Average surface distance. A is the predicted segmentation and B is the reference segmentation; the distance metrics compare their boundaries. The source defines ASD as the one-way mean distance from A to B.