At a glance
During continuous pursuit, a person can gradually reweight actions toward competing goals. This study models that behavior as a blend of goal-specific controllers and records neurons in 19 people undergoing epilepsy monitoring, alongside behavioral data from 50 healthy participants. Activity in ACC, hippocampus, and OFC shows different relationships to blend weights, switching, and reward structure. The proposed division of labor is a computational interpretation of correlational recordings.
Continuous choice and competing goals
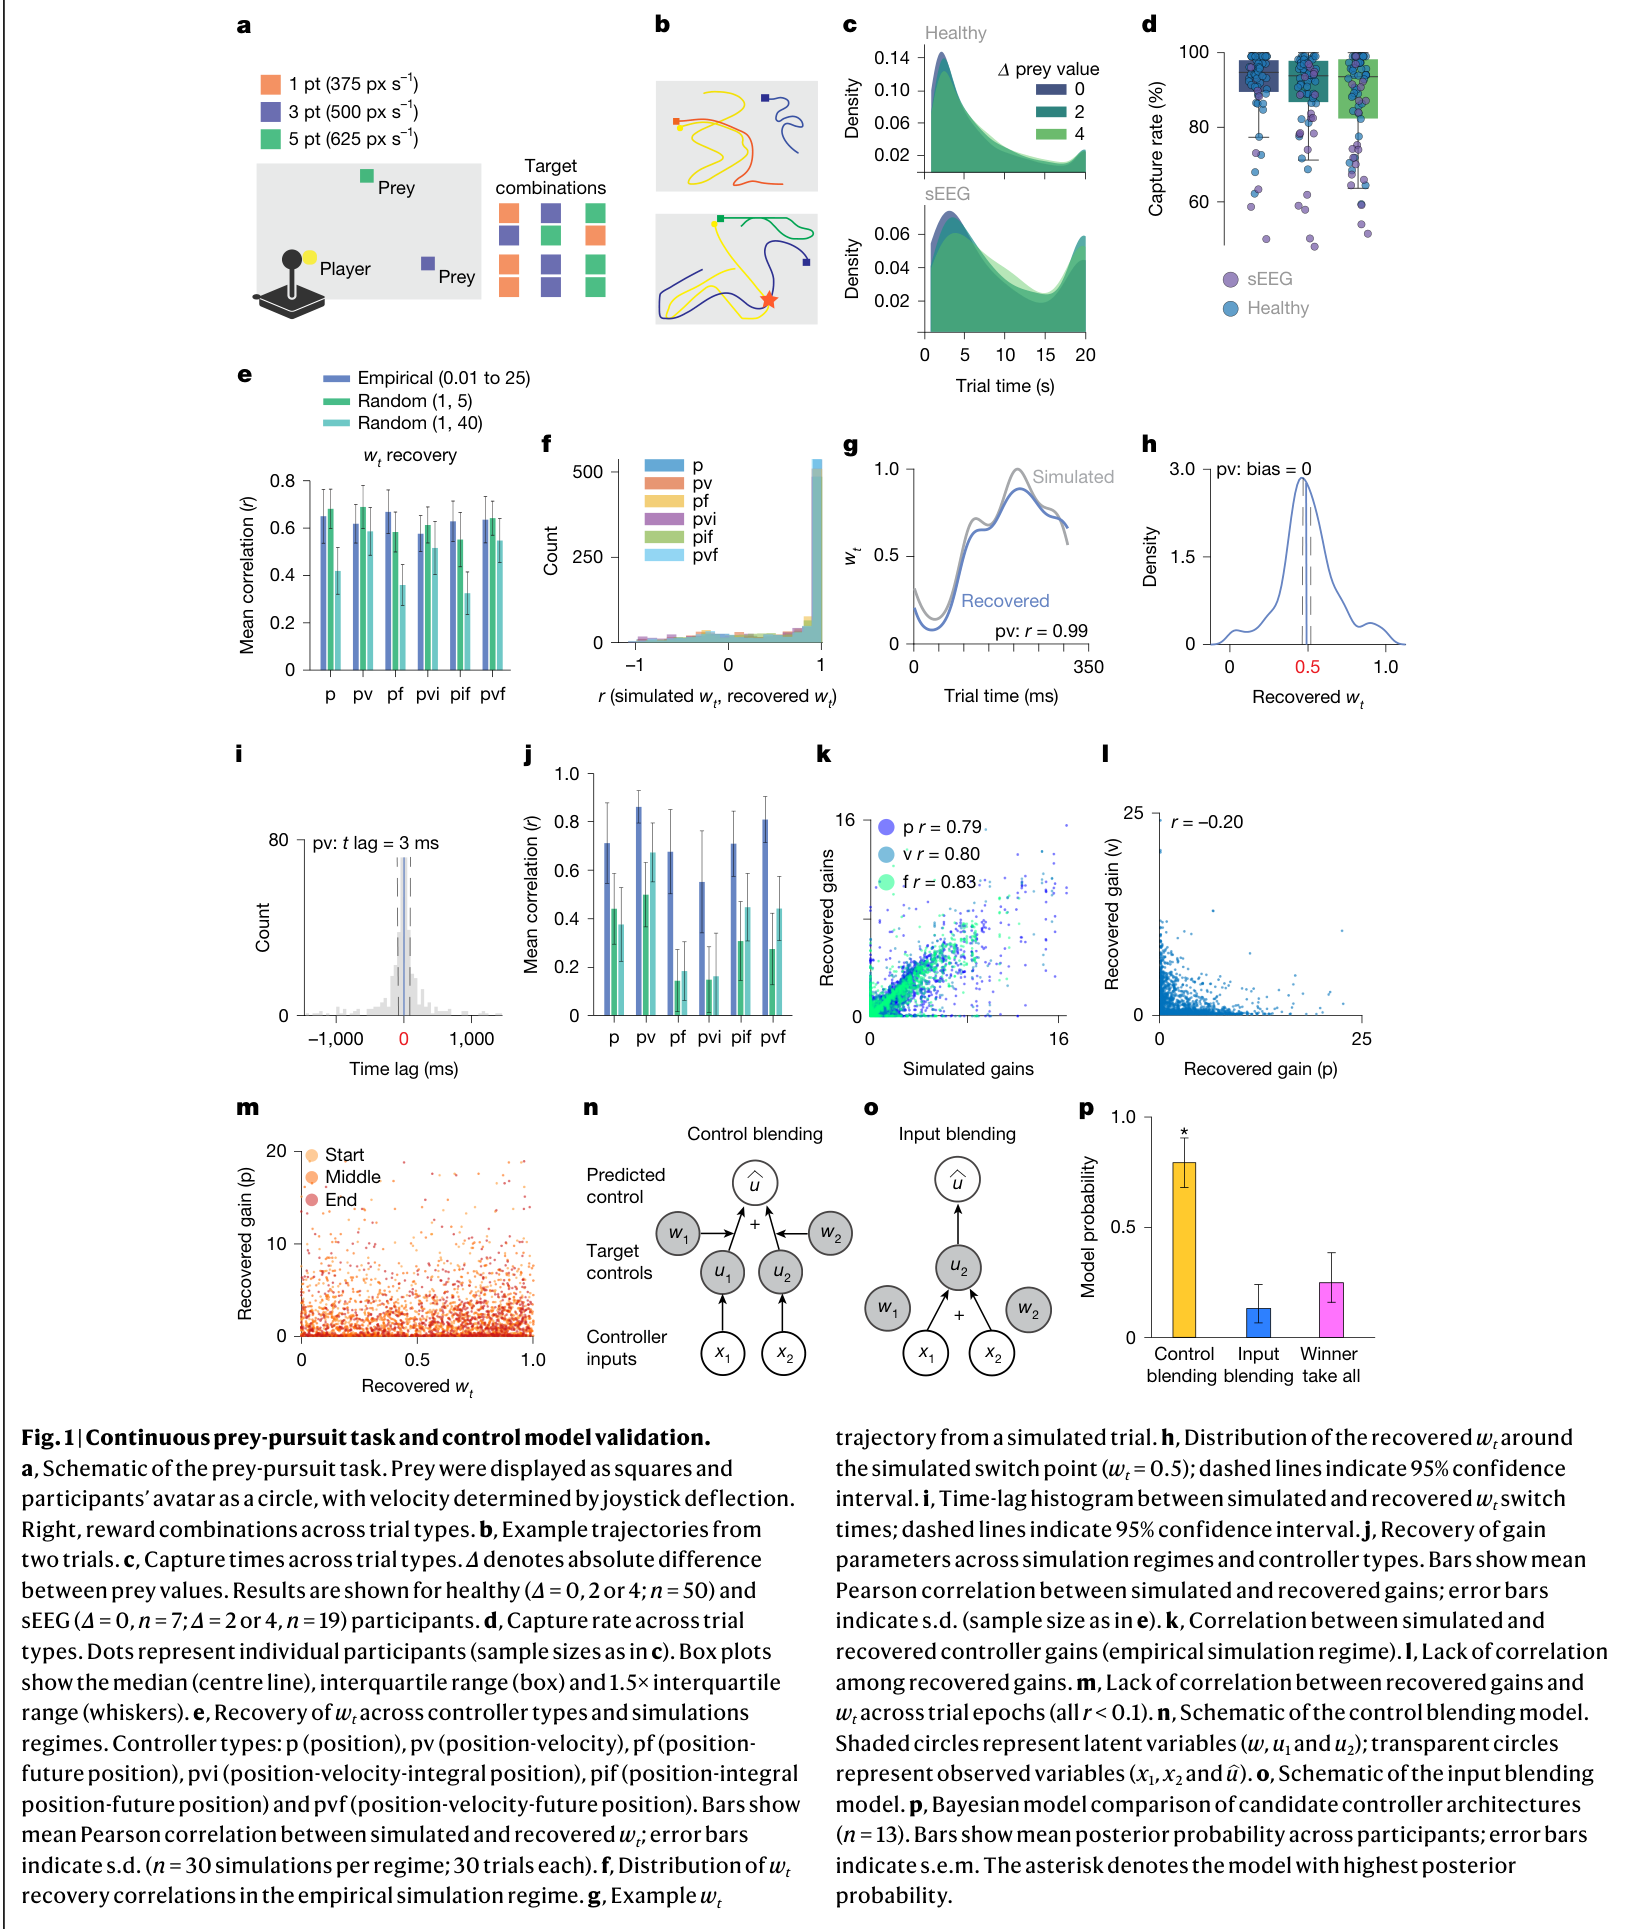
Participants steer a cursor to catch one of two moving prey. Prey differ in point value and speed; trials end at capture or after 20 seconds. Choosing a target is inferred from continuously evolving control rather than from a button press.
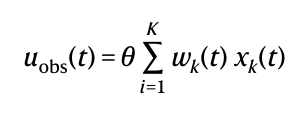
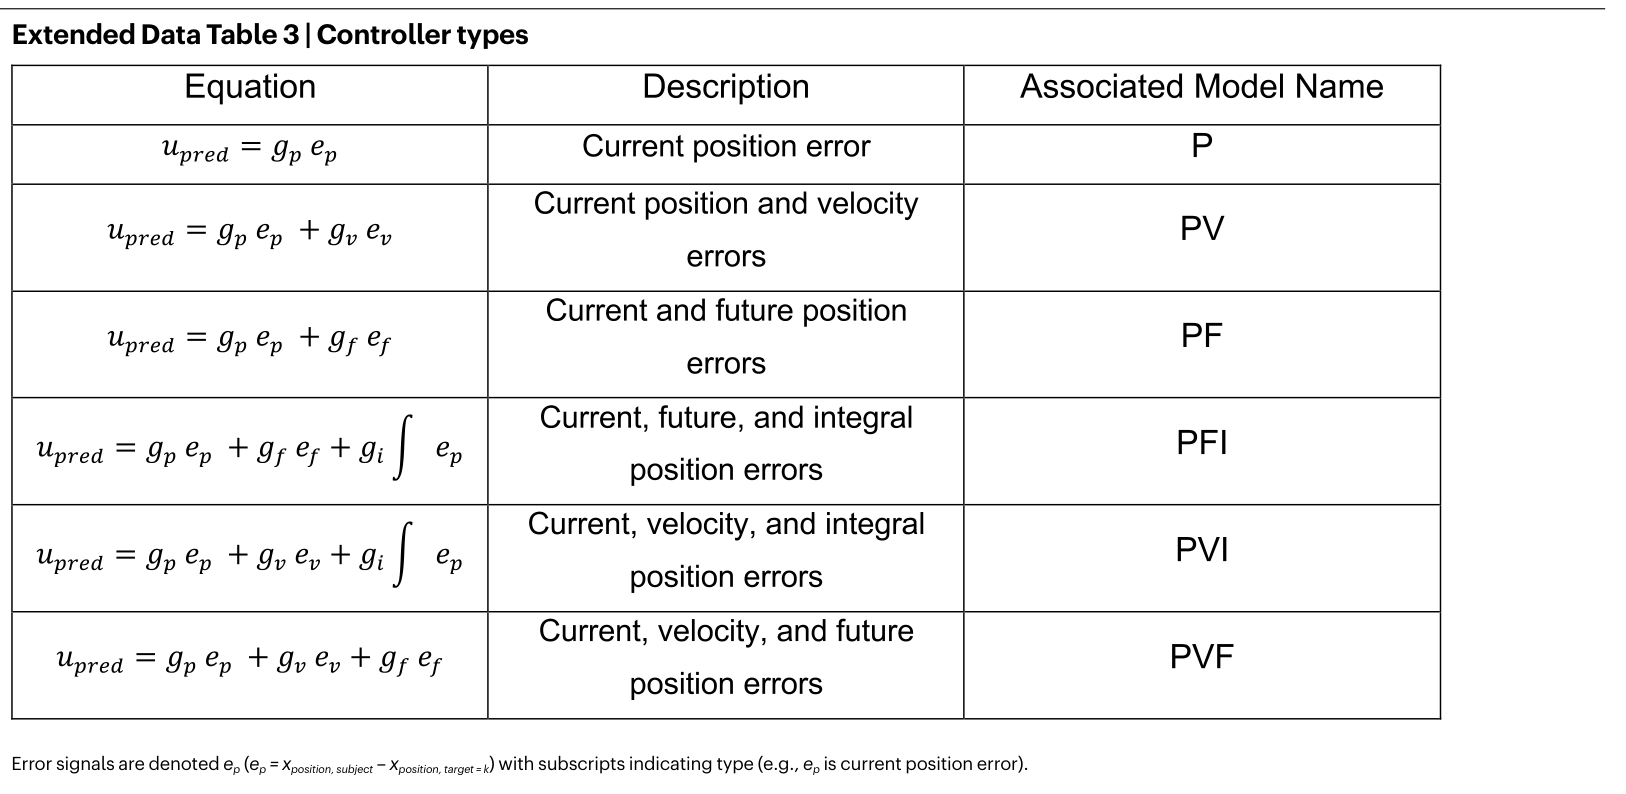
A meta-controller is modeled as changing the relative weights of two lower-level pursuit controllers. Each controller maps estimated position, velocity, or other state errors to an action. The central question is how this composition relates to neural activity across three candidate control and valuation regions.
Related references: [7], [14], [15], [16], [17].
Inferring and validating controller blends
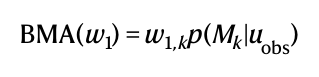
The model simultaneously estimates each target’s controller gains and a time-varying blending weight between zero and one. Candidate controllers use position, velocity, integrated position, or predicted future position errors. Bayesian model averaging combines uncertainty across controller combinations.
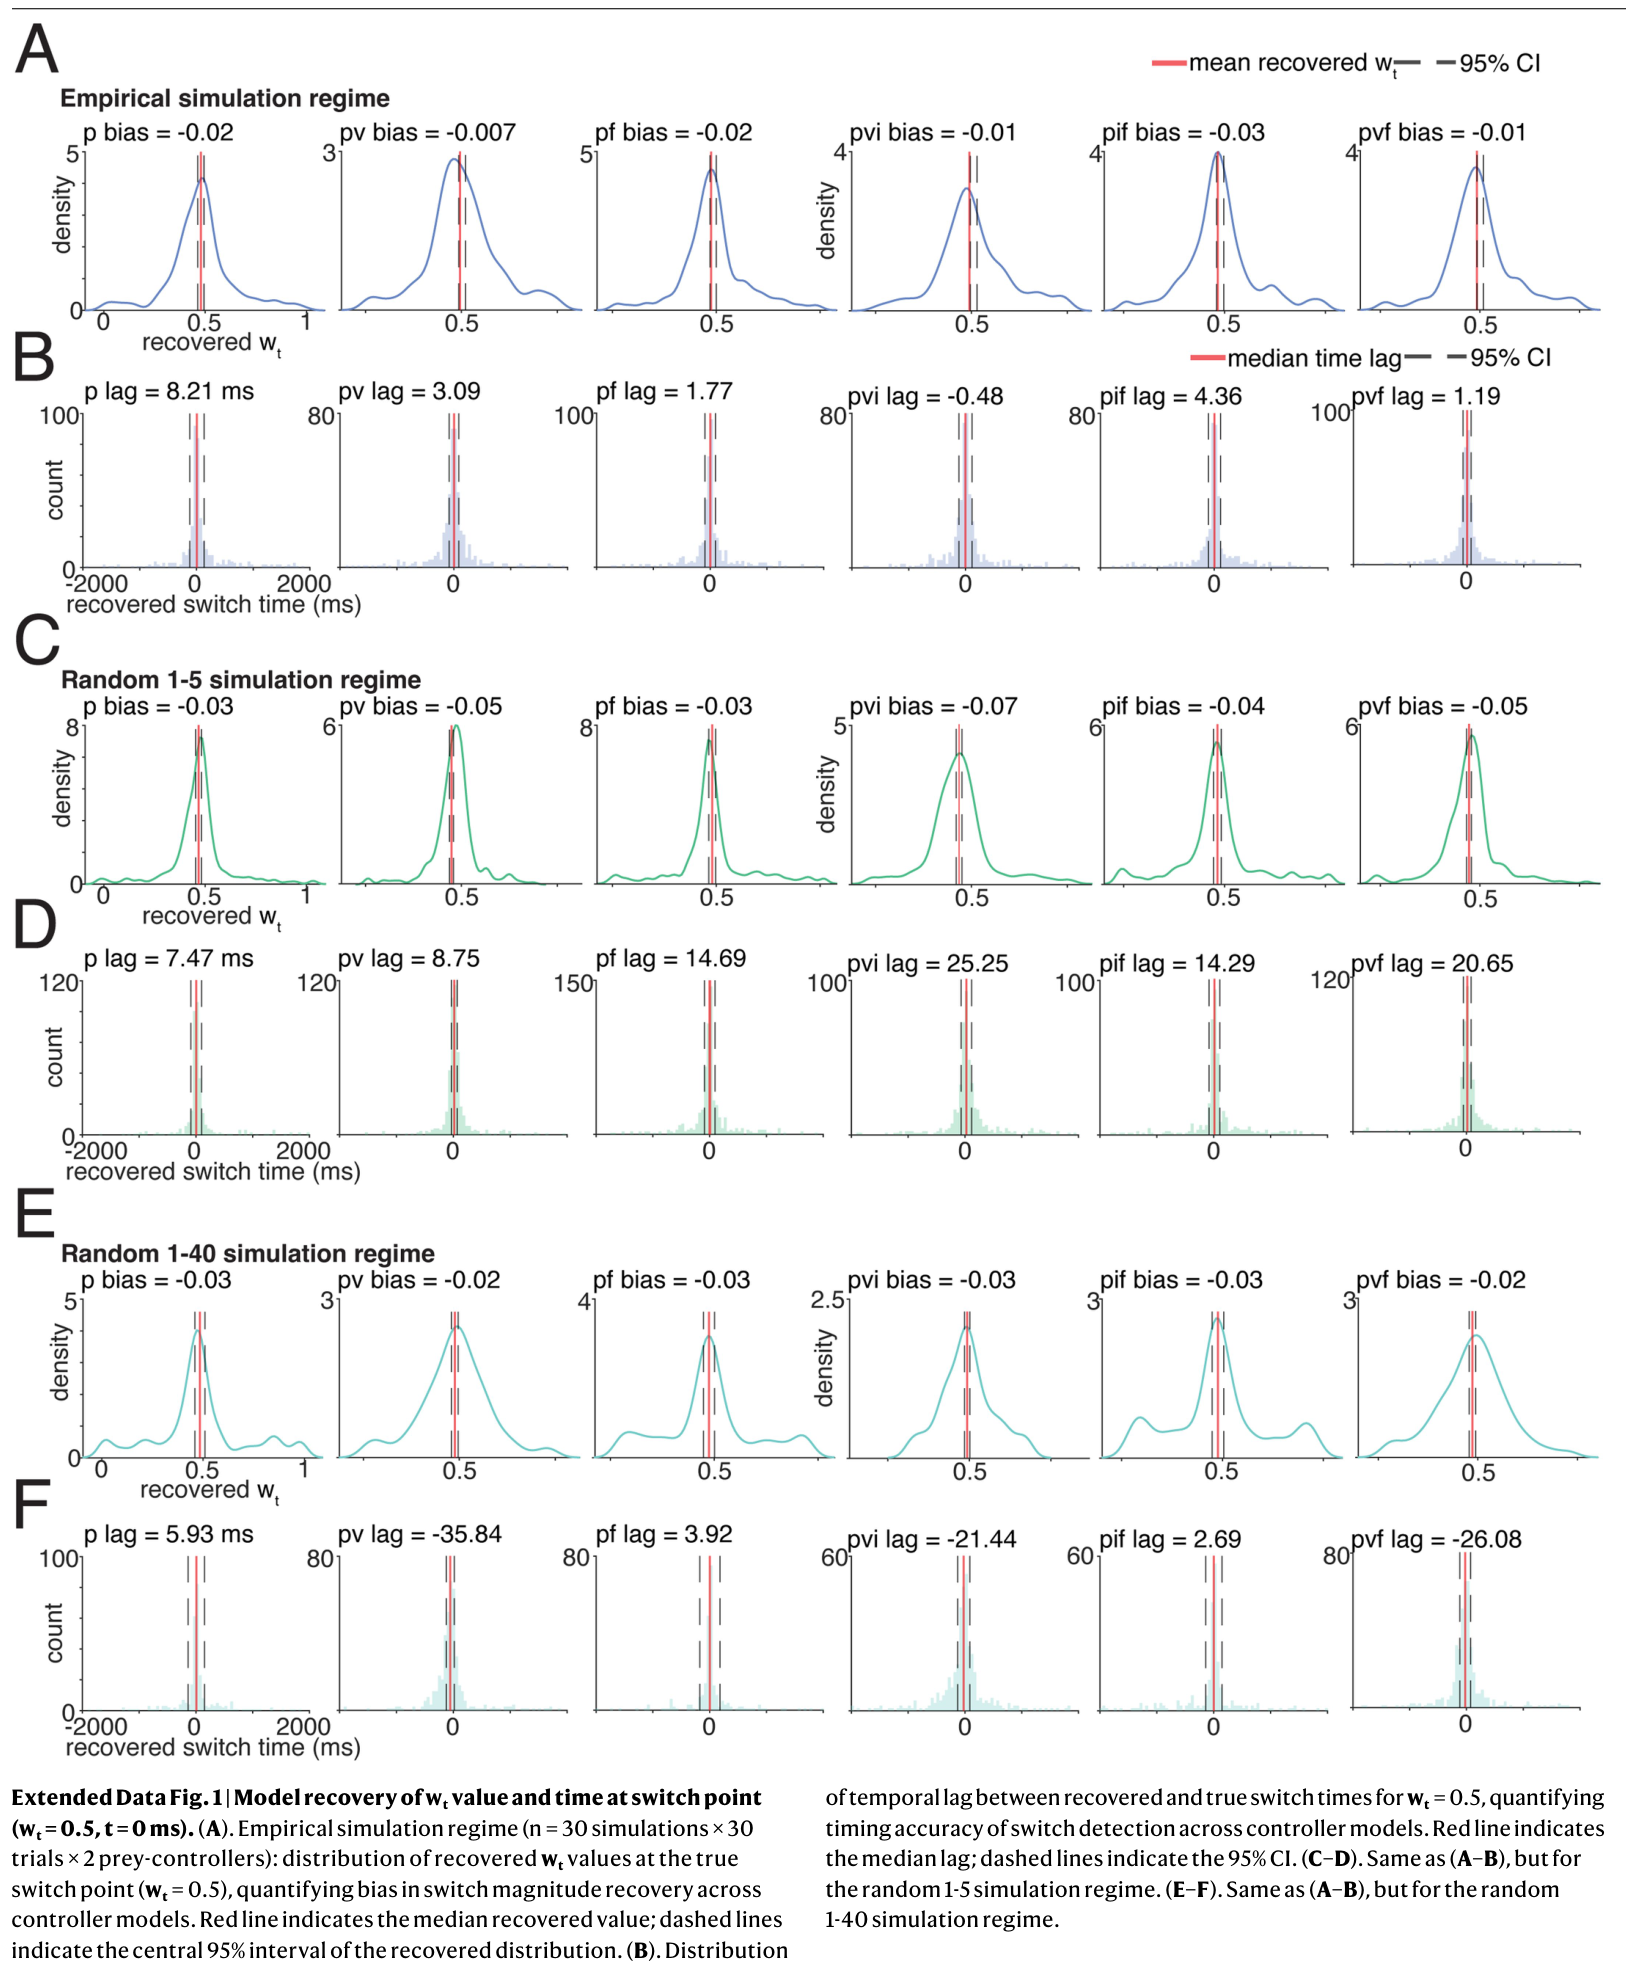
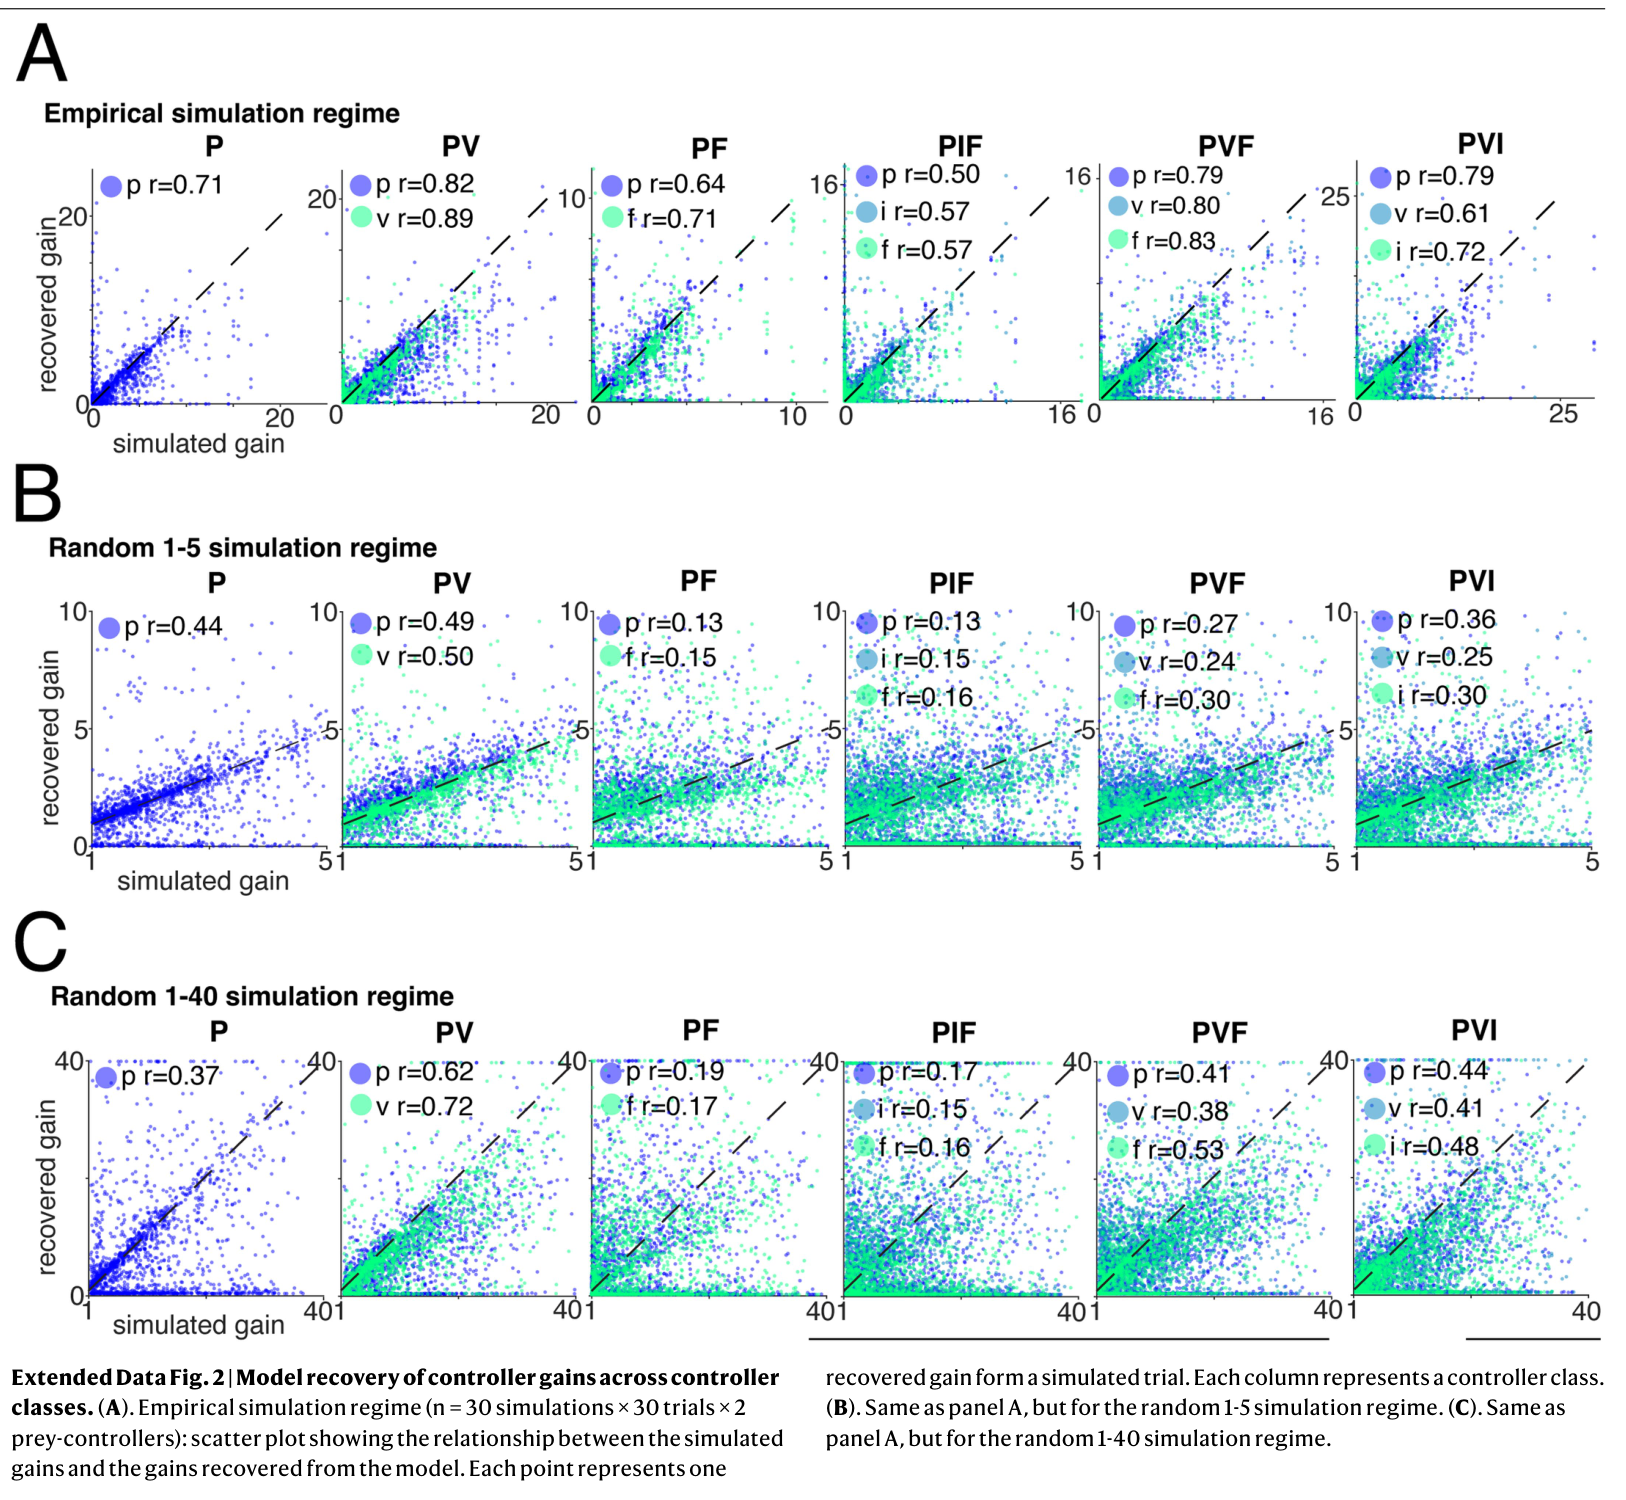
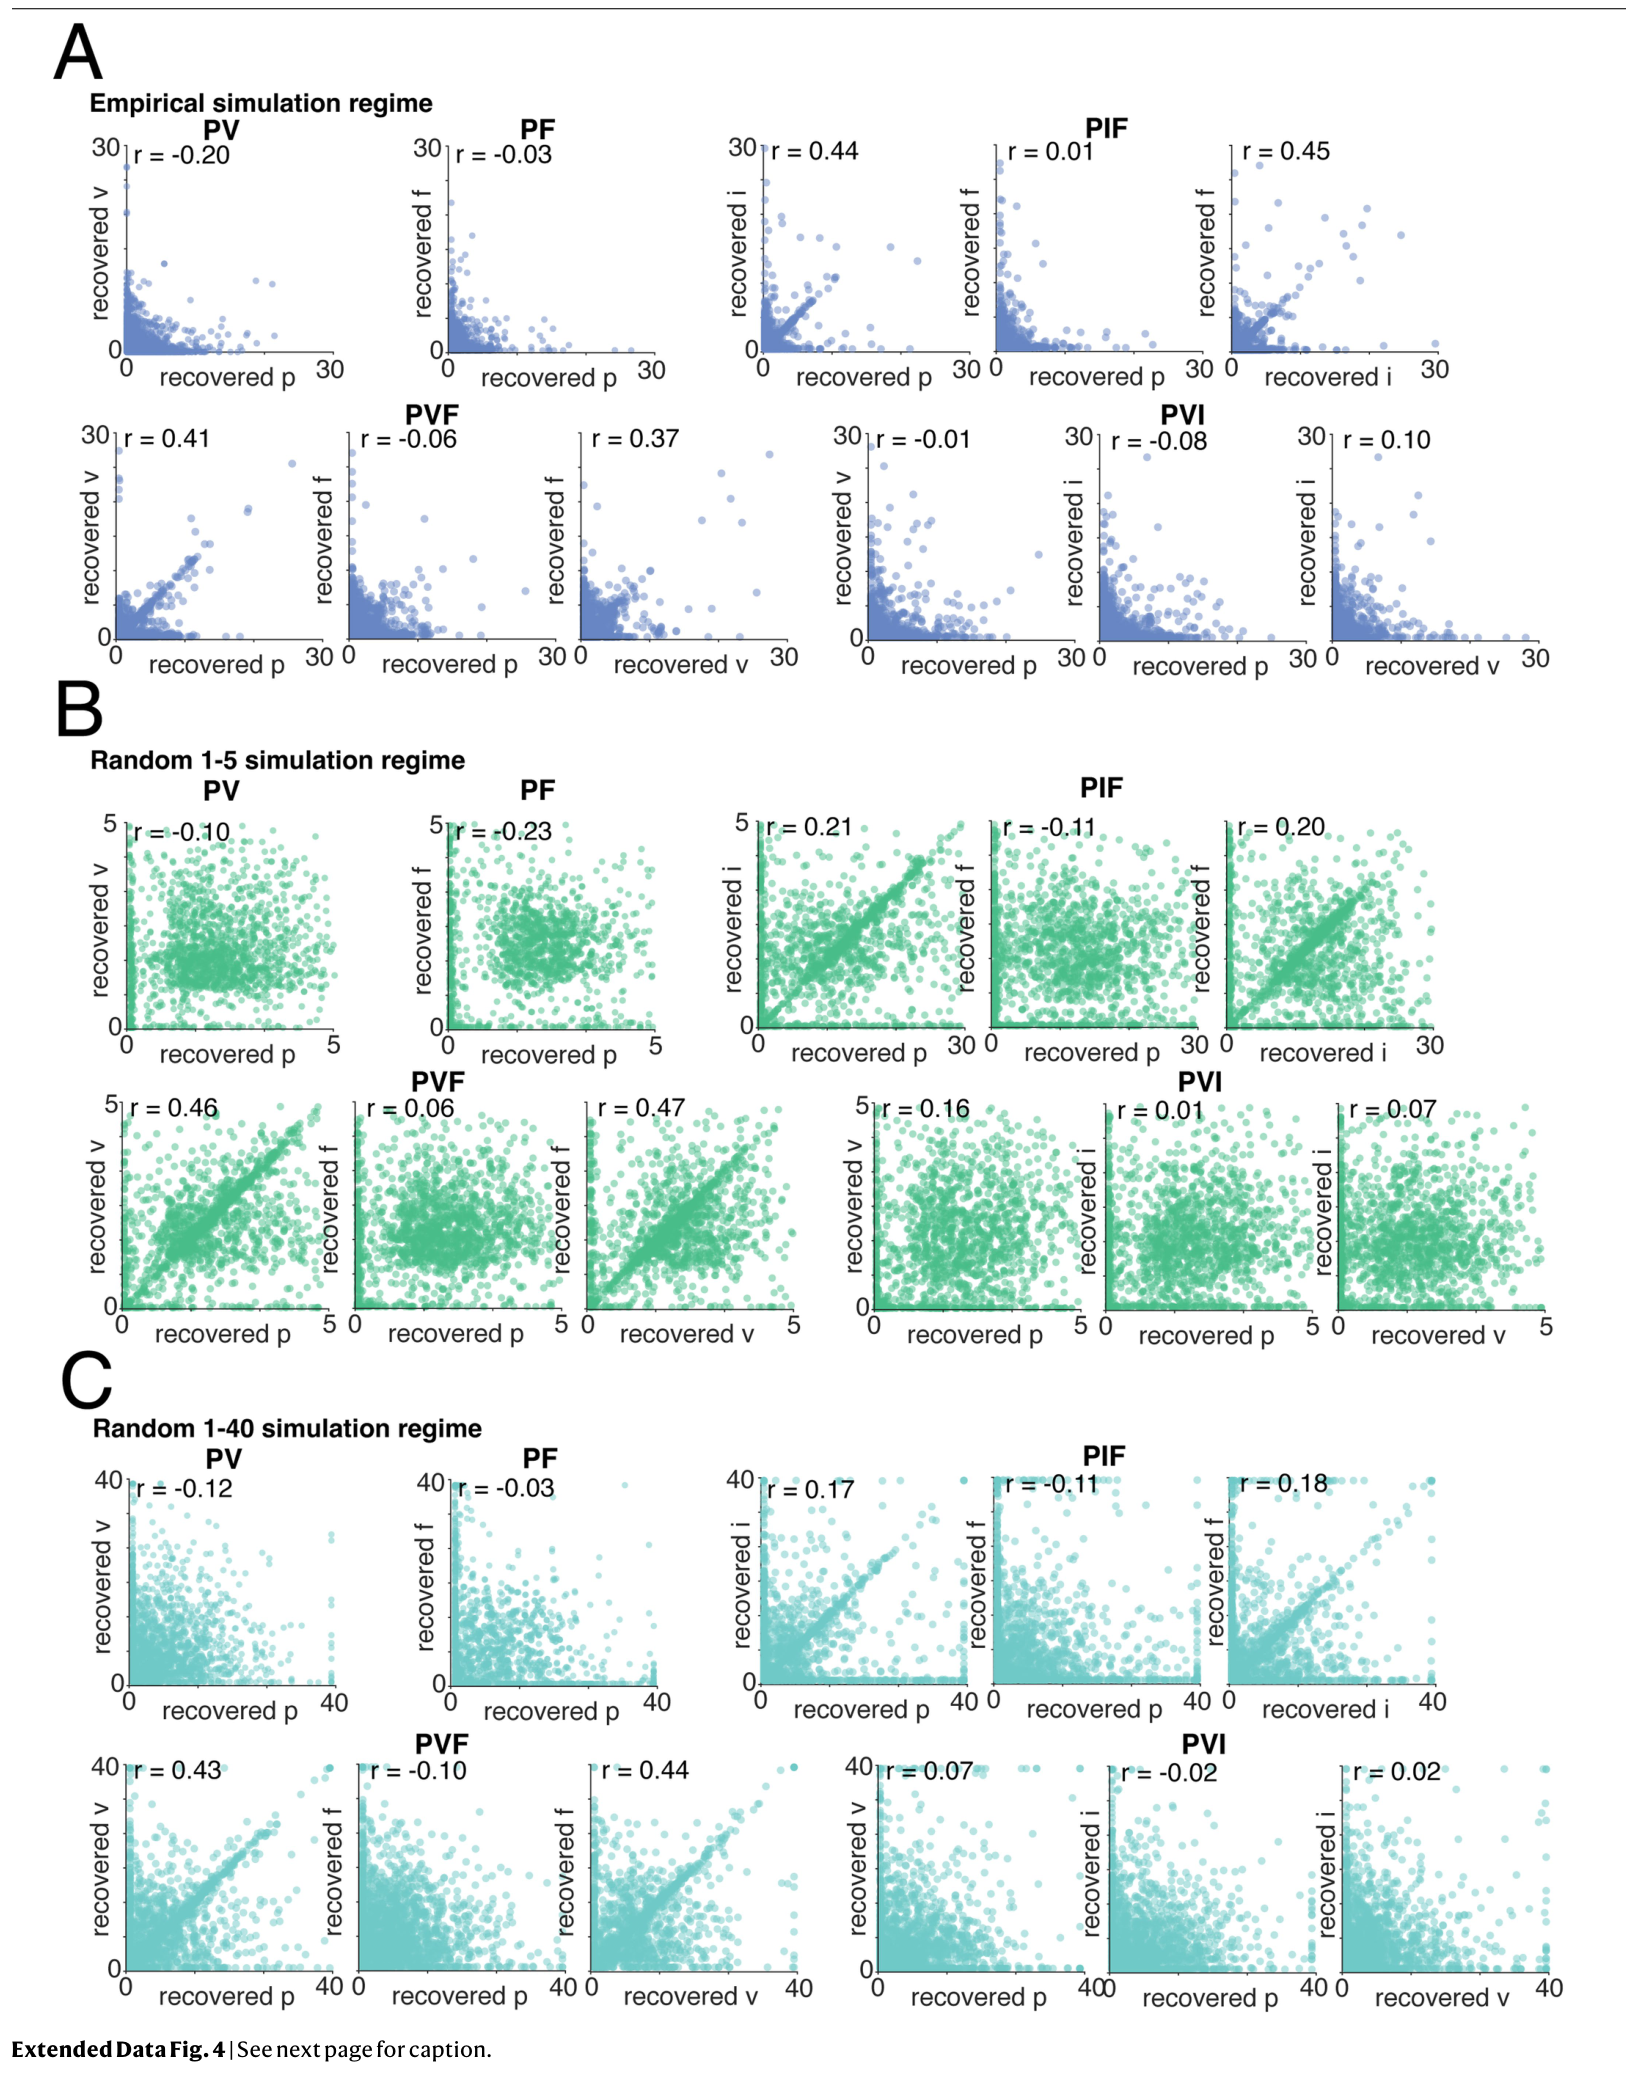
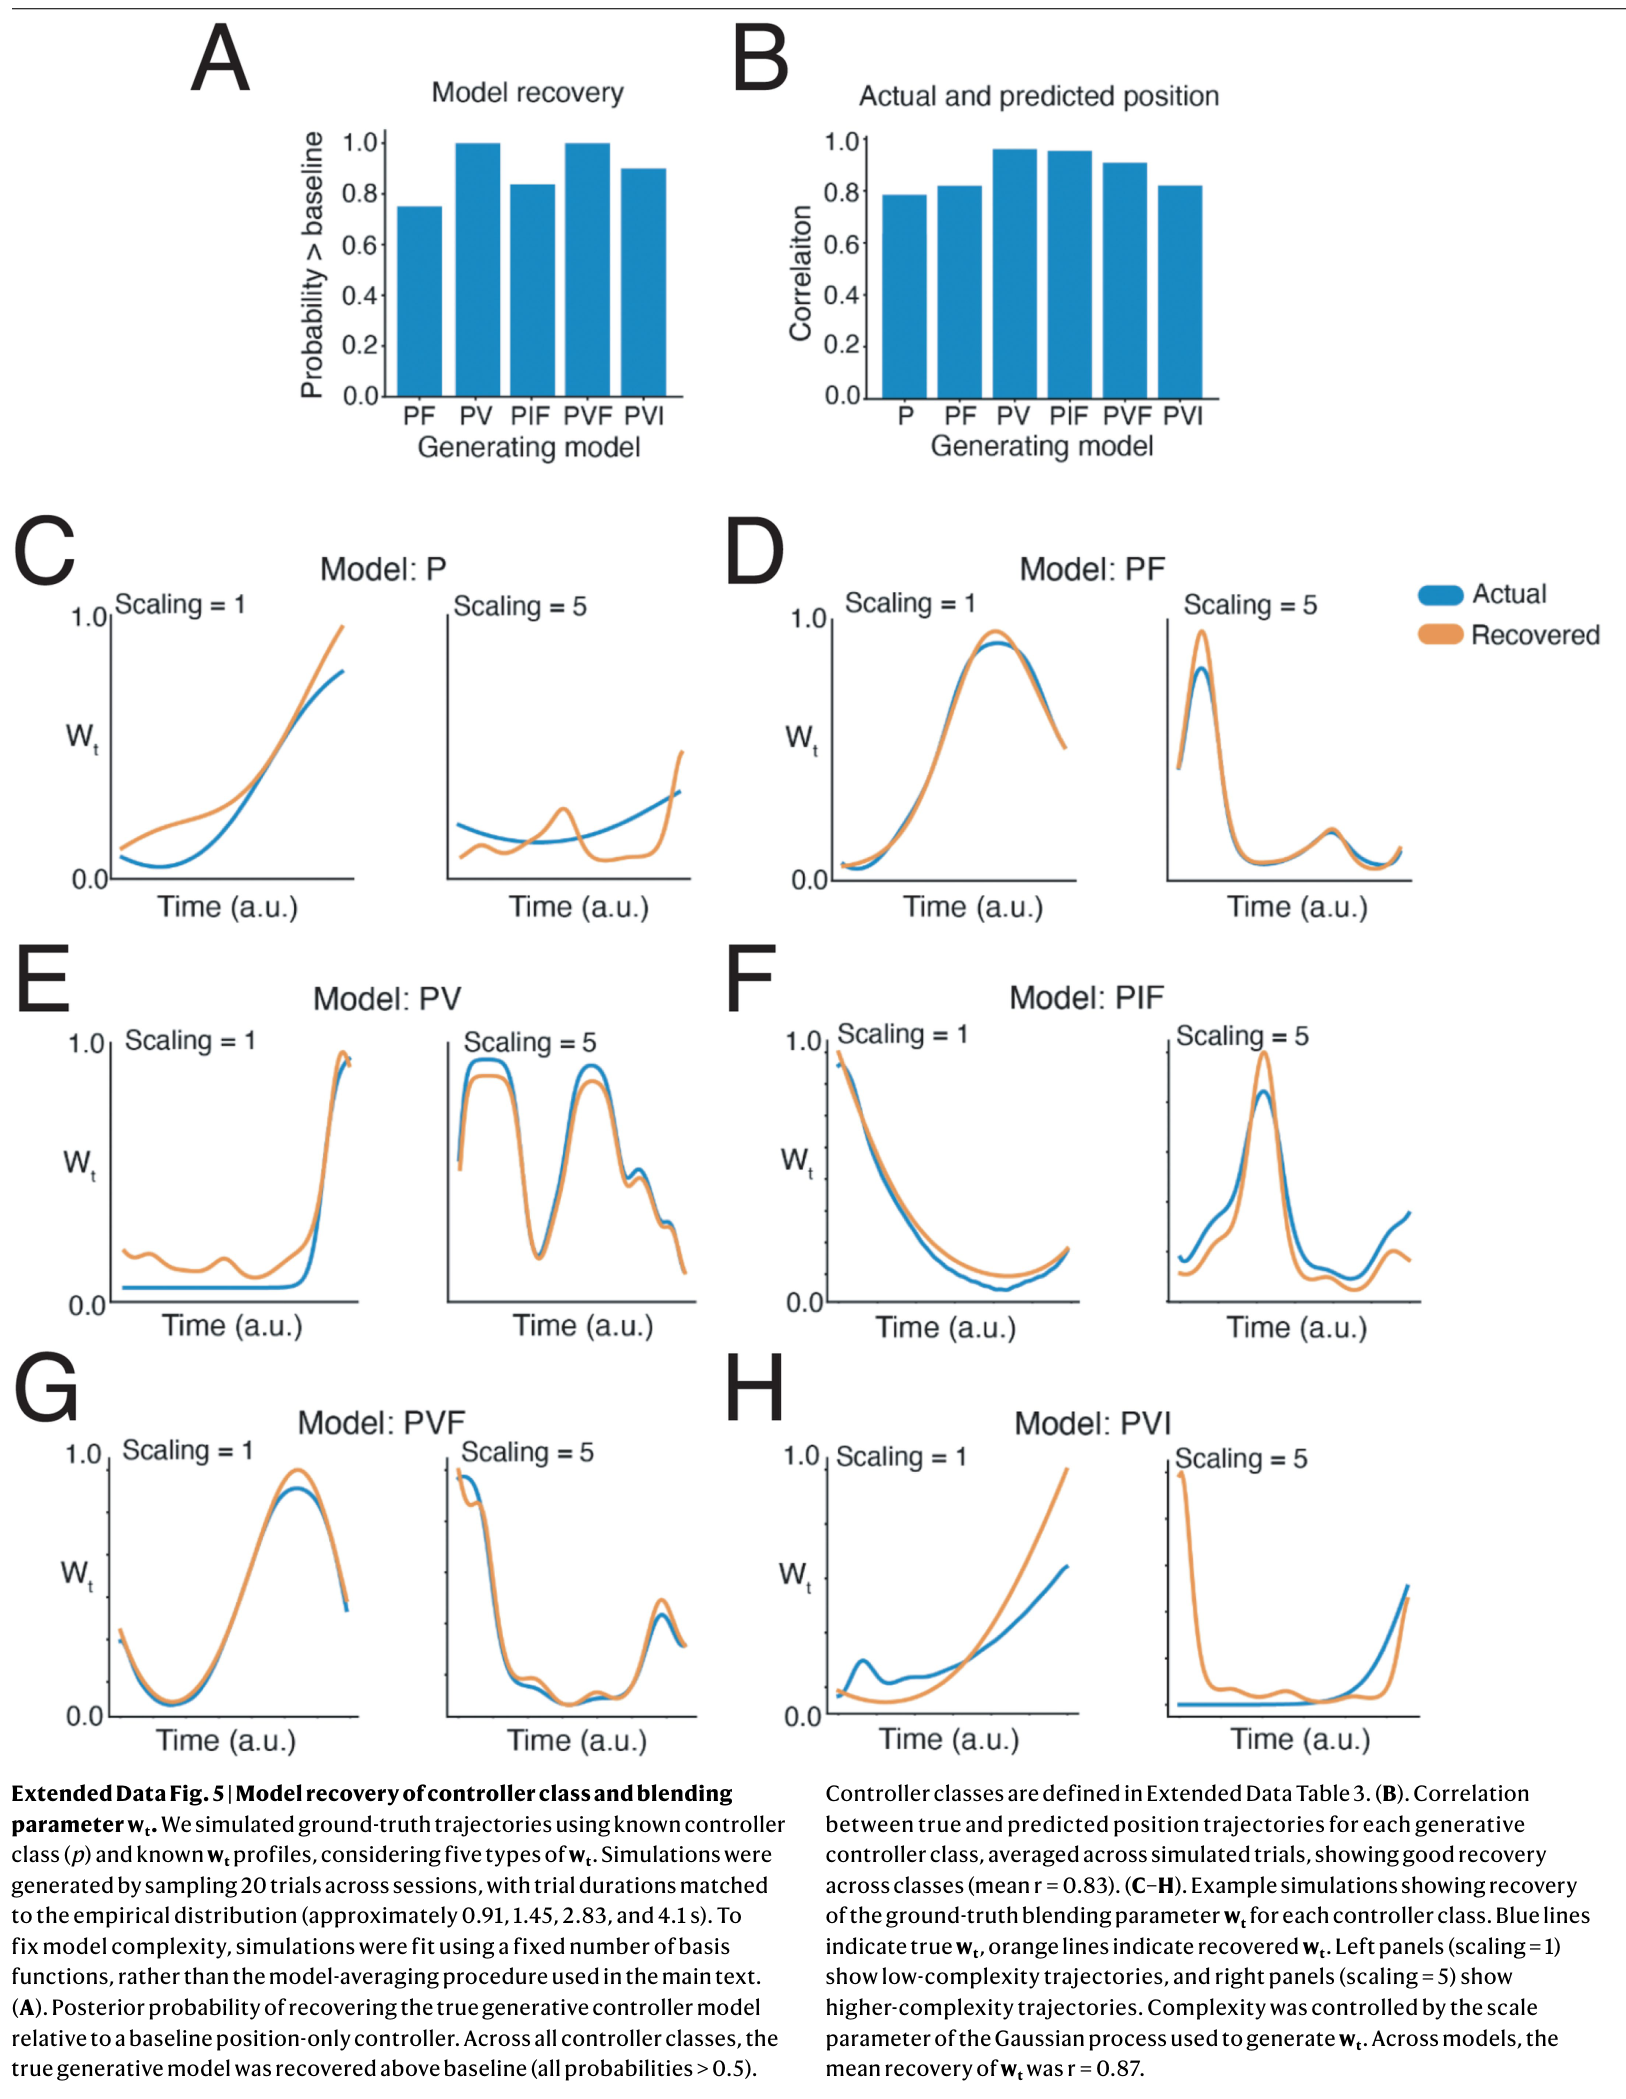
Simulations test recovery of both gains and blend weights. Average weight recovery is moderate across all classes, while the best-fitting position–velocity class gives nearly unbiased switch points. Median switch-time lag is about three milliseconds, but its uncertainty spans roughly 80–100 milliseconds in either direction. This matters when interpreting small neural timing differences.
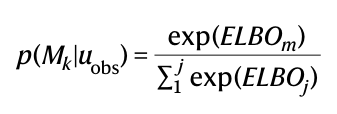
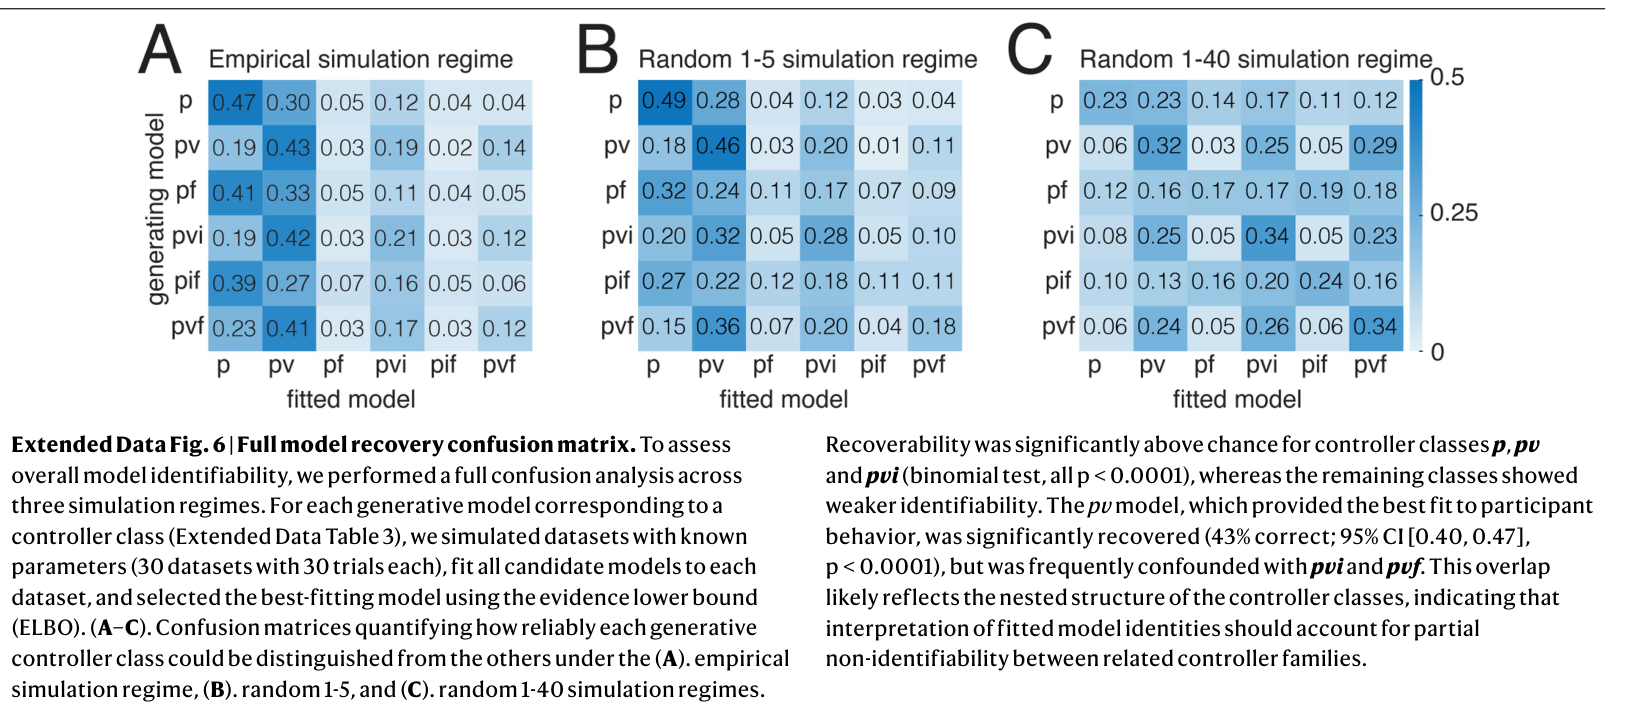
Blended controllers outperform the tested all-or-none and input-blending alternatives, with mean posterior model probability 84% ± 8%. Controller classes overlap: position–velocity models also fit data from more complex generators, so model preference is relative evidence rather than identification of the unique true algorithm.
Related references: [17], [42].
Behavioural signatures of switching
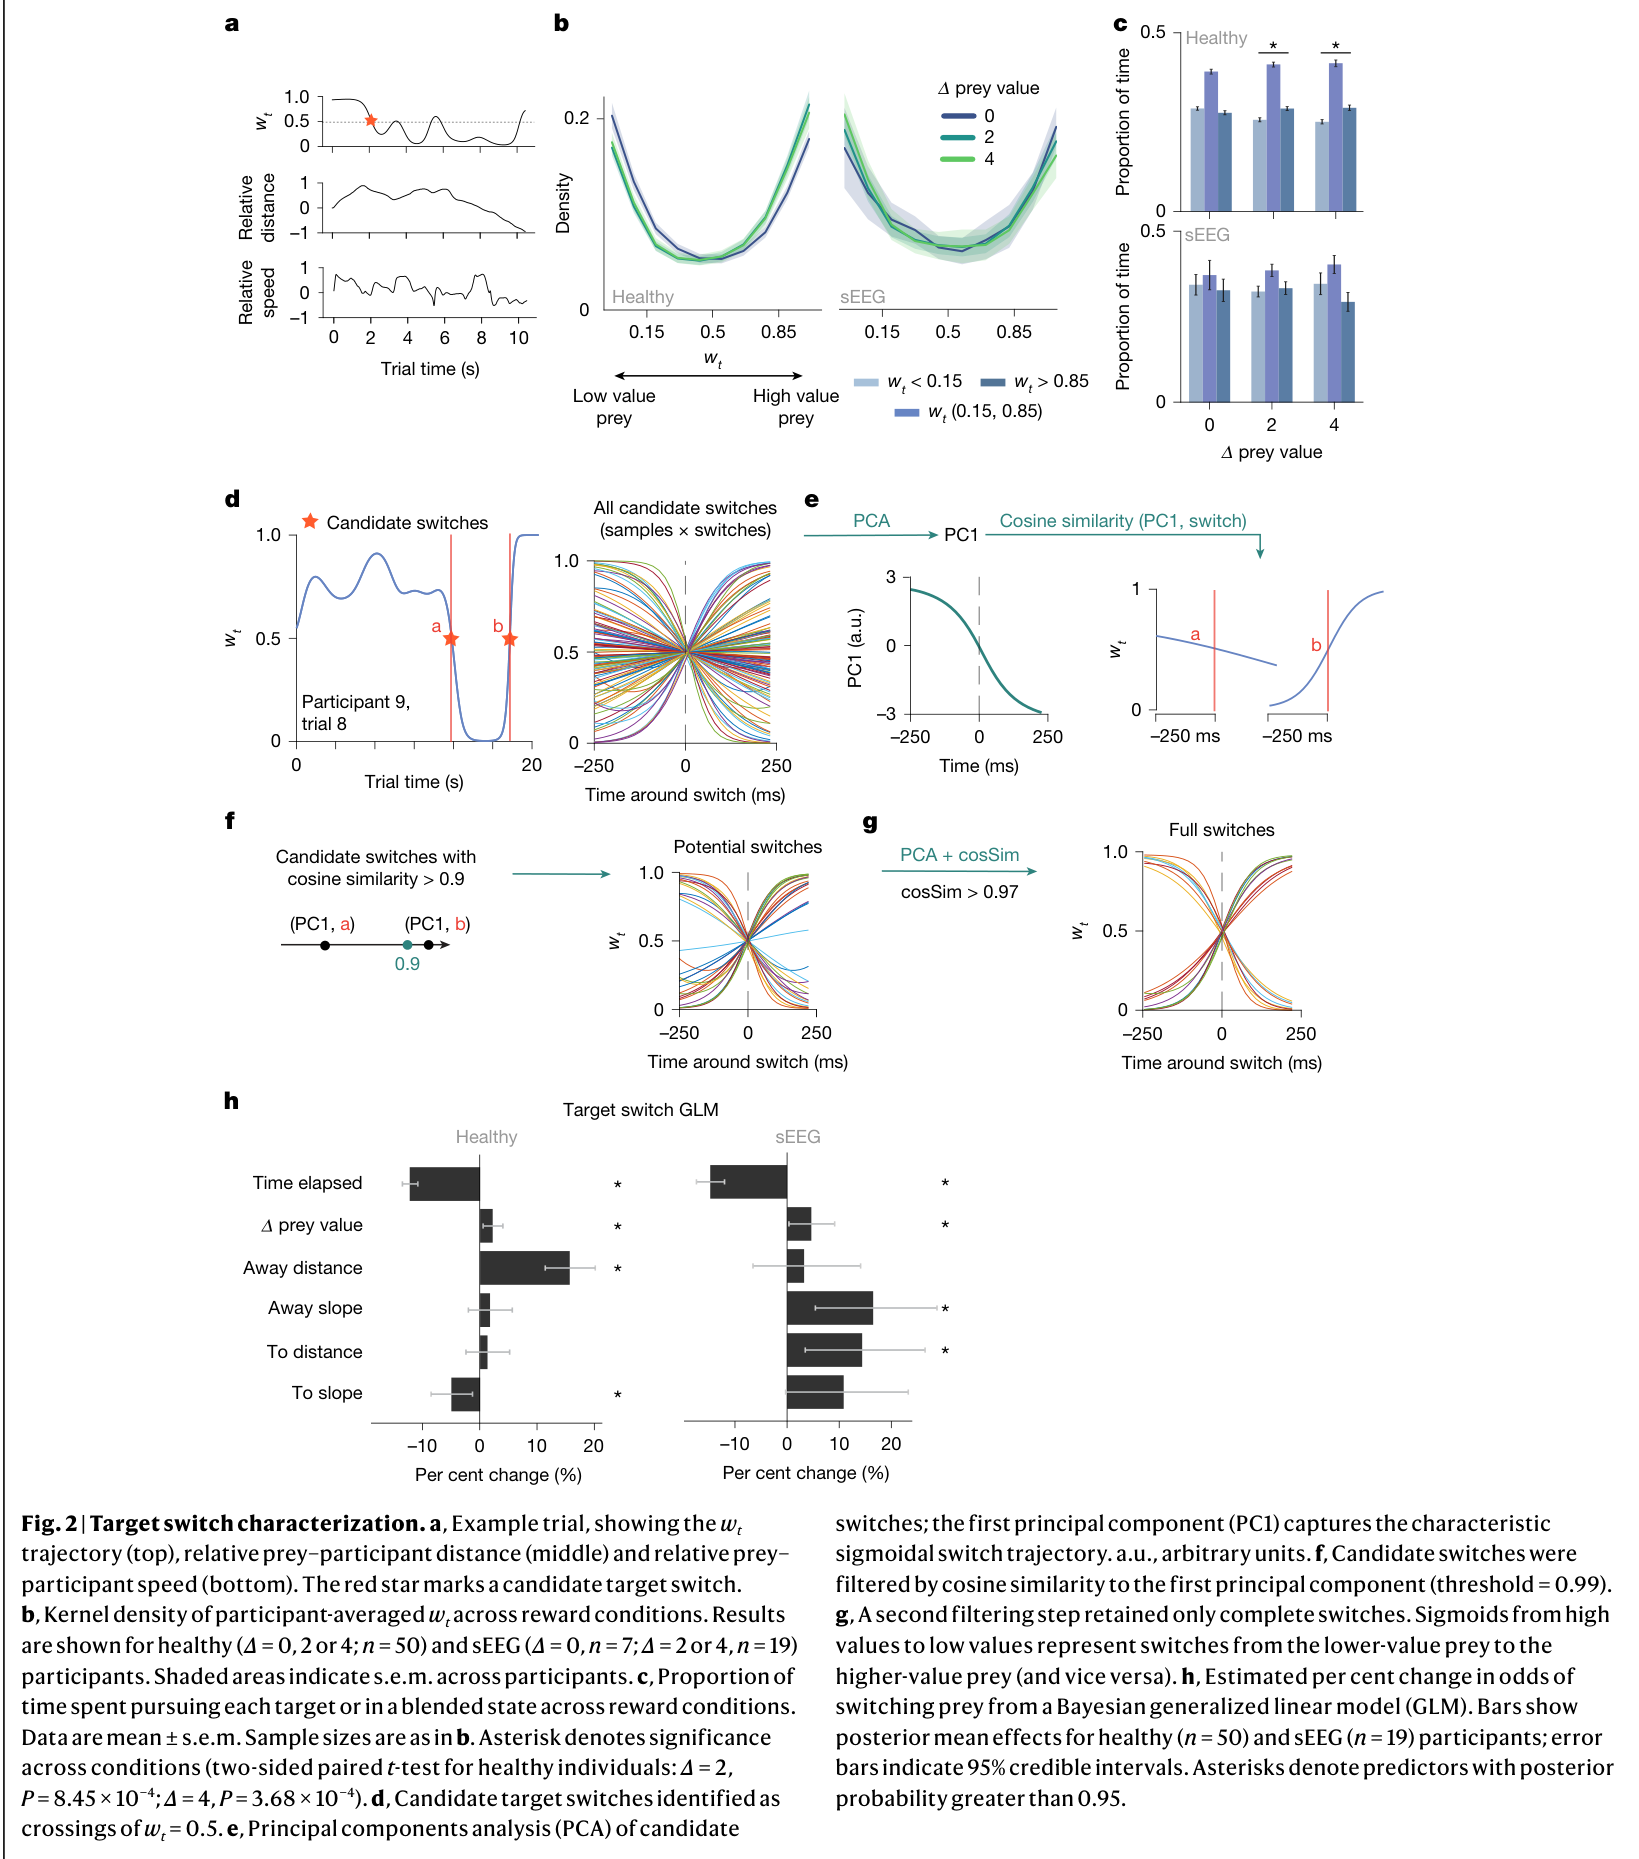
Recovered blend weights occupy intermediate states as well as near-complete commitment to one prey. Prey reward differences influence pursuit and switch probabilities. Full target switches have a characteristic sigmoid-like trajectory; partial reversals also occur.
The analysis identifies candidate crossings of weight 0.5, excludes the first 325 milliseconds of a trial, and retains trajectories matching the canonical switch shape. About 35% of candidate crossings qualify. Findings about switch-aligned neural activity therefore concern this selected class of relatively clear switches.
Related references: [7], [41].
Neural encoding of controller blends
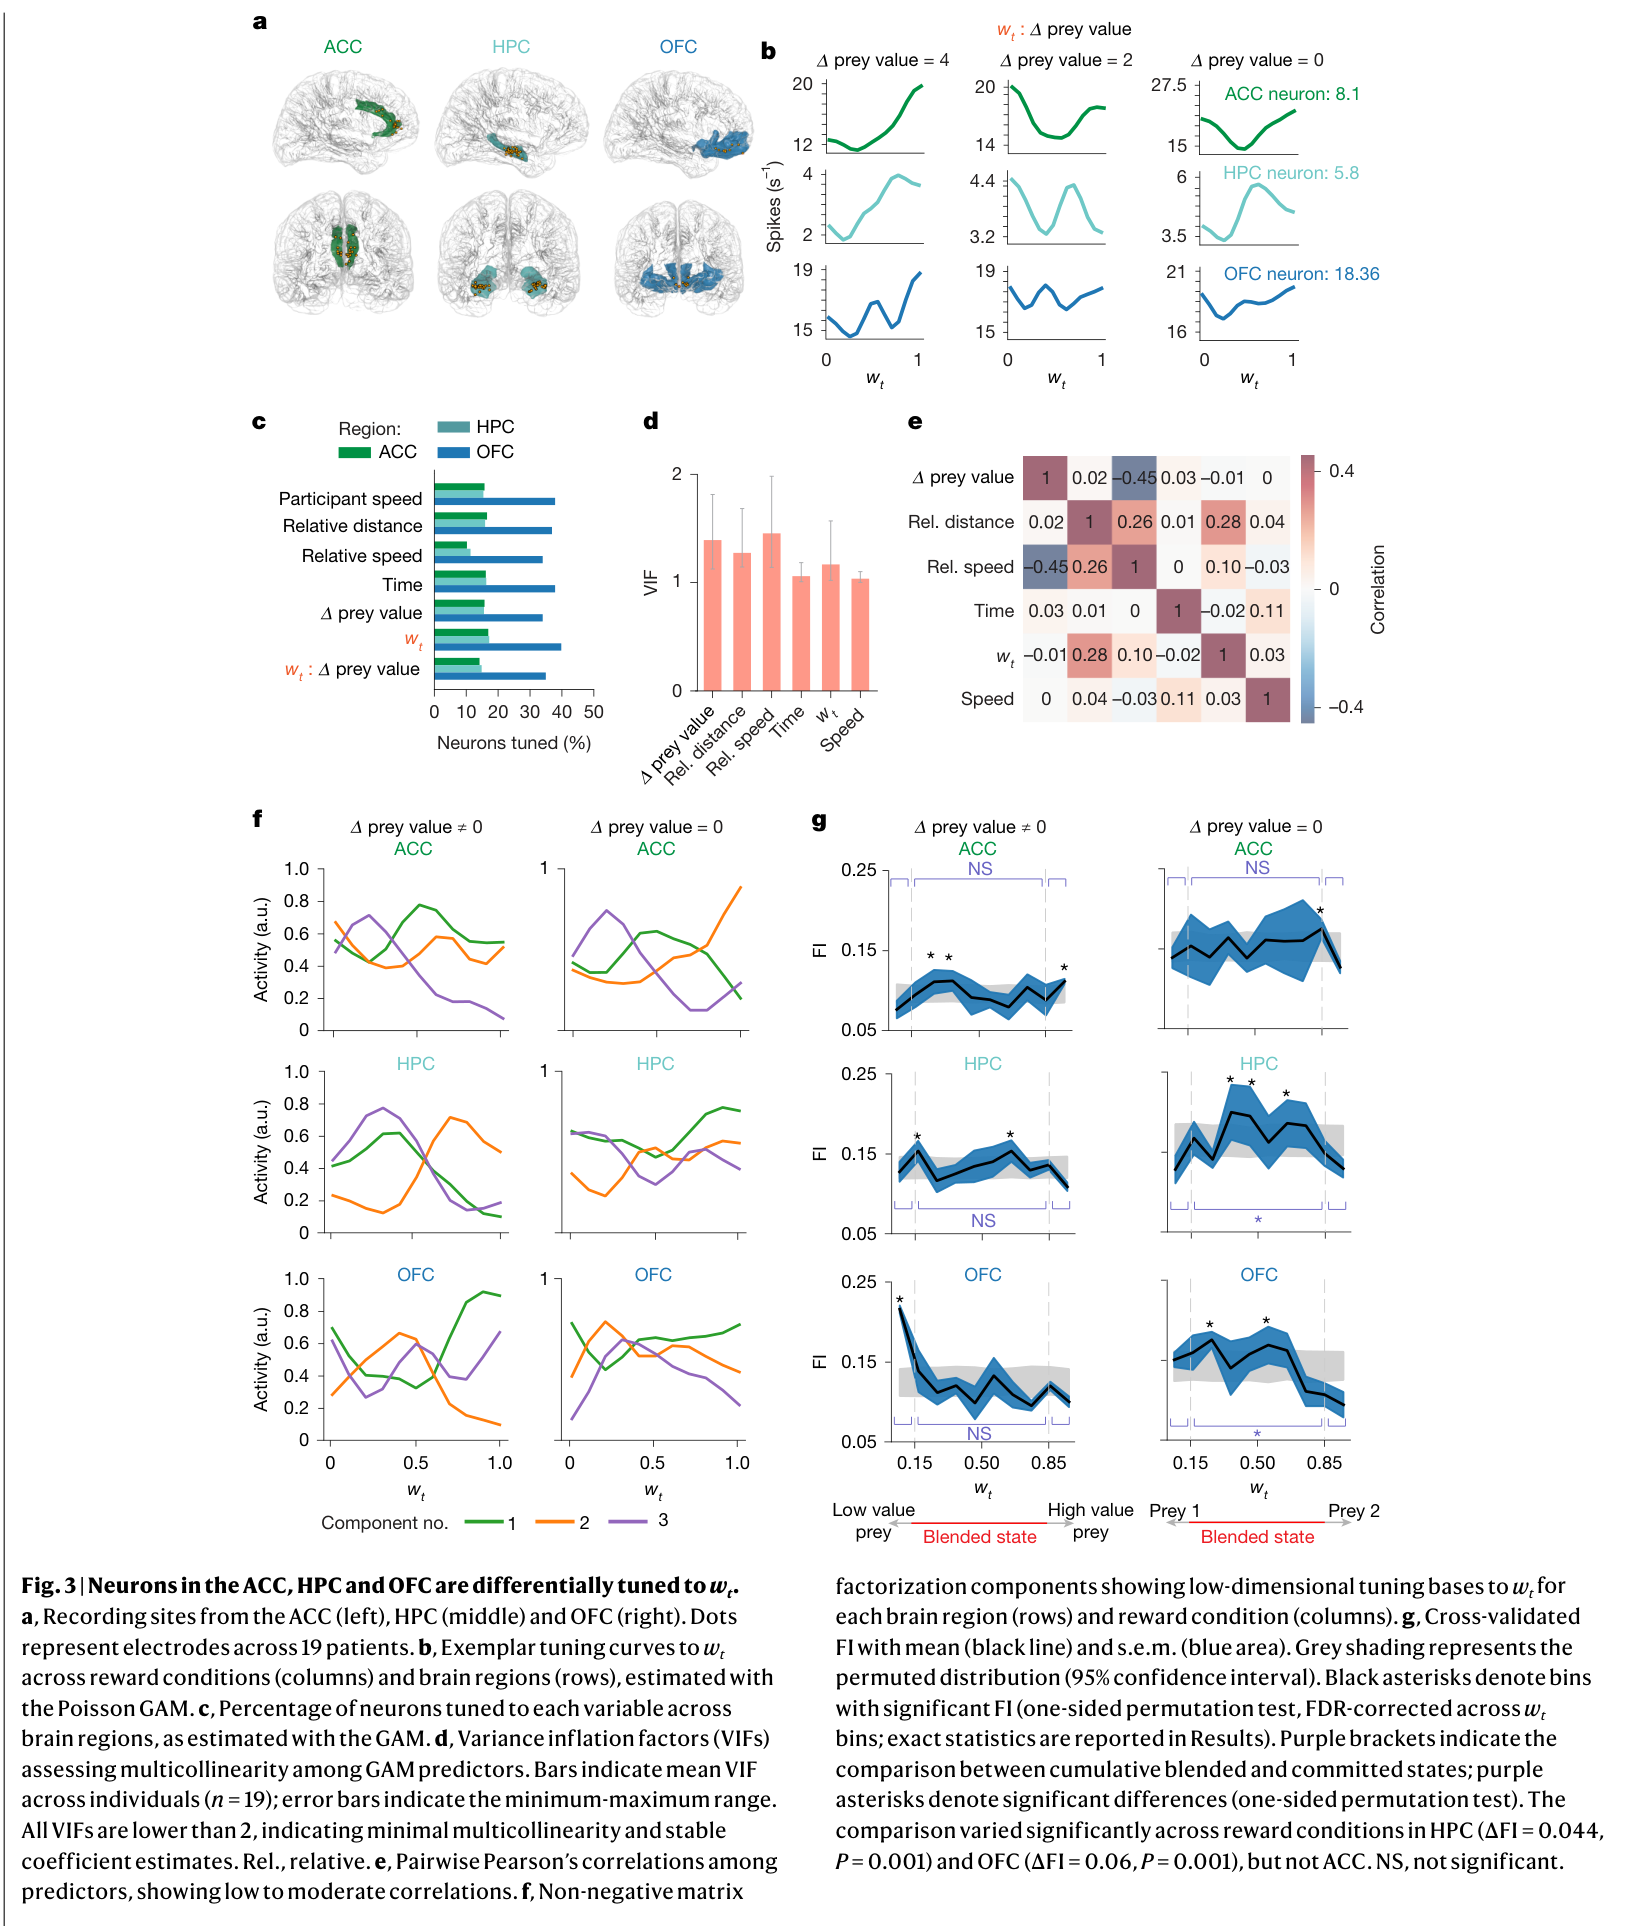
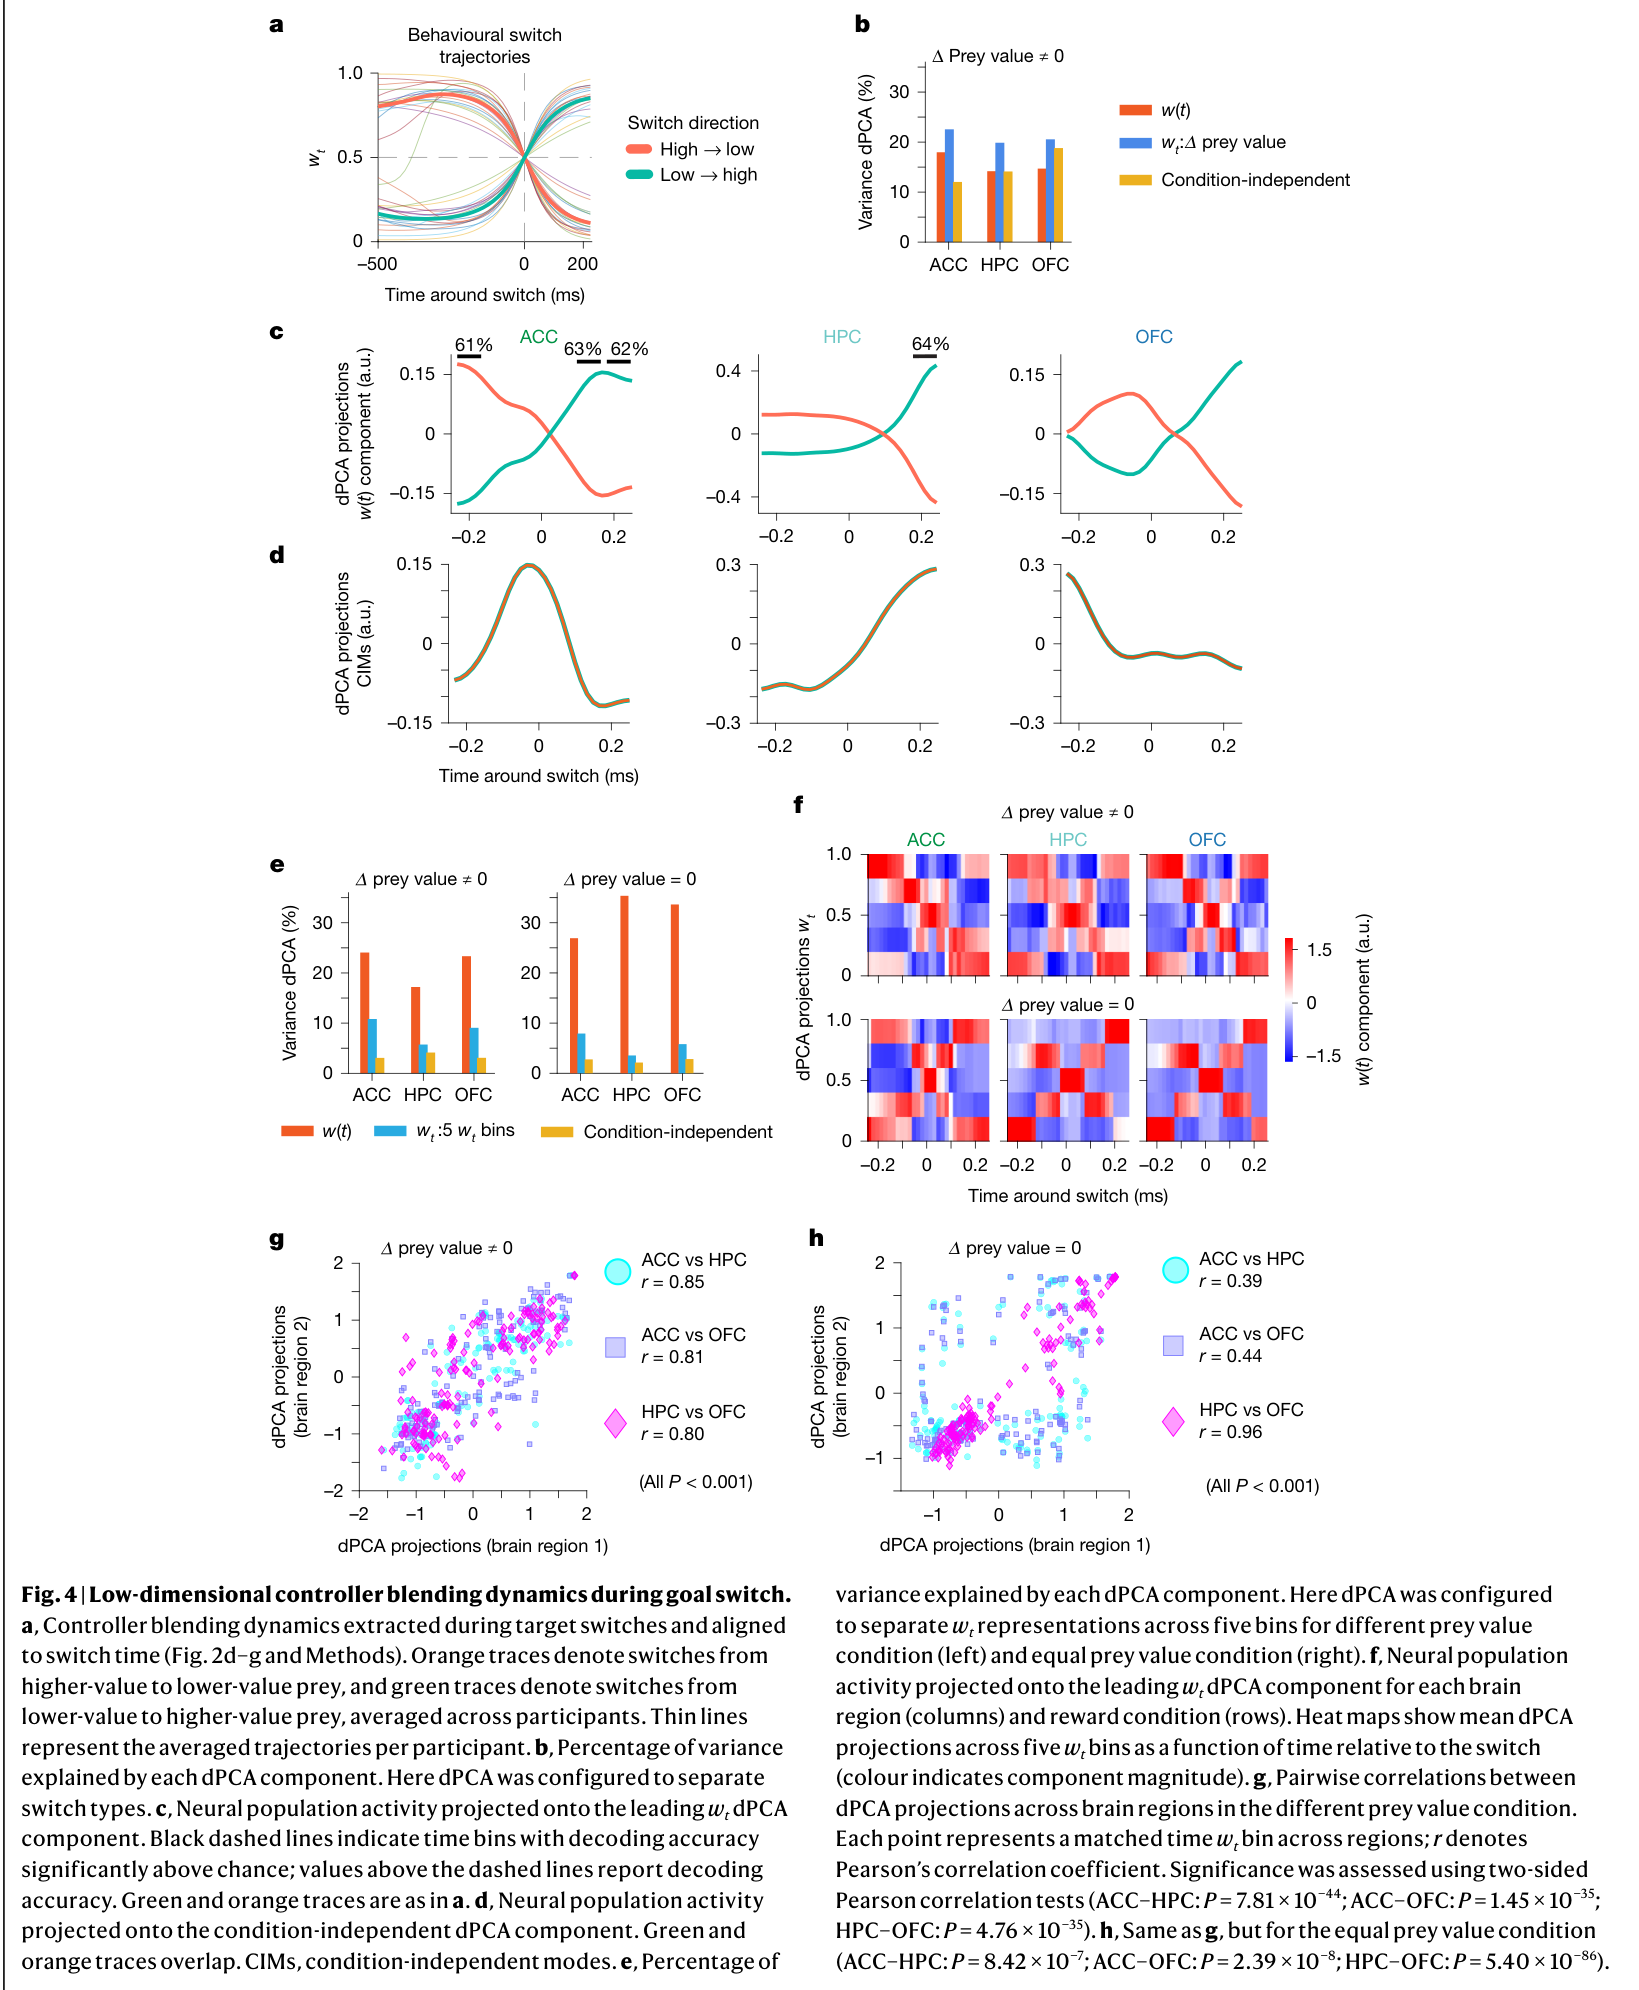
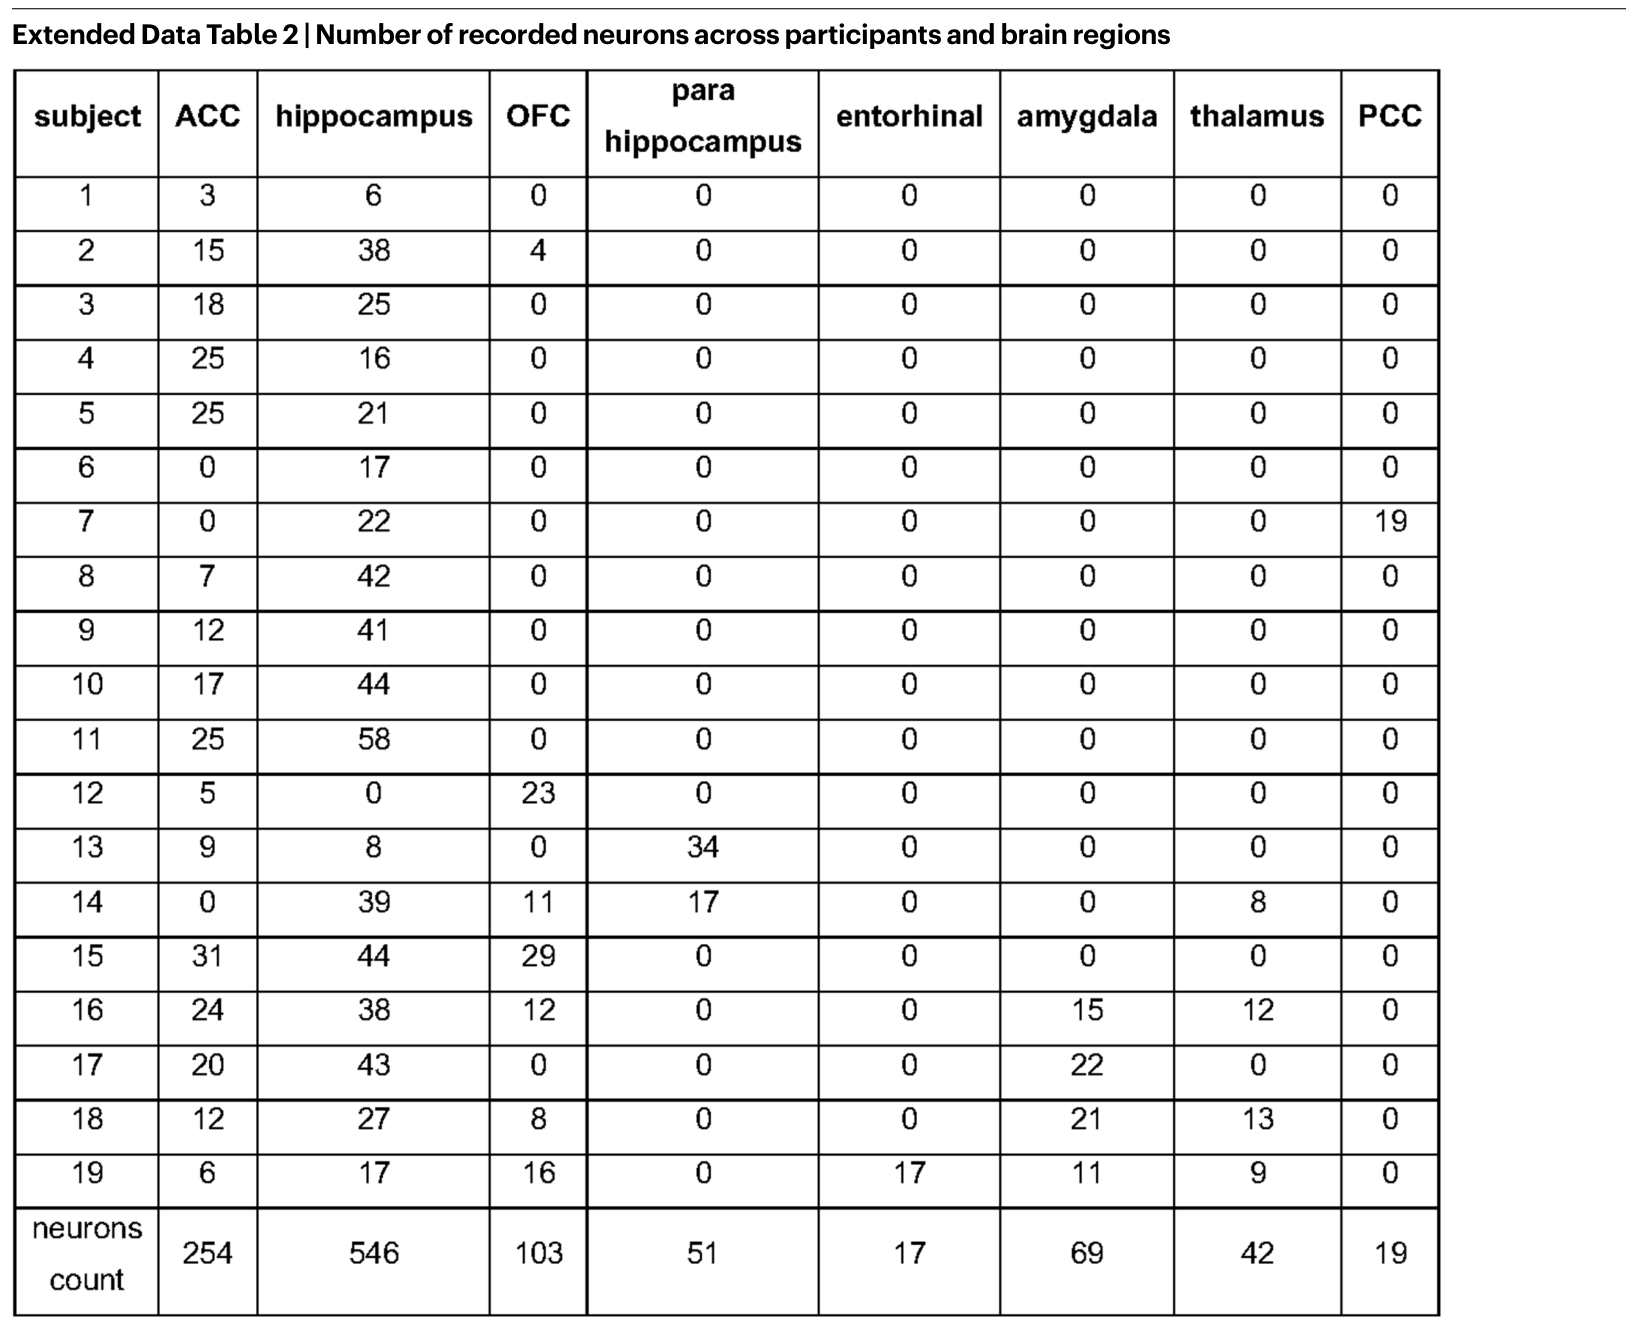
Neurons encode blend weight, behavioral covariates, and interactions with prey value. The recorded populations comprise 254 ACC, 546 hippocampal, and 103 OFC neurons. Models separate blend-related tuning from speed, distance, elapsed time, and reward differences.
ACC tuning favors higher-value pursuit; hippocampal populations more evenly represent intermediate policies. OFC tuning depends strongly on reward context. Cross-validated information analyses and low-dimensional summaries reveal different distributions of sensitivity across the blending continuum, rather than one identical choice signal in all regions.
Related references: [20], [21], [26], [37], [38], [39], [40].
Population dynamics during switches
Demixed population activity tracks the behavioral switch trajectory most closely in ACC. Switch-related information is decodable before and after the switch there, and at switch offset in hippocampus; it is not significantly decoded in OFC in this analysis. Lower OFC neuron counts limit comparisons.
Reward equality changes the organization of neural state spaces and coordination between regions. ACC remains more value-biased, whereas hippocampal and OFC representations emphasize blended states when options have equal value. These are analyses of pooled recorded populations, not demonstrations of directed causal communication.
Related references: [43], [82].
Signals preceding a change of goal
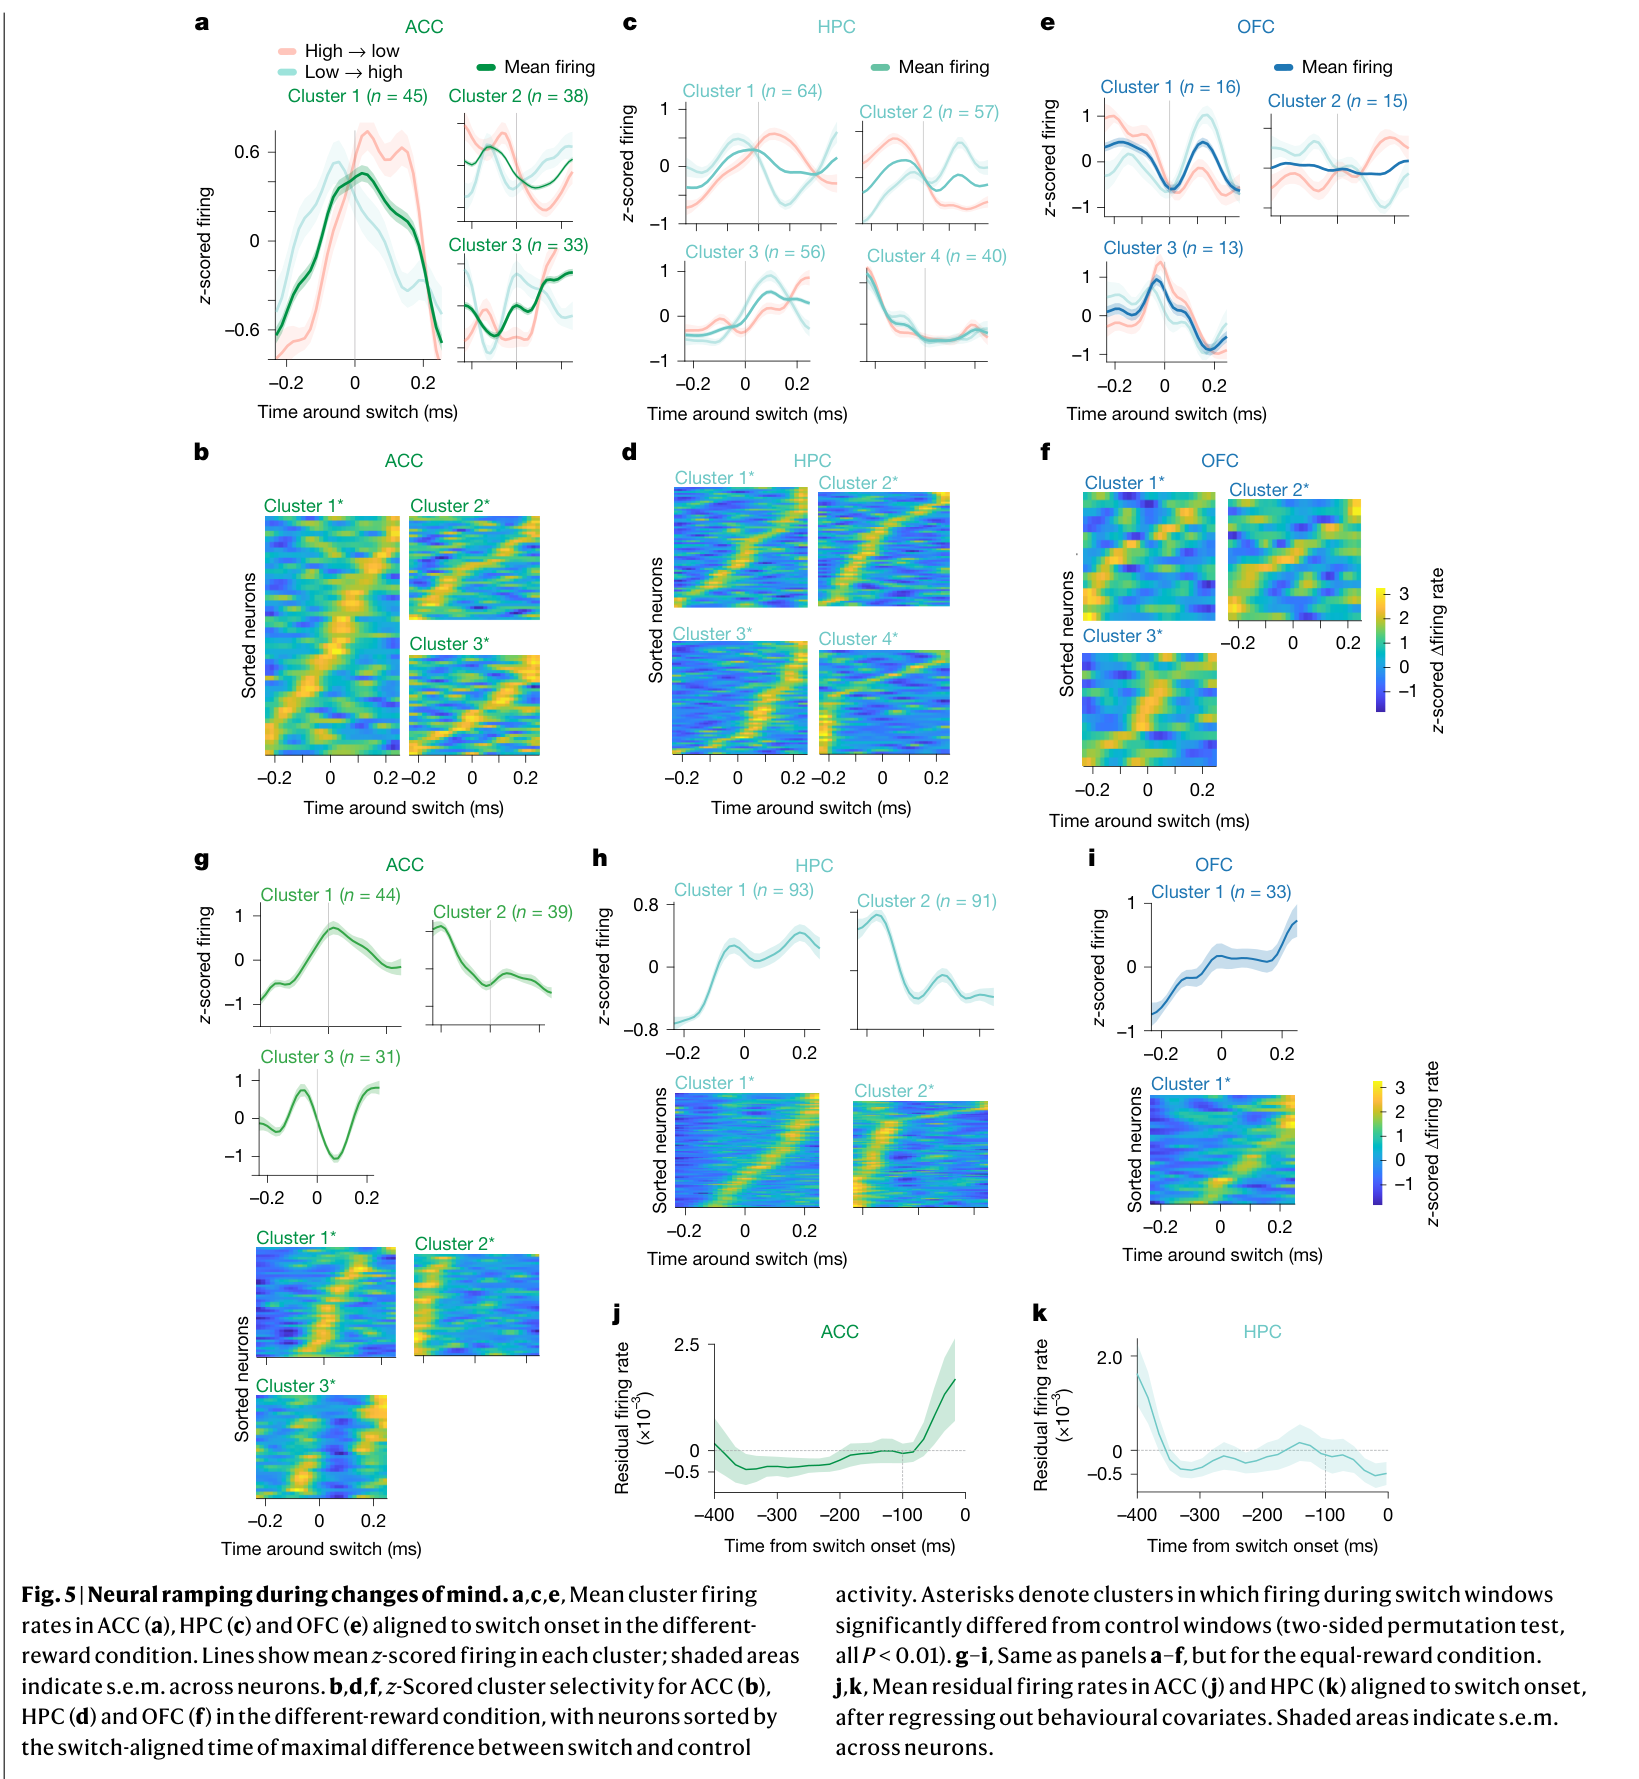
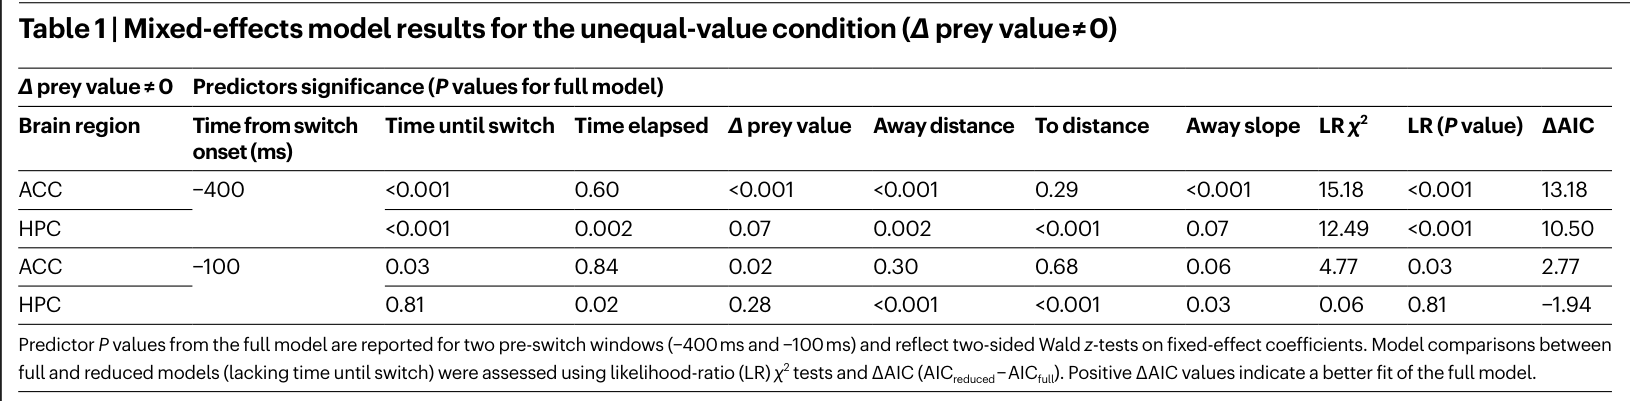
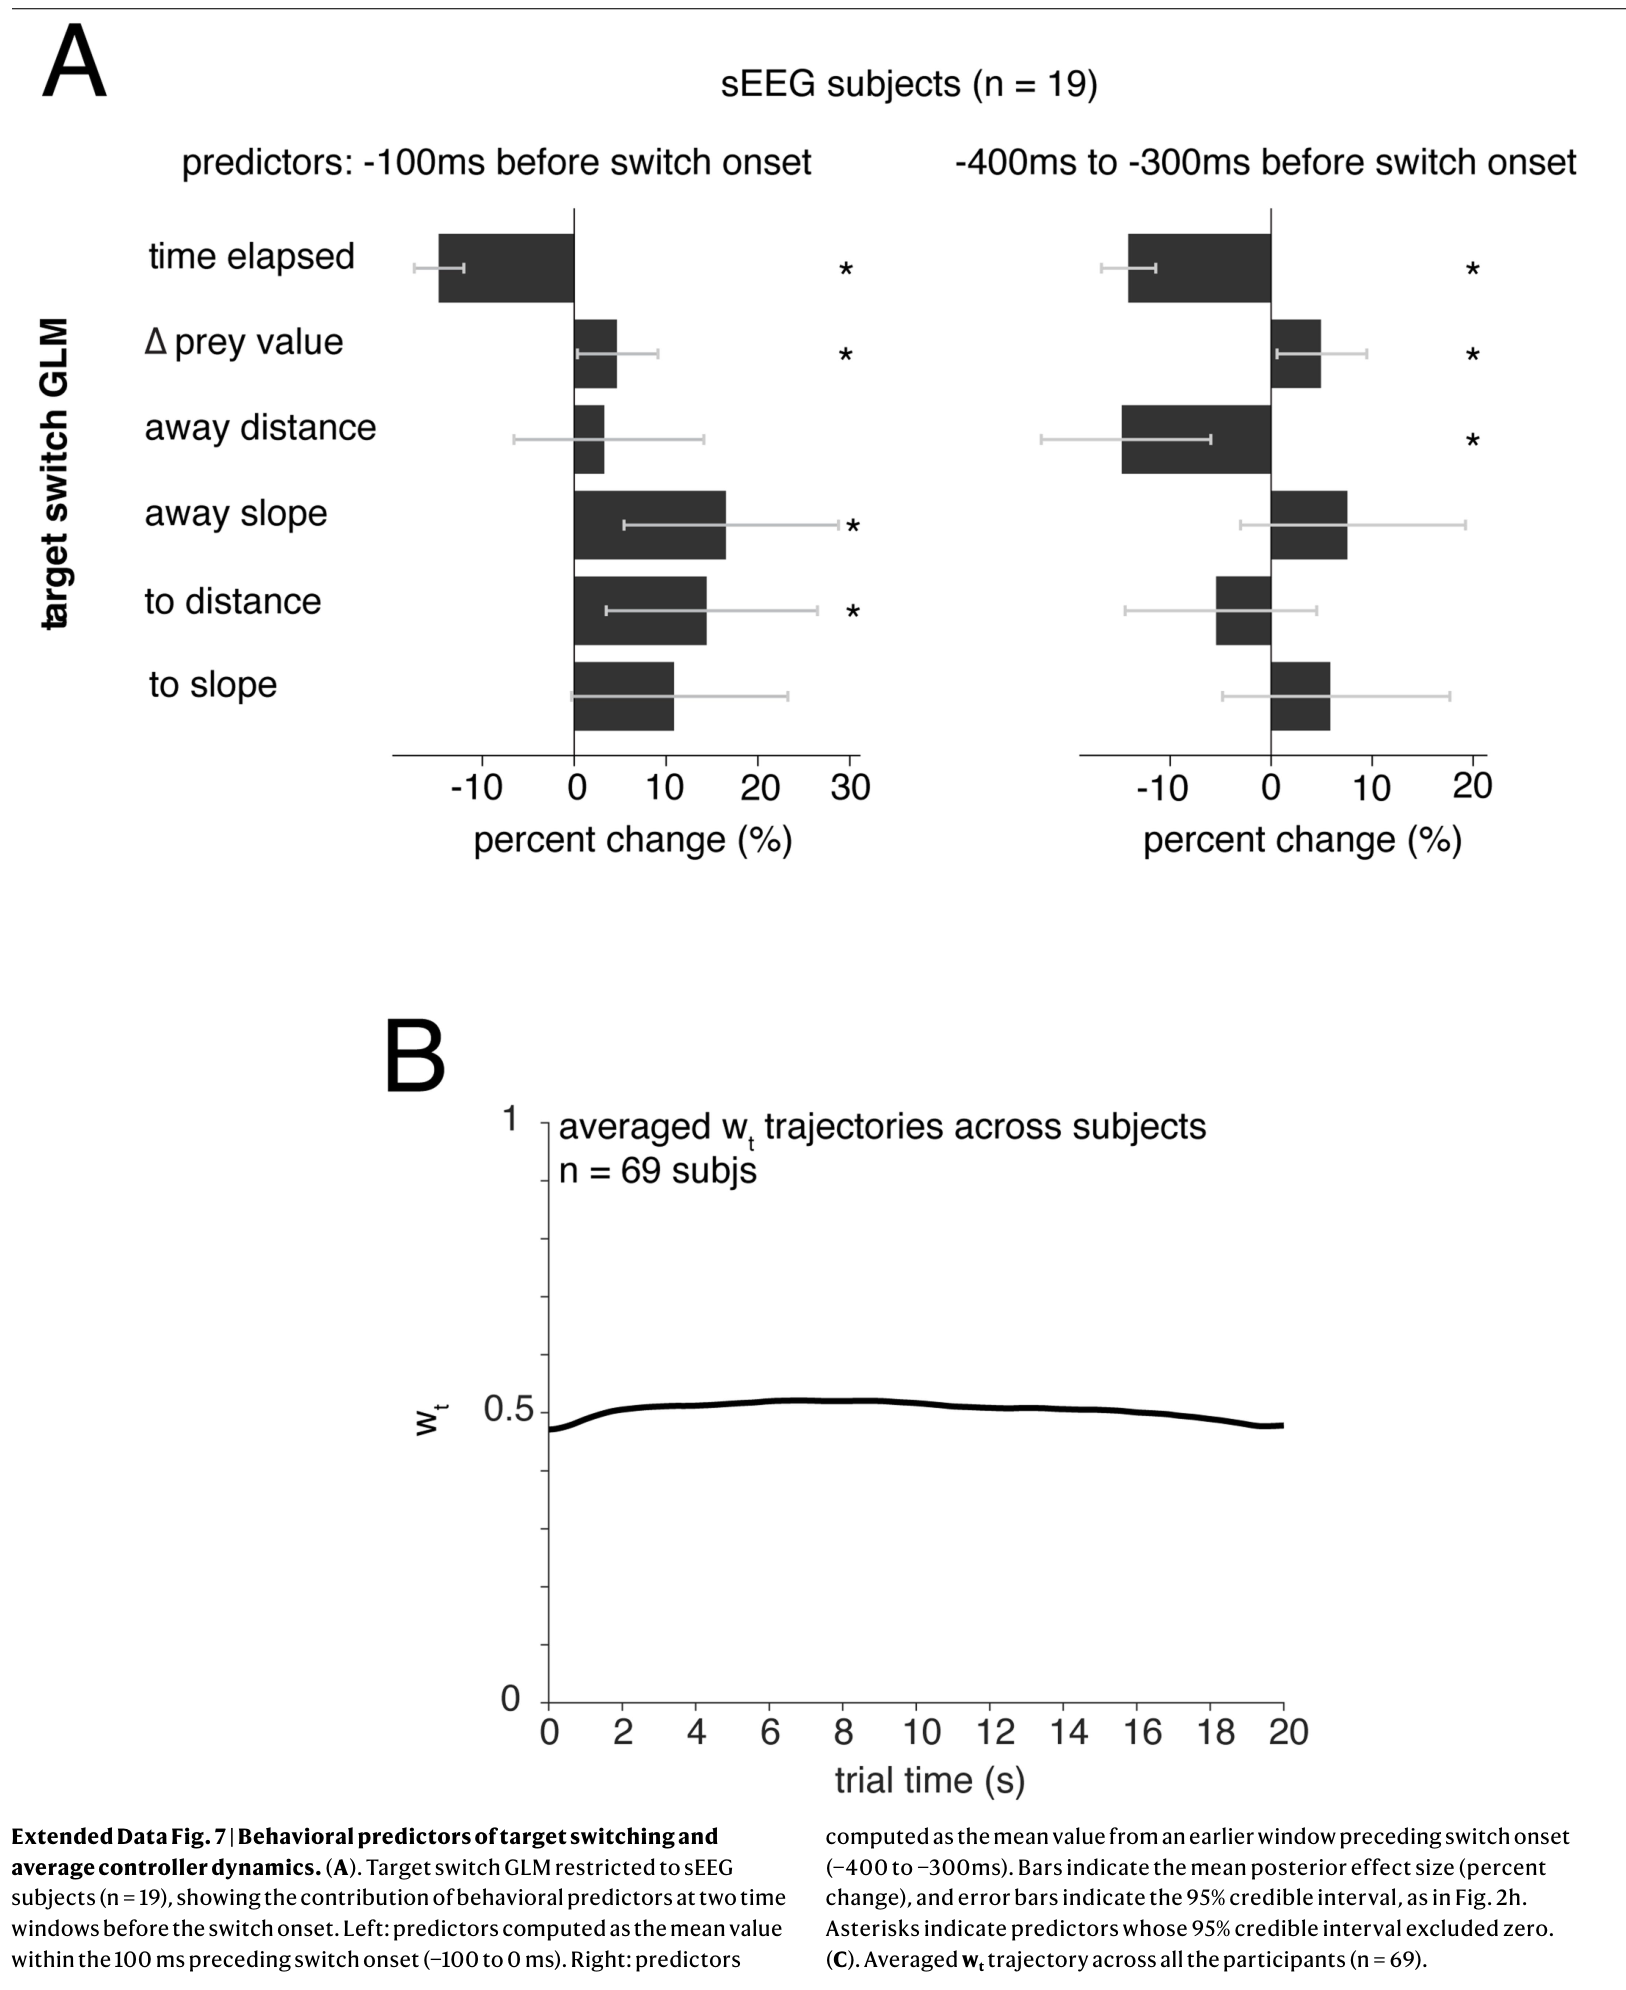
Neural clustering identifies sustained ACC ramping around goal changes, weaker and more heterogeneous hippocampal dynamics, and no comparable clear OFC ramp. In unequal-value trials, both ACC and hippocampal activity contain pre-switch information beyond modeled behavioral covariates over a 400-millisecond window. In the final 100 milliseconds, the effect persists in ACC but not hippocampus.
When prey values are equal, ACC retains a shorter-latency switch-related effect but the longer window is not significant. These results are consistent with different time courses for policy-state representation and meta-control. The preserved tables show the full-model tests, likelihood comparisons, and covariates.
Related references: [36], [44].

Interpretation and limits
The authors propose hippocampus as a state-estimating controller, ACC as a meta-controller that adjusts policy blends, and OFC as a representation of the value context. This extends discrete-choice accounts to continuous interaction.
The evidence is correlational and depends on a fitted behavioral model, selected switch events, and clinical electrode placement. Some controller classes are only partly identifiable; neural populations and task conditions have unequal samples. Neither anatomical necessity nor sufficiency is established, and results from this two-target task do not prove a universal brain architecture for compositional behavior.
Participants, task, and model fitting
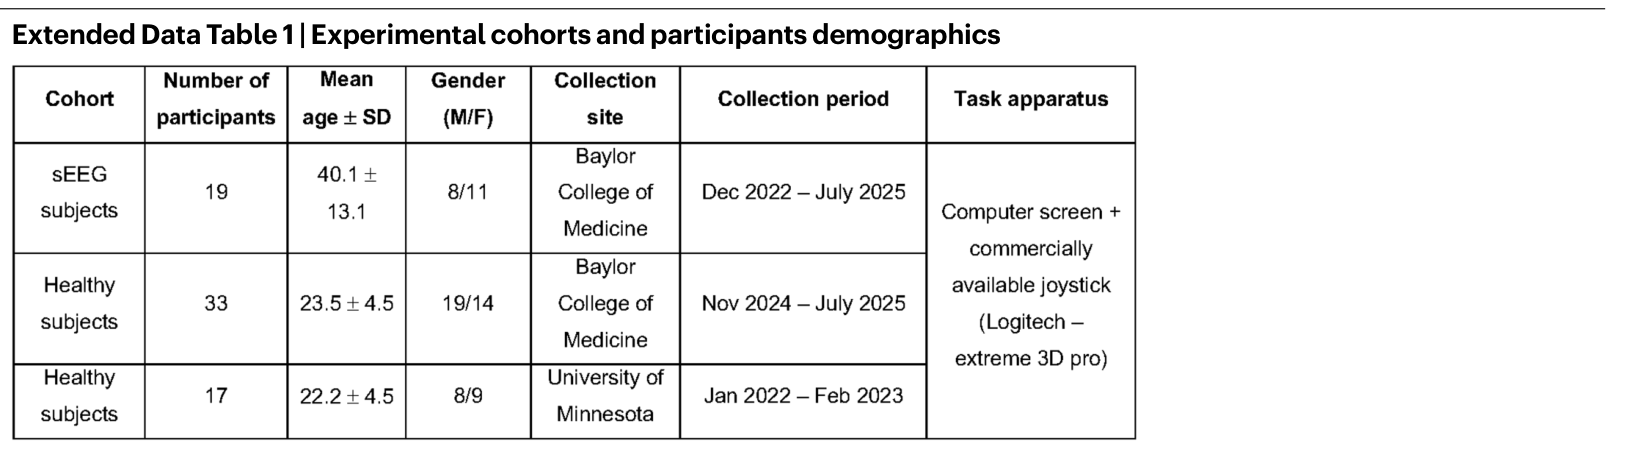
Nineteen patients undergoing intracranial epilepsy monitoring contribute single-neuron recordings; 50 healthy participants provide a separate behavioral comparison. Electrode locations follow clinical needs. Waveforms are spike-sorted, and electrodes are localized using structural imaging. Original demographic and neuron-count tables are preserved below.
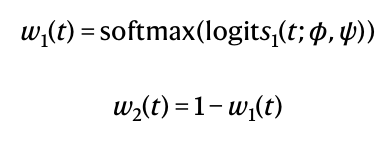
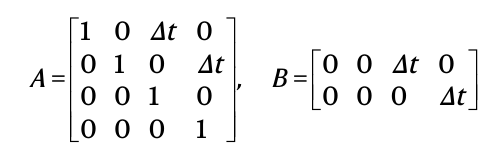
A second-order cursor-dynamics model maps pursuit errors and controller gains to predicted joystick actions. Smooth radial-basis logits parameterize blend weights. Variational Bayesian fitting jointly estimates latent blends and gains, with regularization for smoothness and plausible parameters. Model evidence and Bayesian averaging compare candidate controller families. Recovery experiments vary gains beyond the empirical range to test estimation behavior.
Related references: [61], [62], [63], [64], [65], [66], [67], [68], [69], [70], [72], [73], [74], [75].
Control and inference equations
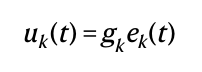
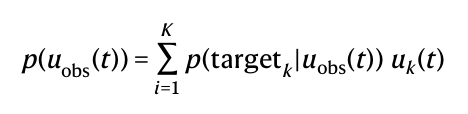
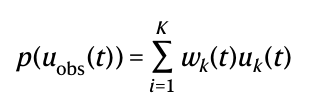
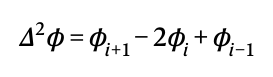
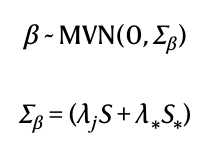
These original displayed equations define component control, blending, likelihoods and priors, cursor dynamics, model evidence, and the neural tuning model. The dropdown numbers are reading-edition labels for equations that are unnumbered in the original article.
Equations 1–18








Neural analyses
Poisson generalized additive models describe nonlinear tuning and interactions while accounting for behavior and reward context. Smoothness and shrinkage priors regularize tuning; posterior intervals and predictive model comparisons determine which effects are retained.
Fisher-information analyses use cross-validation, permutation nulls, and false-discovery correction. Demixed principal-component analysis tests switch-related dynamics and held-out decoding, using pseudo-populations pooled across participants. Clusters come from low-dimensional dynamical models followed by k-means.
Mixed-effects regressions compare pre-switch firing with and without a time-until-switch predictor, controlling for task variables and neuron intercepts. The 400- and 100-millisecond analyses target different parts of the switch preparation period.
Related references: [76], [77], [78], [79], [80], [81], [82].
Extended figures
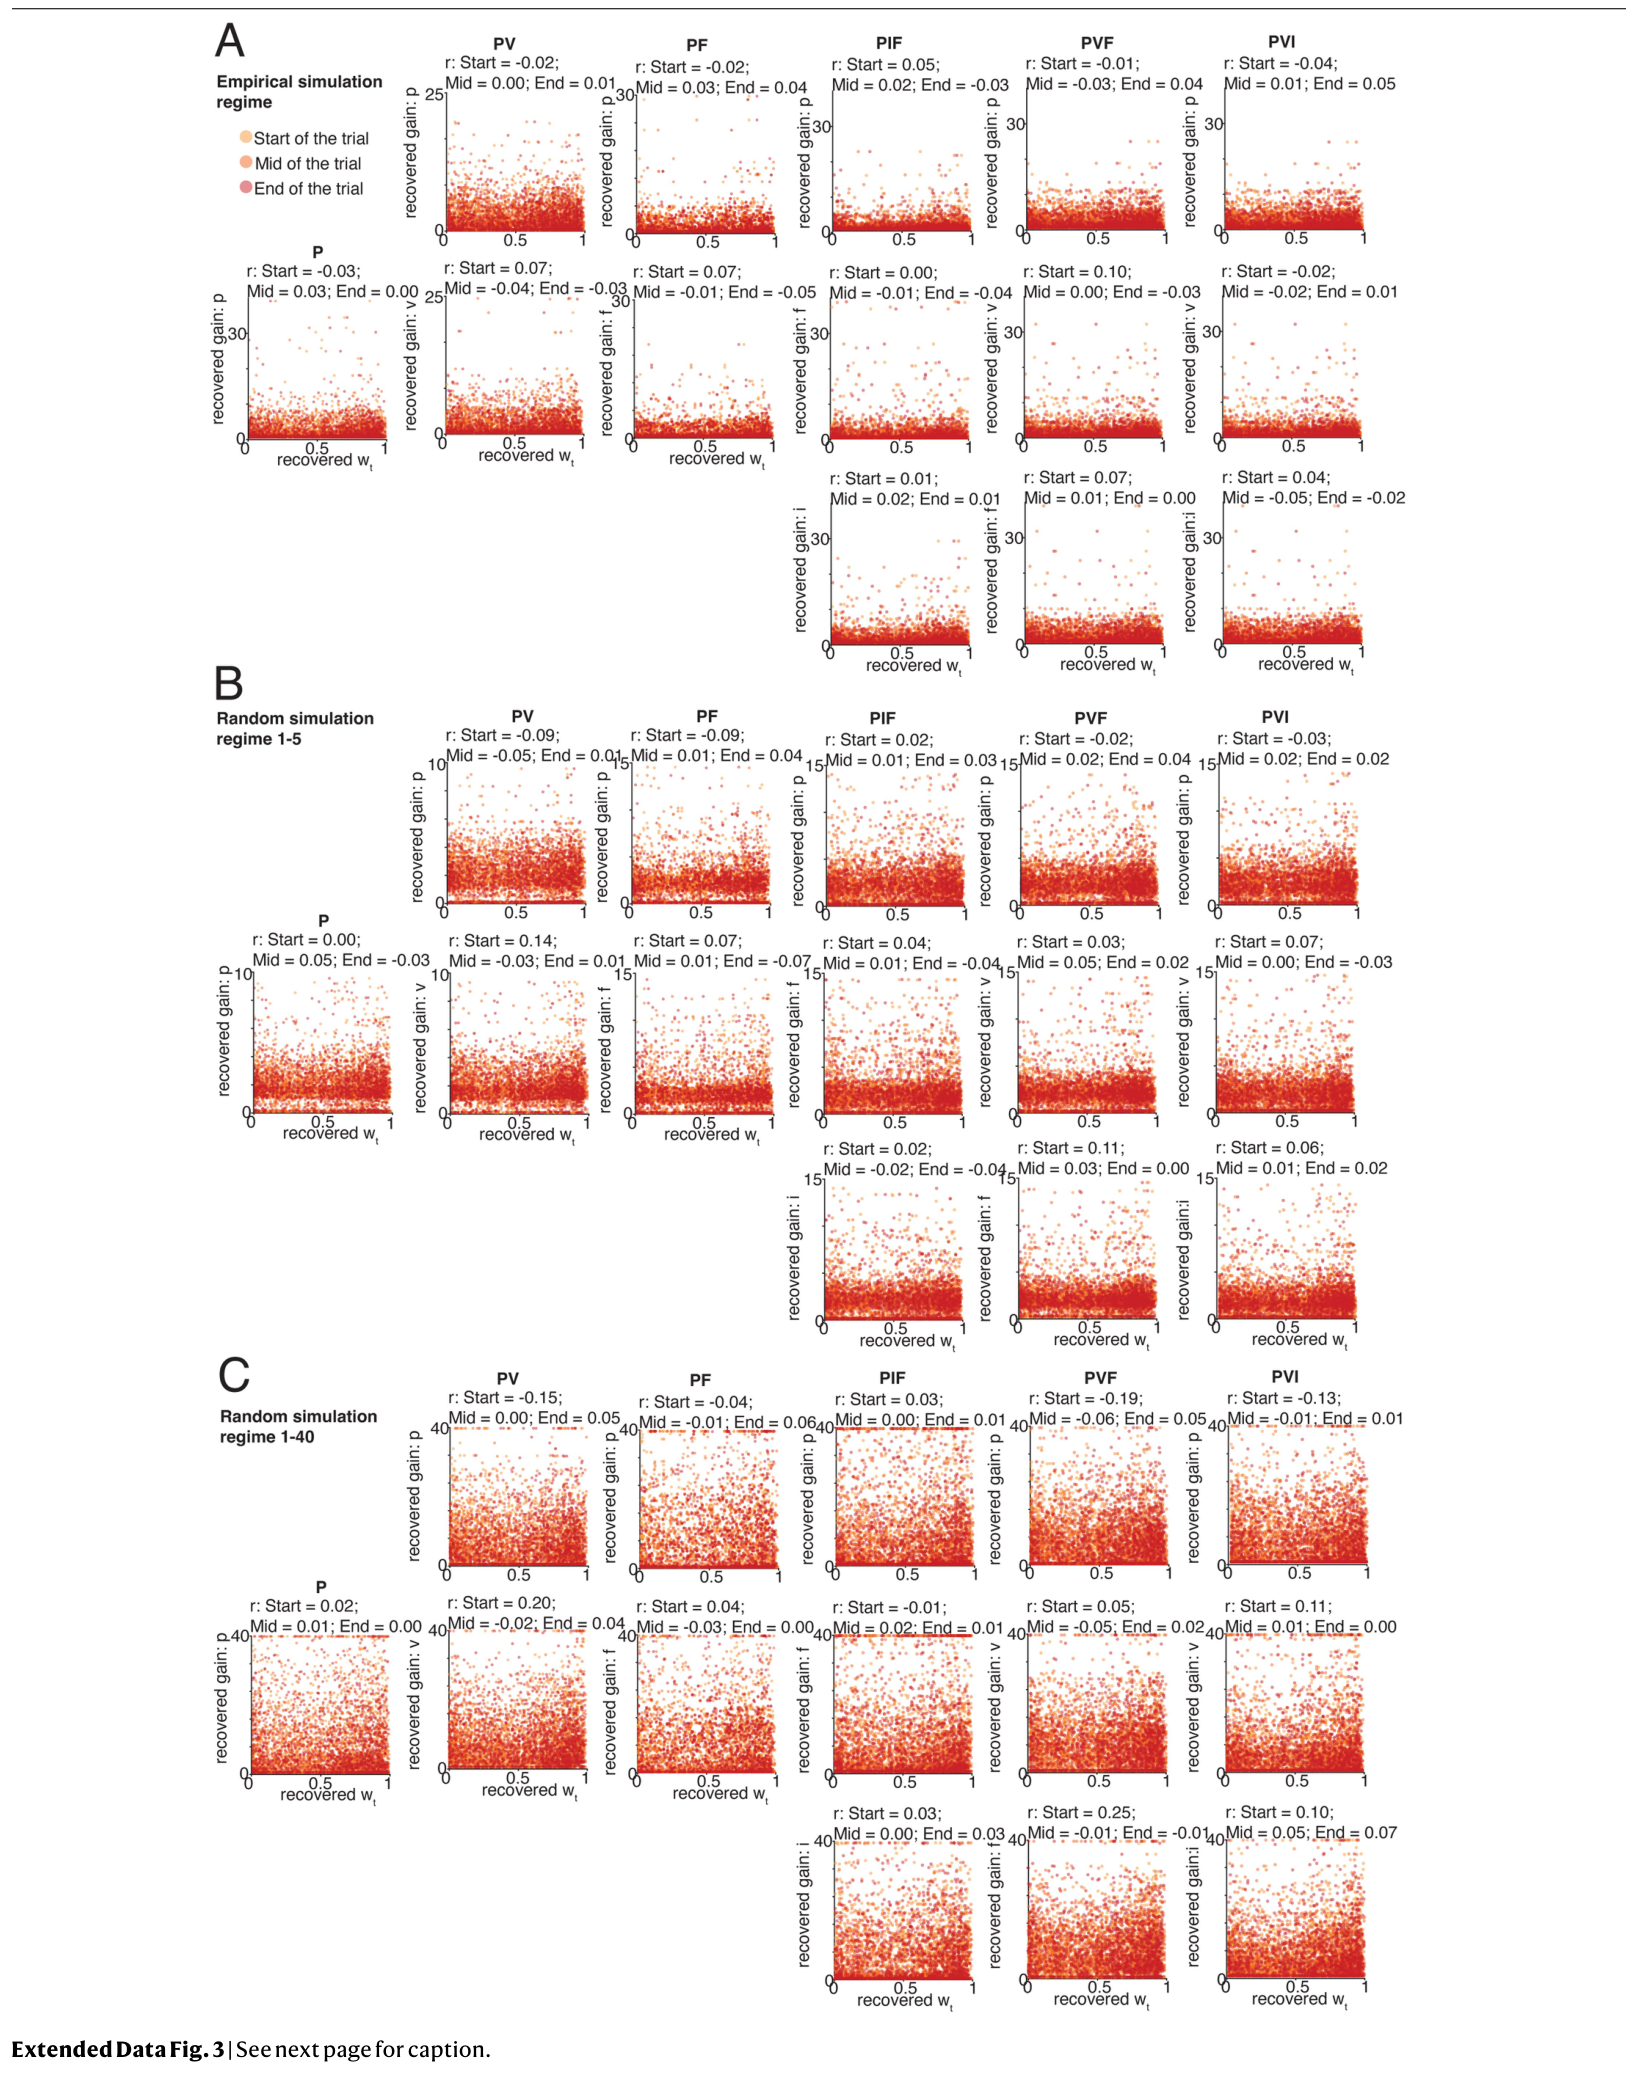
All seven extended figures are retained: recovery of blending trajectories, controller gains, gain–weight relationships, model-confusion analyses, and behavioral switch predictors. Recovery checks support useful latent estimates while exposing overlap among candidate controller classes.
Extended tables
The three extended tables retain participant characteristics, regional neuron counts, and the exact candidate controller definitions.
Reporting details
The reporting tables retain the study-design, statistical, ethics, and participant details supplied with the article. The authors provide preprocessed data and analysis code.
Related references: [83].



Supplementary notes
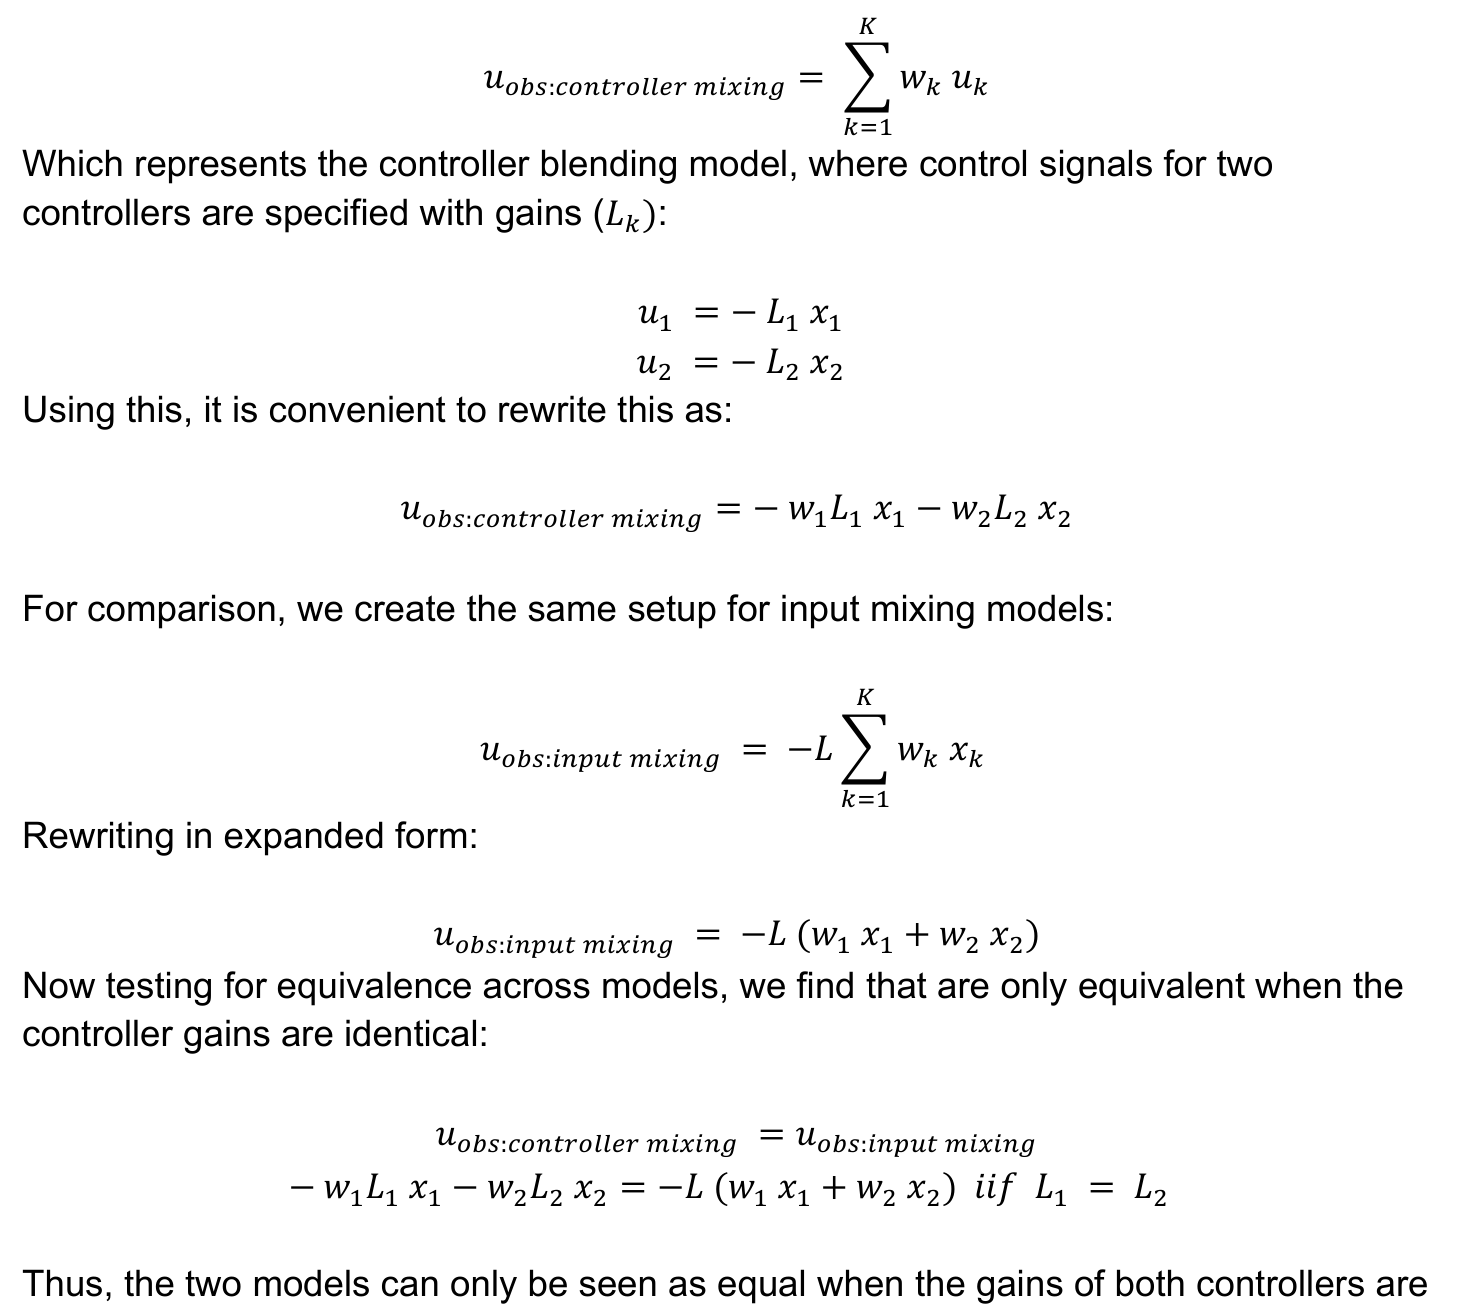
The first note compares blending separate controllers with blending their inputs. Under fixed, steady-state linear gains, the formulations are generally different; equality for arbitrary inputs requires identical component gains. This is an algebraic statement under the note’s assumptions, not a claim that the models differ on every individual trajectory.
The second note examines hippocampal cluster 4. Reward difference is significant, but adding time until switch does not improve the model (likelihood-ratio p = 0.16). Its early firing peak therefore should not be treated as independent evidence of switch prediction.
Equation S1