At a glance
Dopamine neurons may collectively represent a distribution of possible rewards rather than broadcasting one shared average prediction error. Reanalysis of mouse recordings finds reliable differences in optimism, asymmetric responses to better- and worse-than-expected rewards, and recoverable information about reward distributions. The evidence supports distributional reinforcement learning as a computational account; the required circuit wiring and downstream behavioral uses remain unresolved.
From average value to a reward distribution
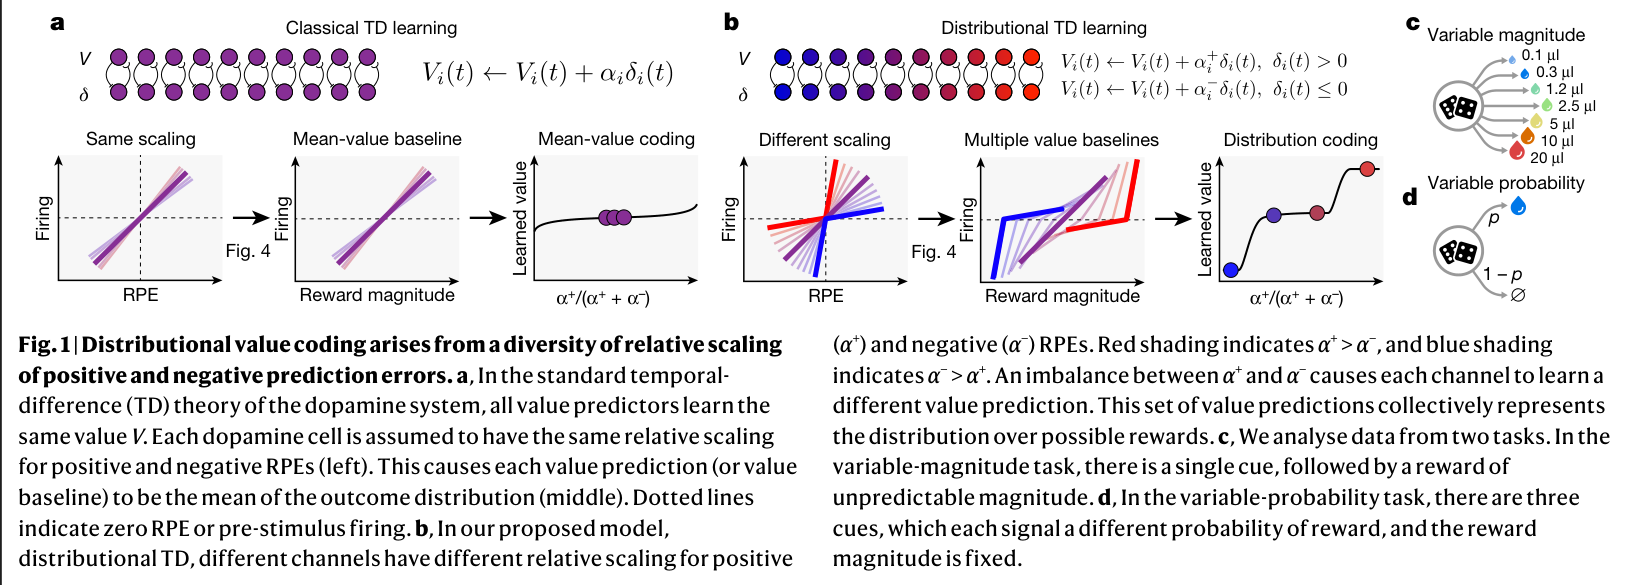
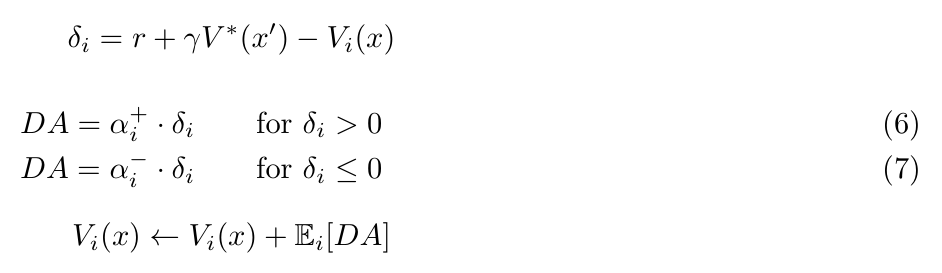
Classical temporal-difference learning updates a single expected return. Distributional reinforcement learning instead maintains many predictions, spanning relatively pessimistic to optimistic outcomes. Giving each channel different sensitivities to positive and negative errors makes these predictions spread across the reward distribution. Their average can resemble classical value coding while concealing useful population structure.
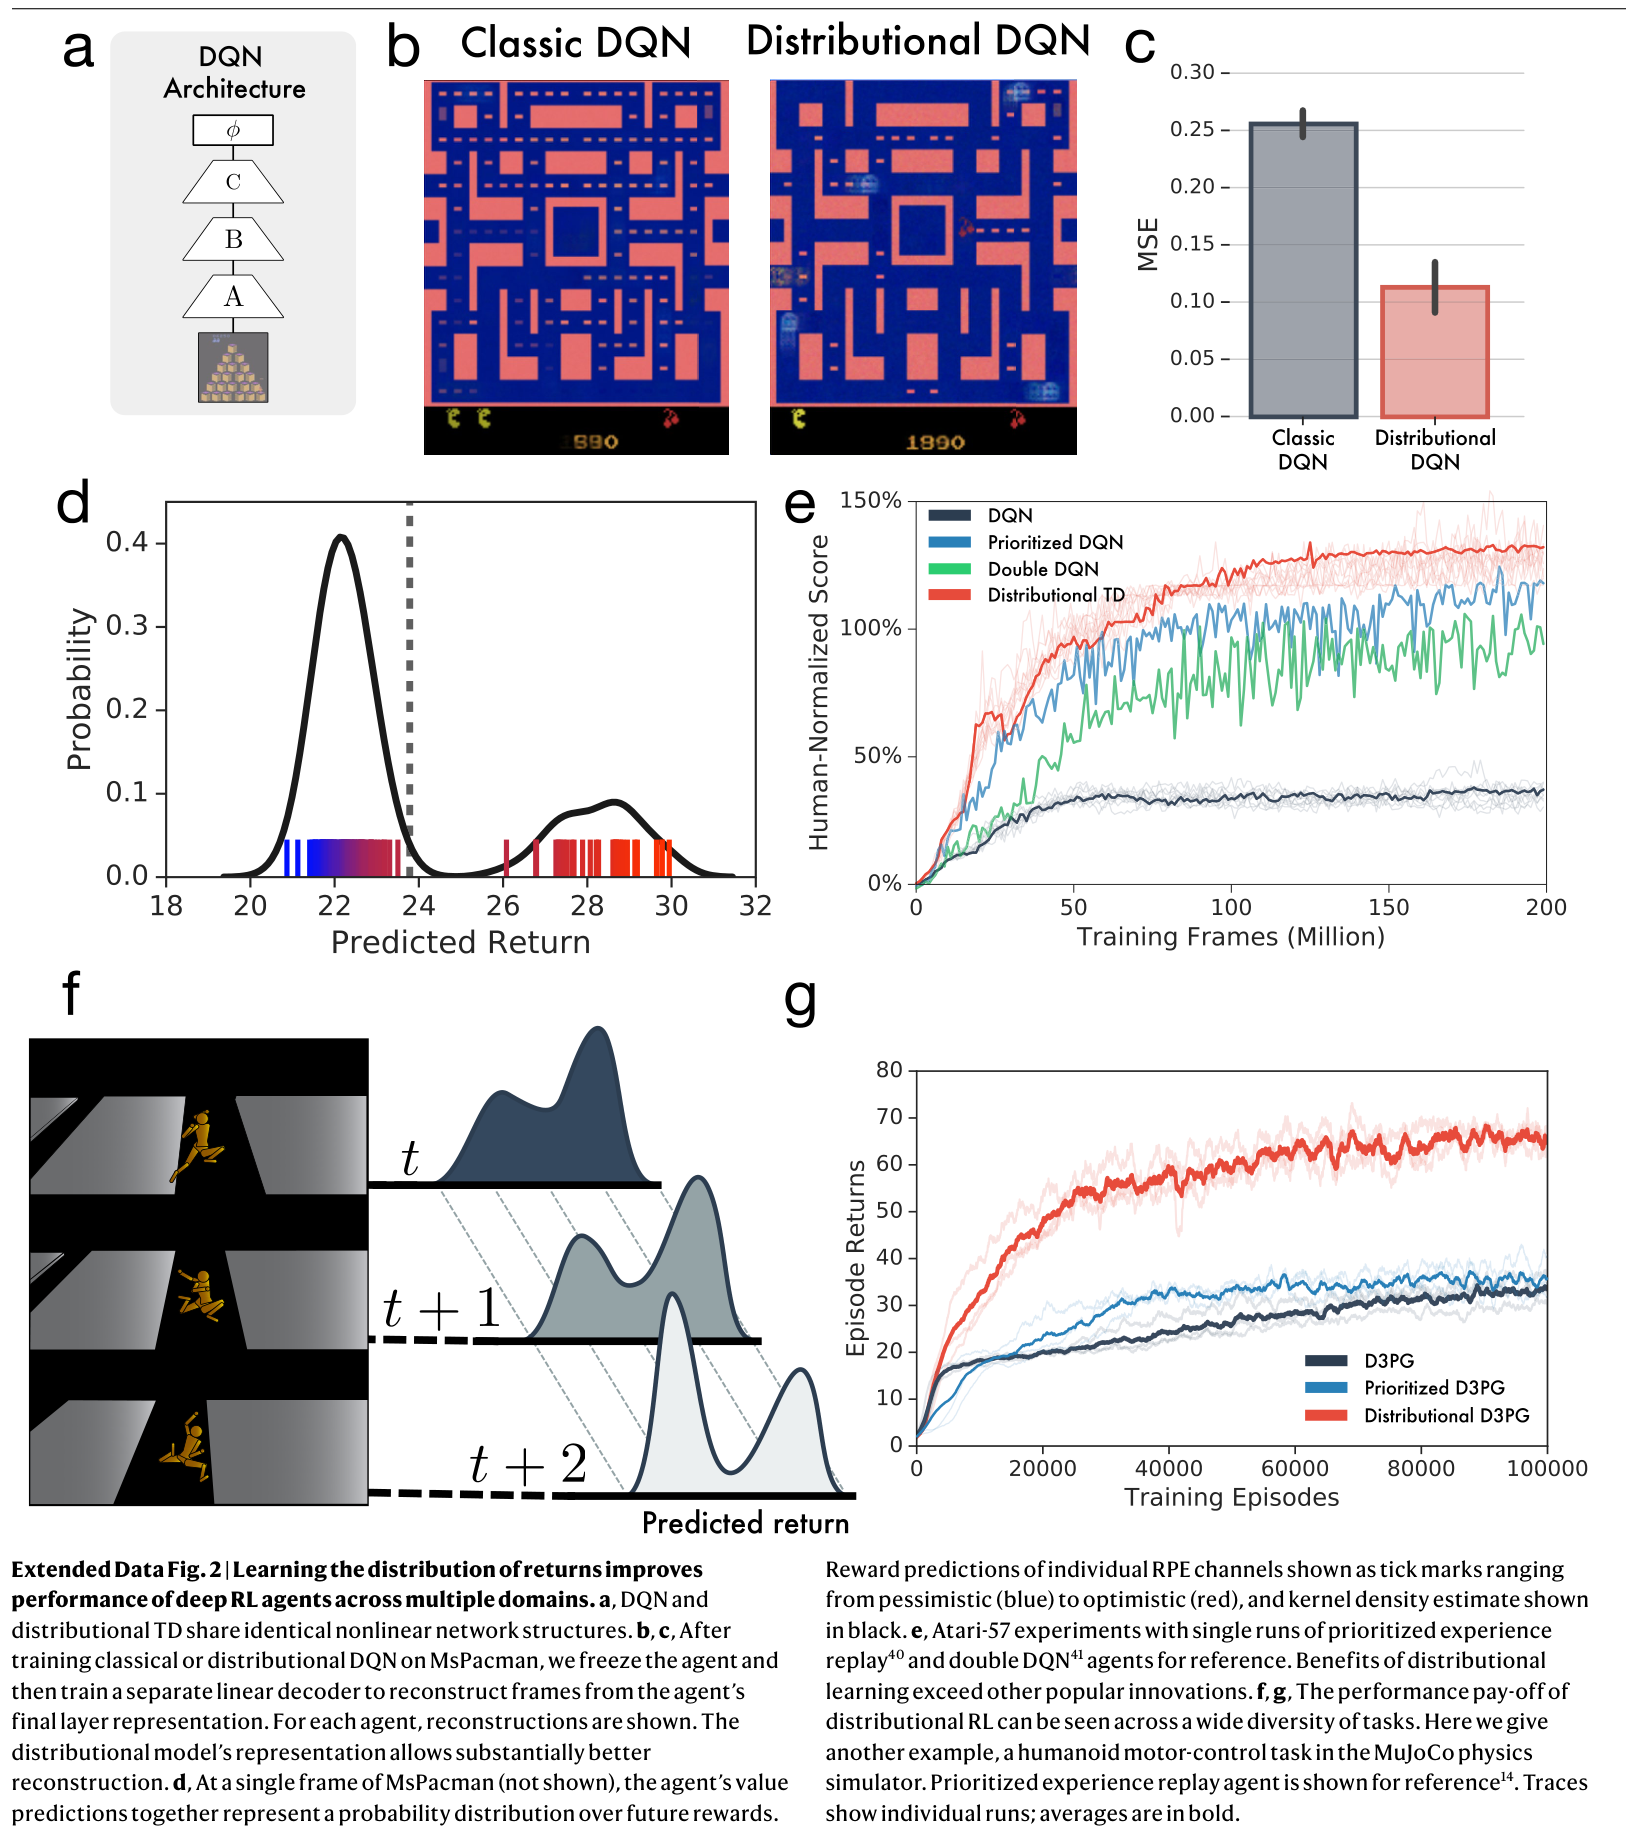
Artificial agents benefit partly because predicting distributions encourages representations that distinguish states with identical mean rewards but different outcome patterns. This motivates a neural hypothesis, rather than establishing that the brain implements the artificial algorithm literally.
Related references: [5], [6], [7], [8], [14], [15].
Diverse dopamine prediction errors
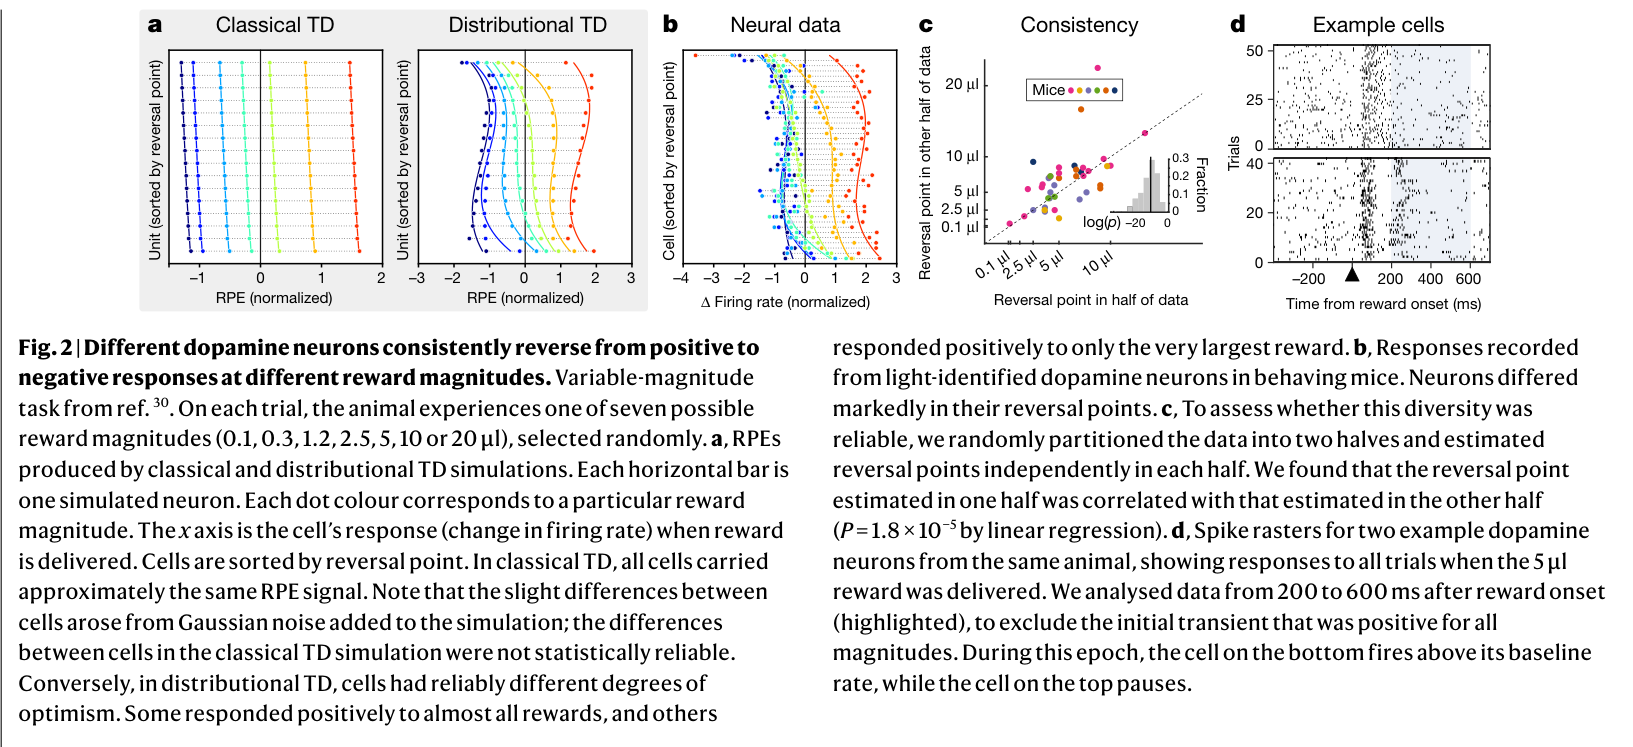
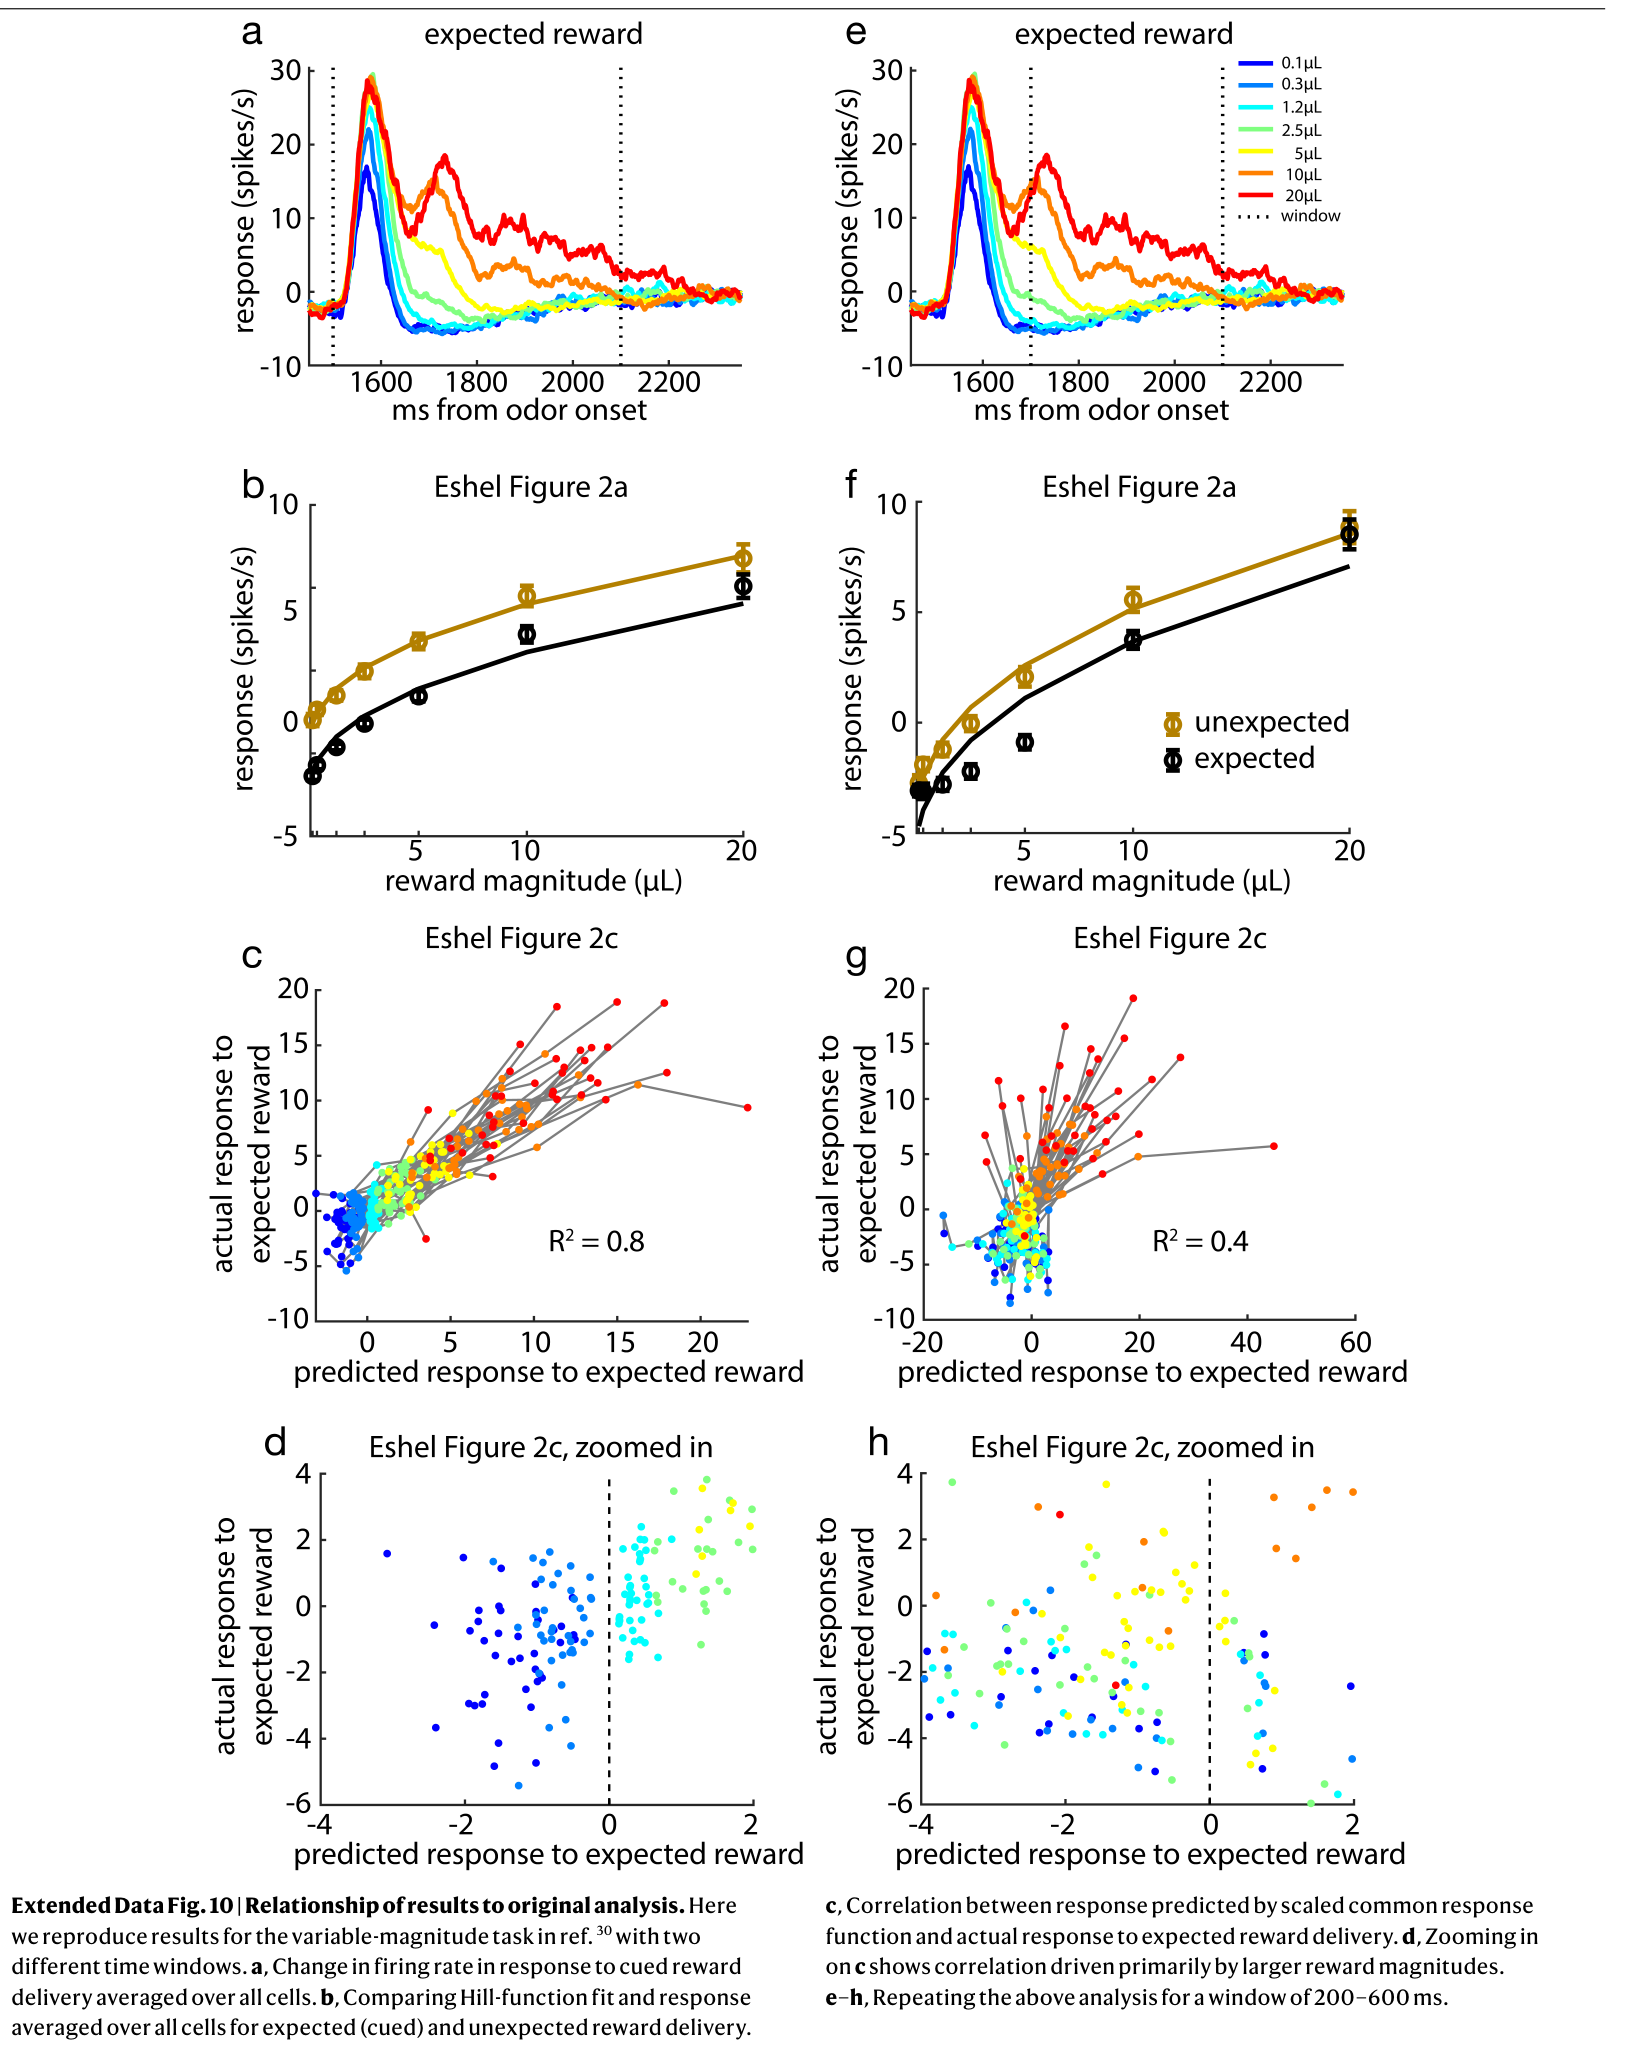
In a variable-magnitude task, rewards range from 0.1 to 20 microlitres. Across 40 recorded dopamine cells, the reward magnitude at which a response changes from below to above baseline varies substantially and is reproducible across independent trial halves (correlation 0.58). For the same 5-microlitre reward, 13 cells respond significantly above baseline and 10 below it.
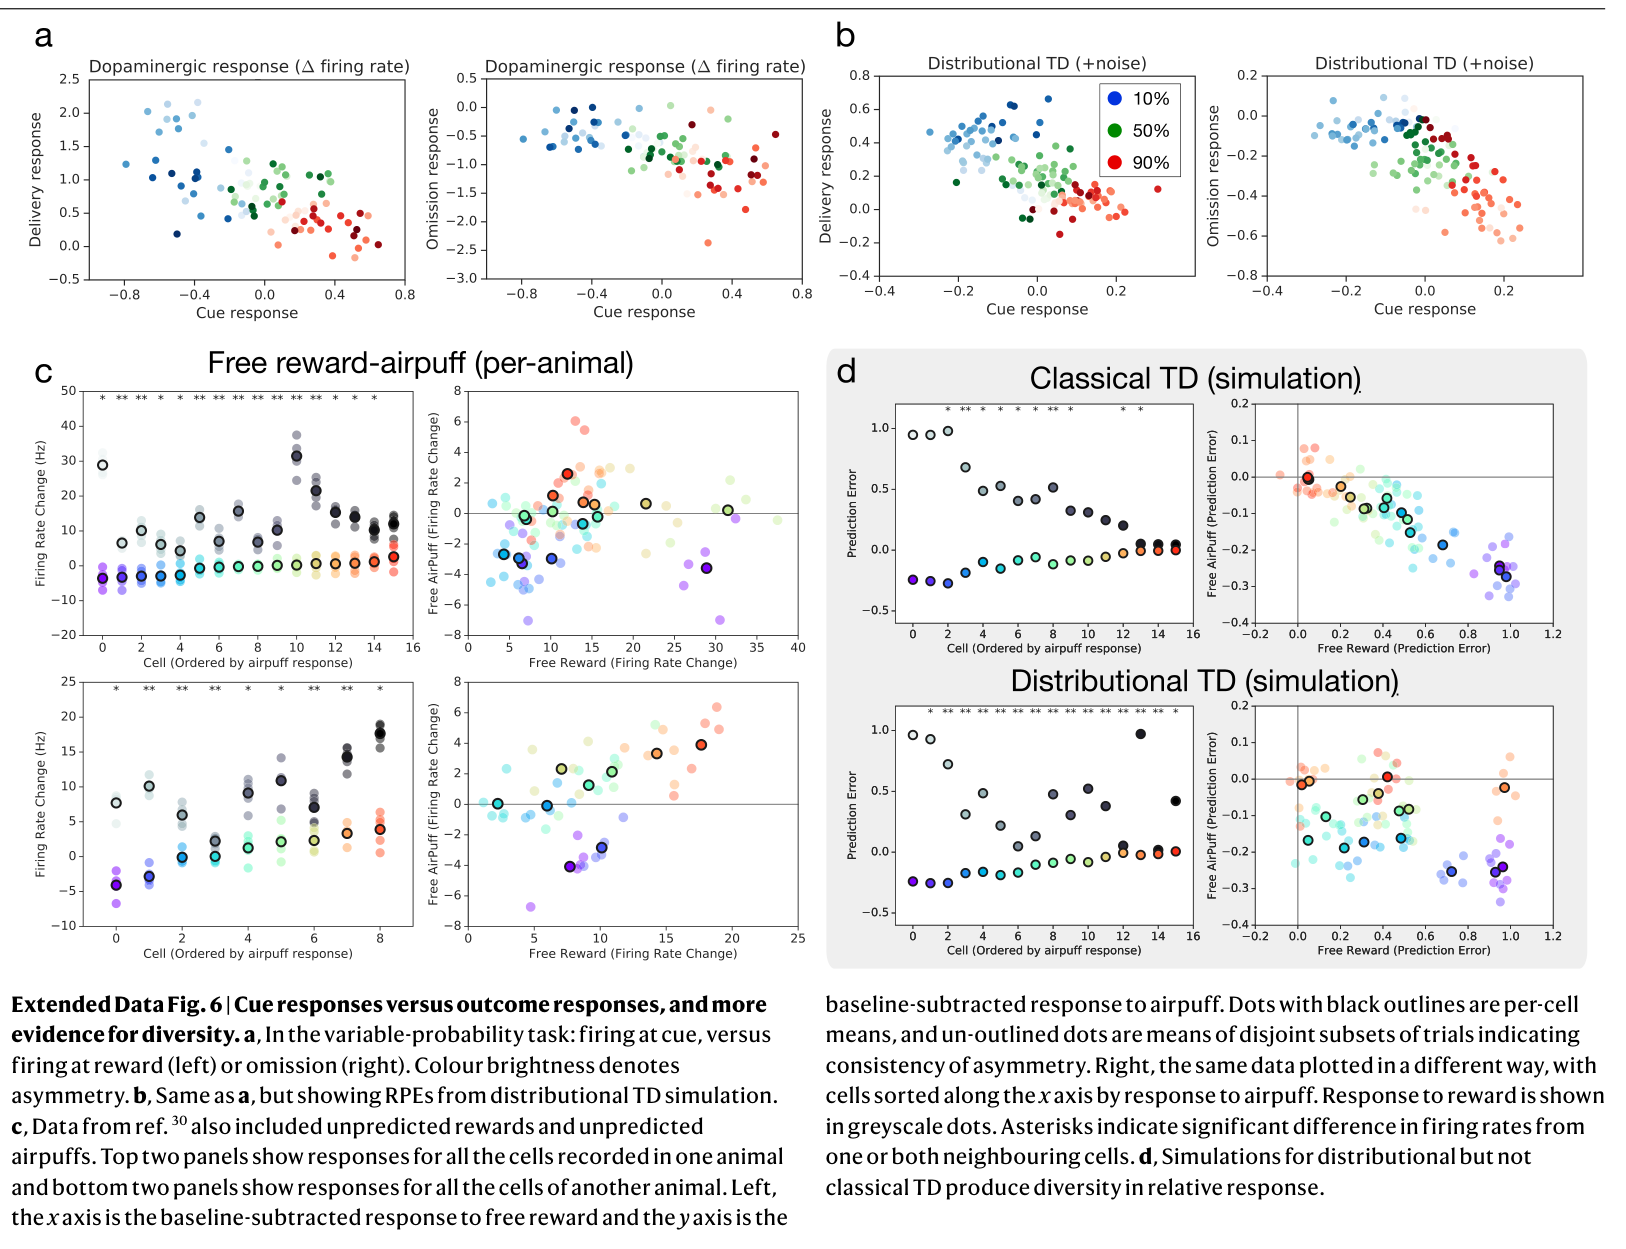
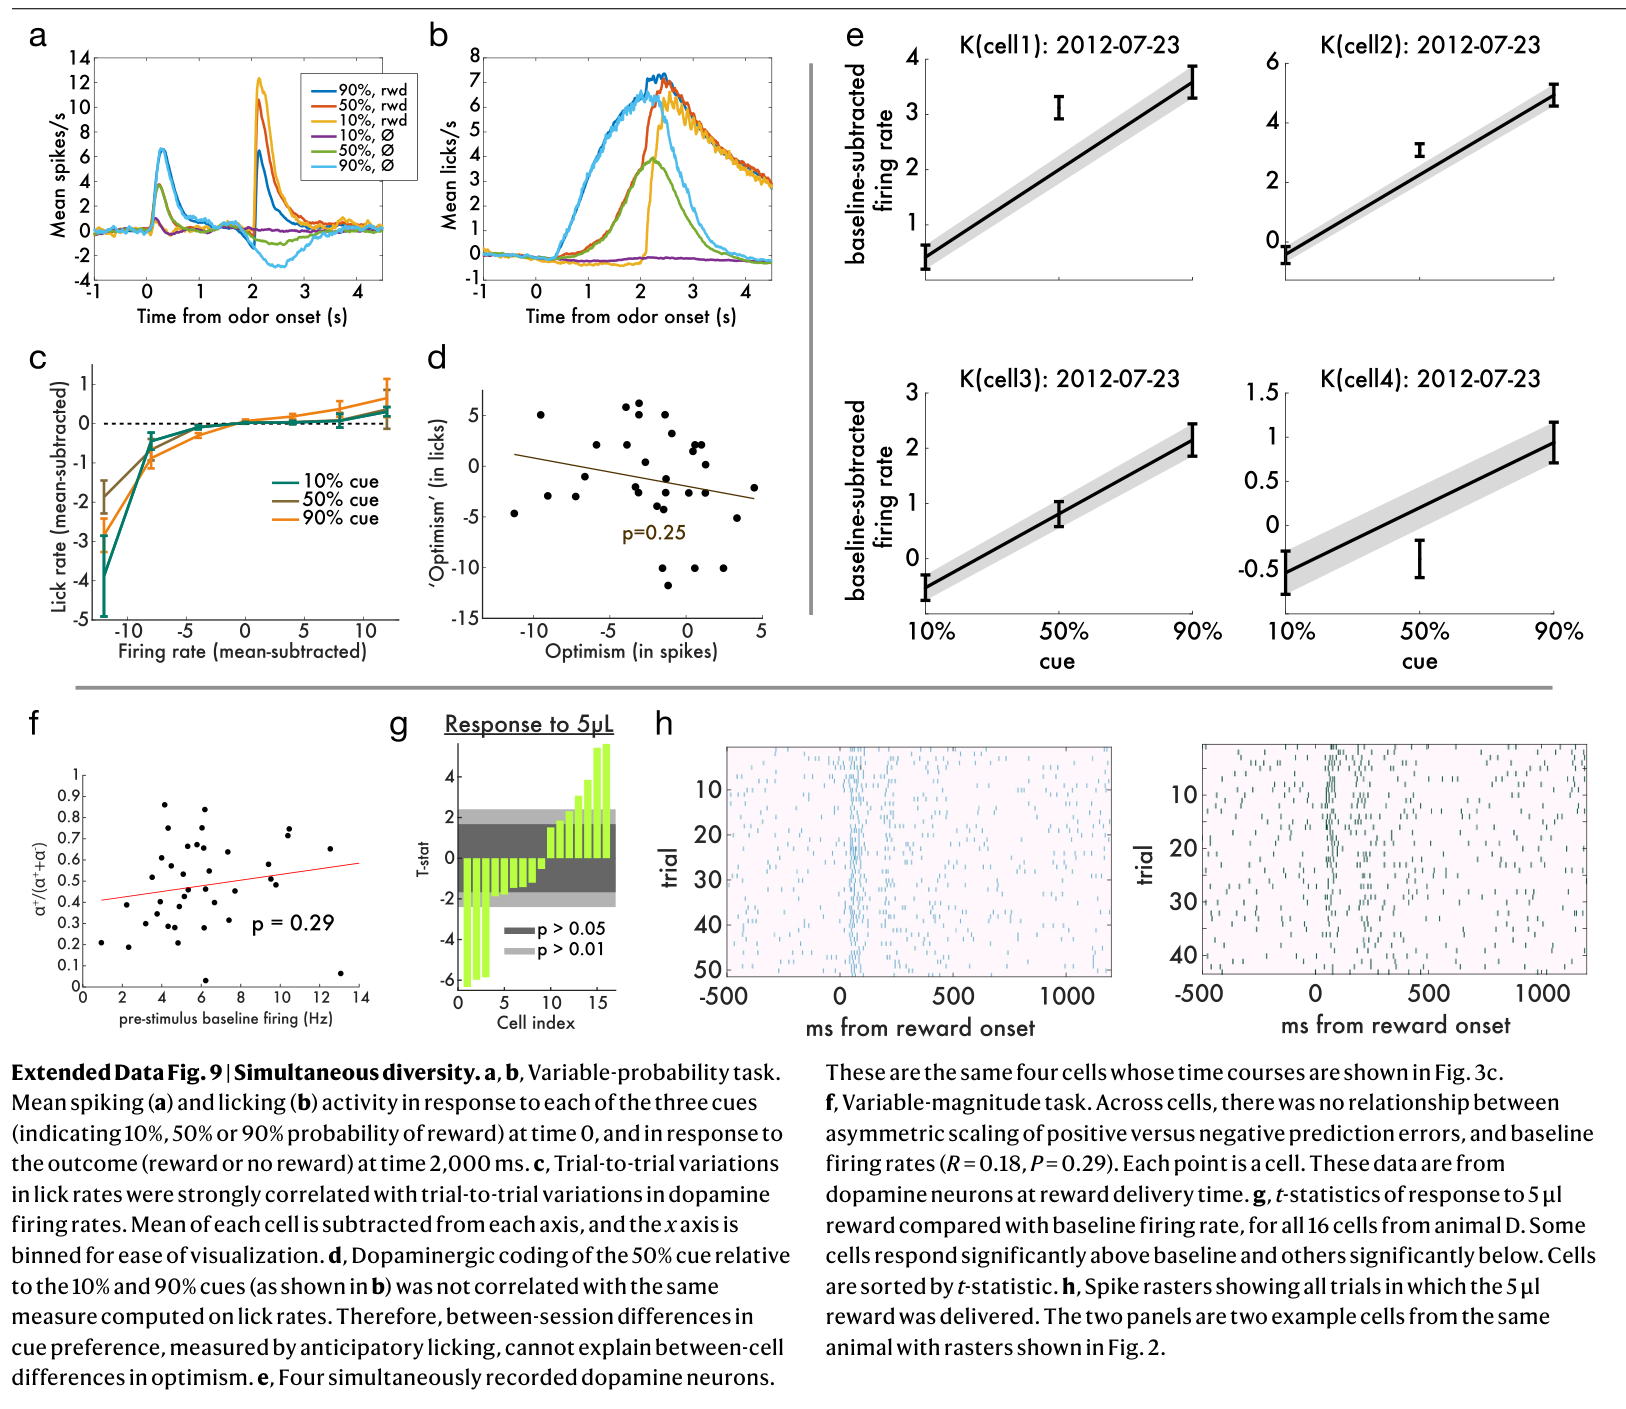
Diversity also occurs within an animal and in simultaneous recordings, arguing against an explanation based only on session-level expectations. Random observation noise added to one common prediction does not explain these stable, opposing responses.
Related references: [19], [30].
Optimistic and pessimistic probability coding
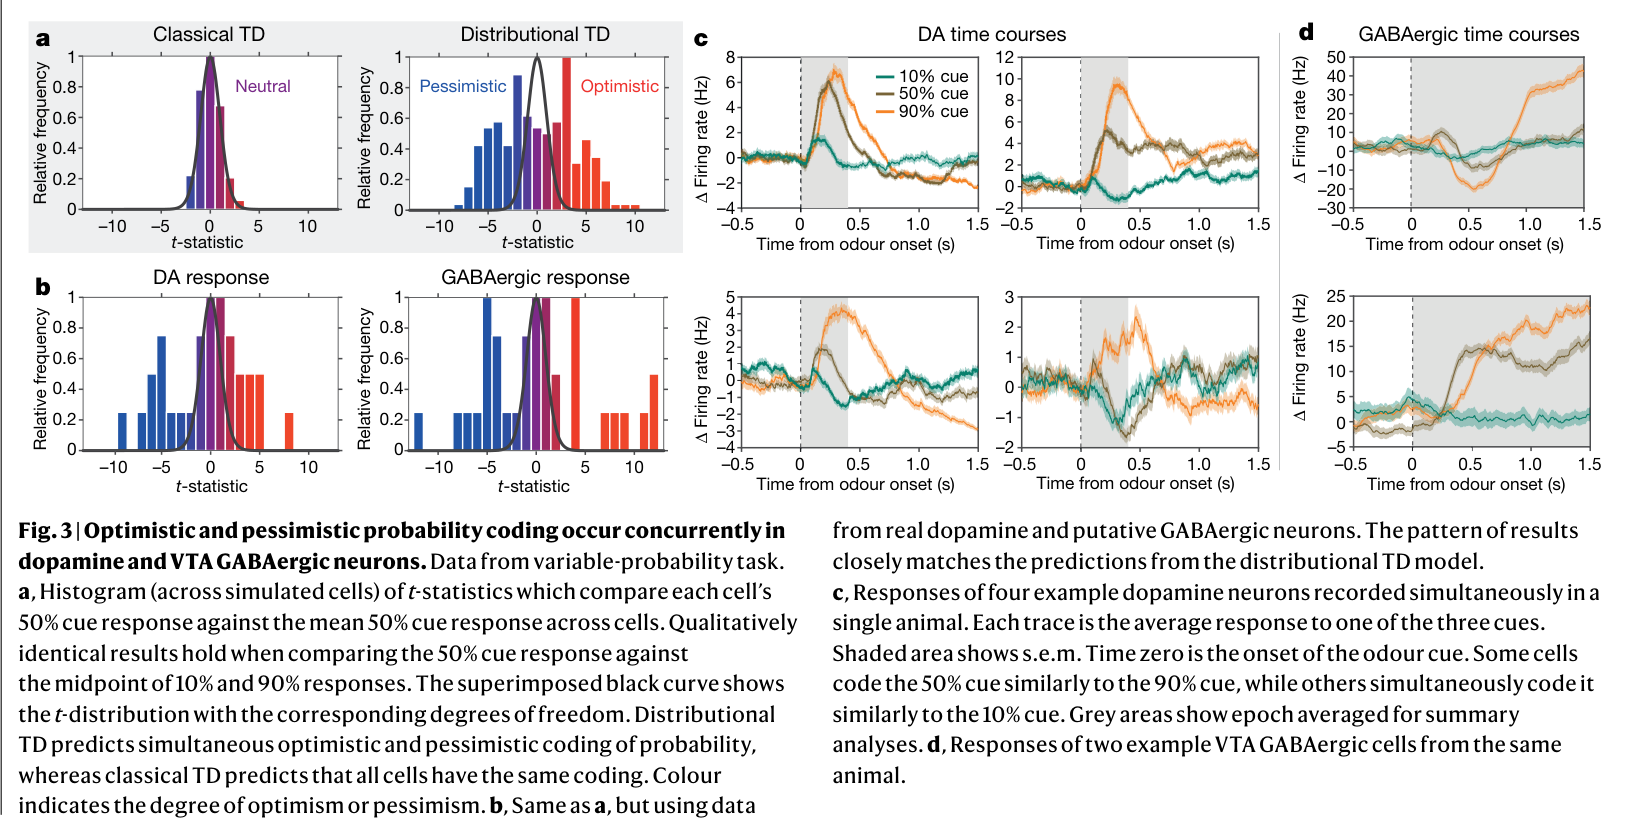
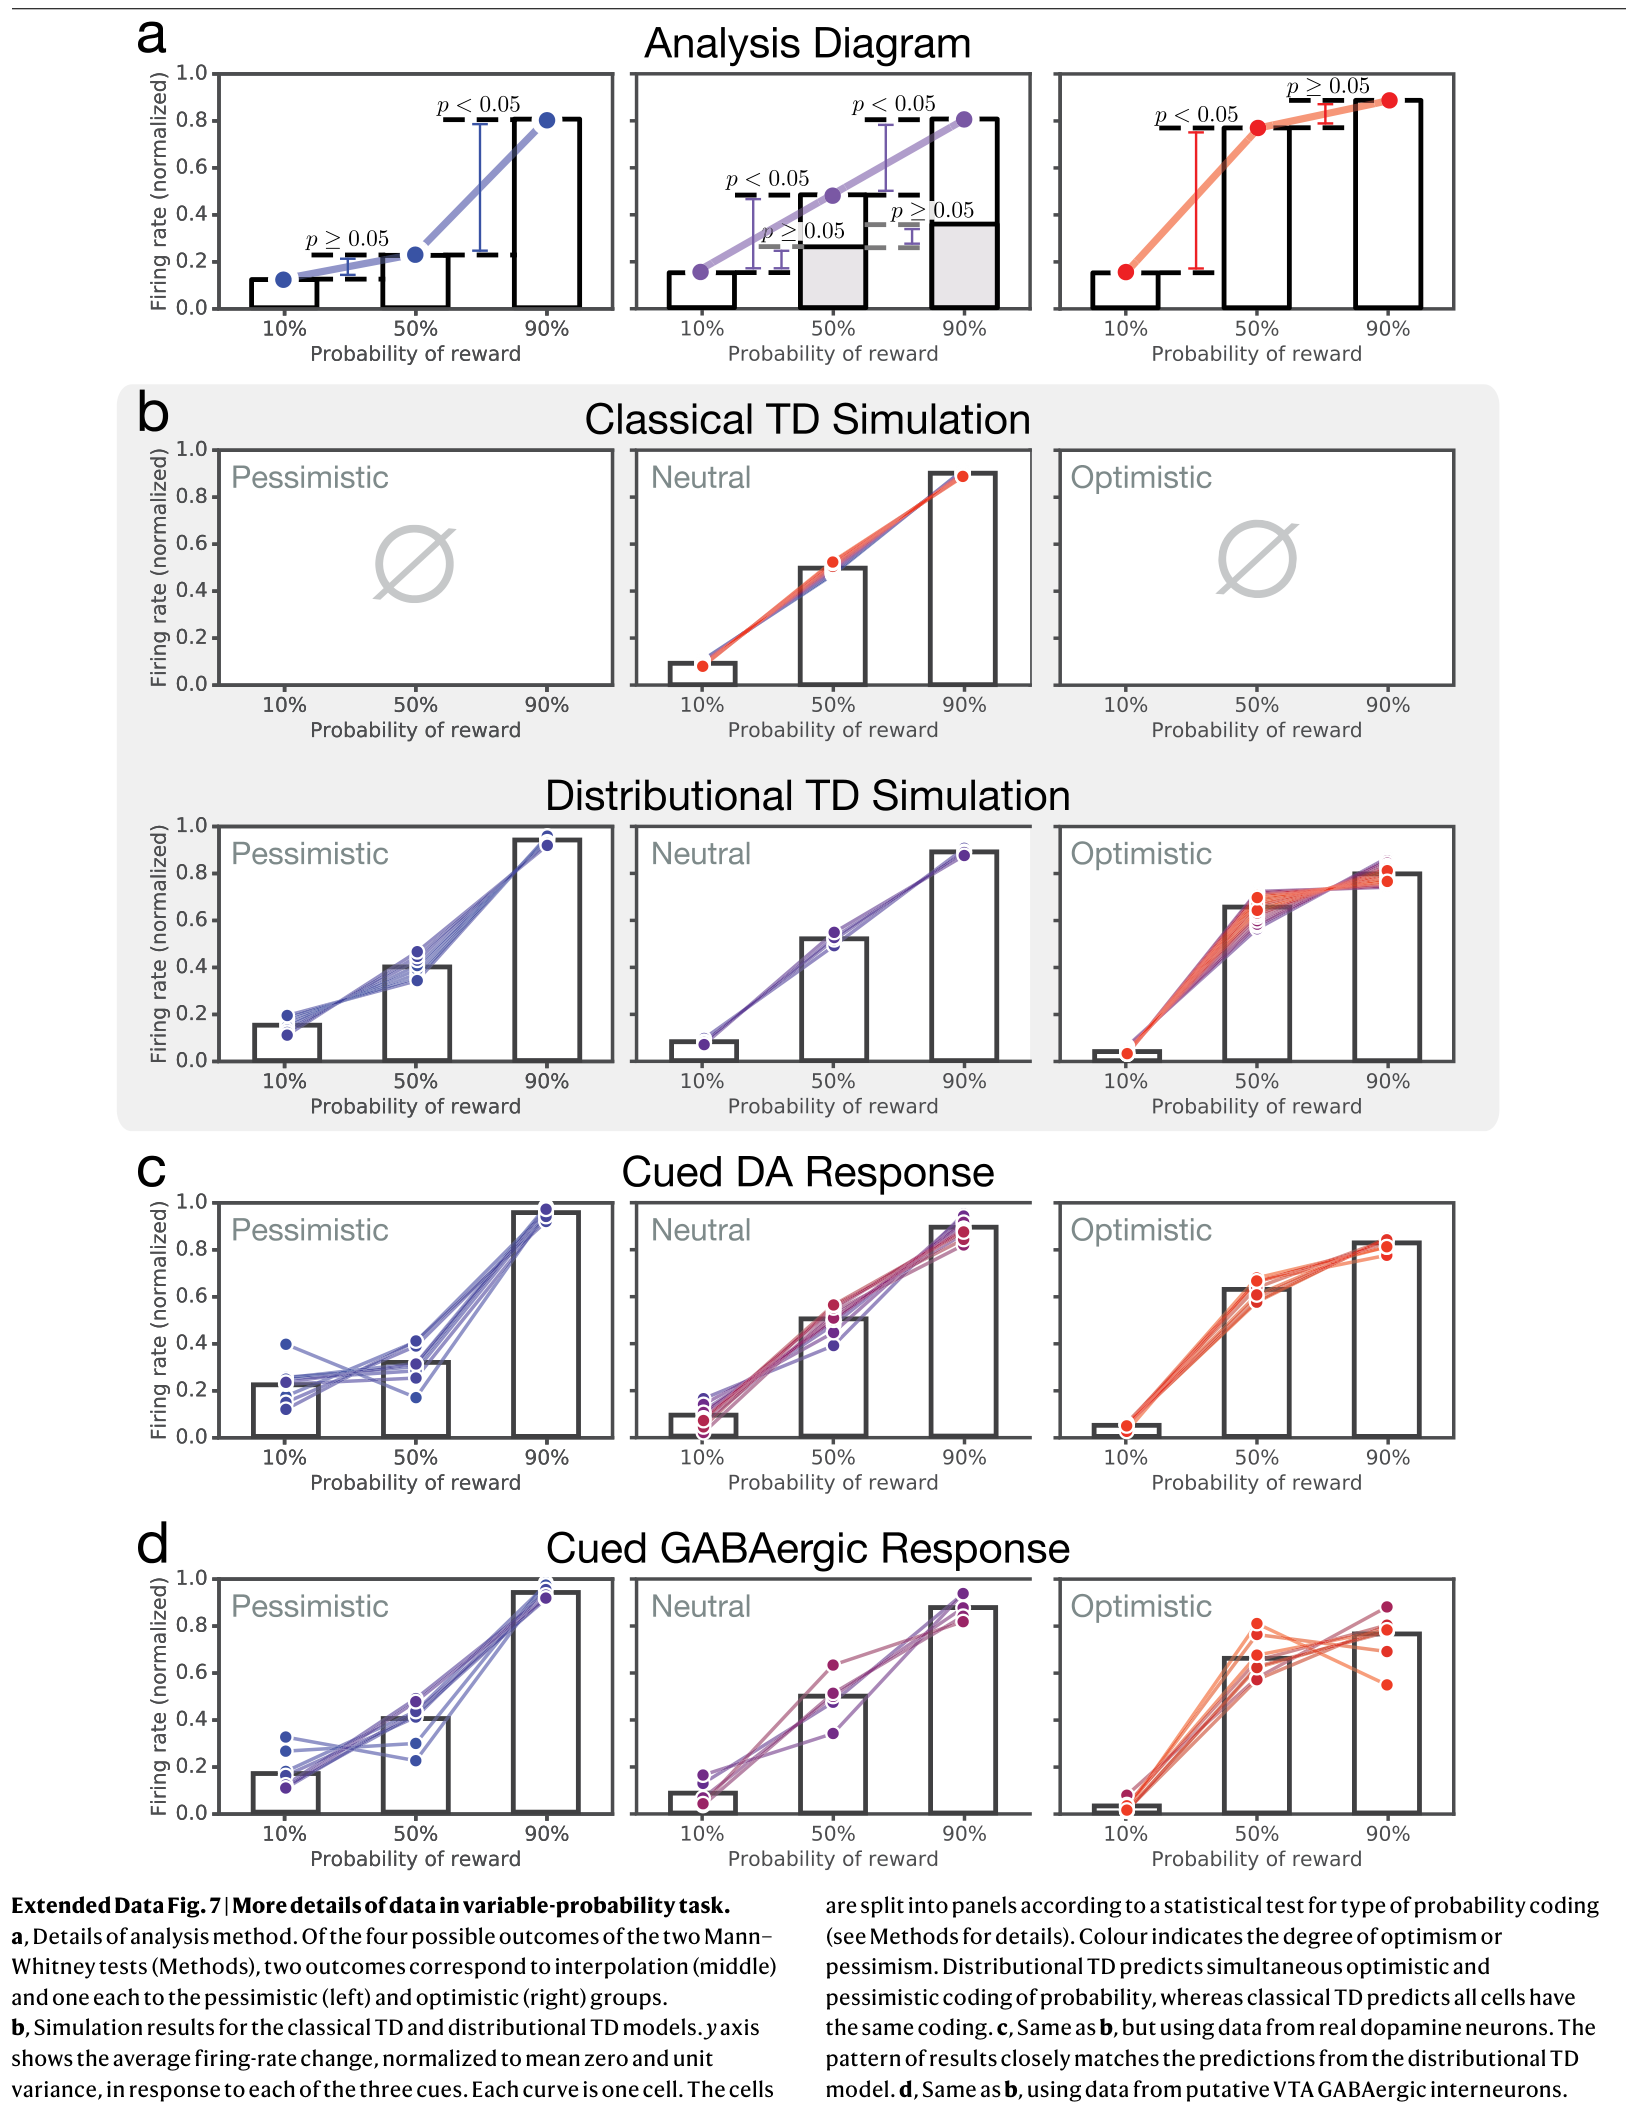
A second task uses cues predicting reward with 10%, 50%, or 90% probability. Of 31 dopamine cells, ten respond relatively optimistically to the 50% cue and nine relatively pessimistically. The variation exceeds that expected from sampling noise and appears within individual animals.
Putative VTA GABAergic neurons also show diverse probability responses, consistent with a range of local value predictions. Licking measurements and simultaneous recordings weaken the alternative that all cells share a common prediction which merely drifts across recording sessions.
Related references: [18], [19].
Asymmetric responses predict learned values
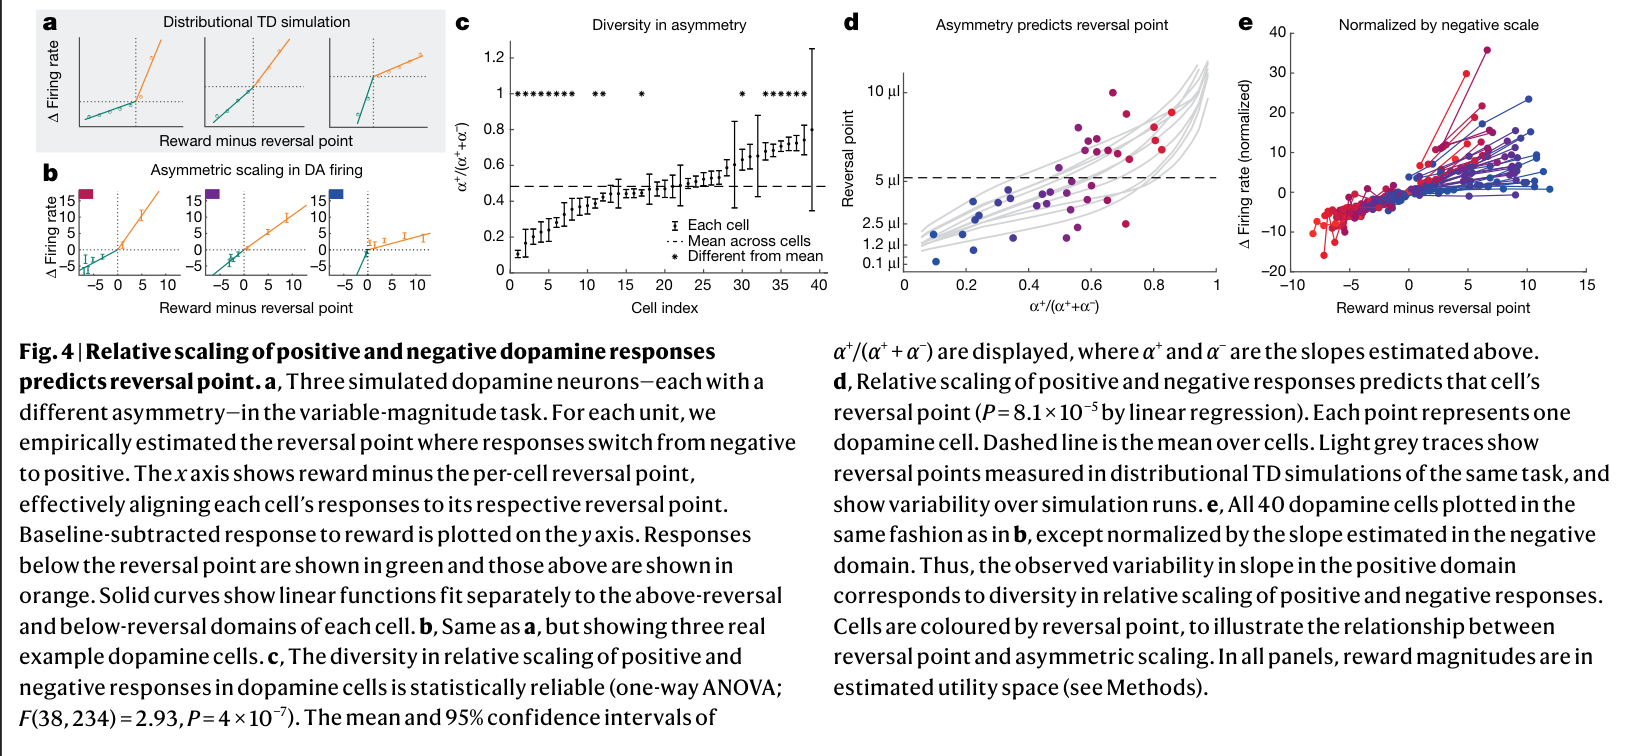
A channel that responds more strongly to positive than negative prediction errors settles on a higher reward prediction; the reverse produces a lower one. The paper tests both parts of this mechanism.
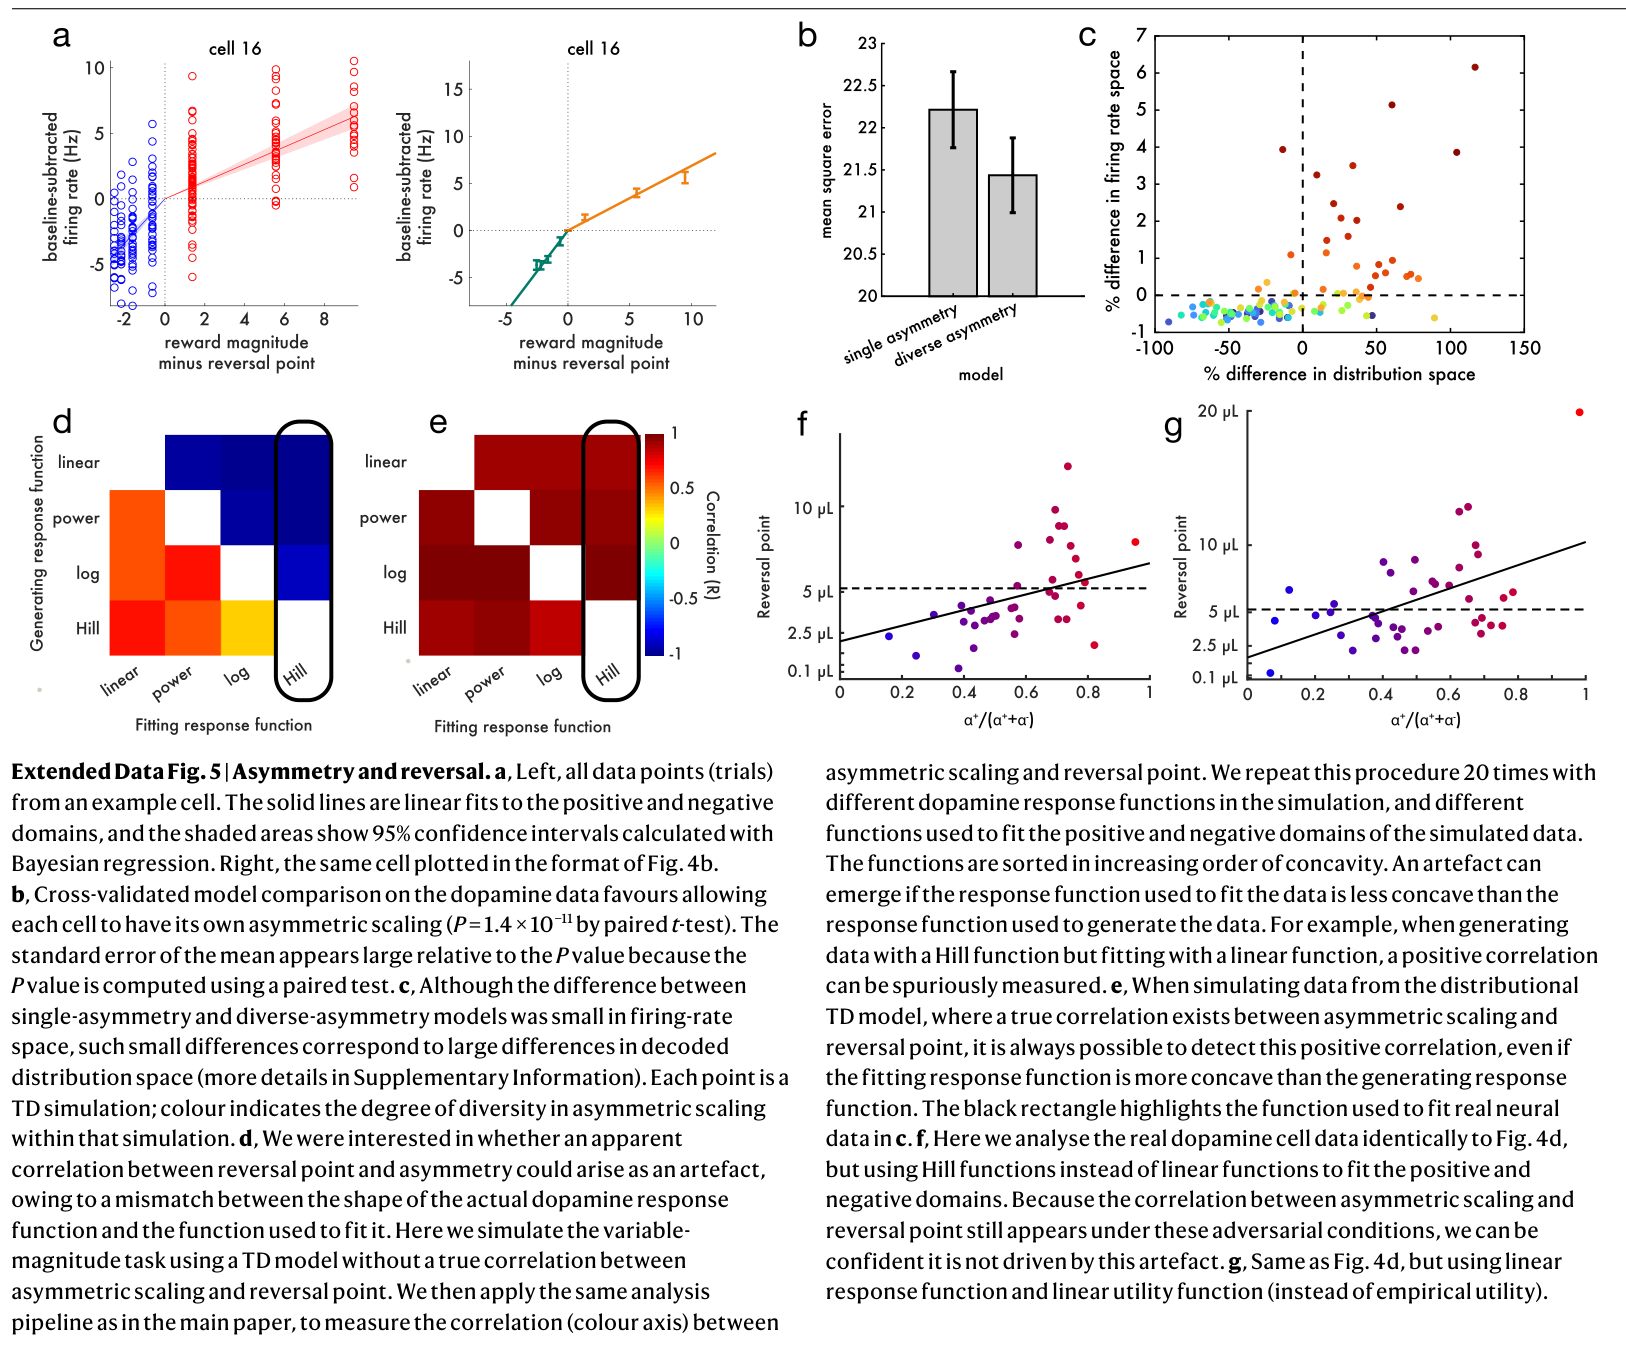
Positive/negative response-slope ratios vary reliably across cells, and those ratios predict reversal points. The correlation remains when slopes and reversal points are estimated from different trial halves, avoiding a shared-data fitting artifact. Analyses using alternative reward-to-utility mappings preserve the qualitative result.
Related references: [6], [20], [30], [38].
Decoding reward distributions
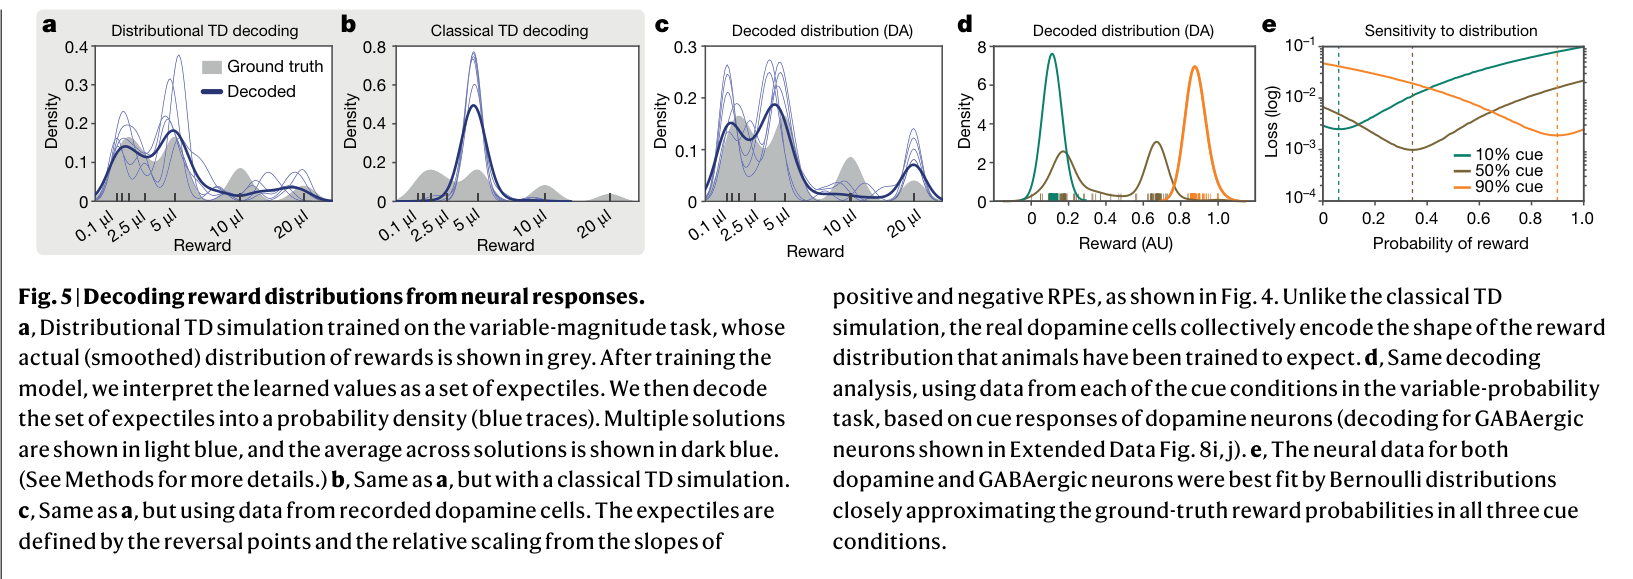
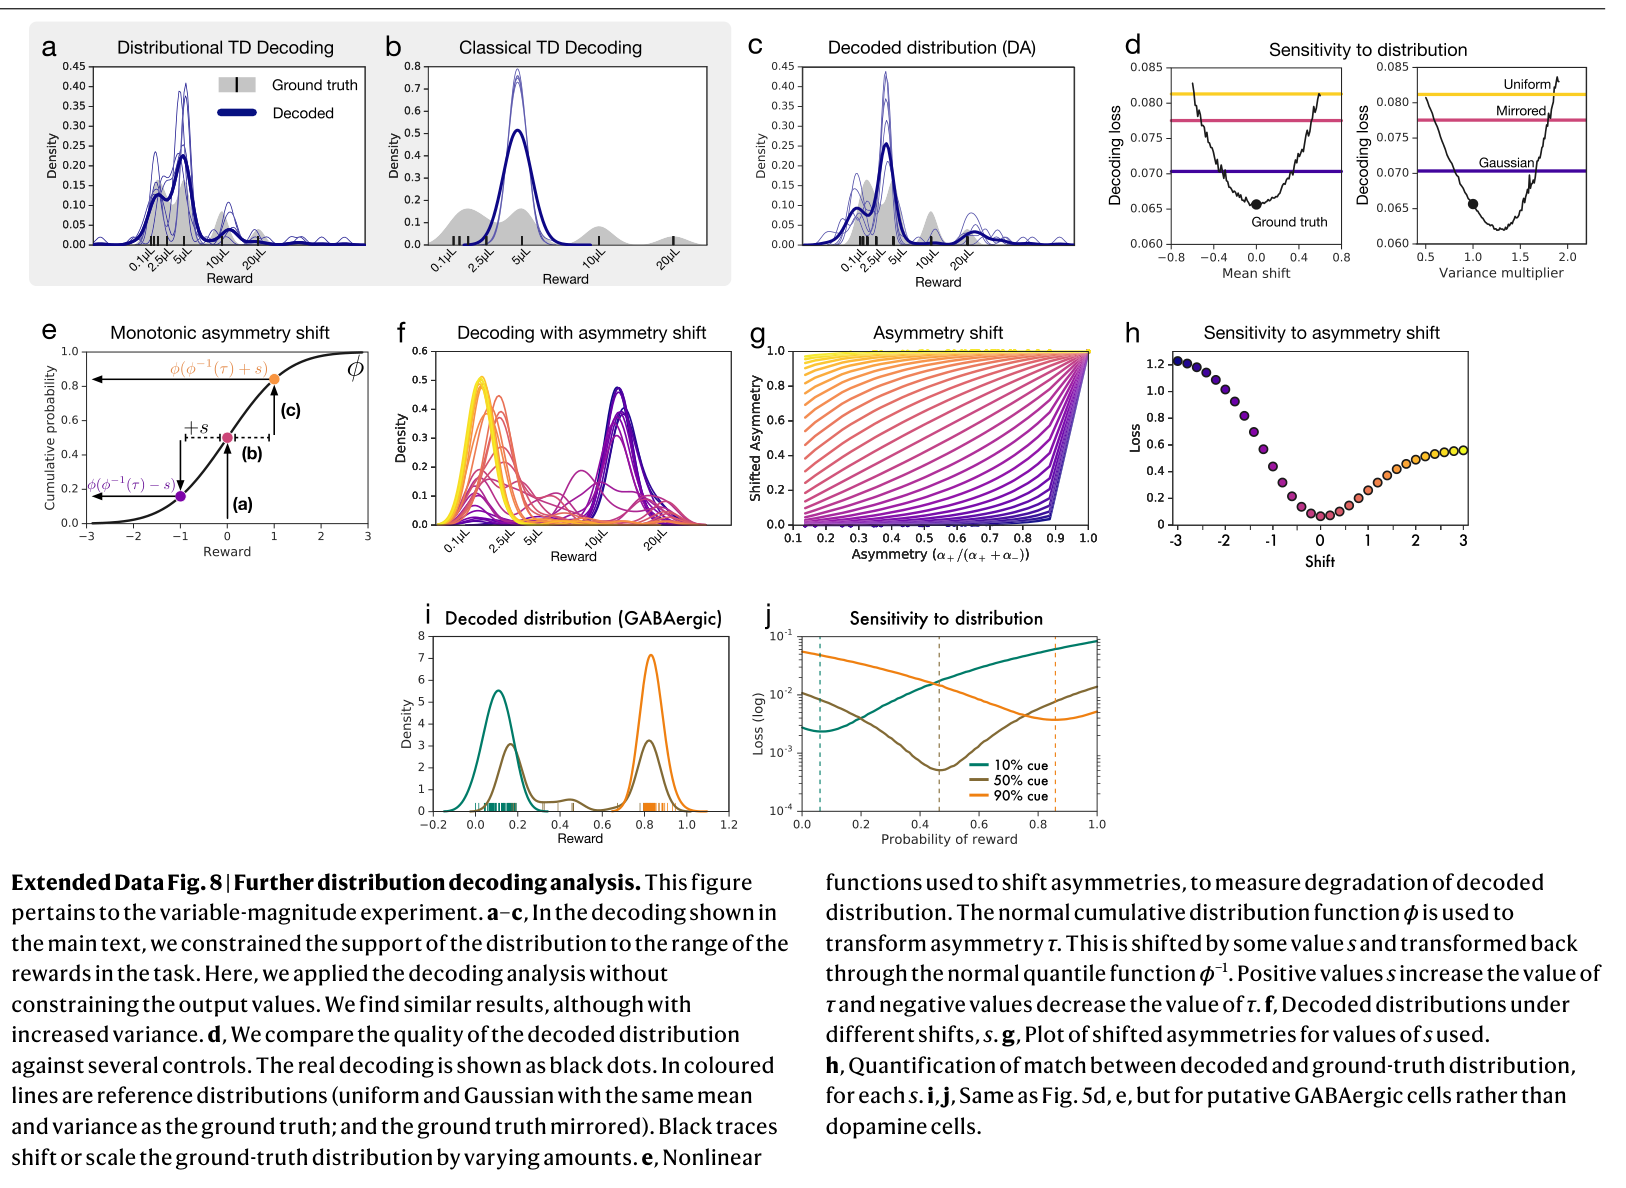
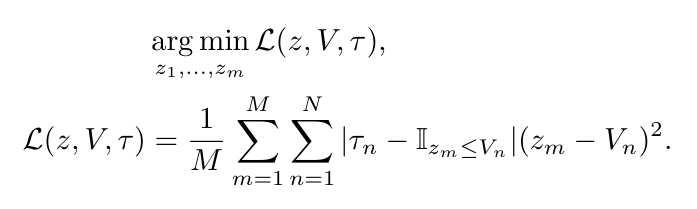
Under approximately linear positive and negative response functions, the learned predictions correspond to expectiles: asymmetric analogues of the mean. Combining each cell’s reversal point with its response asymmetry permits reconstruction of a reward distribution.
Decoded densities recover multiple modes in the magnitude task and relevant structure in the probability task. Distributional model simulations reproduce this pattern; classical mean-value simulations do not. Perturbing or shuffling the measured reversal points and asymmetries degrades reconstruction, showing that arbitrary neural variability alone is insufficient.
Related references: [20], [31], [32], [33].
Interpretation and limits
The results explain some dopamine heterogeneity as structured reward-distribution coding. Averaging across cells can hide this information. However, this is a reanalysis of a limited set of mouse reward tasks, not a demonstration that all dopamine neurons or every brain reward circuit use the same code.
The cellular basis of response asymmetry, the anatomical matching of prediction and error channels, and how downstream circuits use the distribution remain open. Stable optimism across tasks and selective manipulations of optimistic or pessimistic channels are proposed tests. Connections to risk-sensitive behavior, mood, addiction, or depression are hypotheses, not clinical findings.
Related references: [21], [22], [23], [24], [25], [26], [27], [28], [29].
Methods and mathematical model
Optogenetic identification distinguishes dopamine neurons in VTA recordings; putative GABAergic cells are identified from firing patterns. The probability analysis uses 31 dopamine cells from five mice; the magnitude analysis uses 40 cells from five mice. Responses are baseline-corrected, and magnitude responses are measured 200–600 milliseconds after reward delivery to exclude the early feeder response.
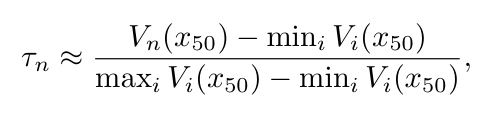
Reversal points maximize agreement between reward size and response sign. Repeated split-half analyses test reliability; separate fits above and below each reversal estimate response asymmetry. One cell without measurable positive responses is omitted from distribution decoding.
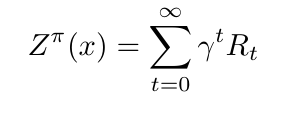
The model maintains multiple value predictions, samples a next-state prediction, and applies channel-specific positive and negative learning rates. Sign-shaped response functions learn quantiles; linear responses learn expectiles. The original model equations are retained below. Simulated task controls, artificial-agent benchmarks, and optimization of distributions from expectiles provide complementary checks.
Related references: [6], [14], [19], [20], [30], [31], [34], [35], [36], [37], [38], [39].
Equations 1–3



Extended data
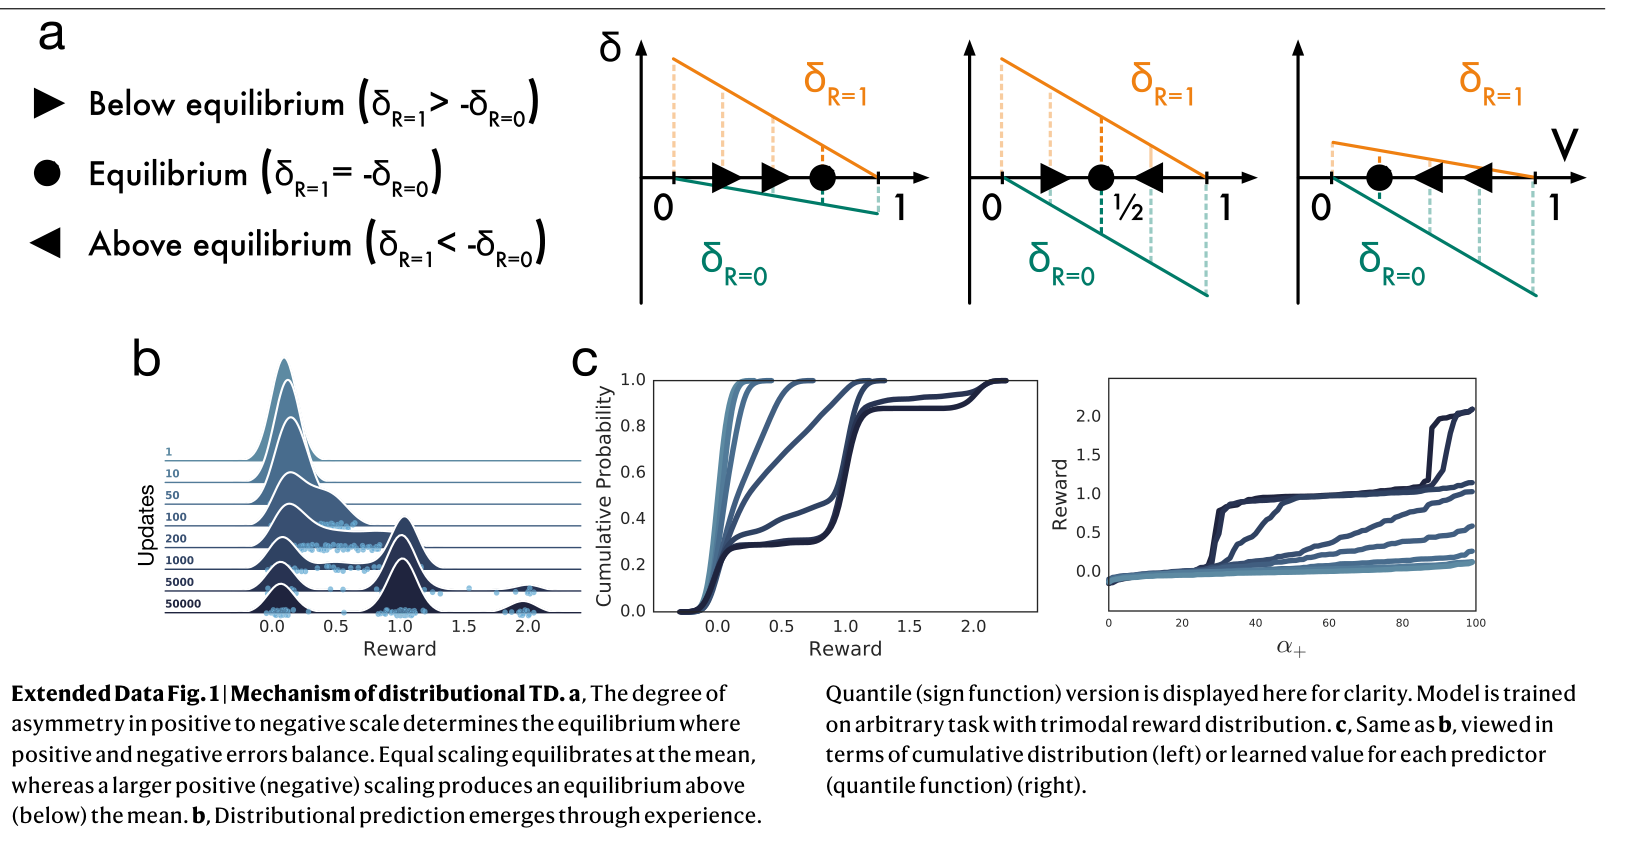
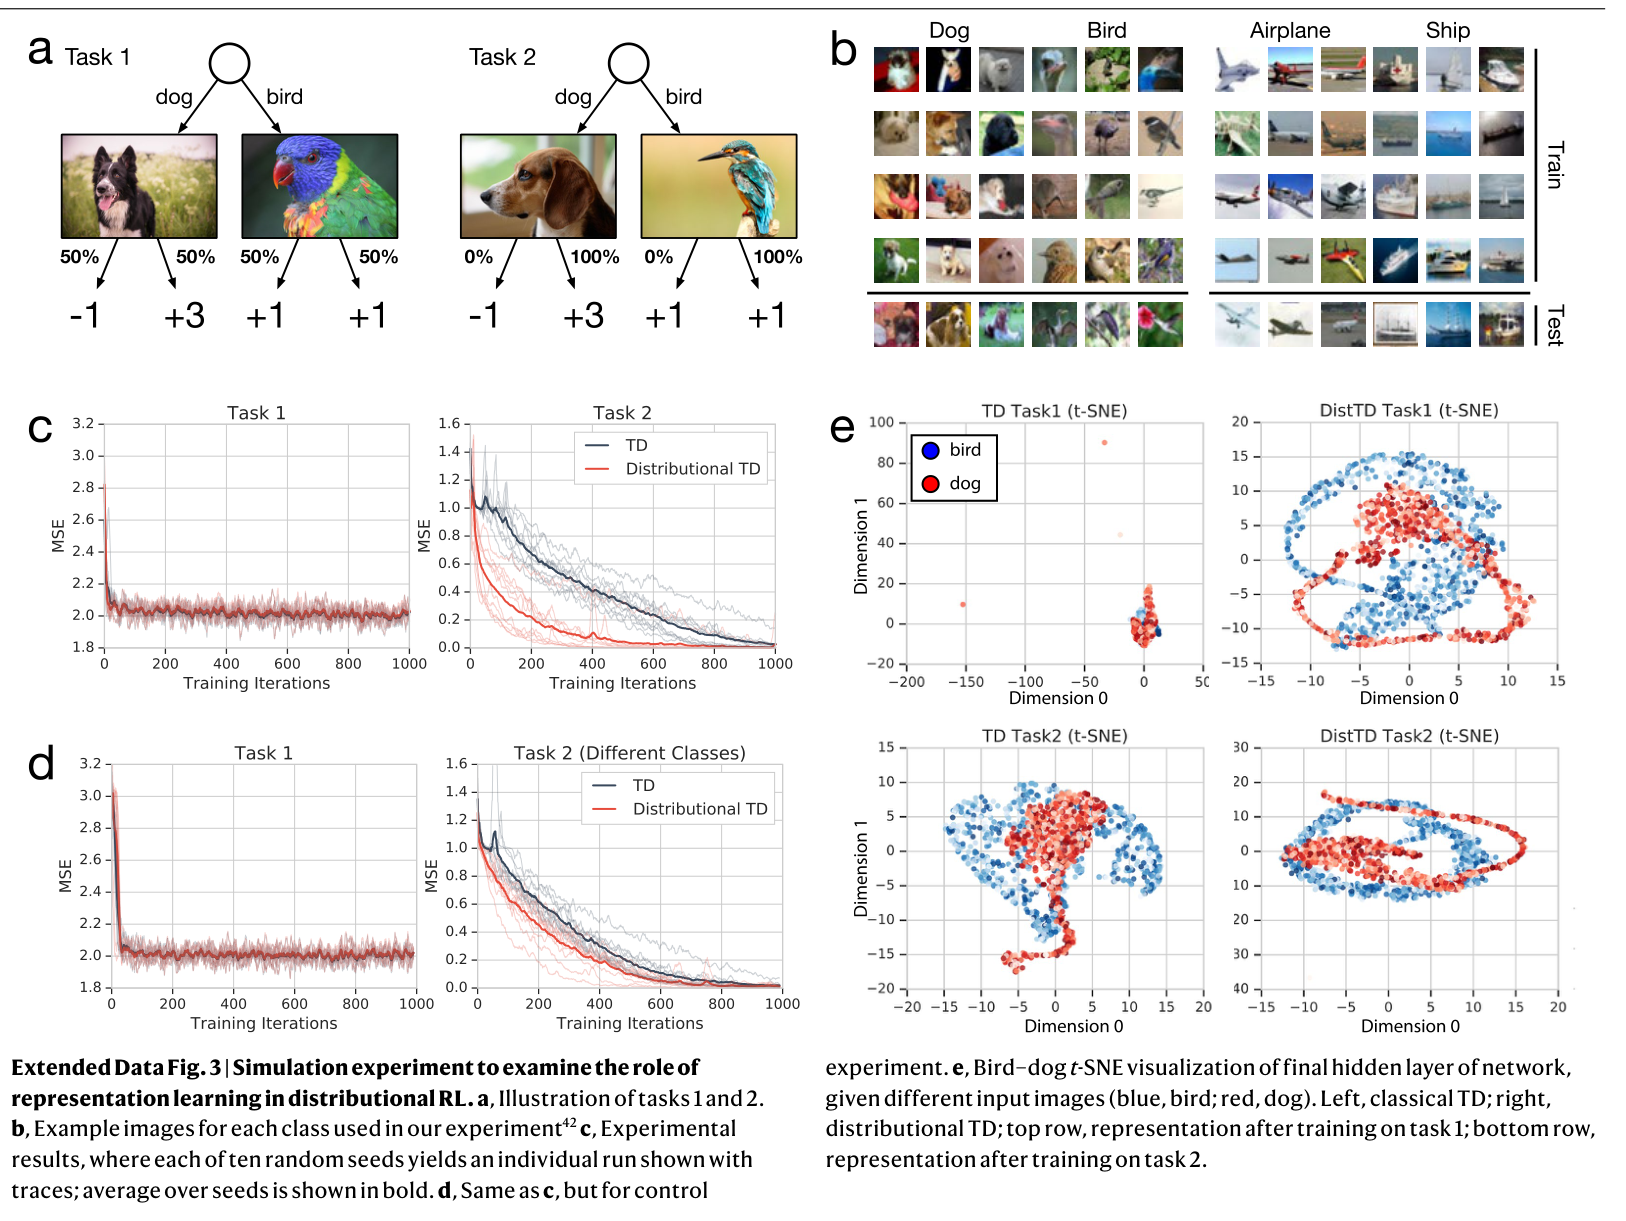
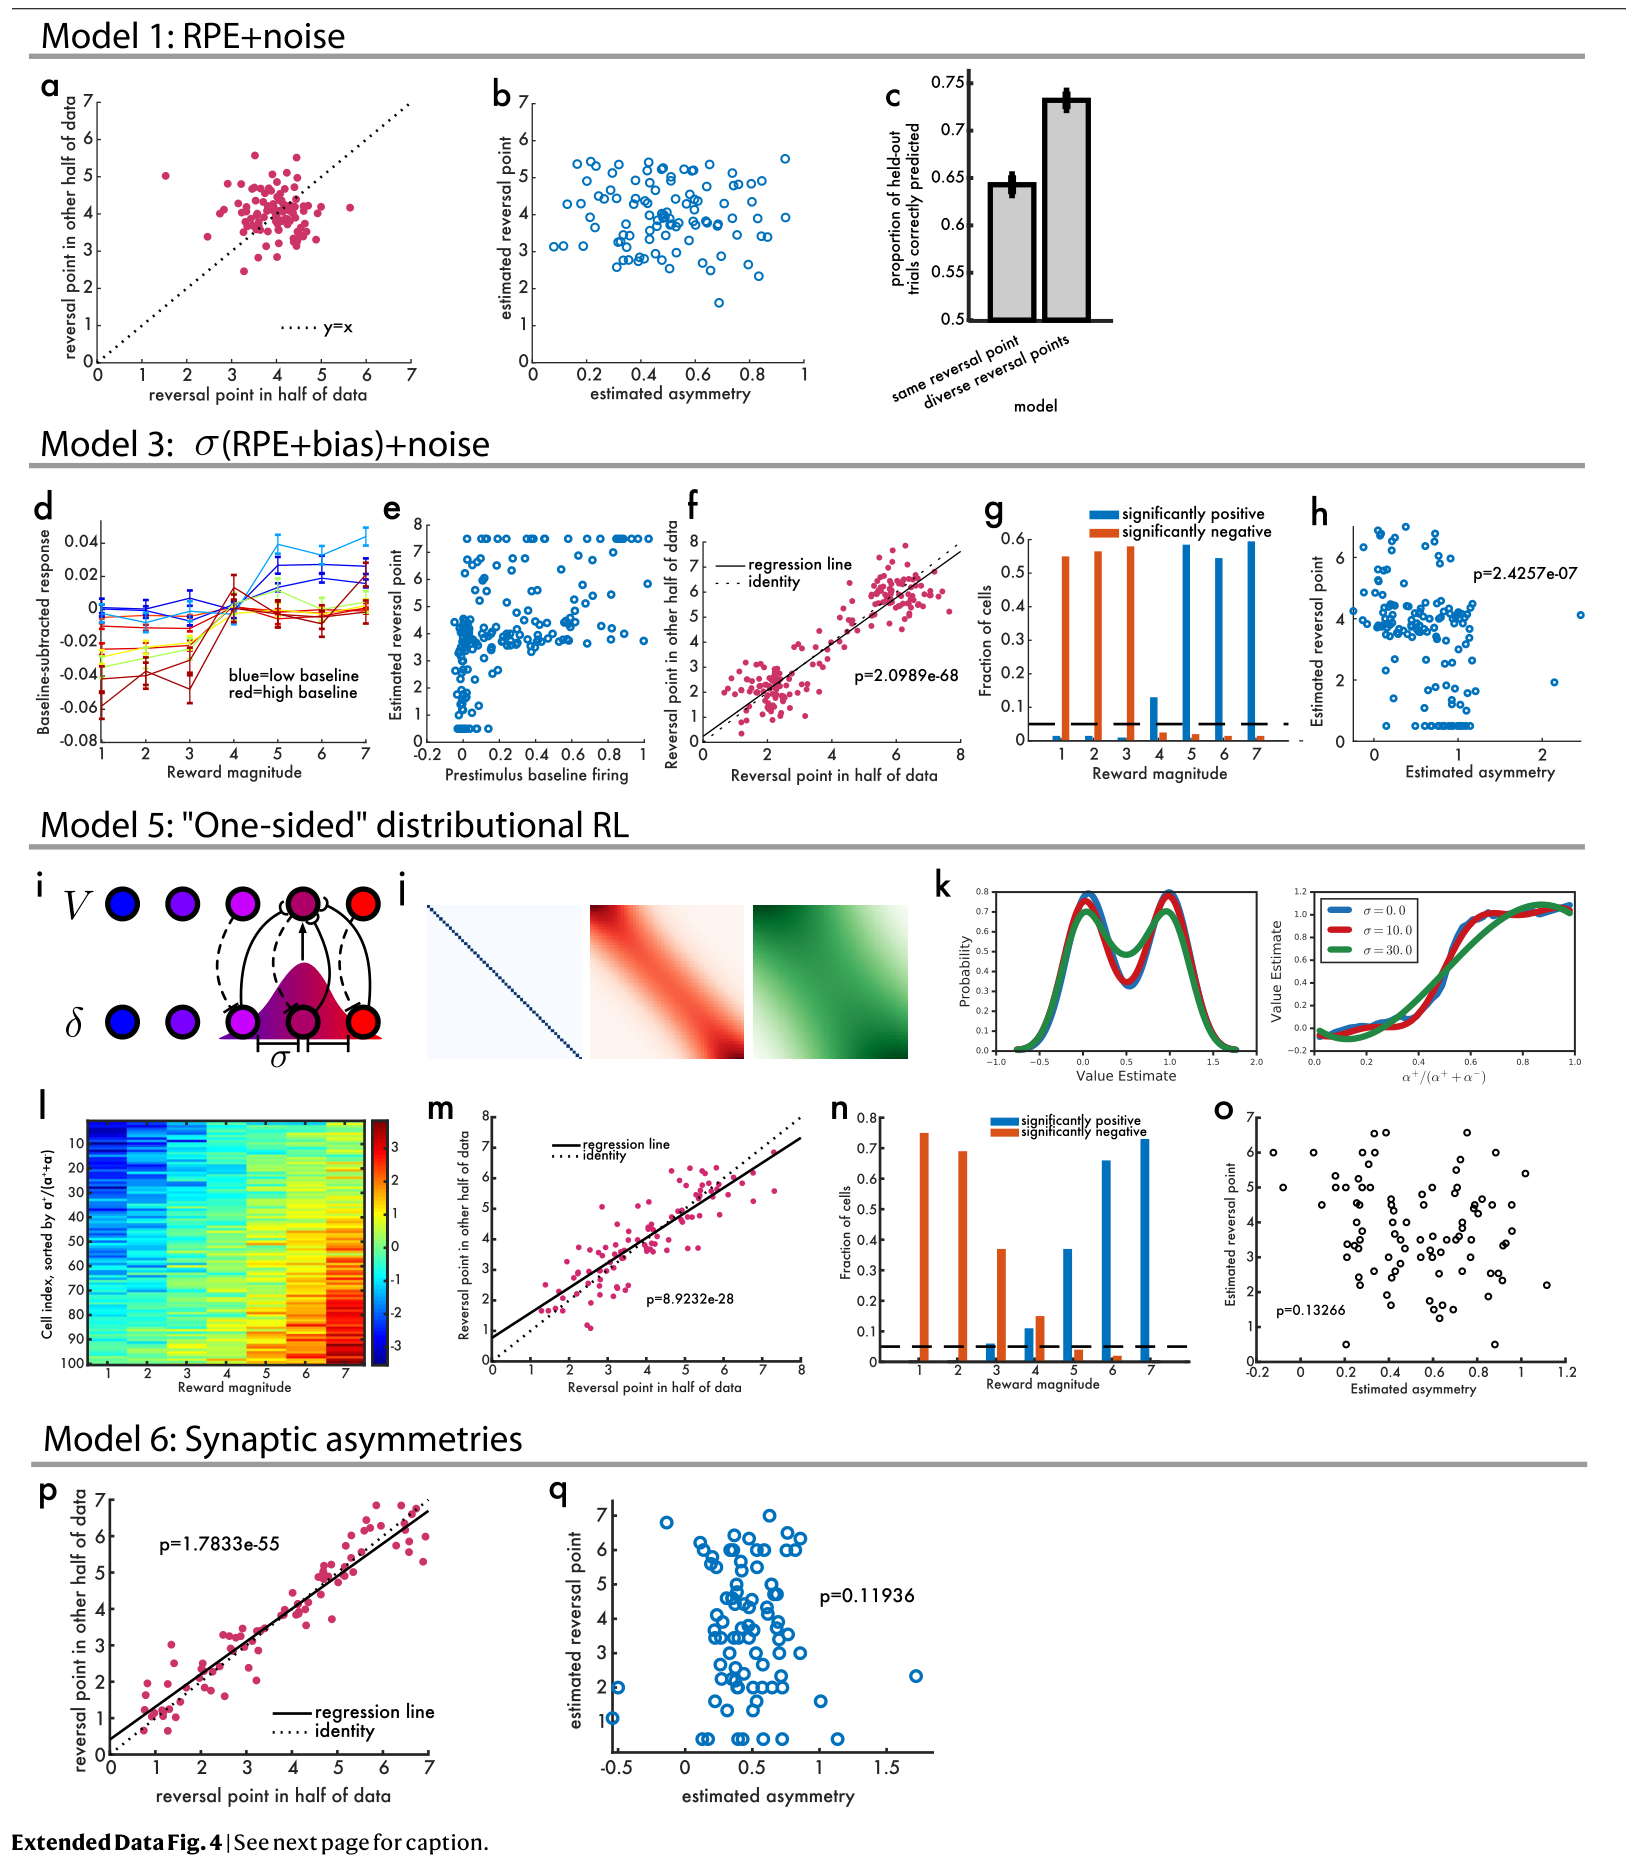
The ten extended-data figures retain the mechanism demonstration, artificial-agent results, representation-learning experiment, alternative models, reliability and decoding checks, and within-animal analyses. Together they test explanations beyond simple population-average reward prediction.
Reporting details
The original reporting tables document sample selection, experimental procedures, and animal-study details. The authors provide neuronal data and analysis code through the Open Science Framework.


Supplement: distributional learning principles
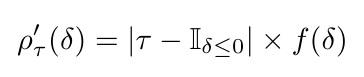
The supplement derives how asymmetric learning rates produce a family of return statistics. With a sign response, the equilibrium is a quantile; with a linear response, it is an expectile. A sufficiently rich family describes the distribution more fully than one mean.
Representation-learning experiments use equal-mean but differently distributed outcomes to explain faster adaptation. Changing the visual classes removes much of the benefit, supporting a representational account. The authors distinguish these learning benefits from choosing risk-sensitive actions: their artificial agents can still select actions by mean return. Original derivations and analysis equations are preserved in the dropdowns.
Related references: [5], [6], [20].
Equations S1–S17











Supplement: alternatives, robustness, and predictions
The authors compare seven alternatives, including noise, stable biases, nonlinear response transformations, reward-time biases, partially distributional architectures, synaptic asymmetries, and graded coupling between value and error channels. Some explain individual observations, but do not jointly reproduce all the reported patterns; the study does not rule out every possible alternative circuit.
Robustness checks vary utility mappings and response functions, assess negative-response floors, separate data used for slope and reversal estimation, and perturb decoding inputs. Additional analyses examine simultaneously recorded cells, cue/outcome relationships, baseline firing, and licking.
Future predictions include stable relative optimism across tasks, asymmetric rates of revaluation, distribution-sensitive blocking, and selective effects of manipulating different error channels. The supplement’s 38 bibliography entries are retained after the main article’s references.