Overview
This edition covers all 37 pages of v2, including complete Appendices A–F, seventeen figures, sixteen numbered tables and every evaluation-prompt component. Sirui Chen and Huang Huang contributed equally. The benchmark is entirely simulated; oracle target annotations, predicted targets and language-only policies are distinct experimental settings.
At a glance
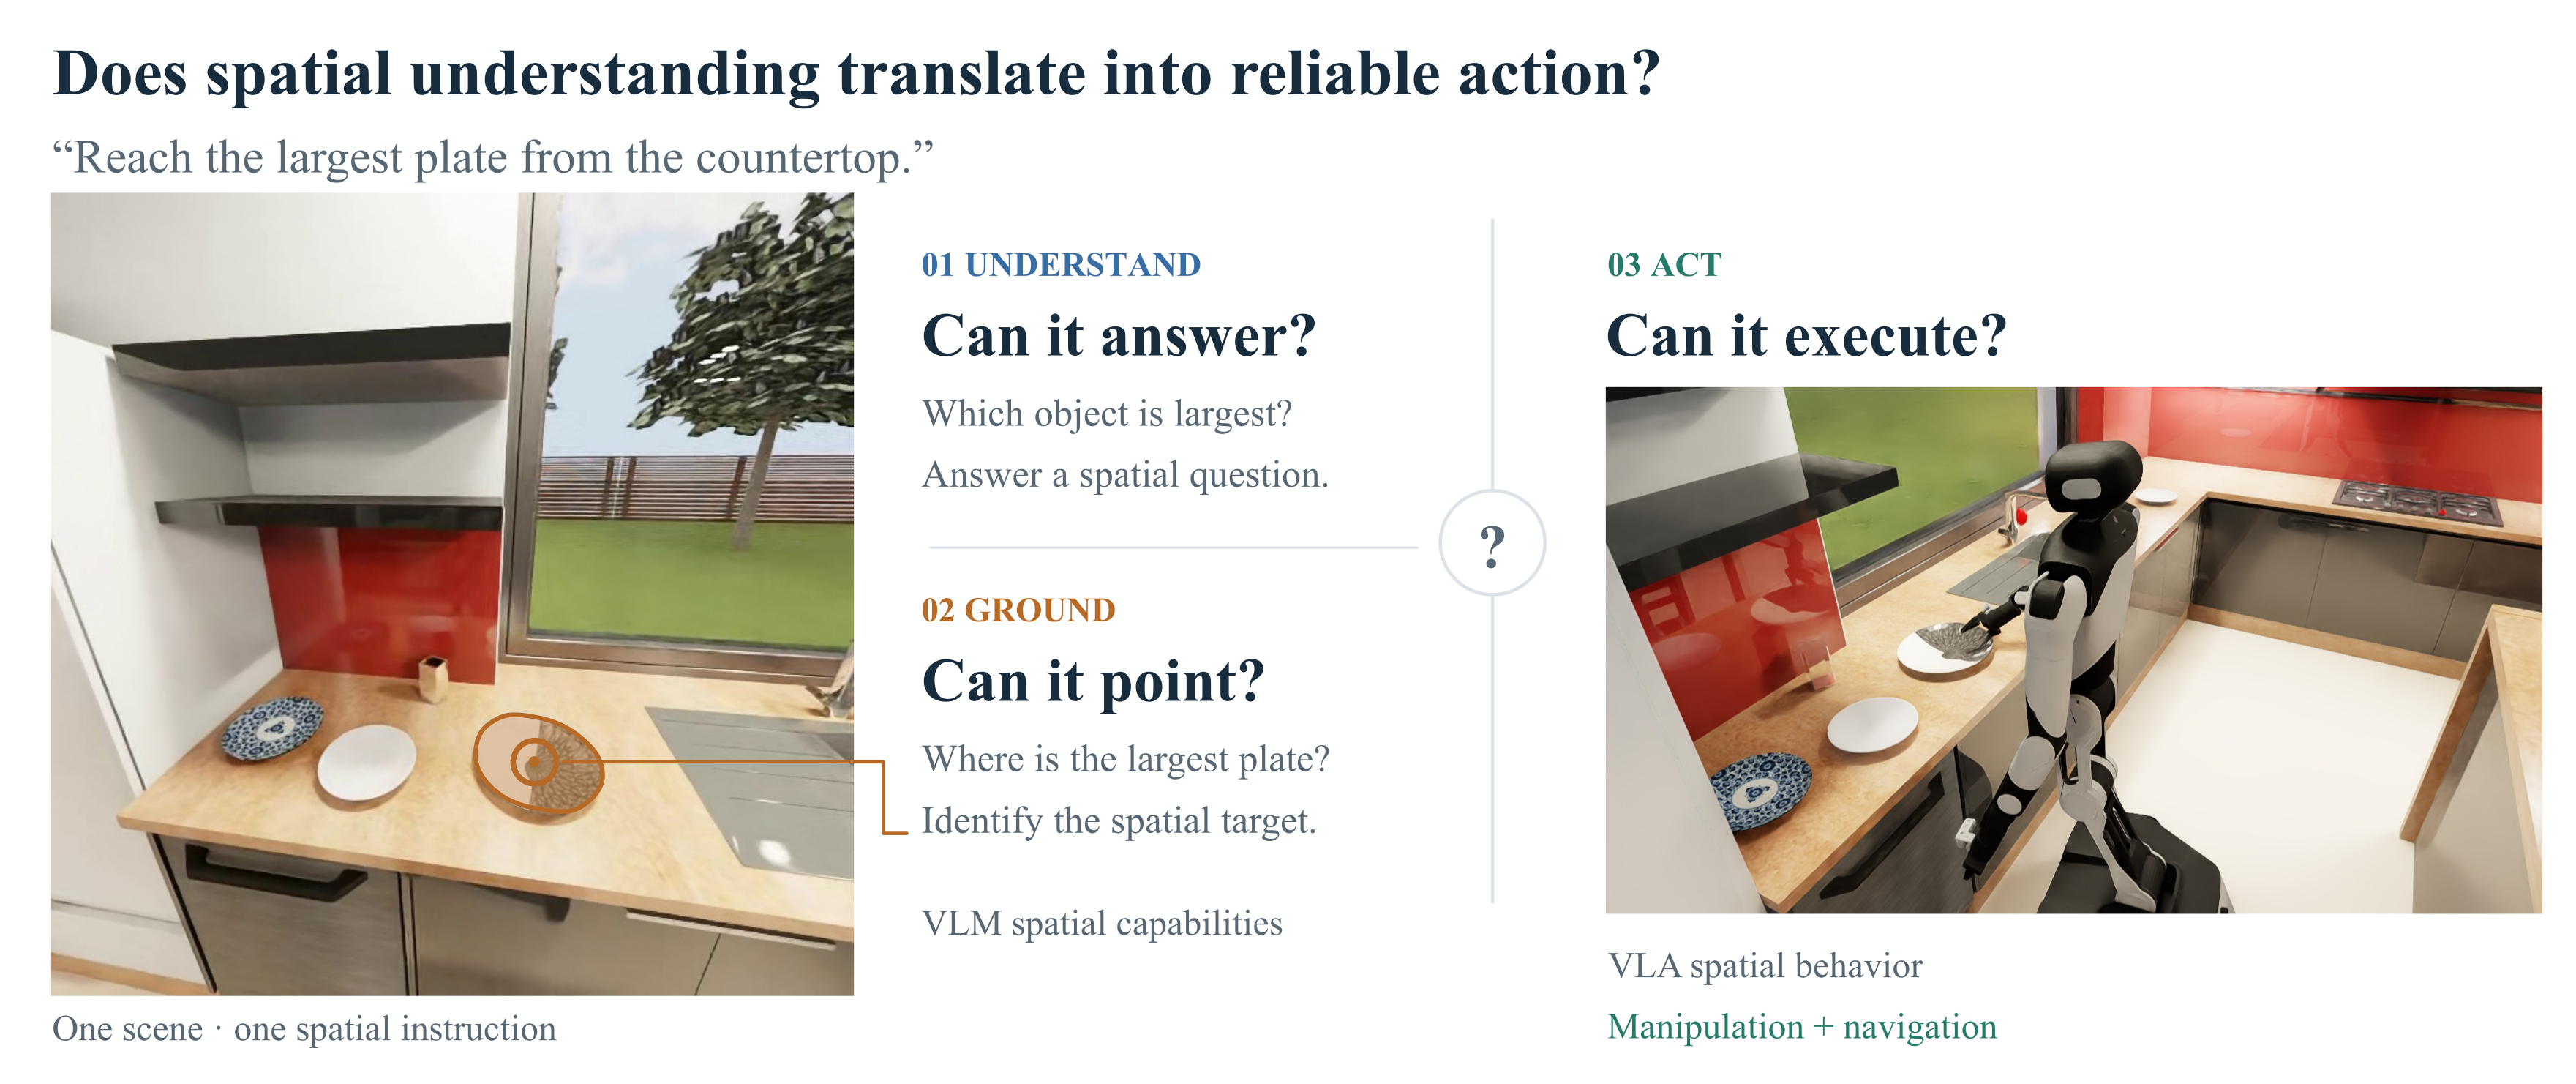
BEHAVIOR-Spatial aligns spatial question answering, target pointing and robot behavior. Its 3,256 questions, 1,240 grounding queries, fourteen manipulation tasks and ten navigation tasks expose a gap between success in new configurations and following changed instructions in familiar layouts. Baseline soft success is 41.6% held-out versus 16.1% on the instruction probe; oracle dots raise these to 60.3% and 38.0%. Soft success includes partial progress and must be distinguished from completed-task success. Perception/action correlations depend on the policy and do not establish a causal transfer mechanism.
1 Introduction
A robot may complete a practiced task without following its spatial instruction, or identify the target correctly yet fail to act. Aligned question, pointing and execution suites diagnose these alternatives. The instruction probe fixes a training layout but requests a different target; held-out evaluation changes both scene and instruction. Neither one alone isolates every aspect of grounding. Oracle visual marks supply the answer rather than demonstrating learned language grounding.
2 Related Work
Prior VQA/pointing benchmarks assess perception separately, while action benchmarks often report only completion. This benchmark links task contexts and adds instruction swaps plus target-commitment and partial-progress measures. Intermediate representations serve as interventions supplying target information, with predicted-point rollouts testing a less privileged interface.
3 The Behavior-Spatial Benchmark
Three suites share spatial task contexts while retaining their own sample-validity rules. The correspondence is primarily at task level, not a guarantee that each question, pointing query and rollout uses identical visual evidence.
3.1 Design Overview
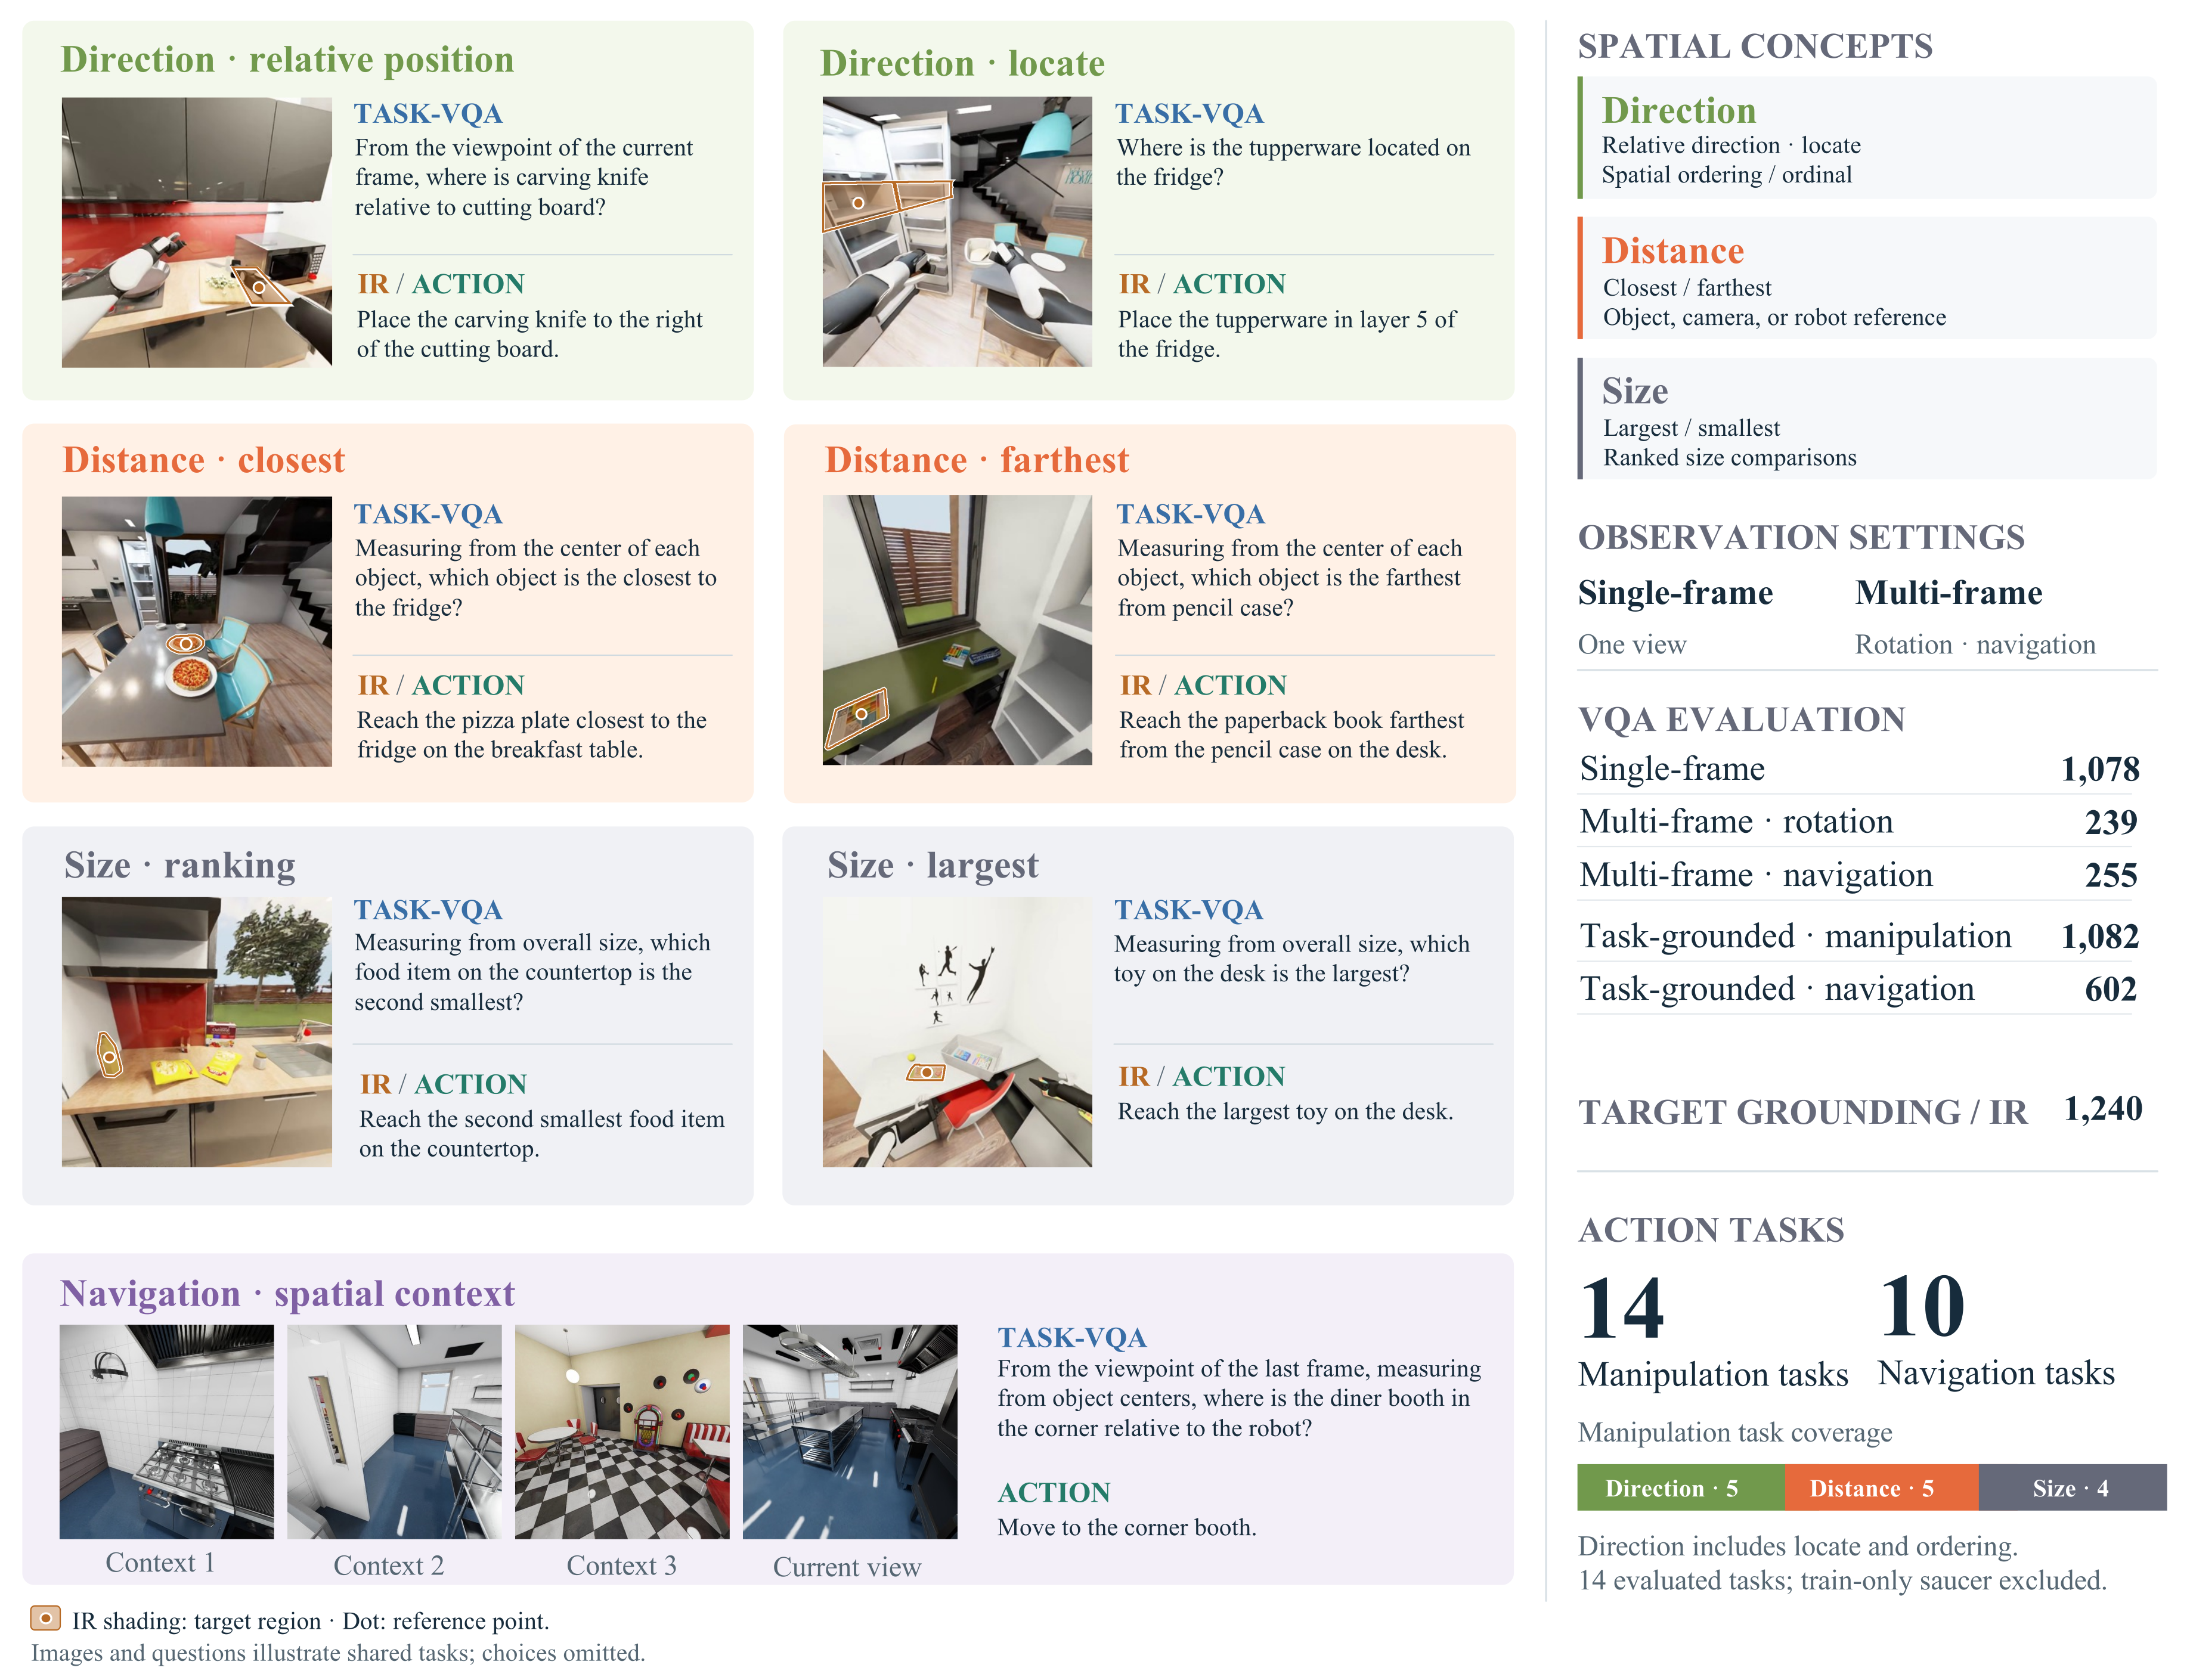
General VQA covers single- and multi-view geometry; task-grounded VQA refers to robot-relevant objects and relations. IR asks for a point in the instructed object or goal region. Action measures manipulation and navigation, distinguishing identification from execution.
3.2 Spatial Taxonomy
Direction includes object/robot-relative relations, container-region location and spatial ordinal rank. Distance compares physical separation; size compares physical extent rather than apparent image area. Rotation and navigation observations require different multi-view reasoning.
3.3 Dataset Construction
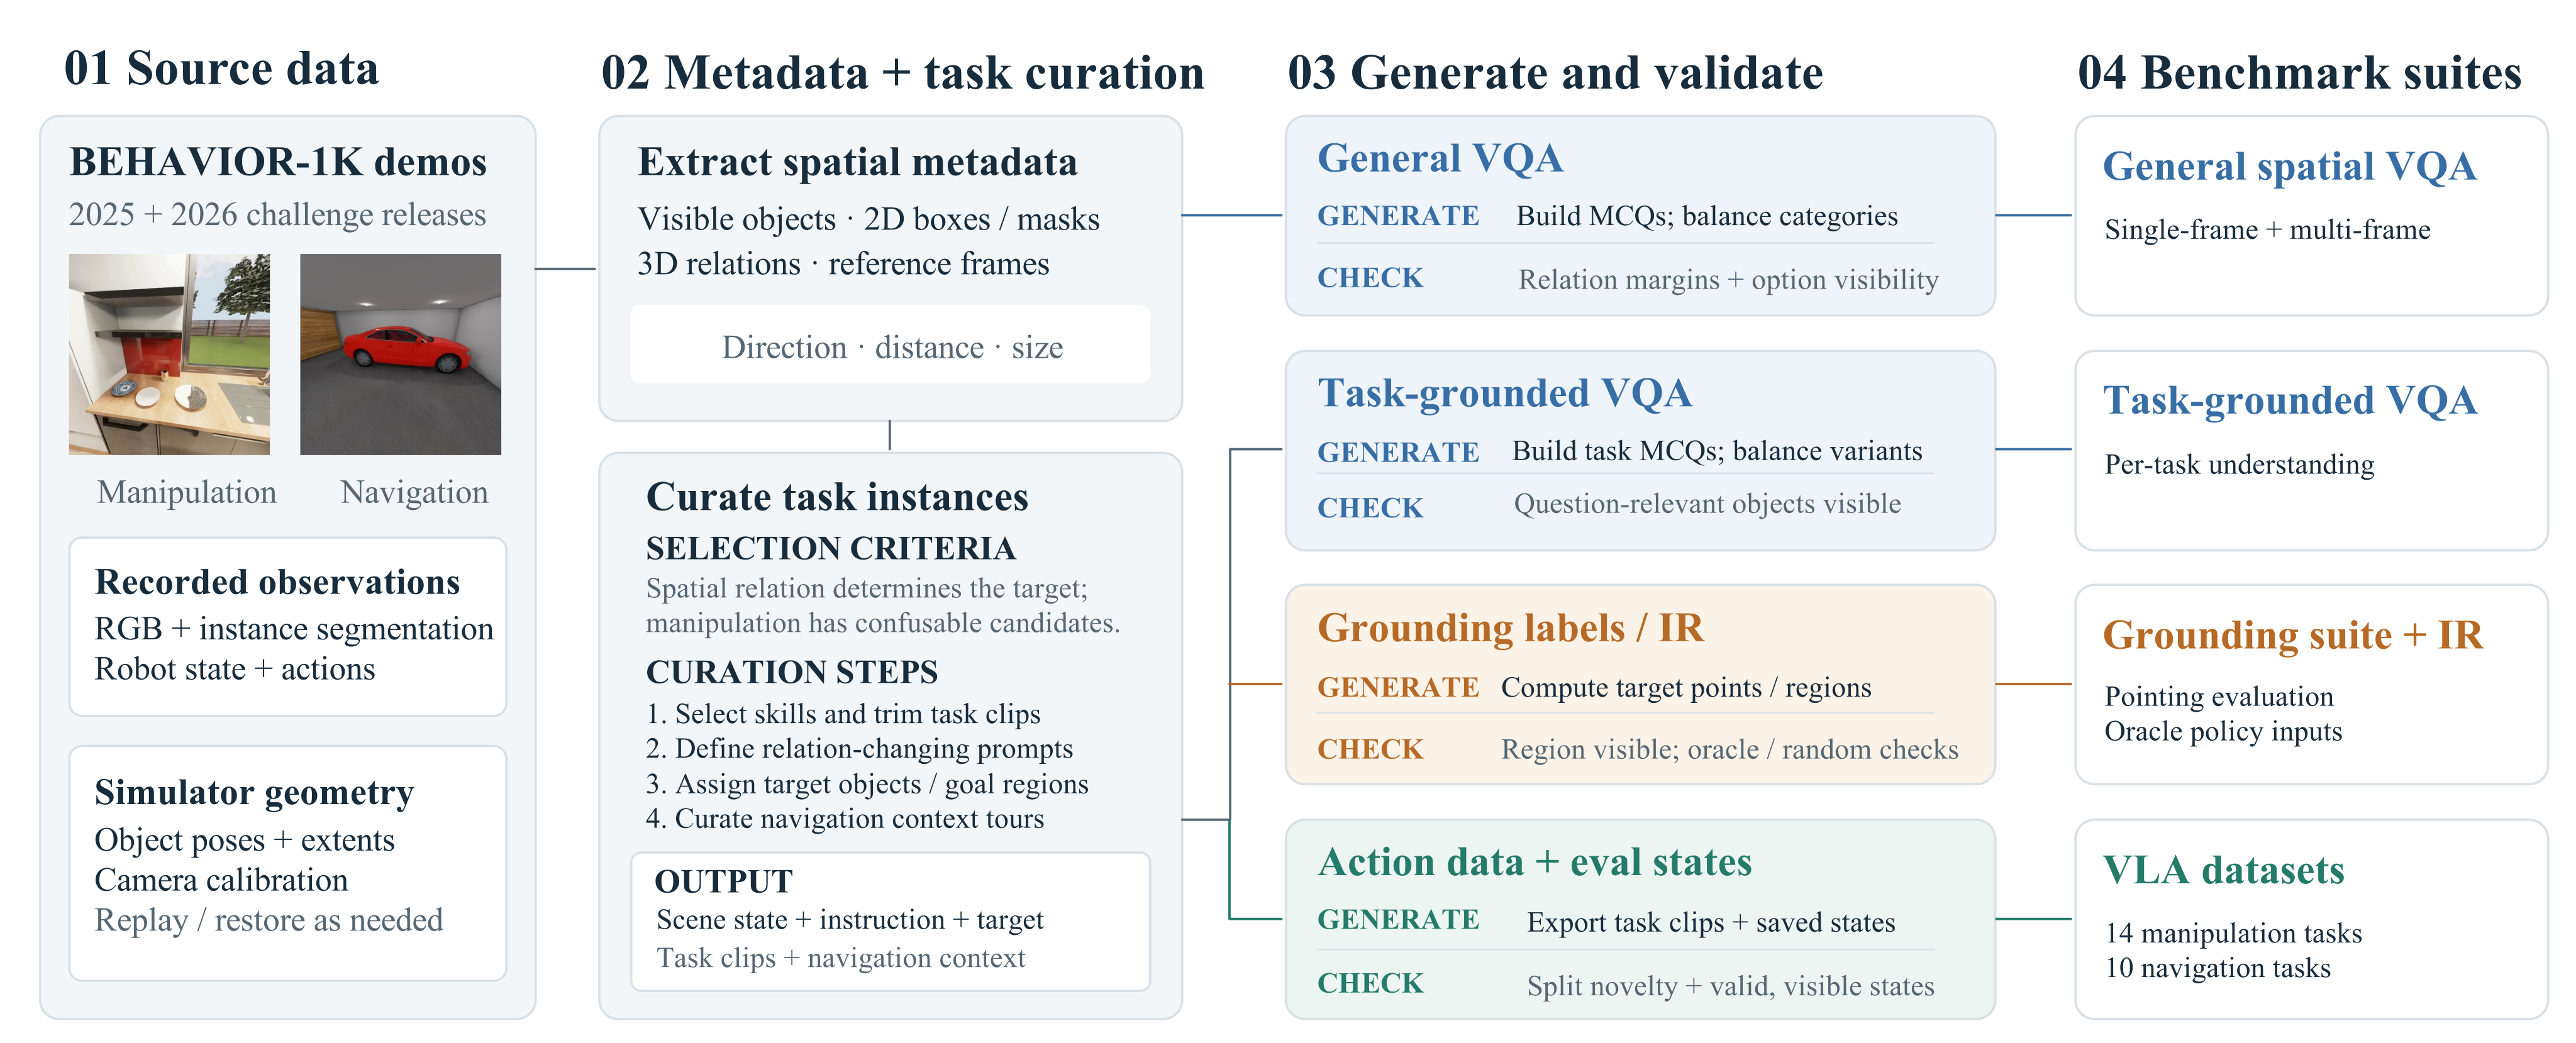
BEHAVIOR-1K demonstrations, recovered simulator geometry and camera metadata generate labels. General VQA has 1,078 single-frame and 494 multi-frame questions across 49 activities; task VQA adds 1,082 manipulation and 602 navigation questions. Fourteen manipulation tasks and ten navigation tasks across five scenes share this context, while 1,240 pointing queries additionally require a visible answer region. Visibility/margin filtering reduces ambiguity without proving every label can be recovered visually.
4 VLA Model
The evaluated action architecture pairs a frozen visual/language backbone with a trained action expert. Manipulation and navigation use task-specific policies and observations; the code-agent comparison has a separate perception/control stack and computation protocol.
4.1 Model Architecture
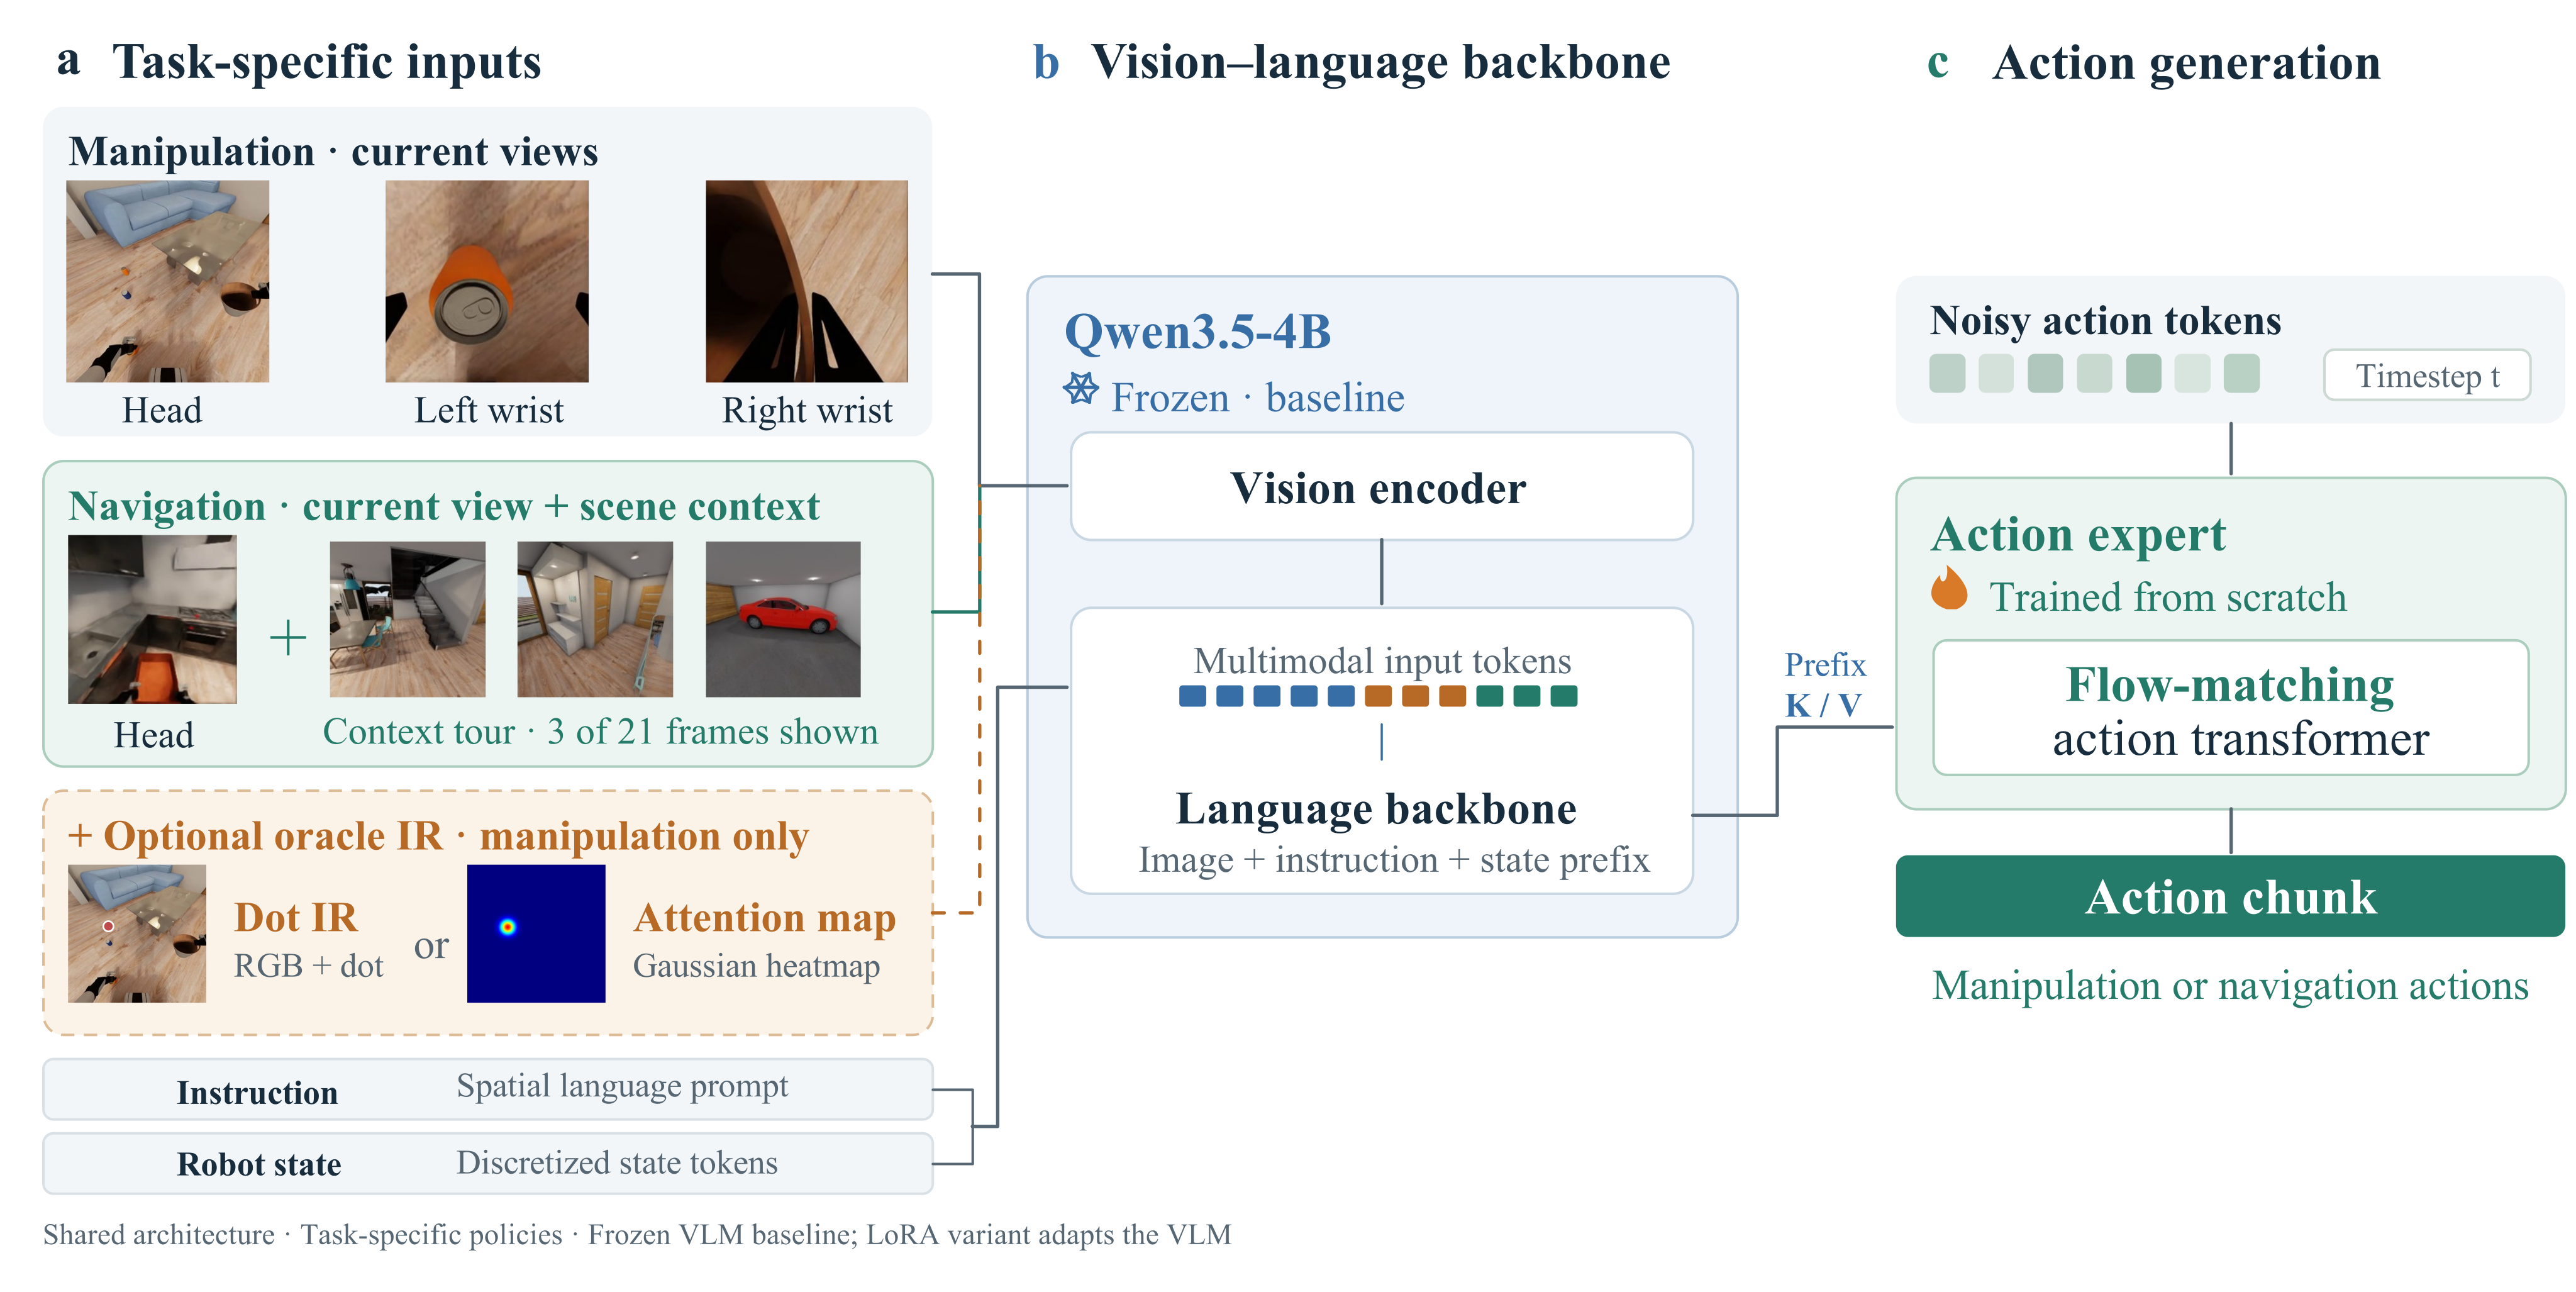
A Qwen3.5-4B backbone replaces π0.5’s VLM and receives images, instruction and discretized state. A flow-matching expert predicts 32-step, 23-dimensional chunks for torso, both arms/grippers and base. The baseline freezes the backbone and trains the 0.30B expert/projections. Manipulation sees head plus two wrists; navigation sees head plus a variable-length curated context tour. Oracle manipulation variants add a visual input slot.
Original mathematical definition and protocol
BEHAVIOR-Spatial-VLA builds on the architecture (Intelligence et al., 2025), replacing its VLM backbone with Qwen3.5-4B (Team, 2026). The VLM encodes visual observations and the language instruction, with discretized robot proprioception included in the text prefix. A flow-matching action expert attends to the resulting prefix features and predicts 32-step chunks of 23-dimensional actions controlling the torso, dual arms, grippers, and mobile base. Unless otherwise stated, the VLM is frozen and the action expert is trained from scratch.
4.2 Policy Variants
Six manipulation variants compare frozen baseline, LoRA adaptation, DROID initialization, oracle dot, dot plus first-frame anchor and standalone Gaussian heatmap. Dot versus heatmap changes background/context as well as spatial spread, so it is not a one-factor bandwidth experiment. DROID transfer initializes expert/projection weights, while the backbone remains frozen. Navigation uses one joint ten-task frozen-backbone policy.
4.3 Policy Evaluation Protocol
All policies share 469 held-out and 700 prompt-probe manipulation instances. Held-out cases pair unseen demonstration configurations with reversed/unseen instruction variants; probe cases reuse training layouts and change targets. These are different distributions, so their aggregate difference is diagnostic rather than a paired causal estimate of language reliance. Per-task timeouts depend on demonstration horizons. Main IR results use simulator-derived target information at both training and inference; navigation starts are separately spawn-validated.
Original mathematical definition and protocol
The held-out set () uses scene configurations from unseen demonstrations, paired with unseen instruction variants that reverse the spatial relation used during training. This setting tests generalization under changes to both scene configuration and instruction. The prompt-probe set () retains scene configurations used during training but changes the instruction to specify a different valid target. This setting tests whether policies follow the instruction when it conflicts with the demonstrated target.
4.4 Code-as-policy agents
A writer develops one Python control program per task over ten training episodes, receives simulator outcome feedback, validates once, then freezes a selected version for all test episodes. Programs use RGB-D, motion primitives, Molmo2-8B pointing and GPT-5 visual queries; they receive no privileged simulator identities/poses/segmentation. Open-weight writer results therefore do not imply a completely open-weight perception stack. Development feedback and validation are additional supervision distinct from test execution.
5 Experiments and Results
Experiments report perceptual accuracy, target-directed progress, completed tasks and wrong-target commitments separately. The preserved tables retain full task values, protocols and denominators rather than reducing all settings to a single success score.
5.1 Metrics
VQA uses four options and scores unparsable answers incorrect. Task-grounded manipulation VQA/IR average tasks equally, whereas action pooled rates weight episodes. Soft success includes strict completion plus specified noncommitted target-consistent progress; wrong-target commitments are another rate over all episodes, not its complement. Soft credit is an observable proxy rather than direct evidence of an internal intention. Navigation has one binary goal metric, with no soft/strict split.
Accessible table, original values and citation links
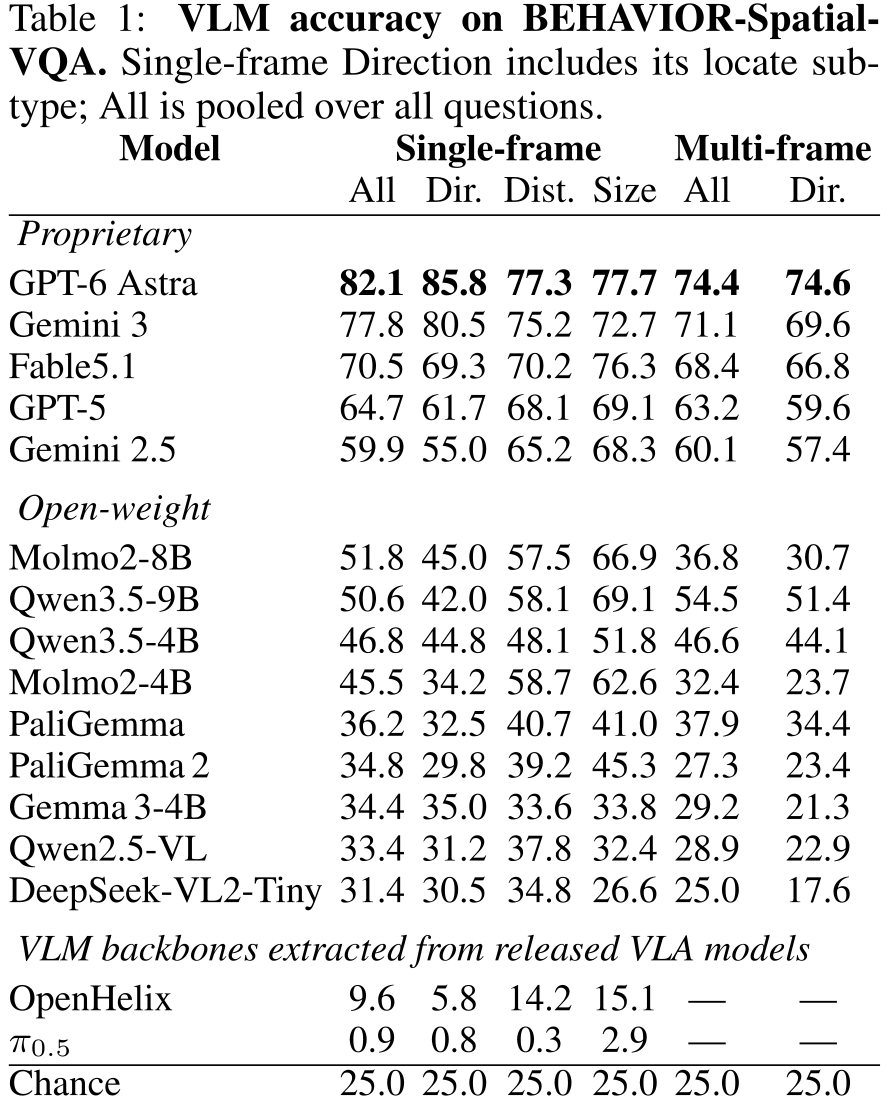
| Model | Single-frame | Multi-frame | ||||
|---|---|---|---|---|---|---|
| All | Dir. | Dist. | Size | All | Dir. | |
| Proprietary | ||||||
| GPT-6 Astra | 82.1 | 85.8 | 77.3 | 77.7 | 74.4 | 74.6 |
| Gemini 3 | 77.8 | 80.5 | 75.2 | 72.7 | 71.1 | 69.6 |
| Fable5.1 | 70.5 | 69.3 | 70.2 | 76.3 | 68.4 | 66.8 |
| GPT-5 | 64.7 | 61.7 | 68.1 | 69.1 | 63.2 | 59.6 |
| Gemini 2.5 | 59.9 | 55.0 | 65.2 | 68.3 | 60.1 | 57.4 |
| Open-weight | ||||||
| Molmo2-8B | 51.8 | 45.0 | 57.5 | 66.9 | 36.8 | 30.7 |
| Qwen3.5-9B | 50.6 | 42.0 | 58.1 | 69.1 | 54.5 | 51.4 |
| Qwen3.5-4B | 46.8 | 44.8 | 48.1 | 51.8 | 46.6 | 44.1 |
| Molmo2-4B | 45.5 | 34.2 | 58.7 | 62.6 | 32.4 | 23.7 |
| PaliGemma | 36.2 | 32.5 | 40.7 | 41.0 | 37.9 | 34.4 |
| PaliGemma 2 | 34.8 | 29.8 | 39.2 | 45.3 | 27.3 | 23.4 |
| Gemma 3-4B | 34.4 | 35.0 | 33.6 | 33.8 | 29.2 | 21.3 |
| Qwen2.5-VL | 33.4 | 31.2 | 37.8 | 32.4 | 28.9 | 22.9 |
| DeepSeek-VL2-Tiny | 31.4 | 30.5 | 34.8 | 26.6 | 25.0 | 17.6 |
| VLM backbones extracted from released VLA models | ||||||
| OpenHelix | 9.6 | 5.8 | 14.2 | 15.1 | — | — |
| 0.9 | 0.8 | 0.3 | 2.9 | — | — | |
| Chance | 25.0 | 25.0 | 25.0 | 25.0 | 25.0 | 25.0 |
5.2 VLM Evaluation on BEHAVIOR-Spatial-VQA and BEHAVIOR-Spatial-IR
General single-frame accuracy reaches 82.1% for the strongest proprietary model and 51.8% for the strongest open-weight one in this comparison. Multi-frame and task-grounded rankings differ. Qwen3.5-9B task VQA reaches 57.2%; strict pointing is 44.8%, versus Molmo2-8B’s 44.6%, while tolerant pointing favors Molmo2-8B at 52.2%. Answer choice and localization probe different capabilities. The very low extracted-VLA VQA values also include invalid response formatting and should not be read as pure spatial-knowledge measurements.
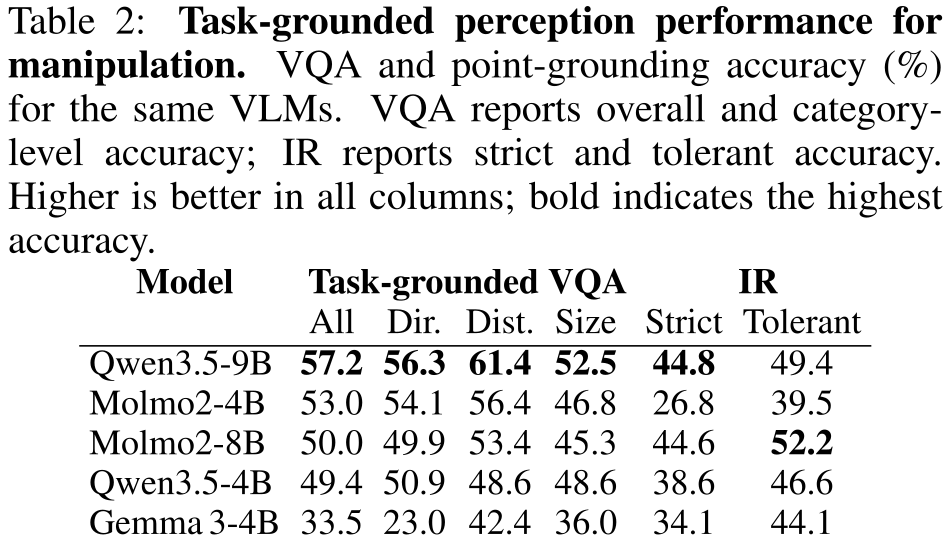
Accessible table, original values and citation links
| Model | Task-grounded VQA | IR | ||||
|---|---|---|---|---|---|---|
| All | Dir. | Dist. | Size | Strict | Tolerant | |
| Qwen3.5-9B | 57.2 | 56.3 | 61.4 | 52.5 | 44.8 | 49.4 |
| Molmo2-4B | 53.0 | 54.1 | 56.4 | 46.8 | 26.8 | 39.5 |
| Molmo2-8B | 50.0 | 49.9 | 53.4 | 45.3 | 44.6 | 52.2 |
| Qwen3.5-4B | 49.4 | 50.9 | 48.6 | 48.6 | 38.6 | 46.6 |
| Gemma 3-4B | 33.5 | 23.0 | 42.4 | 36.0 | 34.1 | 44.1 |
5.3 VLA evaluation on robot tasks
Policies use ten flow-denoising steps, 32-action chunks and asynchronous replanning. Checkpoints are nearby rather than identical updates, and LoRA uses a smaller batch. These settings constrain attribution of small method differences.
5.3.1 VLA performance on manipulation tasks
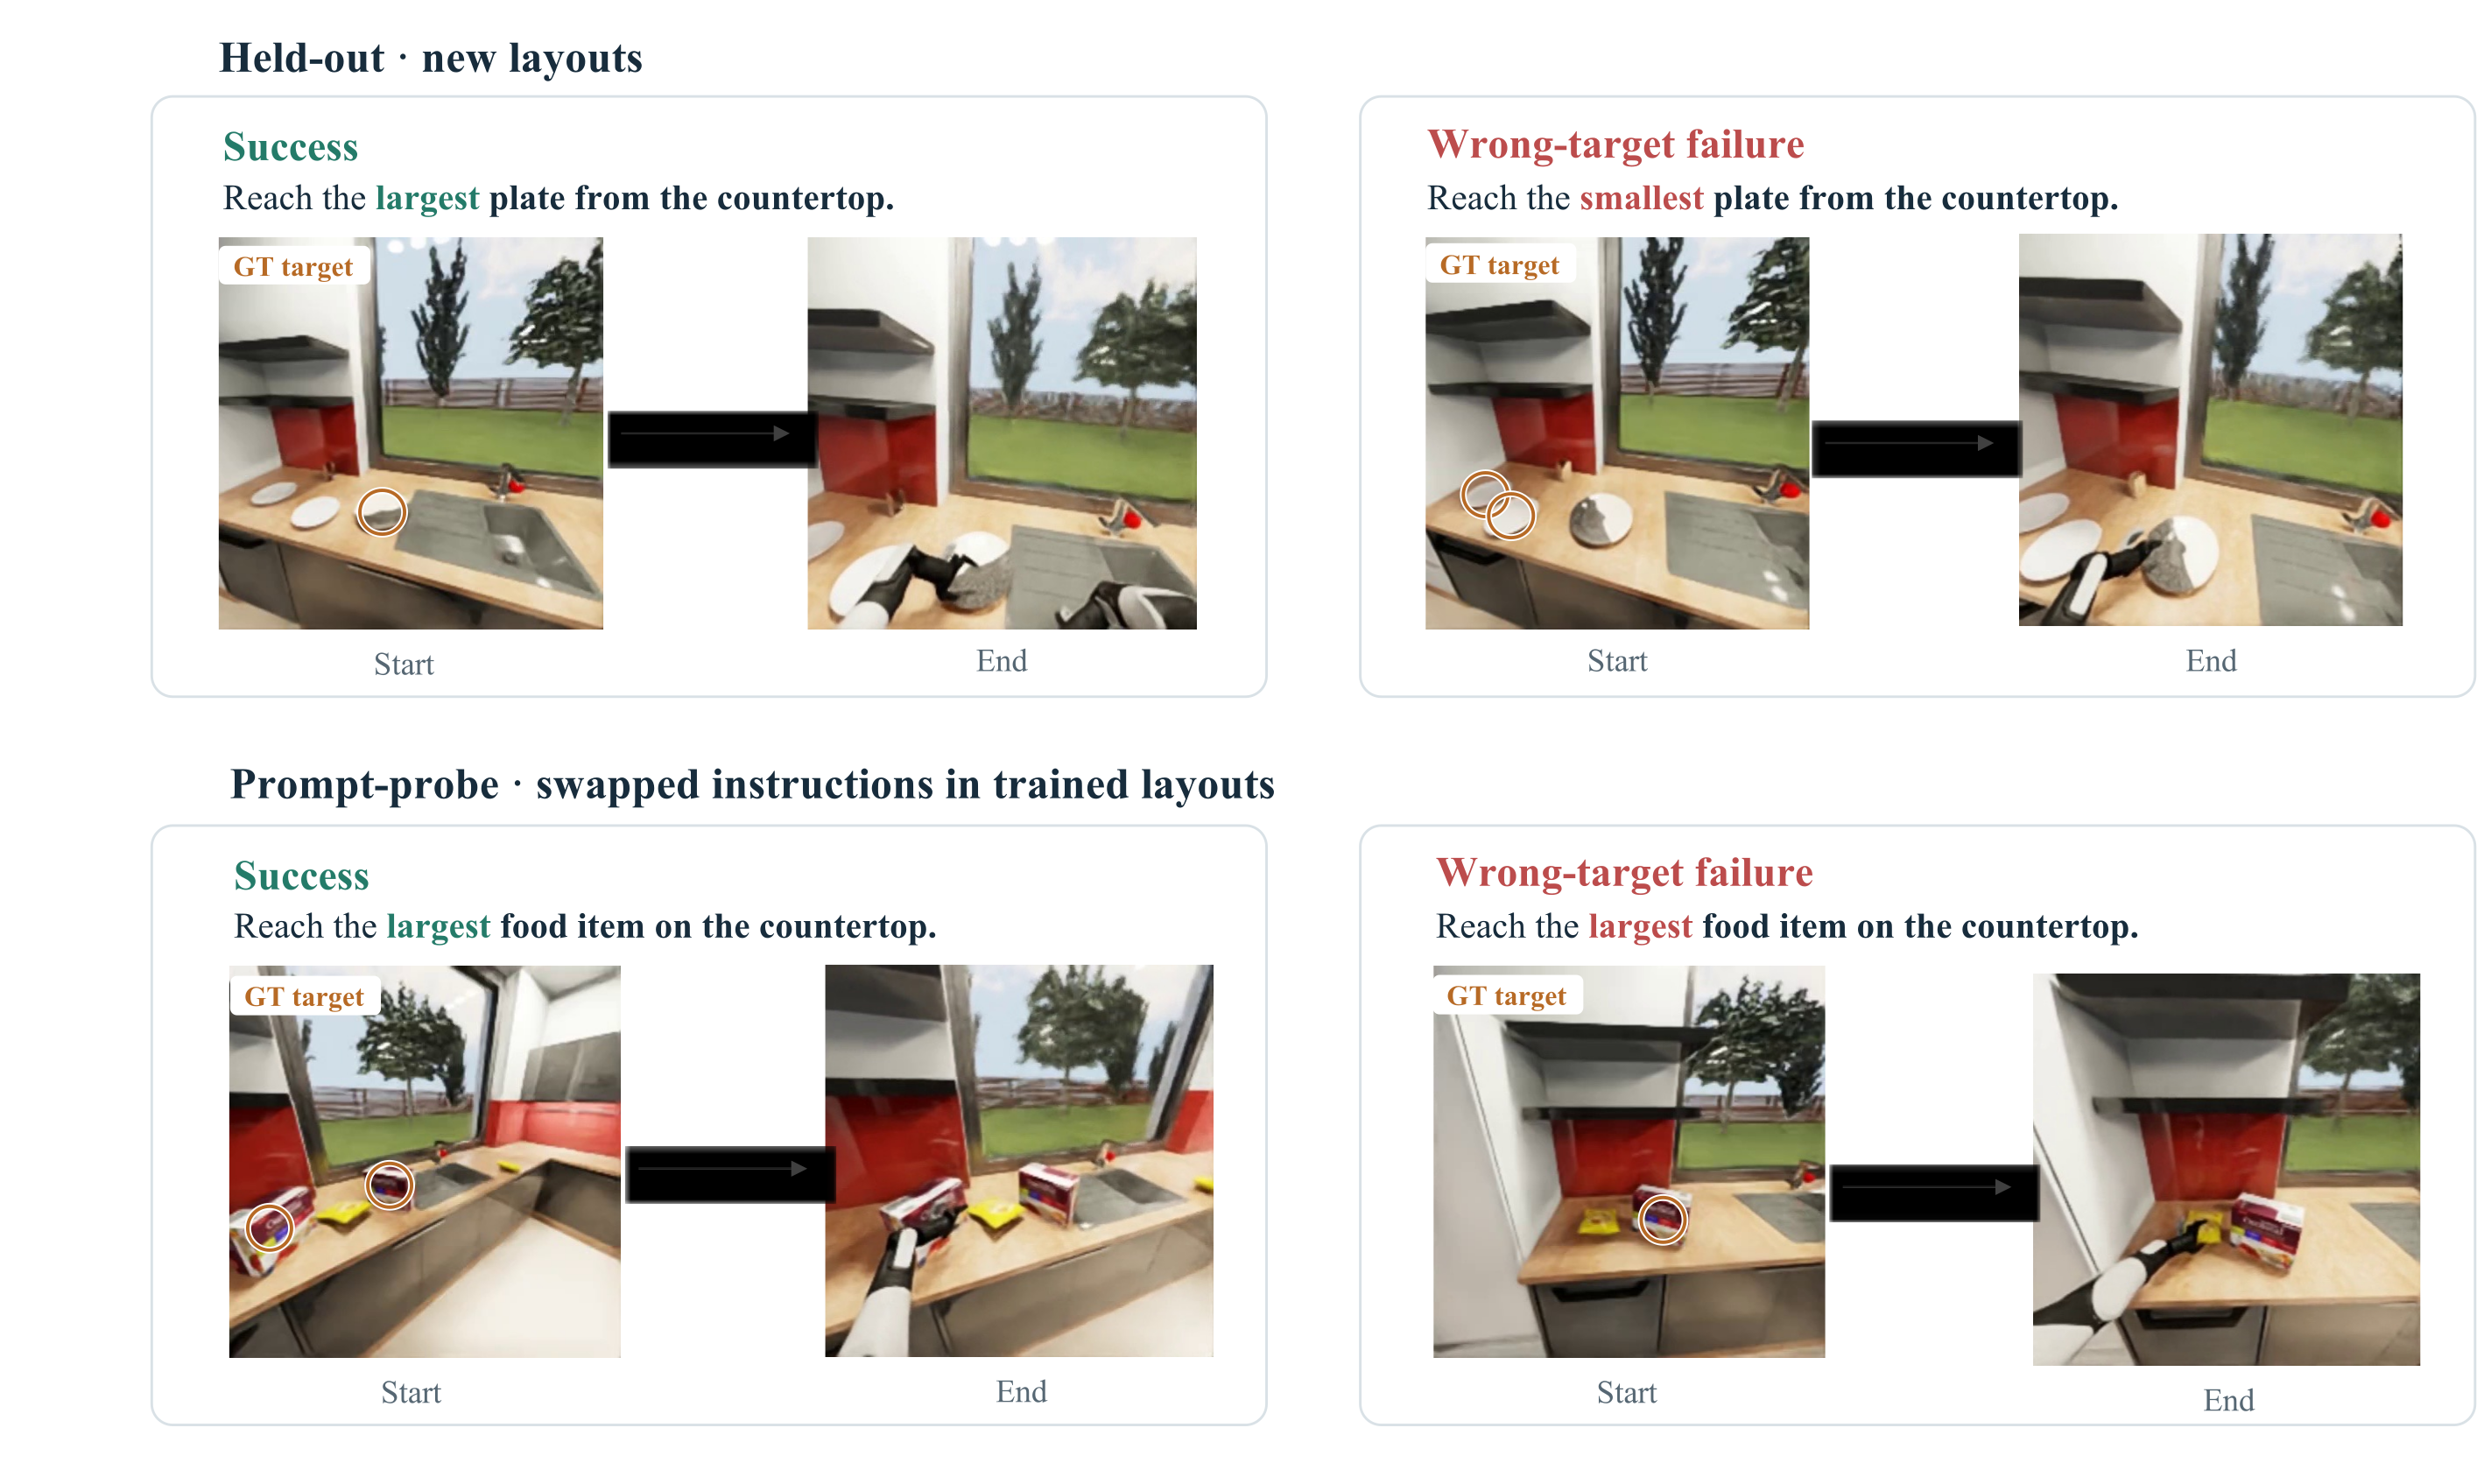
Baseline held-out soft/strict success is 41.6/27.9%; probe is 16.1/10.0%, with 70.0% wrong-target commitments. LoRA yields 43.5/30.9% held-out but 17.9/9.6% probe; DROID initialization gives 40.1/24.7 and 16.6/8.9. Oracle dots yield 60.3/44.8 and 38.0/24.9, reducing probe wrong targets to 43.9%. These cues substantially help but still leave errors. Per-task soft/strict gaps identify different bottlenecks; neither adaptation recipe improves strict probe completion over baseline.
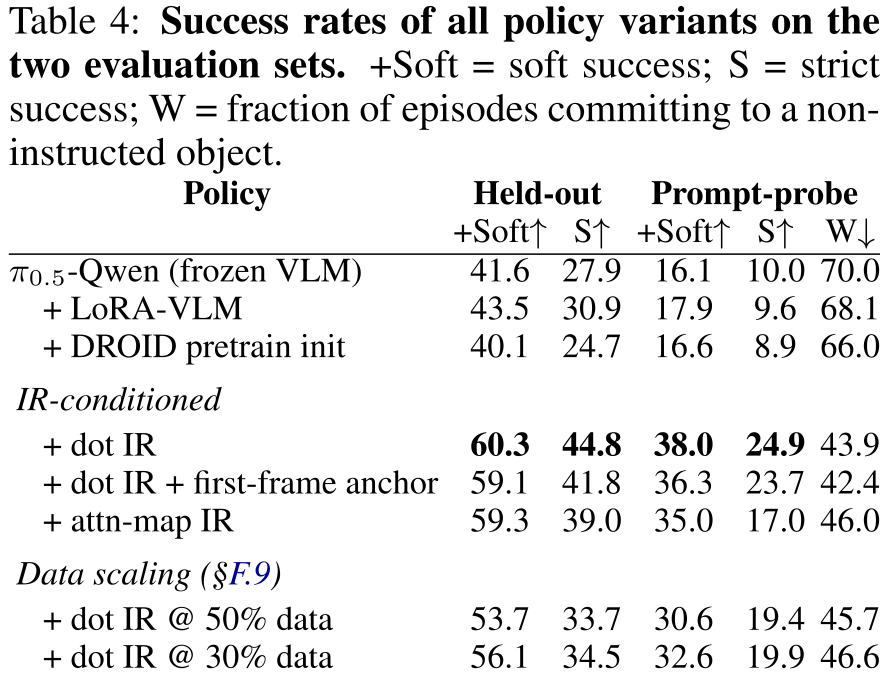
Accessible table, original values and citation links
| Policy | Held-out | Prompt-probe | |||
|---|---|---|---|---|---|
| +Soft | S | +Soft | S | W | |
| -Qwen (frozen VLM) | 41.6 | 27.9 | 16.1 | 10.0 | 70.0 |
| + LoRA-VLM | 43.5 | 30.9 | 17.9 | 9.6 | 68.1 |
| + DROID pretrain init | 40.1 | 24.7 | 16.6 | 8.9 | 66.0 |
| IR-conditioned | |||||
| + dot IR | 60.3 | 44.8 | 38.0 | 24.9 | 43.9 |
| + dot IR + first-frame anchor | 59.1 | 41.8 | 36.3 | 23.7 | 42.4 |
| + attn-map IR | 59.3 | 39.0 | 35.0 | 17.0 | 46.0 |
| Data scaling (§F.9) | |||||
| + dot IR @ 50% data | 53.7 | 33.7 | 30.6 | 19.4 | 45.7 |
| + dot IR @ 30% data | 56.1 | 34.5 | 32.6 | 19.9 | 46.6 |
5.3.2 Code-as-policy agents on manipulation tasks
With shared tools/API, proprietary writers yield 50.3–66.1% soft and 33.3–51.4% strict held-out success. Open-weight writers yield 37.1–39.0% soft but only 5.1–5.3% strict, with 83–87% of episodes ending without a decision. Their low wrong-target rates partly reflect this noncommitment and are not superior completed-task accuracy. Frozen programs still observe, branch and retry; simulation pauses during computation/perception, unlike a wall-clock-controlled physical deployment.
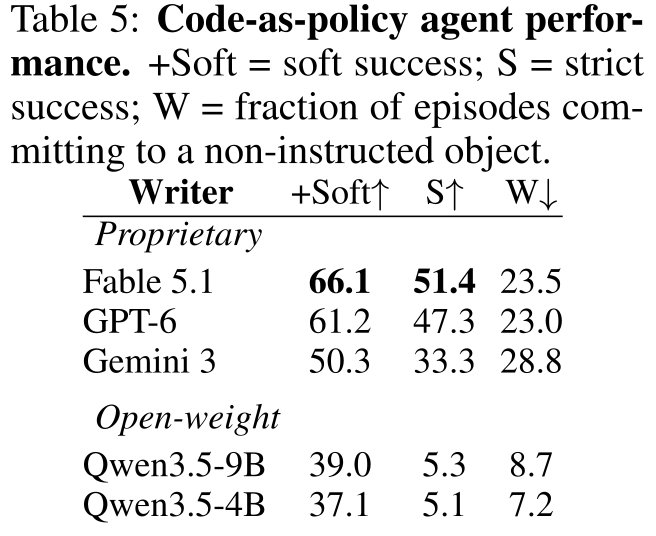
Accessible table, original values and citation links
| Writer | +Soft | S | W |
|---|---|---|---|
| Proprietary | |||
| Fable 5.1 | 66.1 | 51.4 | 23.5 |
| GPT-6 | 61.2 | 47.3 | 23.0 |
| Gemini 3 | 50.3 | 33.3 | 28.8 |
| Open-weight | |||
| Qwen3.5-9B | 39.0 | 5.3 | 8.7 |
| Qwen3.5-4B | 37.1 | 5.1 | 7.2 |
5.3.3 Perception–Action correlation for manipulation
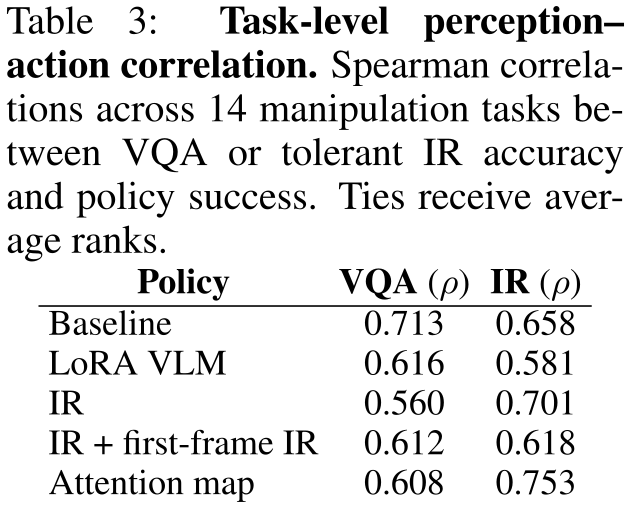
Across fourteen tasks, dot-IR and attention-map policies correlate more strongly with tolerant pointing than VQA (Spearman .701 vs .560 and .753 vs .608). Baseline and LoRA show the reverse ordering; first-frame IR is nearly tied. All scores use the same Qwen perception model and task-level aggregates, with no uncertainty or causal identification. Oracle policies are not executing these VLM predictions in this correlation experiment, so the association can reflect task difficulty rather than direct transfer of their predicted points.
Original mathematical definition and protocol
We compare Qwen3.5-4B’s task-level VQA and tolerant IR accuracies with each policy’s soft held-out success across 14 manipulation tasks, using Spearman’s rank correlation with average ranks for ties (Table 3). For two of the strongest-performing variants, dot IR and attention-map IR, grounding accuracy correlates more strongly with success than VQA accuracy ( versus , and versus , respectively). This suggests that the metric that tracks the policy is the one the VLM has to generate, not the one it has to answer. Correlation plots are provided in Appendix F.6.
5.3.4 Ablation Studies for manipulation tasks
Predicted dots recover part of the oracle benefit: Qwen3.5-4B yields 48.8/34.1% held-out soft/strict success, below oracle 60.3/44.8. A fixed first-frame marked image slightly reduces performance. Paperback approach-prefix augmentation changes soft progress/wrong-target rates but leaves strict completion 10.1% in its separate case study. Full-data dot training is best pooled, but 50% is worse than 30%; more demonstrations do not help every task. These interventions change multiple aspects of data or visual conditioning.
5.4 VLA performance on navigation tasks
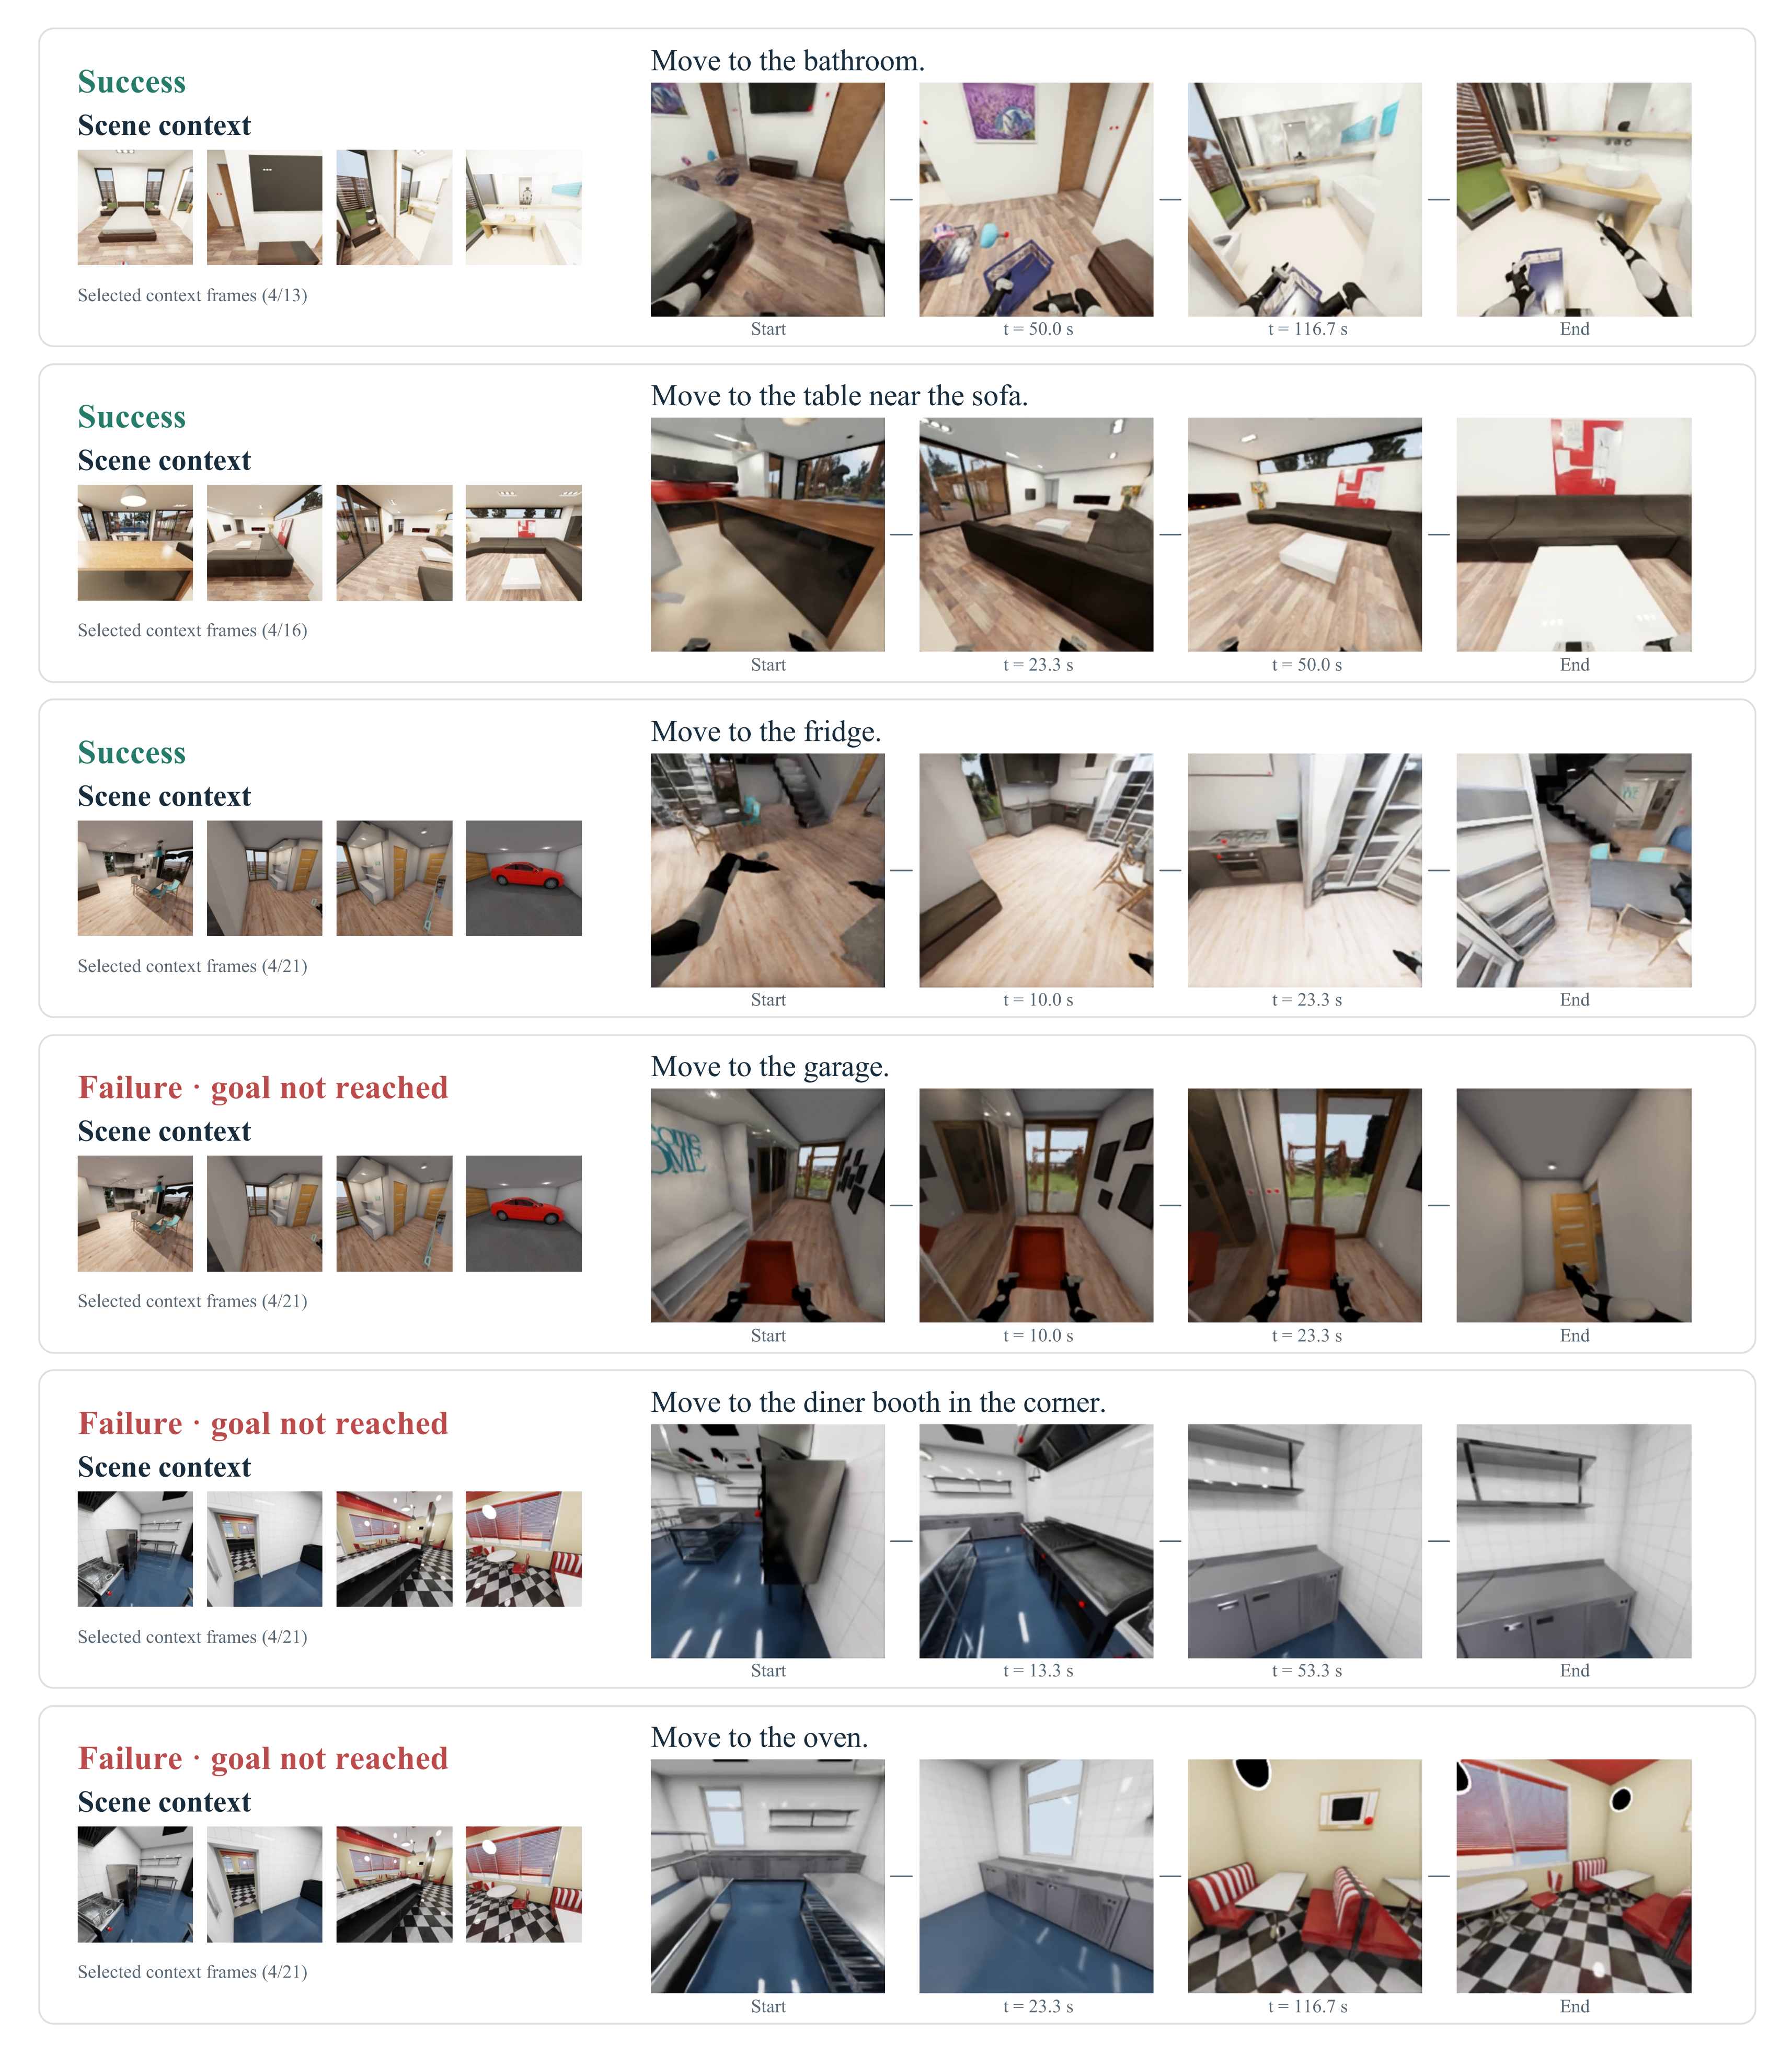
Navigation success spans 22.5% garage to 92.5% bookcase, pooled 59.9% over 401 starts. Direction VQA ranges 16.7–40.0% and does not consistently track route completion across ten tasks. Route length, obstacles, start distribution and context order are plausible confounds; none is isolated as the cause. Main text’s 75–85% diner range understates the table’s 87.5% corner-booth result; all published values remain intact.
6 Limitations and Conclusion
The results support diagnosing spatial instruction following separately from practiced completion, while leaving physical transfer and broader policy generality open.
6.1 Limitations
Everything is simulated. Acting-hand/target-layer correlations in tupperware can confound spatial interpretation, and timeout budgets affect success. Oracle IR training needs target annotations or an alternative grounding source; predicted test points do not remove that training supervision. One architecture, limited task/scene set and unreported training-seed variability restrict broader conclusions.
6.2 Conclusion
Explicit target cues improve target-directed behavior, and predicted cues retain a smaller benefit, but reliable task completion remains difficult. VQA/pointing scores provide policy-dependent diagnostics rather than a universal predictor of action success.
AI use statement
The authors report generative-AI help with writing, figure scripts and result aggregation, with author review of manuscript claims and experimental logs.
Ethics statement
The source describes simulated labels and cautions against interpreting simulation success as evidence for safe physical deployment. These notes retain the statement without adding physical experiments.
Reproducibility statement
The manuscript documents construction, splits and evaluation and promises benchmark/code release upon publication. The stated project URL returned HTTP 404 during this review, so no additional media or implementation details were inferred from it.
Appendix A Additional Data Curation Details
Appendix A specifies geometric categories, visibility/margin filtering, frame context and pointing-label construction. Full templates/counts and all task-view grids remain.
A.1 Spatial Concepts and Observation Settings
Locate counts layers/grids inside a specified container; ordinal ranks spatial positions and appears only in task-grounded VQA. Size requires accounting for perspective. Rotation observes viewpoints around one position; navigation must also account for robot displacement. These settings do not share identical directional answer spaces.
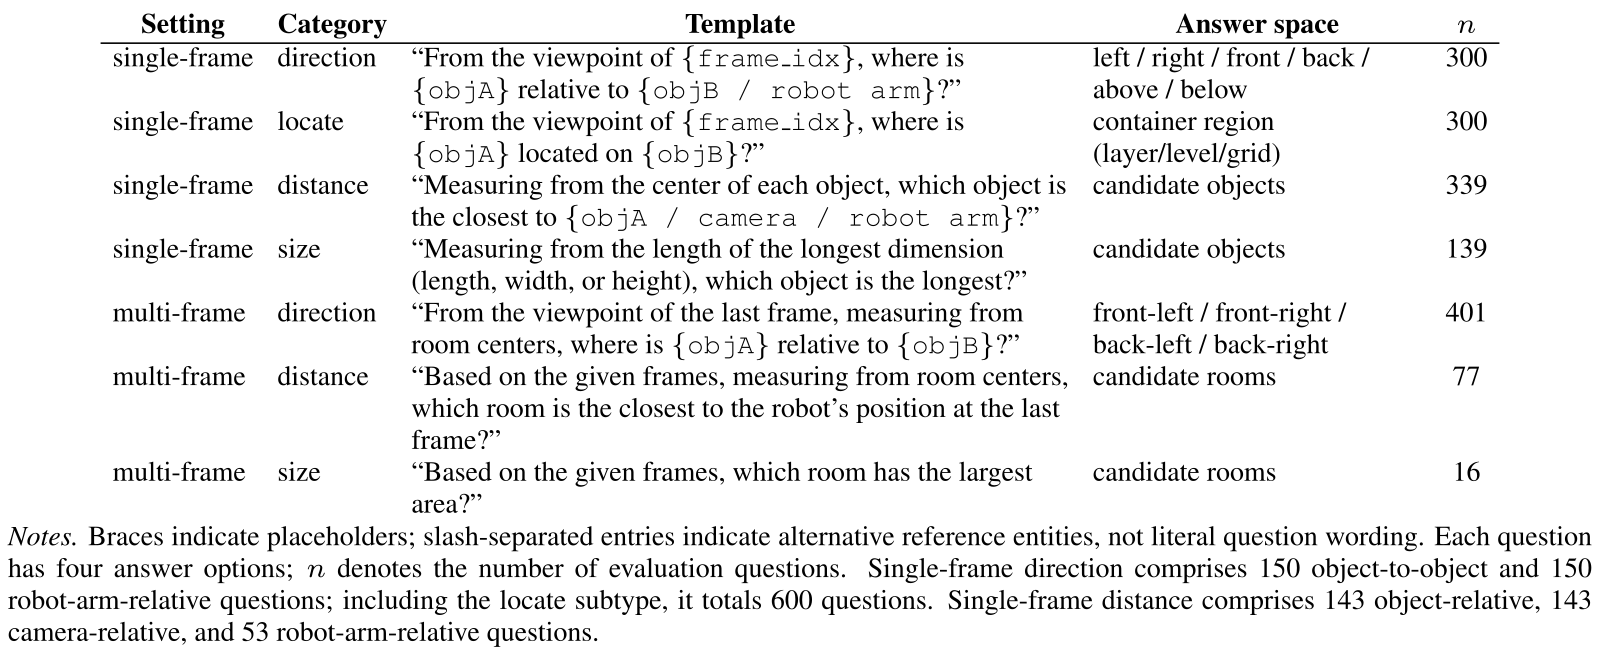
Accessible table, original values and citation links
| Setting | Category | Template | Answer space | |
|---|---|---|---|---|
| single-frame | direction | “From the viewpoint of {frame_idx}, where is {objA} relative to {objB / robot arm}?” | left / right / front / back / above / below | 300 |
| single-frame | locate | “From the viewpoint of {frame_idx}, where is {objA} located on {objB}?” | container region (layer/level/grid) | 300 |
| single-frame | distance | “Measuring from the center of each object, which object is the closest to {objA / camera / robot arm}?” | candidate objects | 339 |
| single-frame | size | “Measuring from the length of the longest dimension (length, width, or height), which object is the longest?” | candidate objects | 139 |
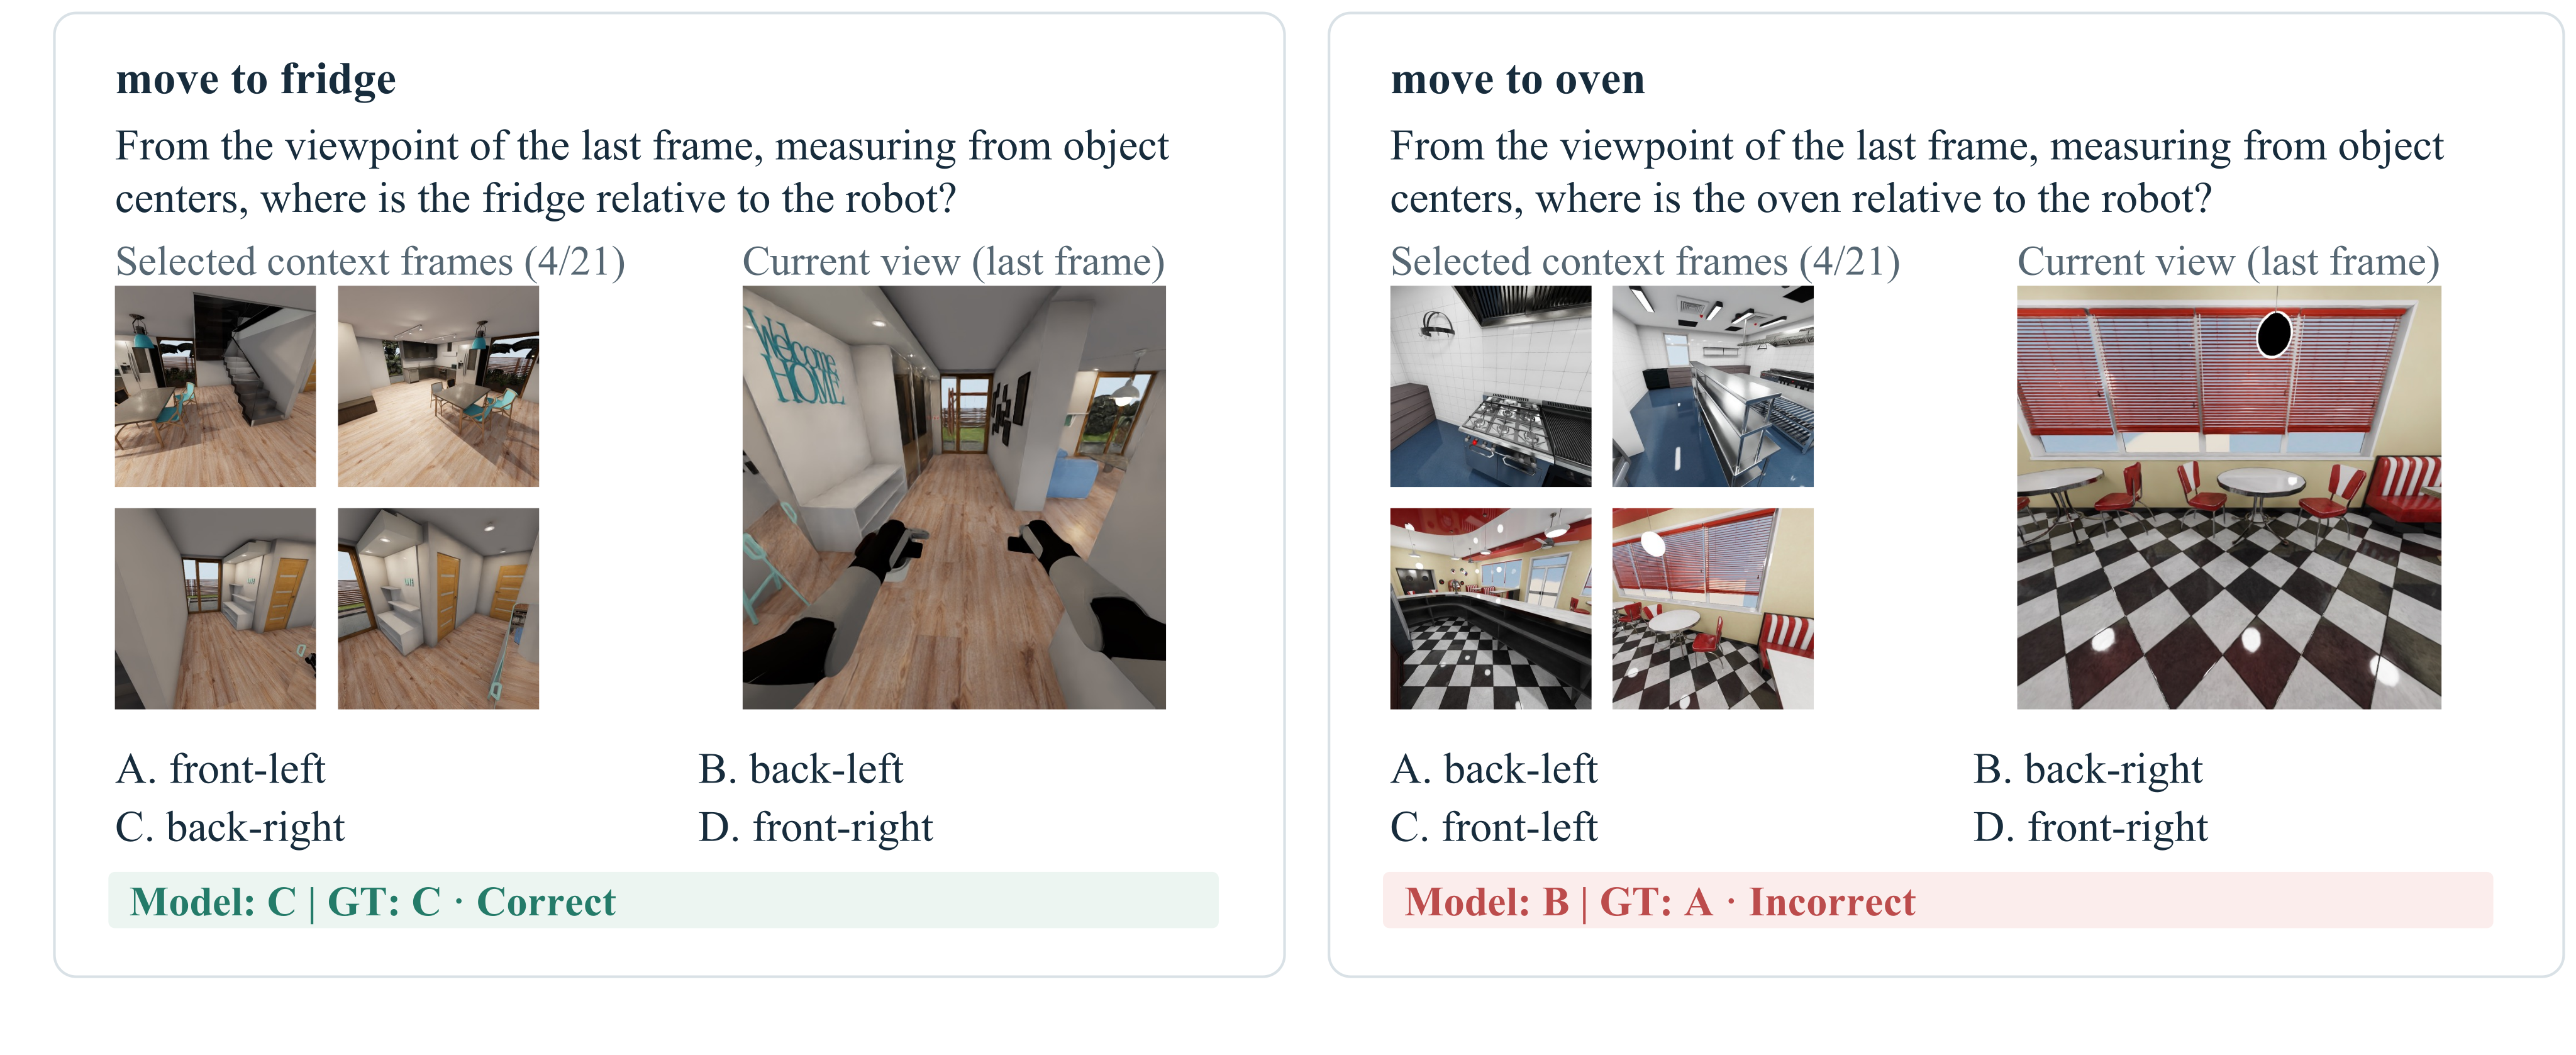
| multi-frame | direction | “From the viewpoint of the last frame, measuring from room centers, where is {objA} relative to {objB}?” | front-left / front-right / back-left / back-right | 401 |
| multi-frame | distance | “Based on the given frames, measuring from room centers, which room is the closest to the robot’s position at the last frame?” | candidate rooms | 77 |
| multi-frame | size | “Based on the given frames, which room has the largest area?” | candidate rooms | 16 |
Notes. Braces indicate placeholders; slash-separated entries indicate alternative reference entities, not literal question wording. Each question has four answer options; denotes the number of evaluation questions. Single-frame direction comprises 150 object-to-object and 150 robot-arm-relative questions; including the locate subtype, it totals 600 questions. Single-frame distance comprises 143 object-relative, 143 camera-relative, and 53 robot-arm-relative questions.
A.2 VQA Generation, Filtering, and Frame Selection
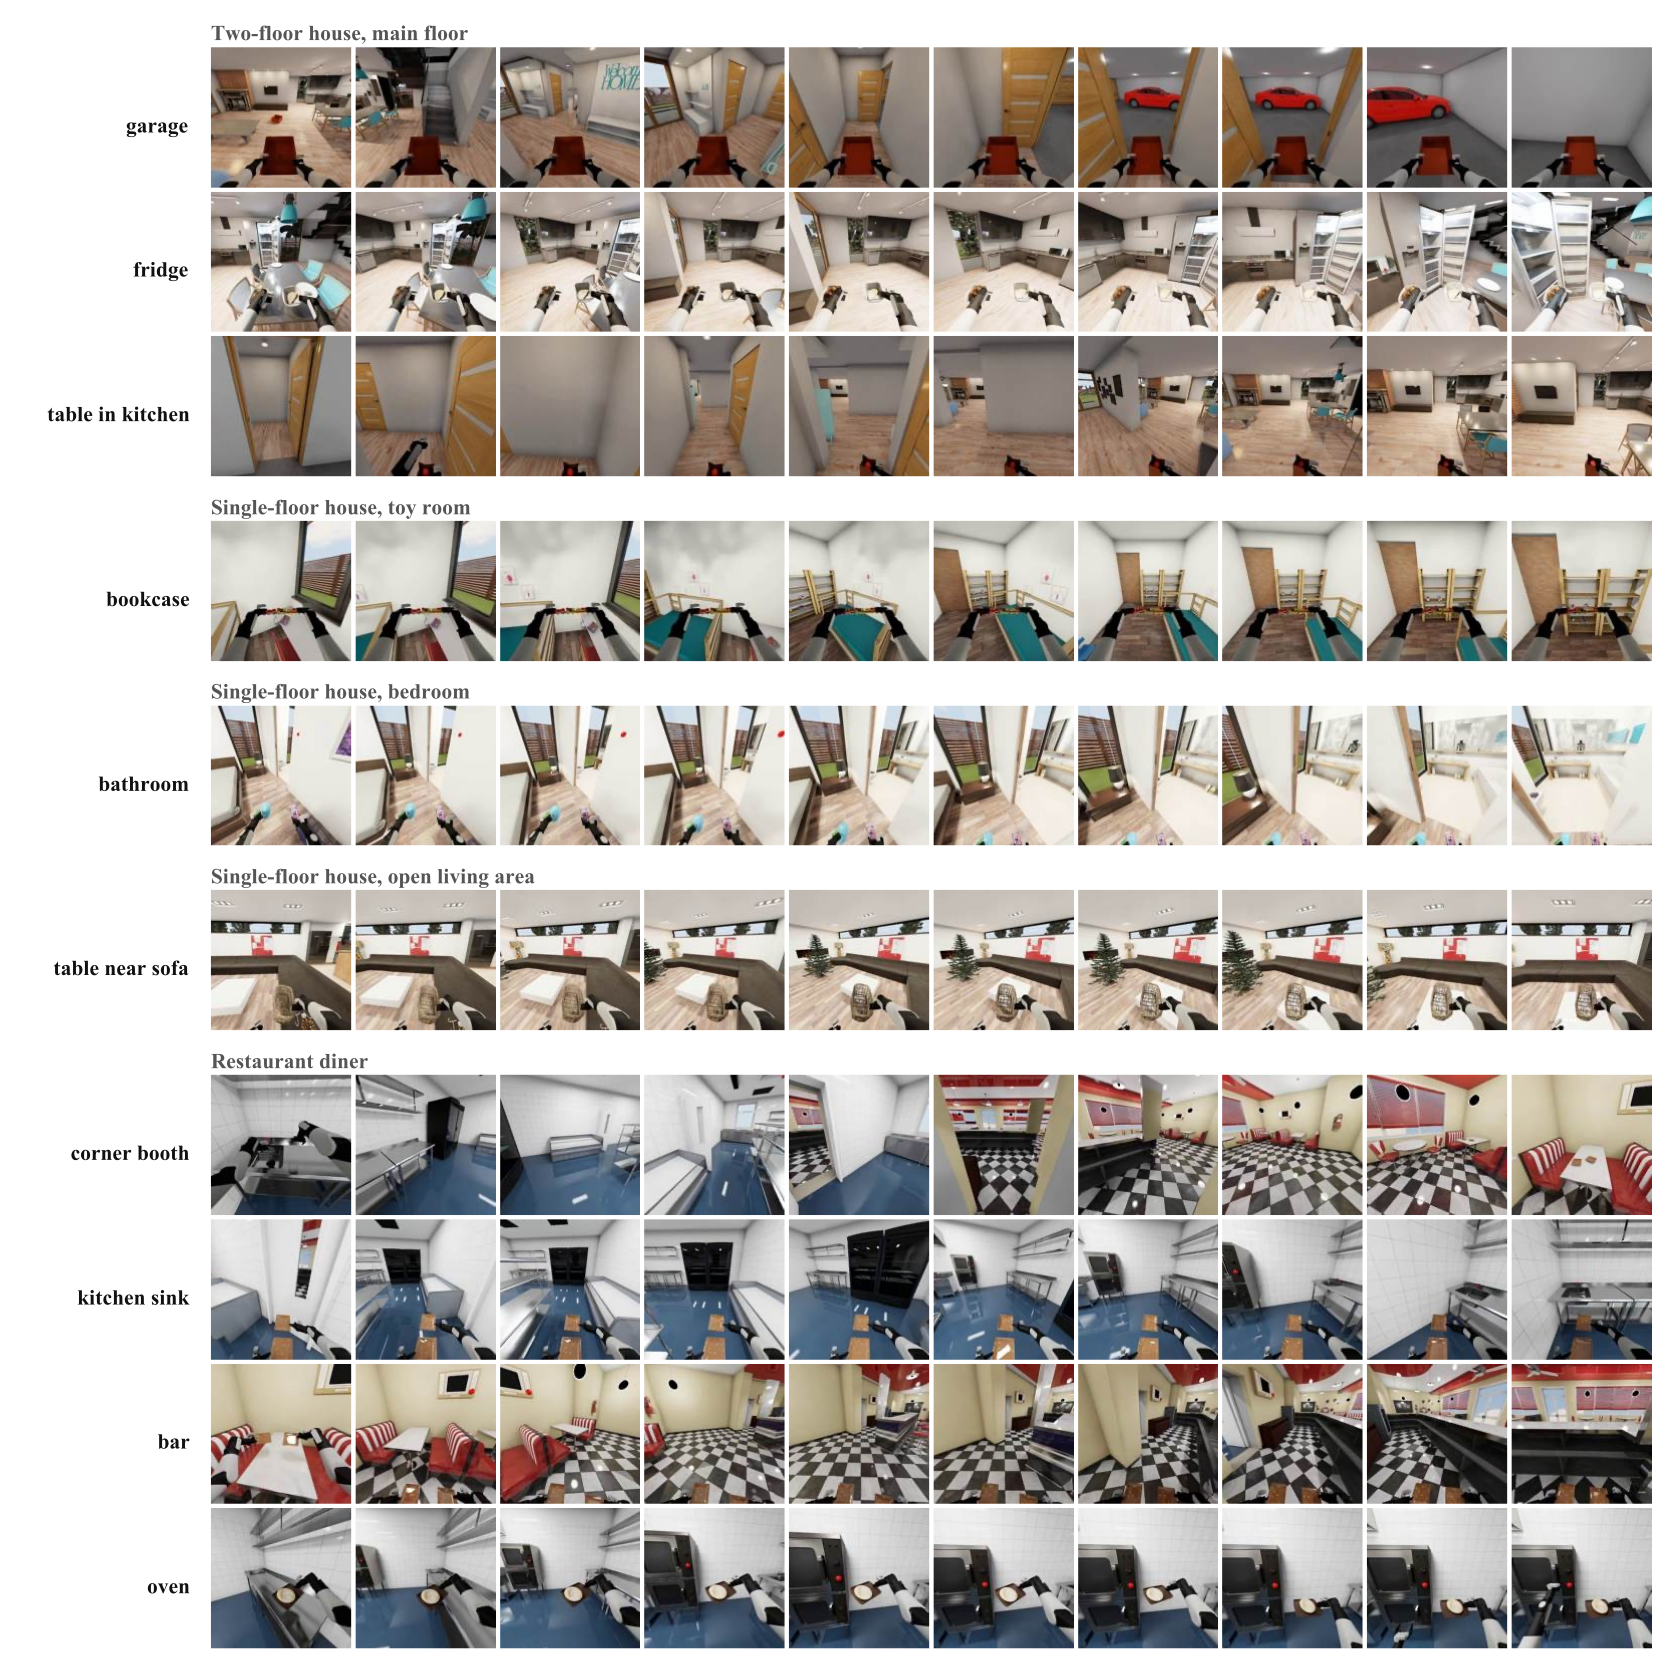
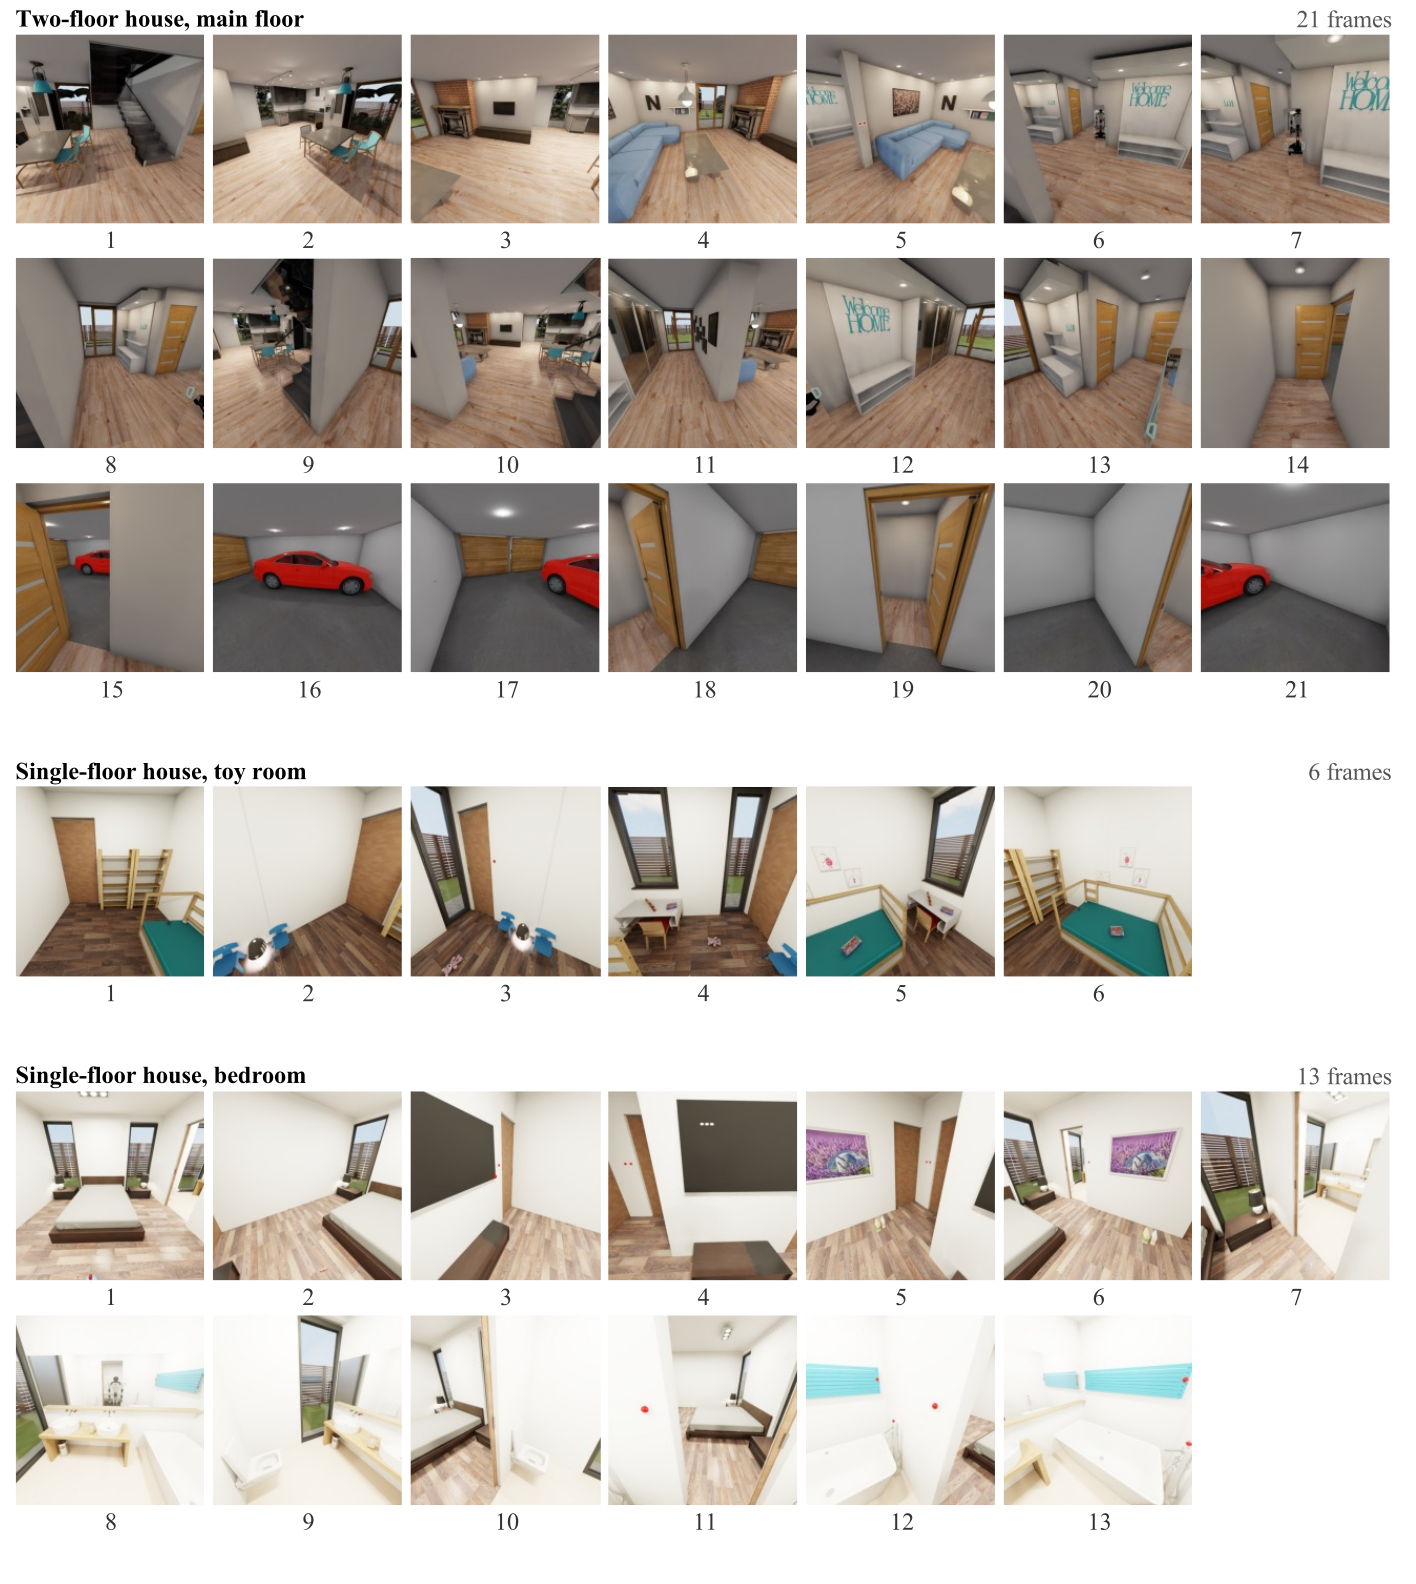
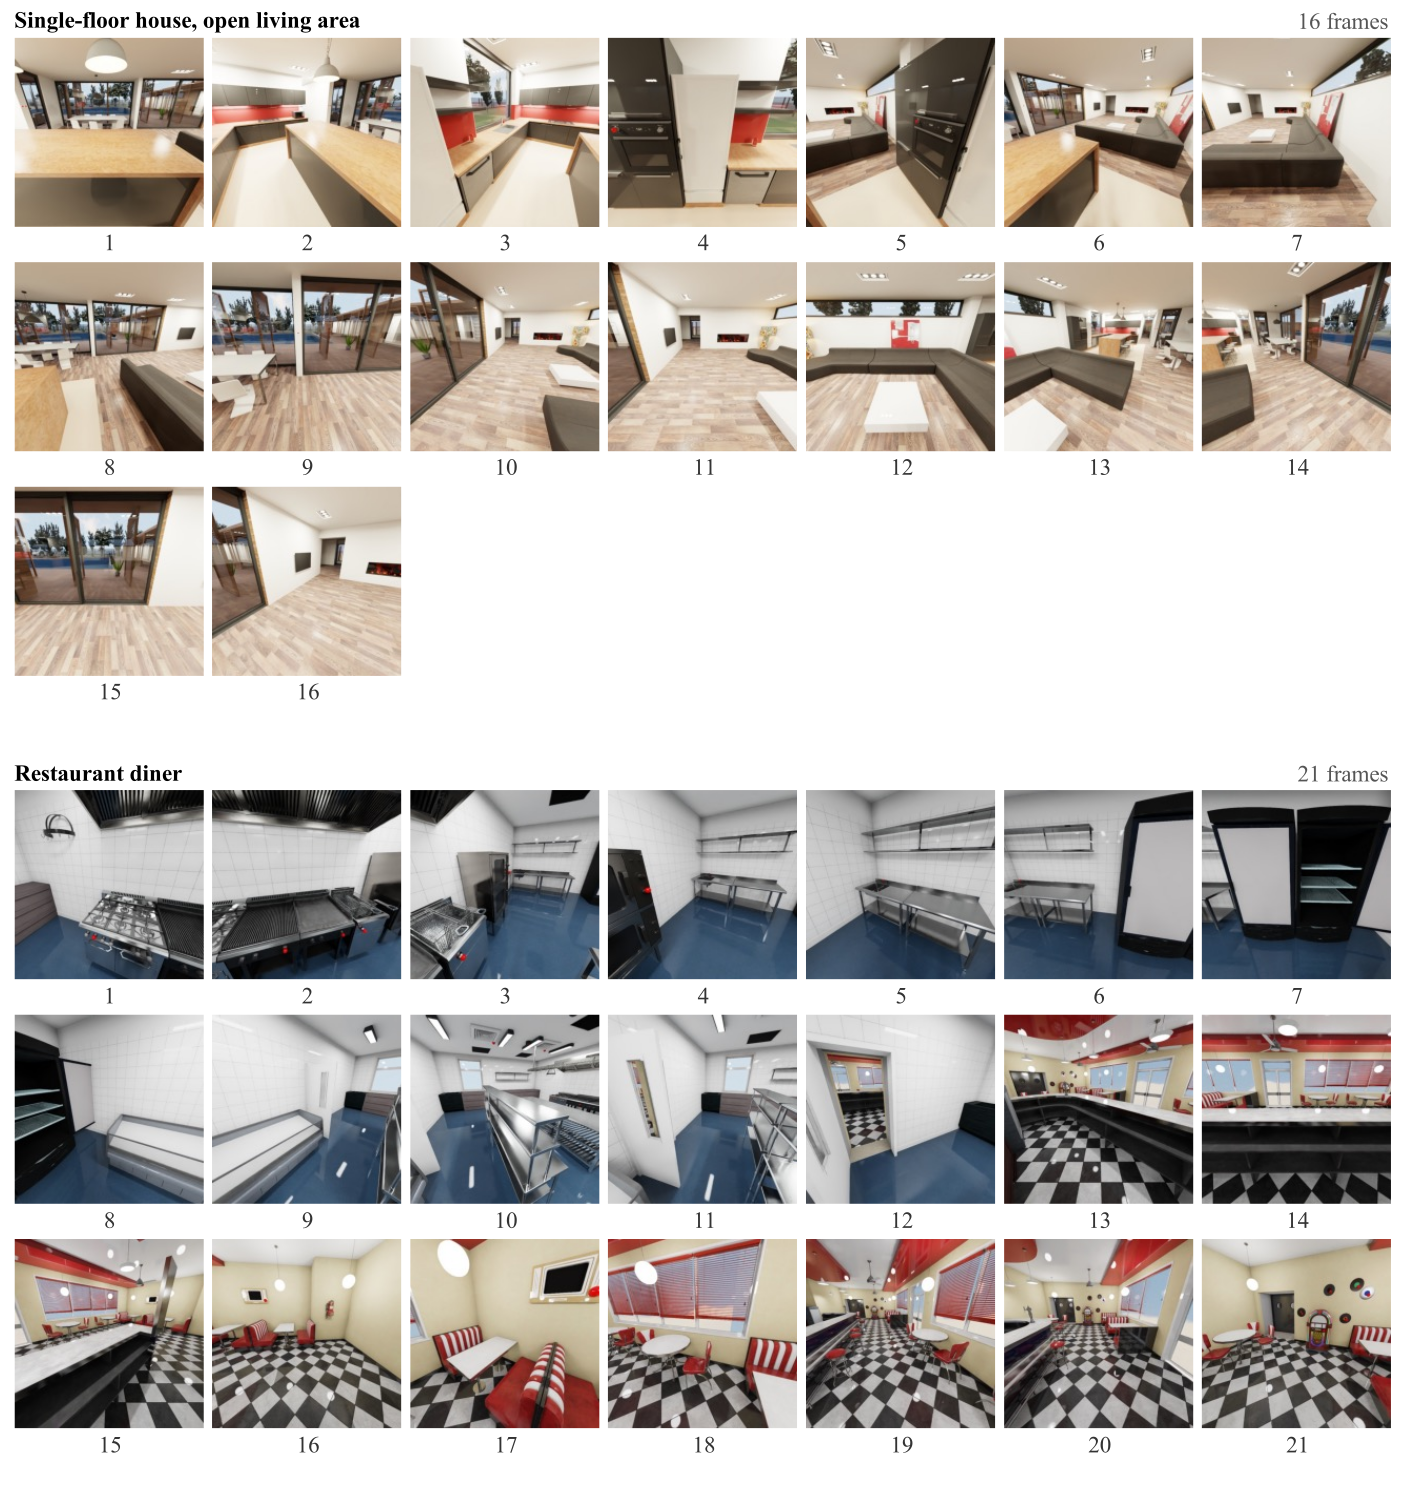
Generation uses 3D relations and projected boxes, then at least 15% distance separation, 10% size margin, pixel visibility thresholds and a sublinear per-frame cap. Exact visibility thresholds are not supplied here. Rotation uses four views covering 360 degrees; multi-frame direction uses diagonals while single-frame uses axial relations. Task questions balance variants; navigation uses ordered curated context tours, not current-position views. All 77 context images across five scenes remain in Figures S3/S4, and all 100 navigation demonstration frames remain in S2.
Original mathematical definition and protocol
General rotation questions supply four frames captured as the robot rotates in place, jointly covering the full surround. General navigation questions use observations captured during movement through a scene. Multi-frame direction questions use four diagonal relations (front-left, front-right, back-left, and back-right), whereas single-frame direction questions use axis-aligned relations.
A.3 Point-Grounding Annotation and Validation
Questioning a relation requires its entities to be visible, while pointing also requires a visible destination region. Thus eligible frames differ across suites even in shared tasks. Model and uniform-random points validate evaluator geometry; these checks do not prove all labels are visually unambiguous.
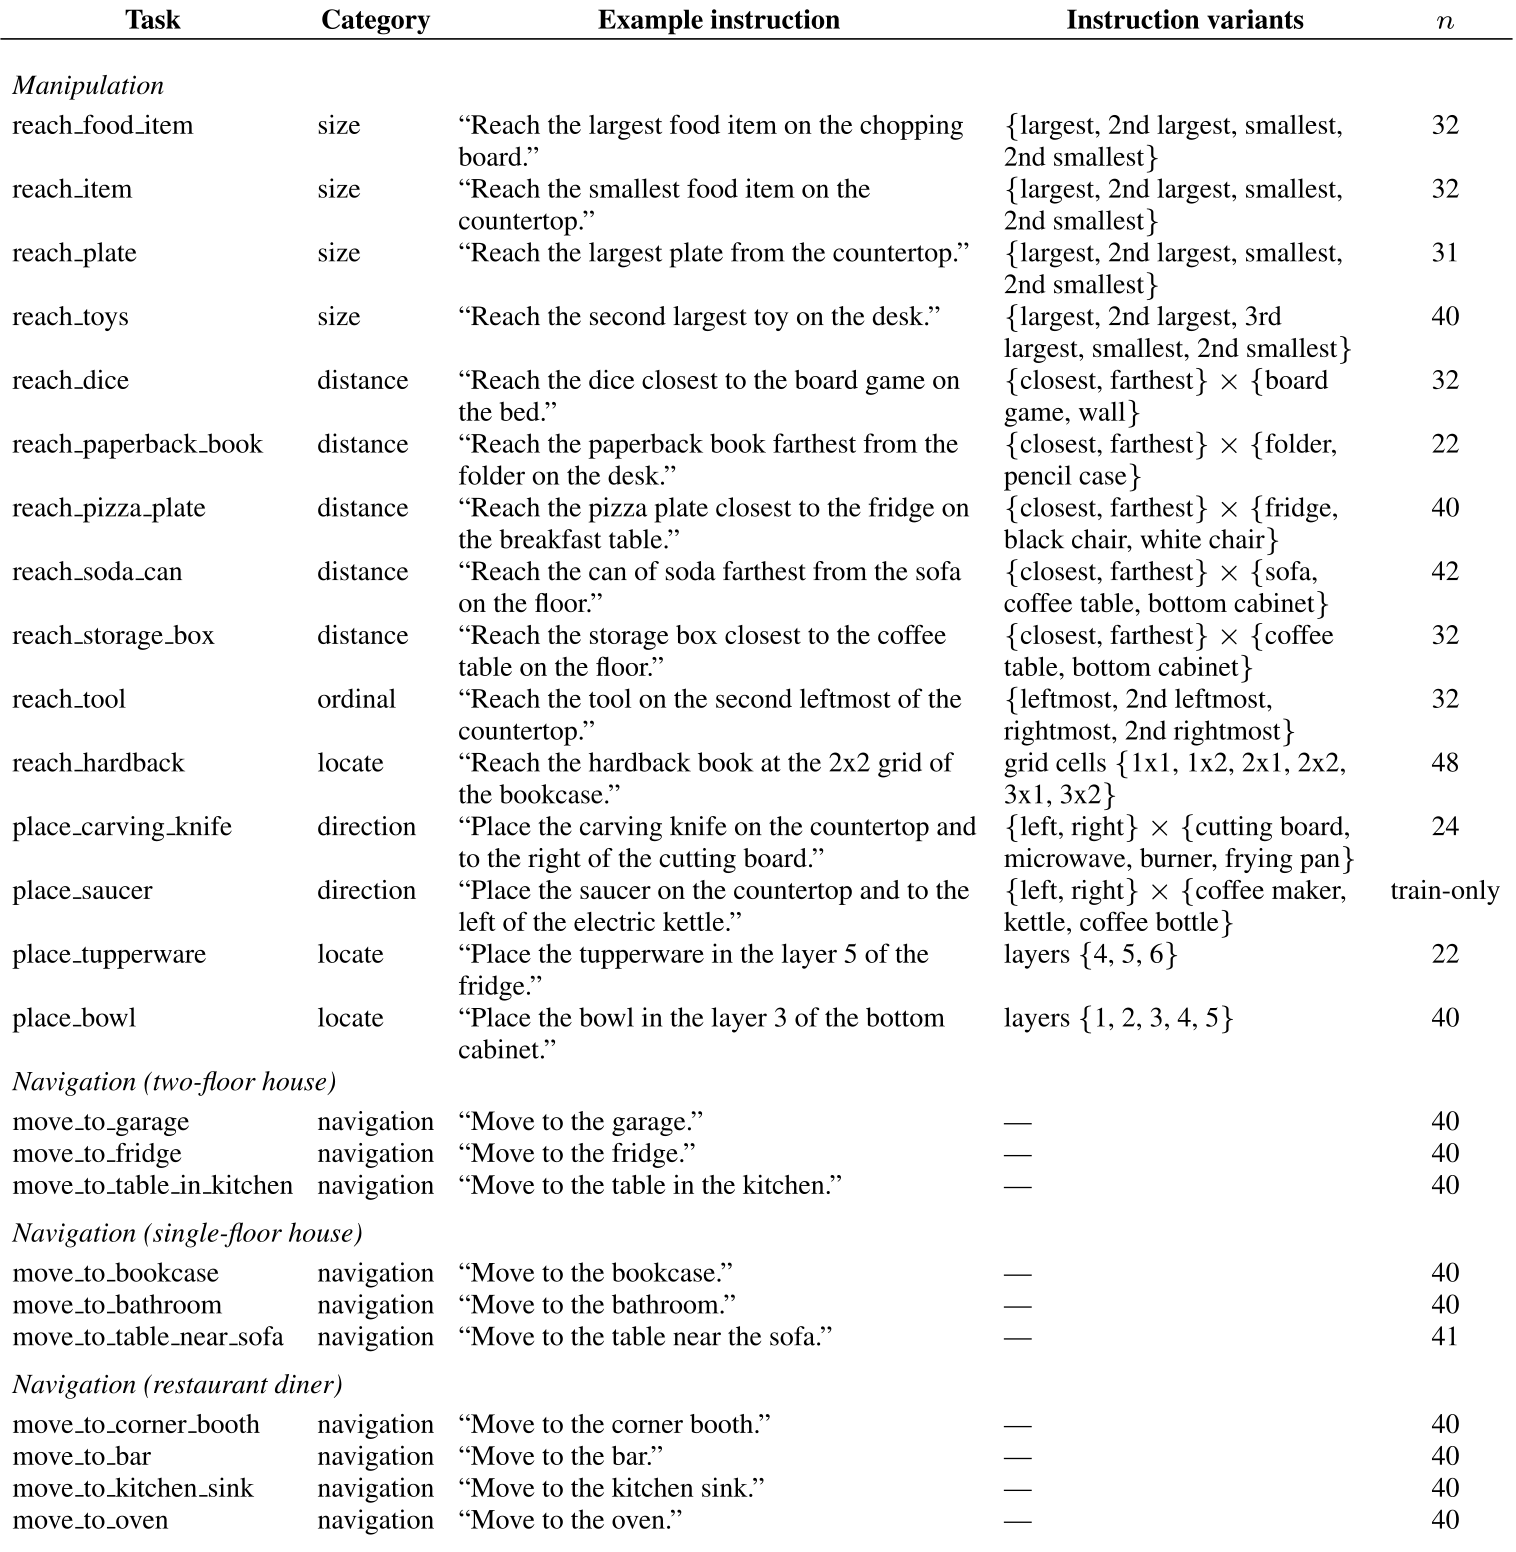
Accessible table, original values and citation links
| Task | Category | Example instruction | Instruction variants | |
| Manipulation | ||||
| reach_food_item | size | “Reach the largest food item on the chopping board.” | {largest, 2nd largest, smallest, 2nd smallest} | 32 |
| reach_item | size | “Reach the smallest food item on the countertop.” | {largest, 2nd largest, smallest, 2nd smallest} | 32 |
| reach_plate | size | “Reach the largest plate from the countertop.” | {largest, 2nd largest, smallest, 2nd smallest} | 31 |
| reach_toys | size | “Reach the second largest toy on the desk.” | {largest, 2nd largest, 3rd largest, smallest, 2nd smallest} | 40 |
| reach_dice | distance | “Reach the dice closest to the board game on the bed.” | {closest, farthest} {board game, wall} | 32 |
| reach_paperback_book | distance | “Reach the paperback book farthest from the folder on the desk.” | {closest, farthest} {folder, pencil case} | 22 |
| reach_pizza_plate | distance | “Reach the pizza plate closest to the fridge on the breakfast table.” | {closest, farthest} {fridge, black chair, white chair} | 40 |
| reach_soda_can | distance | “Reach the can of soda farthest from the sofa on the floor.” | {closest, farthest} {sofa, coffee table, bottom cabinet} | 42 |
| reach_storage_box | distance | “Reach the storage box closest to the coffee table on the floor.” | {closest, farthest} {coffee table, bottom cabinet} | 32 |
| reach_tool | ordinal | “Reach the tool on the second leftmost of the countertop.” | {leftmost, 2nd leftmost, rightmost, 2nd rightmost} | 32 |
| reach_hardback | locate | “Reach the hardback book at the 2x2 grid of the bookcase.” | grid cells {1x1, 1x2, 2x1, 2x2, 3x1, 3x2} | 48 |
| place_carving_knife | direction | “Place the carving knife on the countertop and to the right of the cutting board.” | {left, right} {cutting board, microwave, burner, frying pan} | 24 |
| place_saucer | direction | “Place the saucer on the countertop and to the left of the electric kettle.” | {left, right} {coffee maker, kettle, coffee bottle} | train-only |
| place_tupperware | locate | “Place the tupperware in the layer 5 of the fridge.” | layers {4, 5, 6} | 22 |
| place_bowl | locate | “Place the bowl in the layer 3 of the bottom cabinet.” | layers {1, 2, 3, 4, 5} | 40 |
| Navigation (two-floor house) | ||||
| move_to_garage | navigation | “Move to the garage.” | — | 40 |
| move_to_fridge | navigation | “Move to the fridge.” | — | 40 |
| move_to_table_in_kitchen | navigation | “Move to the table in the kitchen.” | — | 40 |
| Navigation (single-floor house) | ||||
| move_to_bookcase | navigation | “Move to the bookcase.” | — | 40 |
| move_to_bathroom | navigation | “Move to the bathroom.” | — | 40 |
| move_to_table_near_sofa | navigation | “Move to the table near the sofa.” | — | 41 |
| Navigation (restaurant diner) | ||||
| move_to_corner_booth | navigation | “Move to the corner booth.” | — | 40 |
| move_to_bar | navigation | “Move to the bar.” | — | 40 |
| move_to_kitchen_sink | navigation | “Move to the kitchen sink.” | — | 40 |
| move_to_oven | navigation | “Move to the oven.” | — | 40 |
Appendix B Task Suite Overview
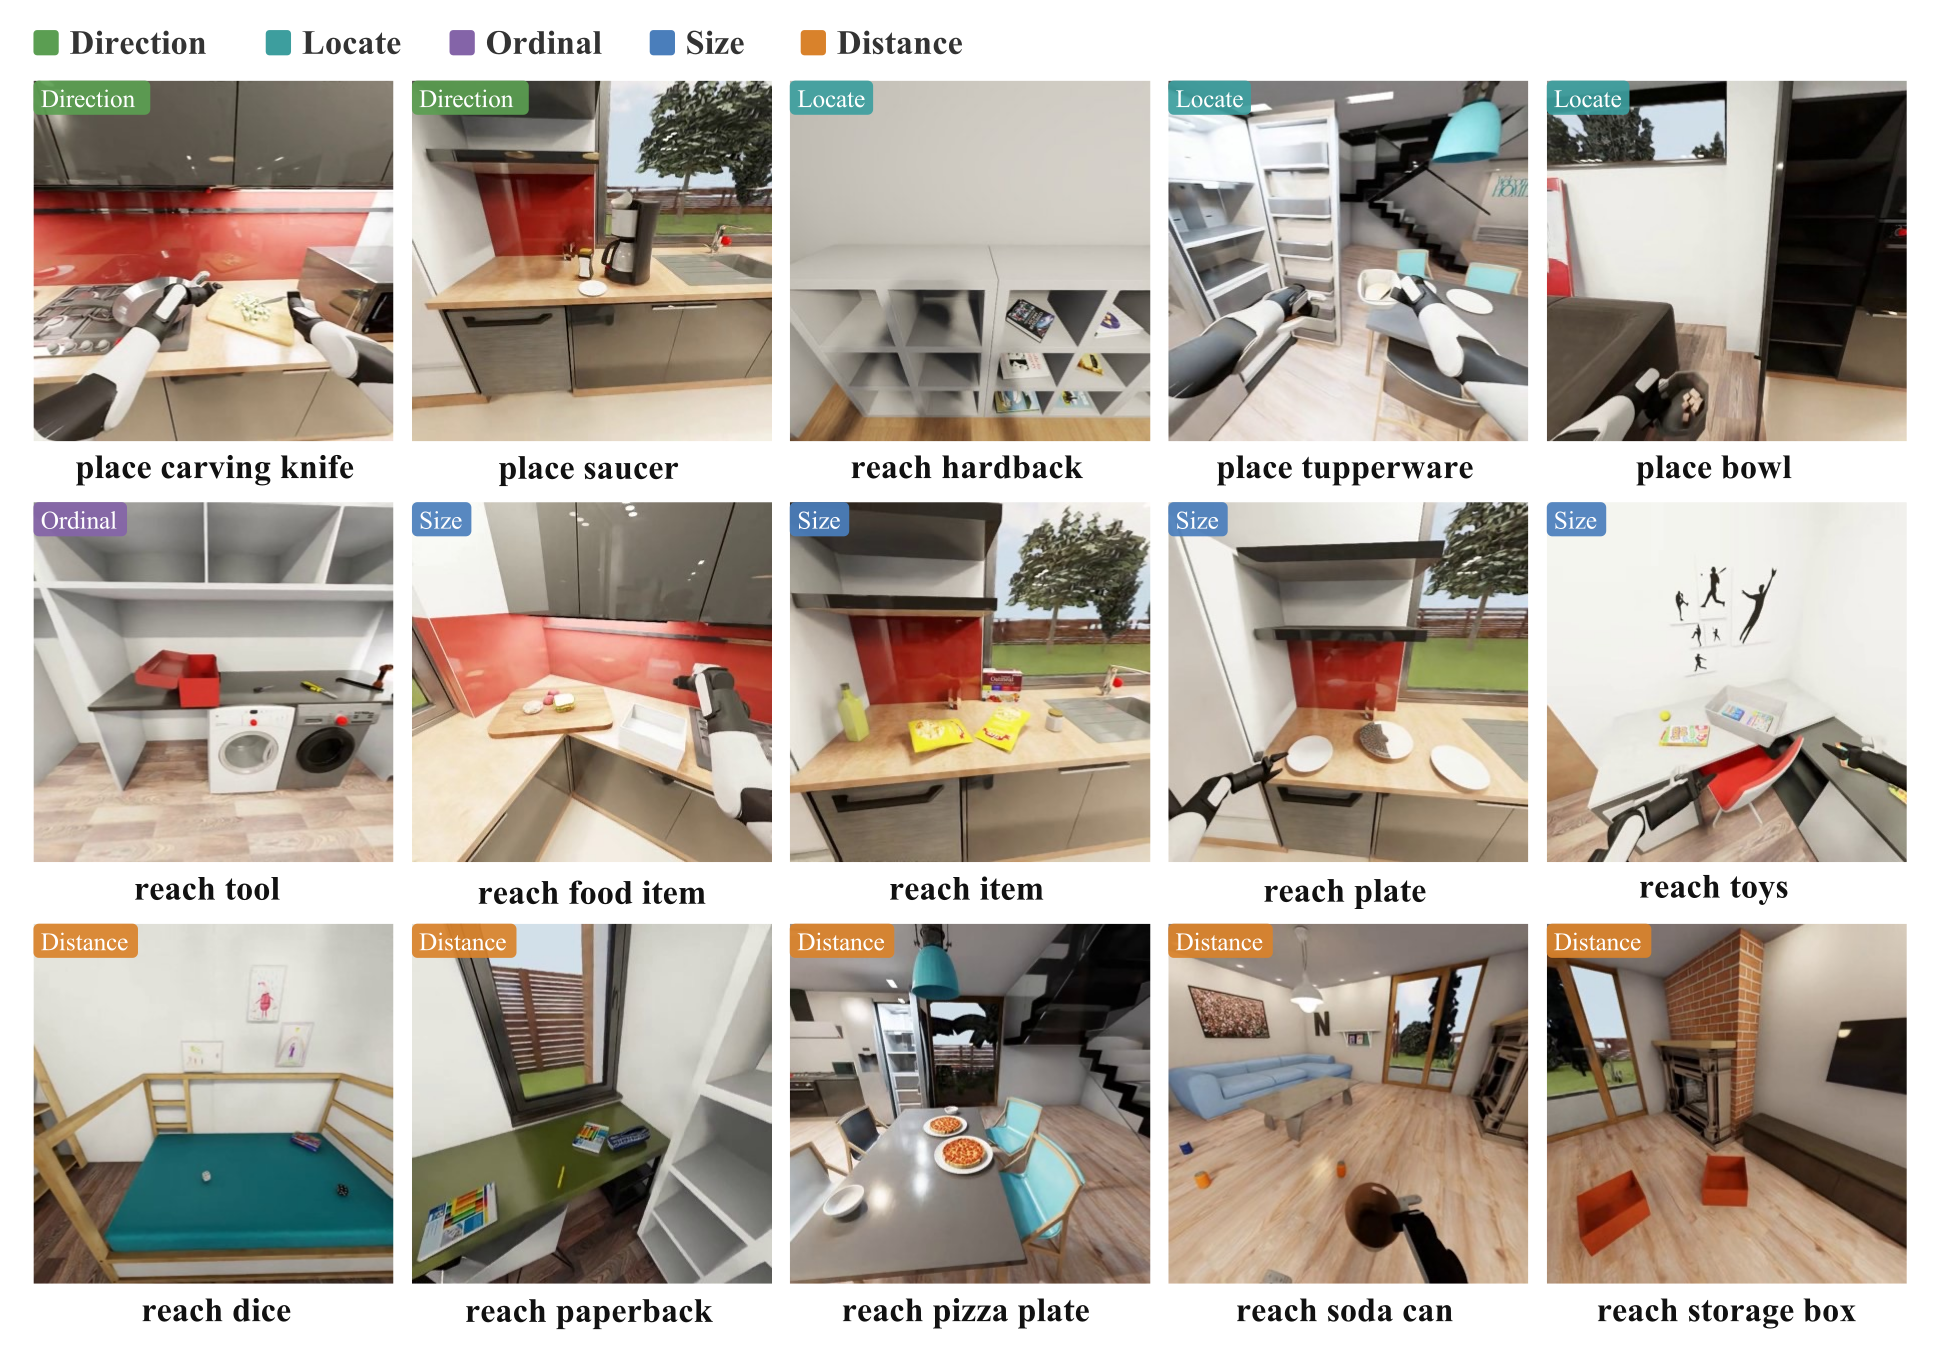
The full inventory contains fourteen evaluated manipulation tasks plus one training-only saucer task, and ten navigation goals. Instructions change relation or reference object; navigation instead changes validated starts. All task counts, variant combinations, context order and source-demonstration routes are preserved. Navigation tours are manually curated per environment and can encode a familiar route direction.
Appendix C Additional Model Training and Evaluation Details
Appendix C retains complete architecture adaptation, hyperparameters, target-rendering equations and evaluation-start construction, with all geometric maps.
C.1 Policy Adaptation and Initialization
The 4.54B backbone stays frozen in baseline; 0.30B expert/projections train from scratch. Rank-16, alpha-16 LoRA on every language/vision linear layer adds 39M parameters with no dropout. DROID uses its step-160k expert/projections, 23-dimensional padded joint actions and 32 horizon. No change of backbone weights is implied by this initialization control.
Original mathematical definition and protocol
We add LoRA adapters (rank 16, , no dropout, initialized to zero) to every linear layer of the language model and vision encoder. This adds 39M trainable parameters (0.9% of the backbone), trained jointly with the baseline’s trainable components.
Original mathematical definition and protocol
We initialize from step 160k of DROID pretraining (frozen VLM, joint-position actions padded to 23 dimensions, horizon 32, batch size 256, peak LR ), so the transferred weights reside in the action expert and projections. Finetuning is otherwise identical to the baseline.
C.2 Training Setup
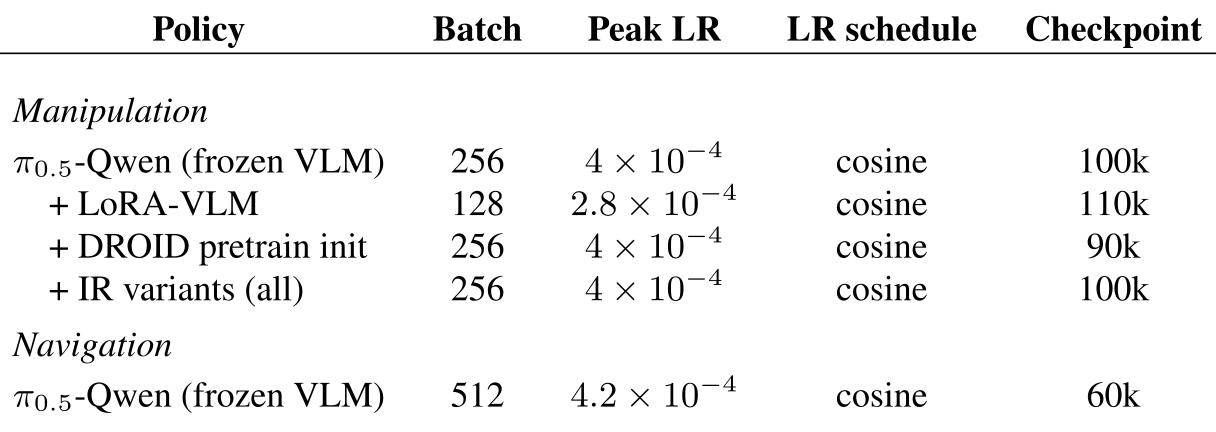
AdamW beta (.9,.95), no decay, clipping 1, bf16, no EMA and 4k warmup apply on four GPUs. Tasks sample uniformly, including training-only saucer. Baseline/core IR use batch 256, peak LR 4e-4, step 100k; LoRA uses 128, 2.8e-4, 110k; DROID 256, 4e-4, 90k. Navigation uses 512, 4.2e-4, 60k. Nearby step counts do not equalize number of sampled examples.
Original mathematical definition and protocol
Table S3 lists the training hyperparameters. All runs use AdamW (), no weight decay, gradient clipping at 1.0, bf16 without EMA, 4k steps of linear warmup, an action horizon of 32, and four GPUs. Manipulation tasks are sampled uniformly from the 14 benchmark tasks plus one training-only saucer task; navigation samples uniformly over its 10 tasks.
C.3 Oracle Intermediate Representation Construction
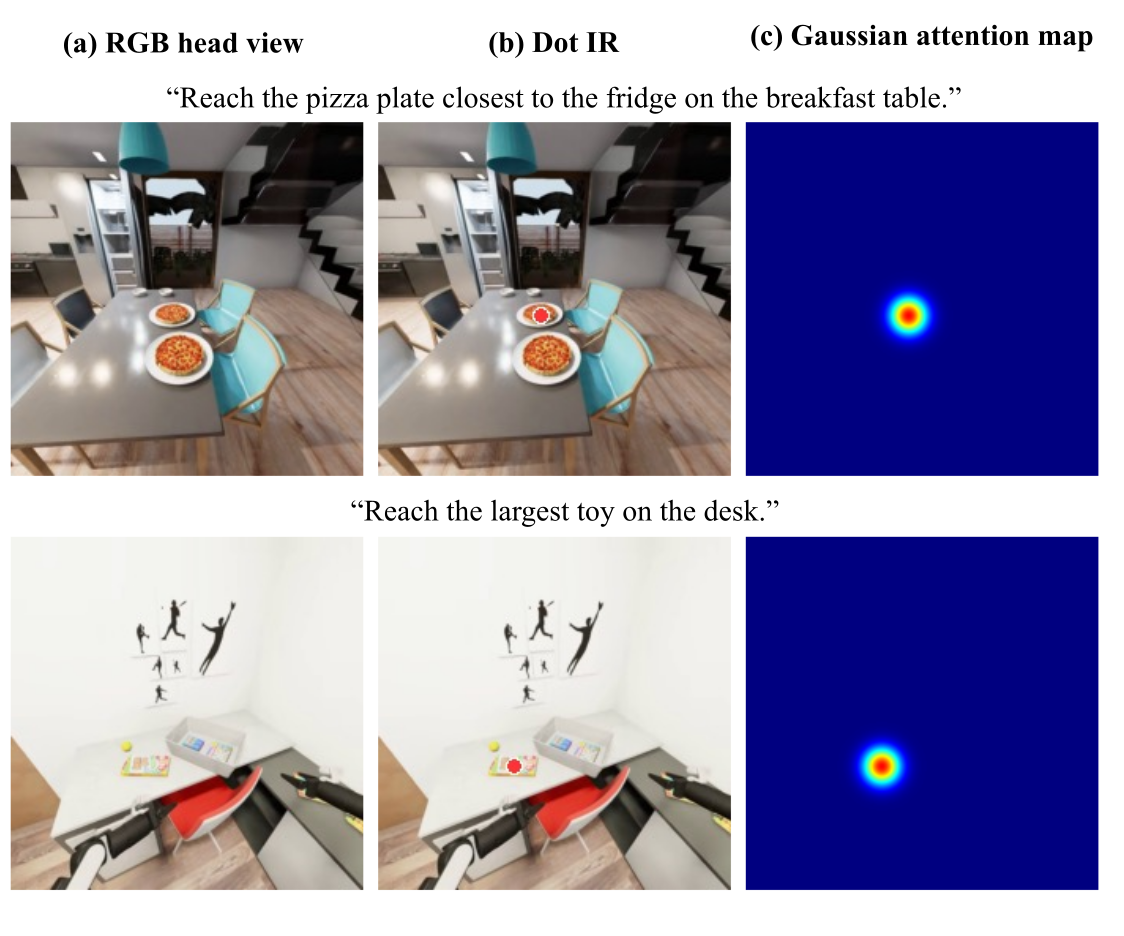
Reach cues track the current 3D box; placement cues fix the final demonstration destination in world coordinates. Projected/clipped box midpoint is rounded on 224-square images without an occlusion mask, so an occluded target can still receive a cue. Dot rendering adds a 4-pixel red disk with white outline to an extra RGB image. Heatmaps use sigma 8, unit peak, rounded 8-bit values and a jet lookup over [0,.875], with no RGB underlay. Invalid projections produce no dot or uniform blue. Current cues reproject each observation; anchor cues retain the initial marked image.
Original mathematical definition and protocol
The oracle IR policy variants receive simulator-derived grounding images during both training and evaluation. For reaching tasks, the reference tracks the target object’s current 3D bounding box. For placement tasks, we fix the box at the object’s destination in the final demonstration frame and reproject this fixed world-space reference through the current head camera. Thus, the placement cue marks the goal location throughout the episode. We project the box corners using the camera intrinsics and extrinsics, clip the resulting 2D bounding box to the image boundaries, and take its integer midpoint. We scale this coordinate to the policy image and round to the nearest pixel. The reference is geometric and does not use an occlusion mask; an occluded target can therefore retain a cue.
Original mathematical definition and protocol
We resize the head-camera RGB image to before drawing a filled red marker (RGB ) of radius 4 pixels with a 1-pixel white outline at the target coordinate. When no valid target projection is available, the image contains no marker. The annotated image is supplied as an additional input alongside the original head and two wrist-camera images.
Original mathematical definition and protocol
For a target coordinate , we construct
Equation S1
| (S1) |
Original mathematical definition and protocol
on the same grid. The Gaussian has unit peak and is not normalized to sum to one. We quantize its values as and map them to RGB using a 256-entry analytic jet lookup table sampled over . This produces a dark-blue background (RGB ) and a red peak (RGB ). An invalid projection produces a uniform dark-blue image. The map is a standalone image without an RGB underlay and occupies the same additional image-input slot as dot IR. See Figure S5 for the difference.
C.4 Policy Evaluation Instance Construction
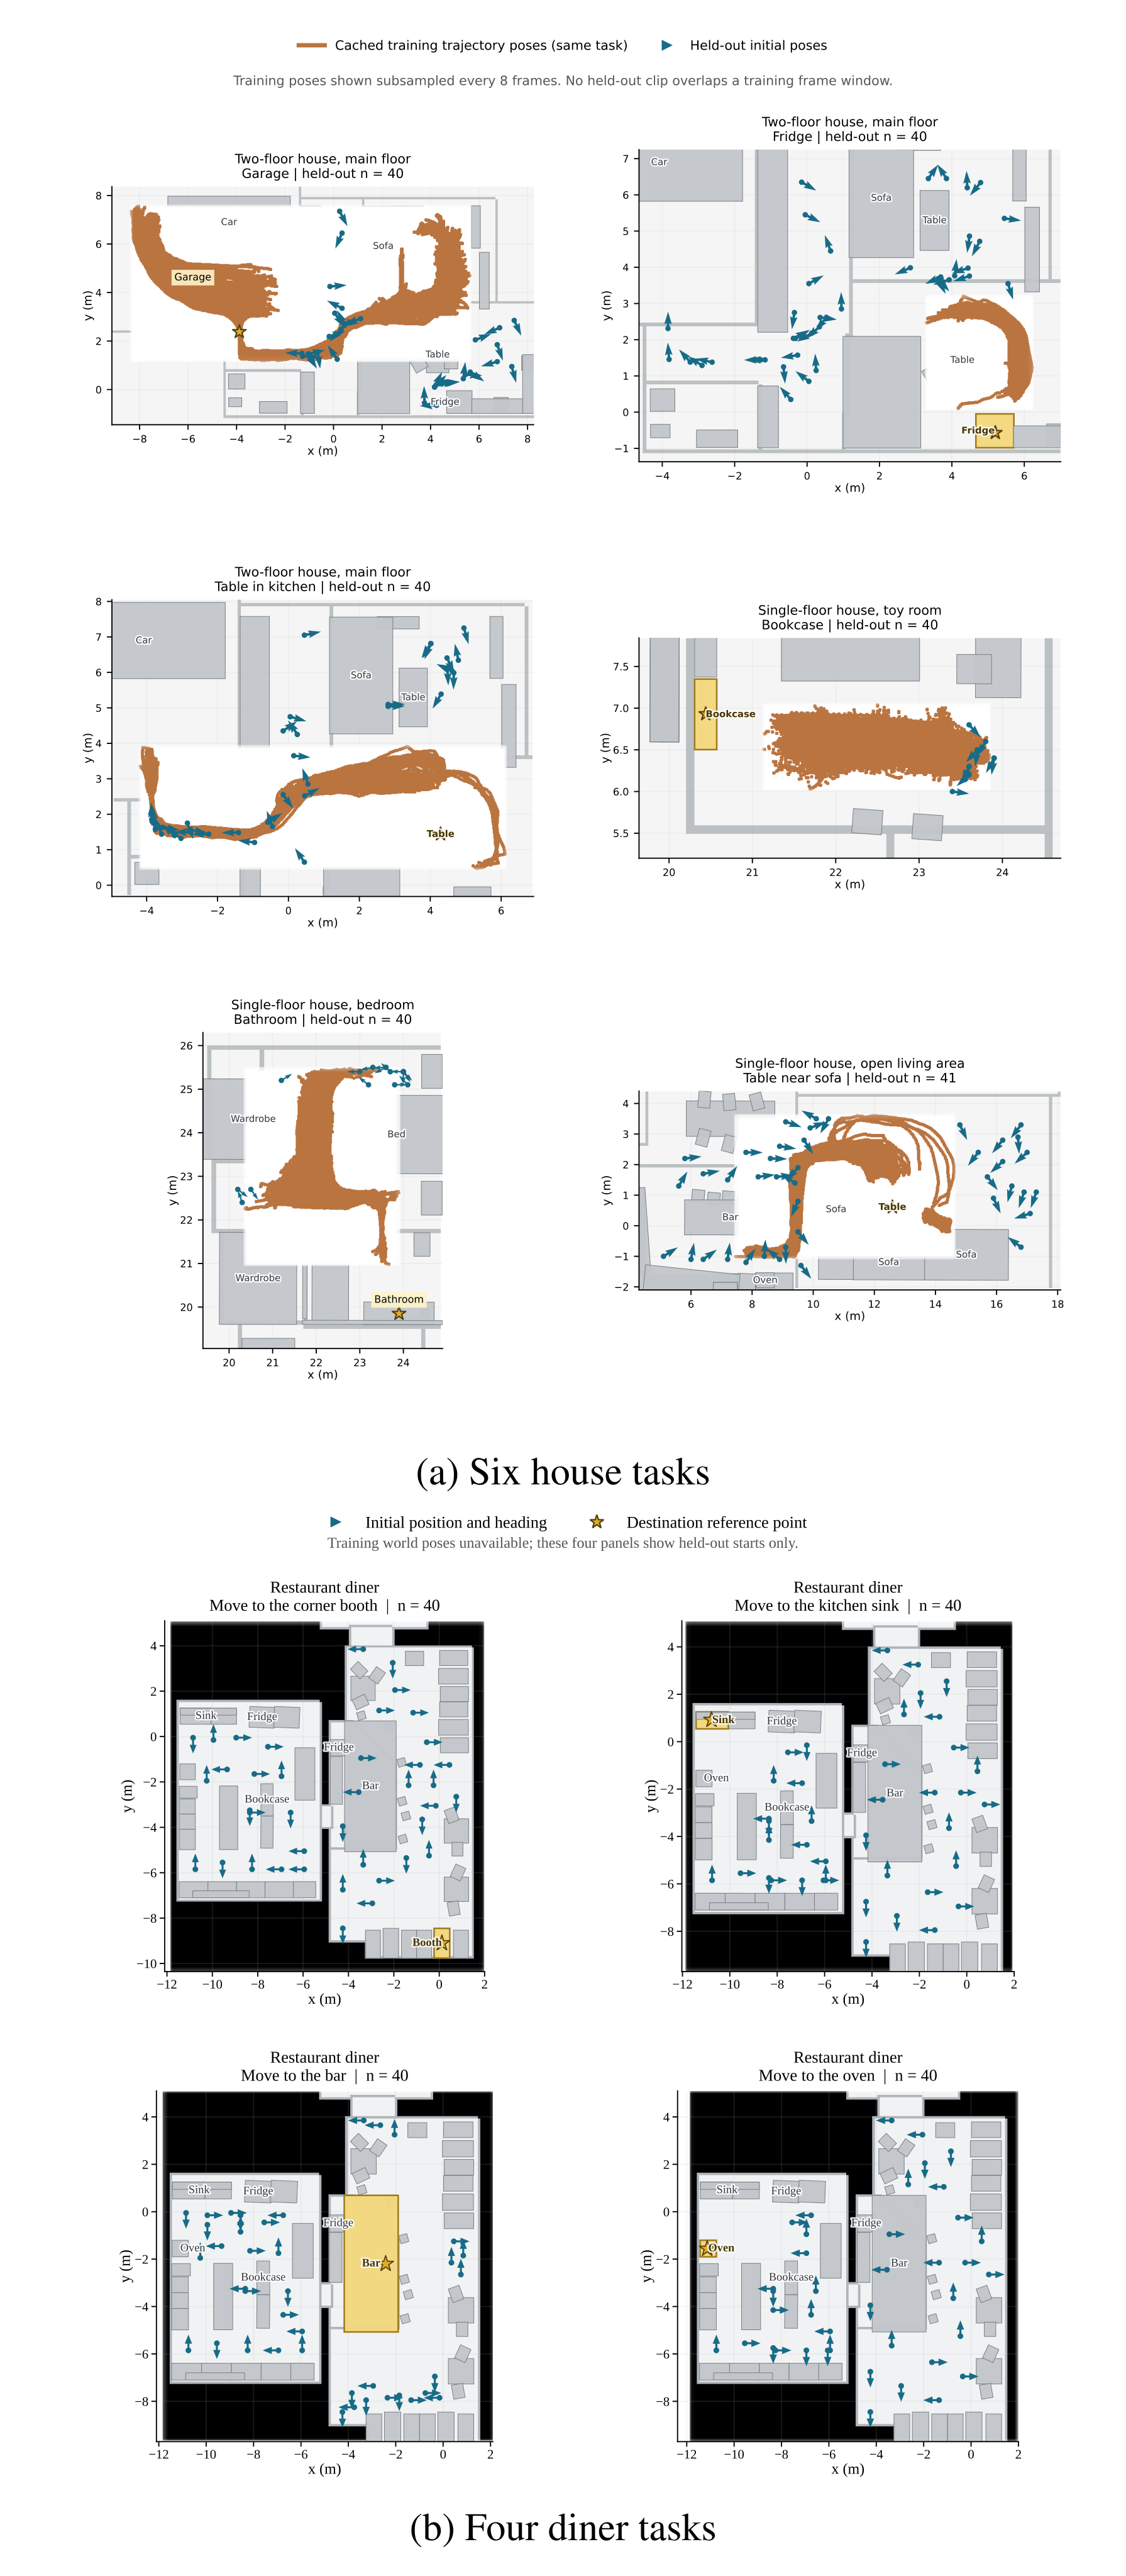
Navigation varies initial position/orientation and rejects unstable spawn states. Schematic furniture bounding-box projections contextualize starts but are not exact collision boundaries. House panels show cached training coverage; diner training poses are unavailable. Spawn validation does not by itself ensure equal route difficulty across tasks.
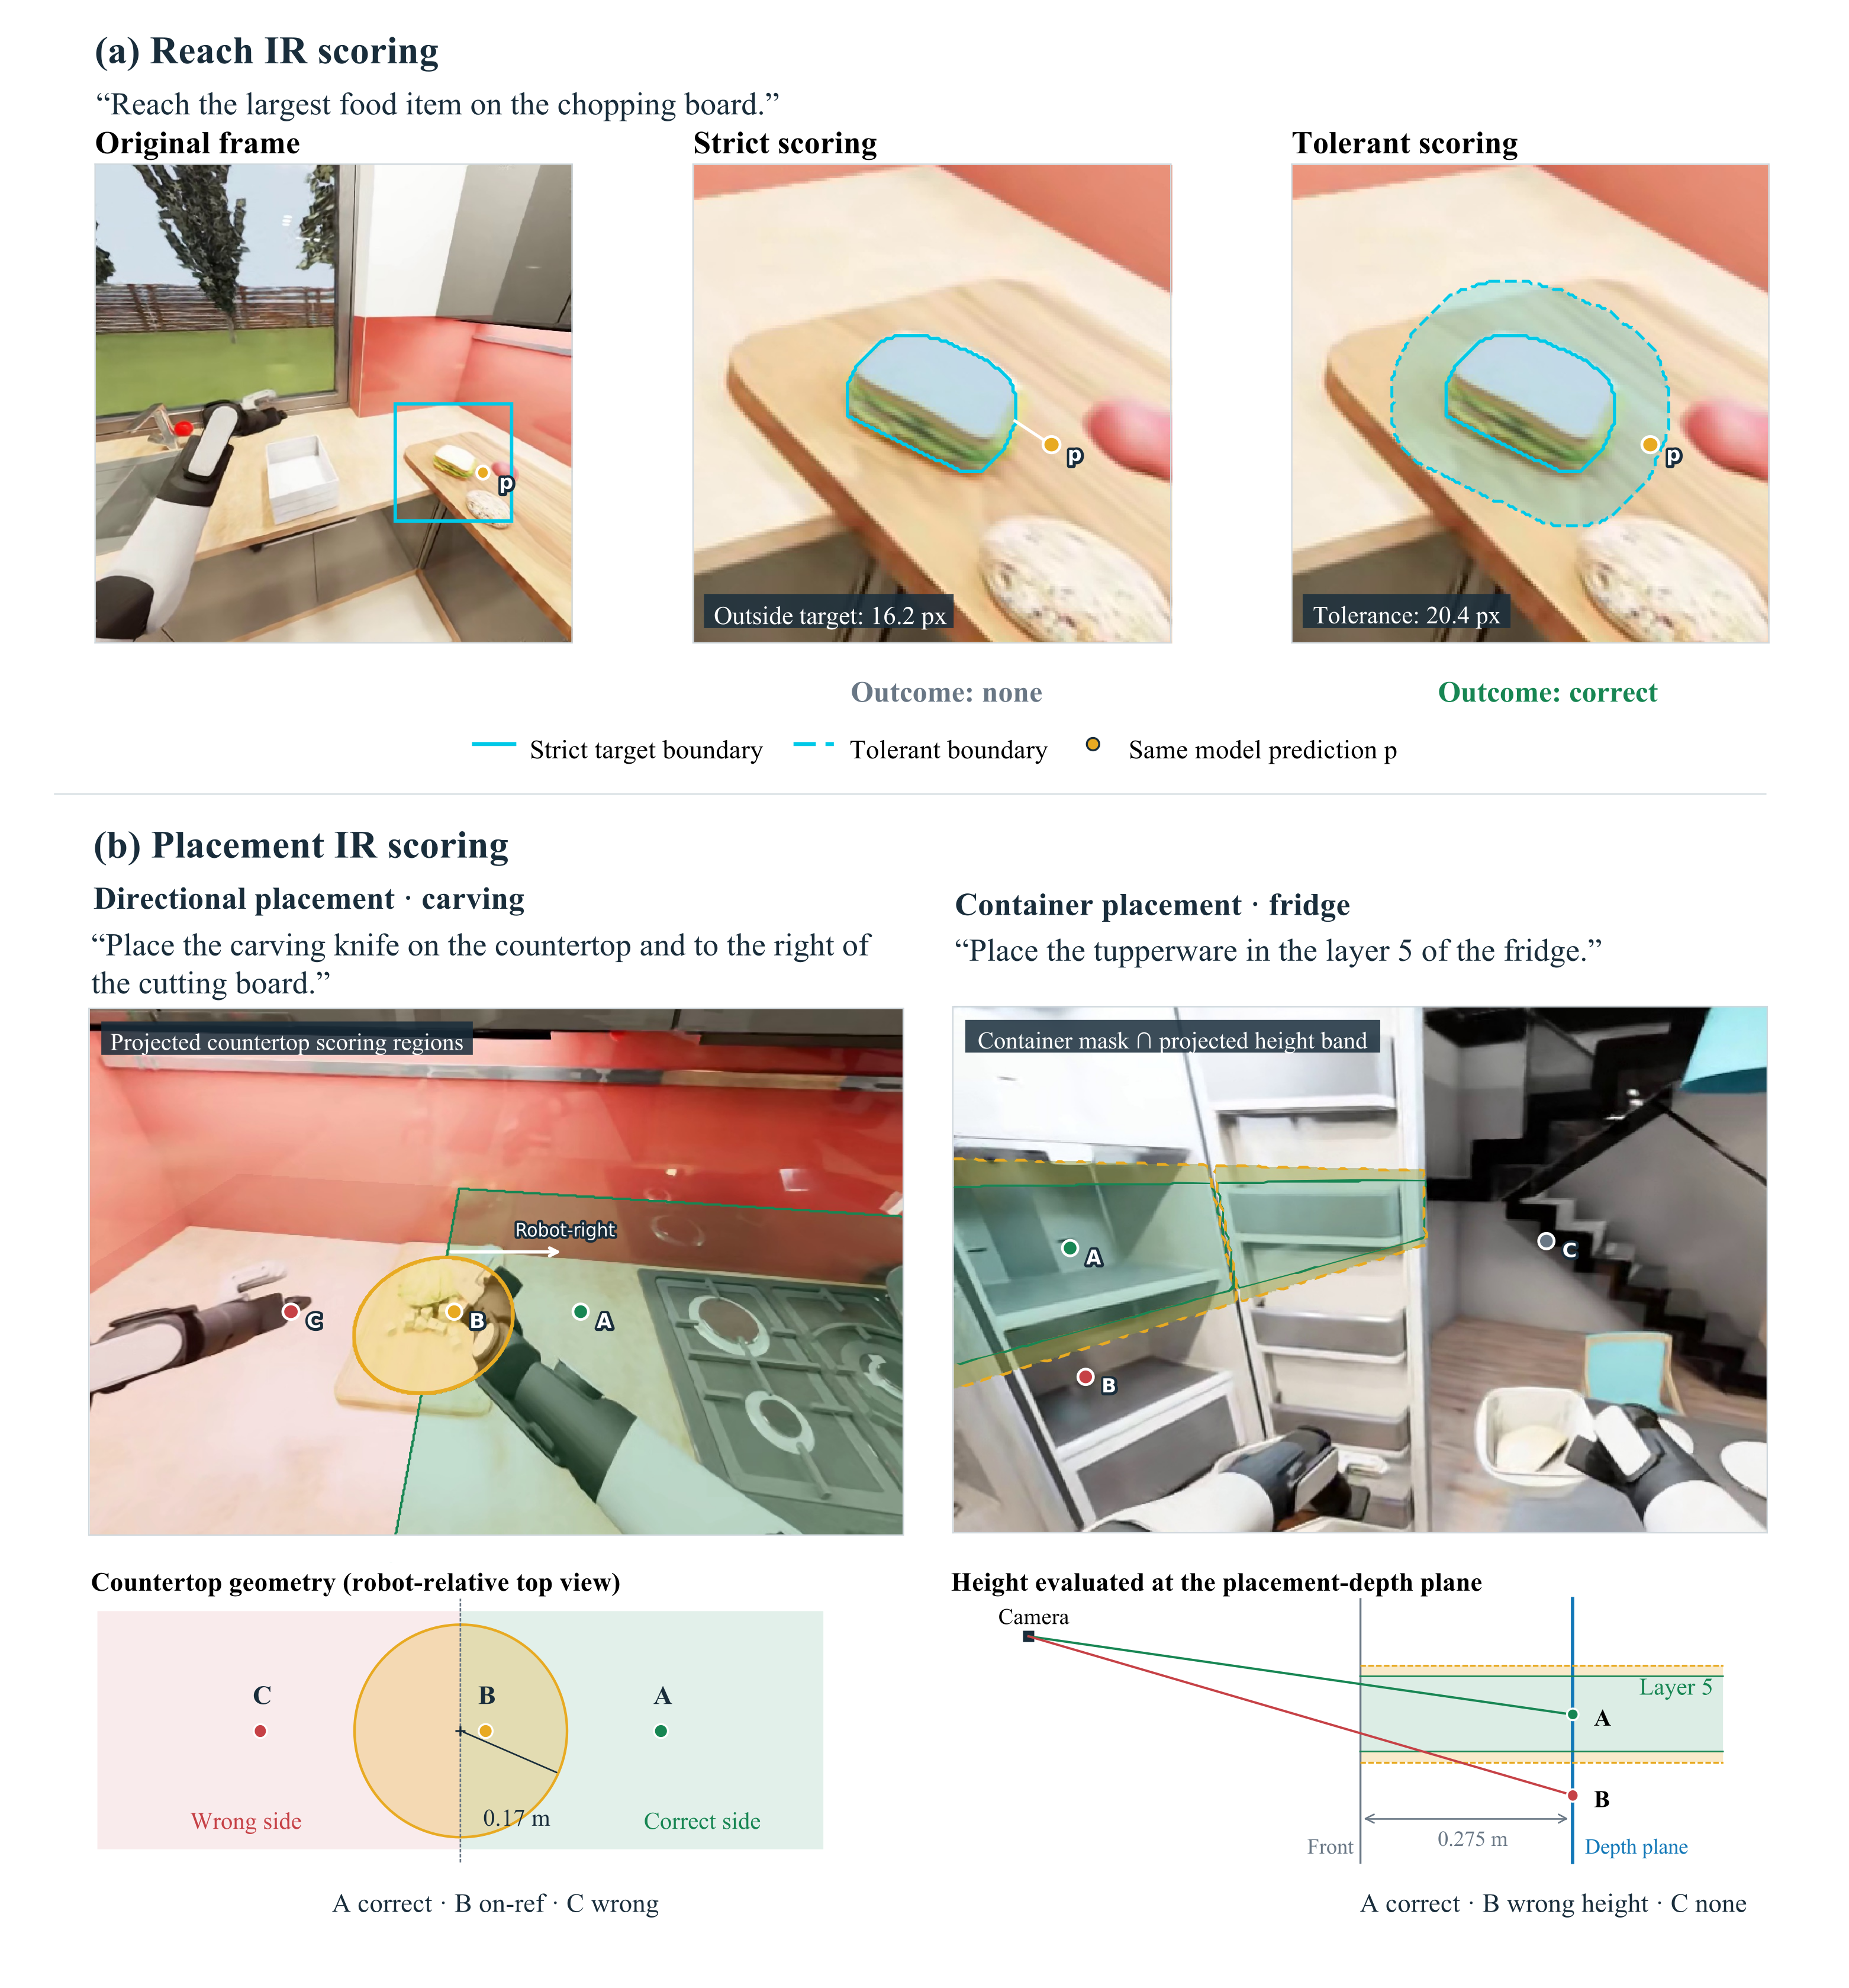
Appendix D Evaluation Scoring Details
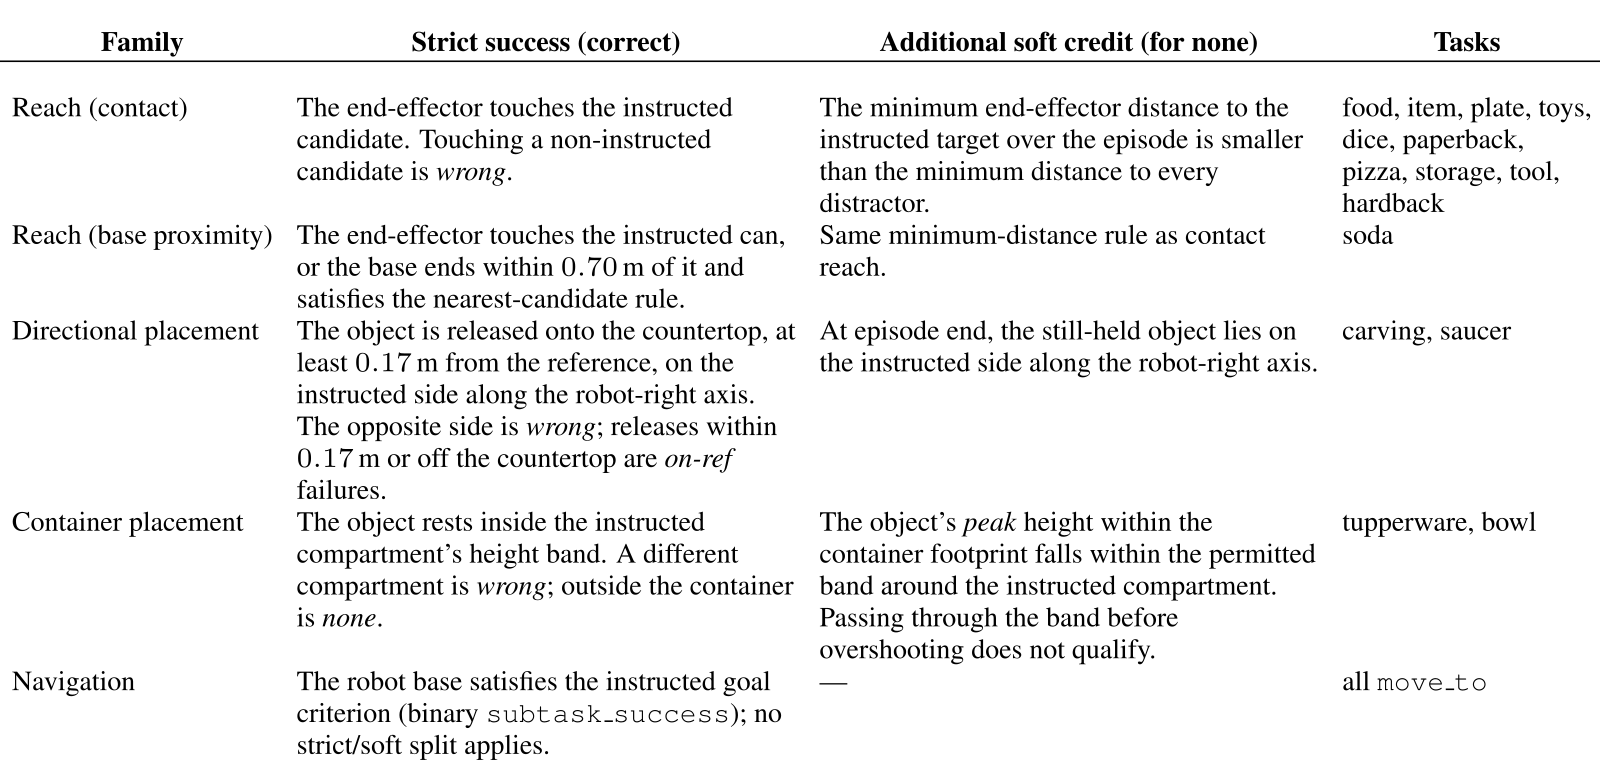
The full family-specific scoring table and definitions remain. Reach strict credit requires target contact, with a soda-can base-proximity exception; soft noncommitment compares each candidate’s minimum end-effector distance over time, potentially attained at different moments. Placement uses release/side or compartment-rest criteria, with specified still-held/peak-height soft credit. Wrong releases, on-reference outcomes and floor drops are treated separately. Point tolerance expands reach regions by about 2% of the image diagonal, not placement regions; directional placement uses a .17m exclusion band and container placement plus/minus .05m at the ray-volume intersection.
Original mathematical definition and protocol
Predicted target points are evaluated against annotated target regions derived from instance segmentation. Predictions assigned to an accepted target region are labeled correct, those assigned to a non-target object are labeled wrong, and unassigned or unparseable predictions are labeled none. Tolerant scoring additionally accepts points within approximately 2% of the image diagonal of the target region (approximately 20 pixels for a image), while preserving all strictly correct predictions. Tolerance expansion applies only to reach tasks. See Figure S7 (a) for illustration.
Original mathematical definition and protocol
For directional placement, the predicted point defines a camera ray whose intersection with the countertop determines the placement location. Its projection onto the robot-right axis determines whether it lies on the instructed side of the reference. Locations within m of the reference center receive an on-ref outcome and no correct credit; off-surface predictions are incorrect. For container placement, the ray is intersected with the container volume, and its entry height is compared with the instructed compartment’s height band ( m). The reported manipulation IR average weights each of the 14 evaluated tasks equally. See Figure S7 (b) for illustration.
Original mathematical definition and protocol
The soda-can task additionally accepts base proximity within m under a nearest-candidate rule. Commitments to non-instructed candidates or locations count as wrong-target outcomes. Released on-ref outcomes count as failures. Soft credit captures observable target-consistent progress; it does not directly establish a policy’s internal grounding decision.
Accessible table, original values and citation links
| Family | Strict success (correct) | Additional soft credit (for none) | Tasks |
|---|---|---|---|
| Reach (contact) | The end-effector touches the instructed candidate. Touching a non-instructed candidate is wrong. | The minimum end-effector distance to the instructed target over the episode is smaller than the minimum distance to every distractor. | food, item, plate, toys, dice, paperback, pizza, storage, tool, hardback |
| Reach (base proximity) | The end-effector touches the instructed can, or the base ends within m of it and satisfies the nearest-candidate rule. | Same minimum-distance rule as contact reach. | soda |
| Directional placement | The object is released onto the countertop, at least m from the reference, on the instructed side along the robot-right axis. The opposite side is wrong; releases within m or off the countertop are on-ref failures. | At episode end, the still-held object lies on the instructed side along the robot-right axis. | carving, saucer |
| Container placement | The object rests inside the instructed compartment’s height band. A different compartment is wrong; outside the container is none. | The object’s peak height within the container footprint falls within the permitted band around the instructed compartment. Passing through the band before overshooting does not qualify. | tupperware, bowl |
| Navigation | The robot base satisfies the instructed goal criterion (binary subtask_success); no strict/soft split applies. | — | all move_to |
Appendix E VQA and Point-Grounding Evaluation Prompts
All fourteen original prompt components remain verbatim in copyable blocks, including spatial conventions, context-tour wording, exact option formatting and normalized integer-point JSON. Their unusual depth-direction convention is retained explicitly.
E.1 VQA Evaluation Prompts
Prompts concatenate observation preamble, response format, applicable geometry rules and question/options. The source calls a farther object 'in front of' a nearer one, an explicitly instructed convention rather than ordinary occlusion language. Grids/layers count bottom-up, columns left-right. Task-navigation instructions replace the general camera-direction block with robot-centric quadrants and distinguish earlier tour views from the final current view; hidden targets still have directions.
Answer the question based on the given image(s).
Answer with the option’s letter and text from the given
choices directly.
Example: if you think the correct answer is ’C.front’
from ’A.above B.under C. front D.behind.’, your response
should only be ’C.front’.
Spatial Understanding Rules:
- Use the camera’s perspective as the reference frame
for all spatial relationships (unless explicitly stated
otherwise).
- Front/Back: The object that appears farther from the
camera (deeper into the scene) is considered "in front of"
the object that appears closer to the camera. The object
closer to the camera is at the "back" of the farther
object.
- Left/Right: Defined from the camera’s viewpoint.
An object located on the left side of the image relative
to another object is considered "left of" that object,
and similarly for right.
- Above/Below: Determined by relative vertical position
in the scene.
Locate Question Rules:
- Grid Positions (Row x Column): Rows are counted from
bottom to top. Columns are counted from left to right.
For example, "1x1" is the bottom-left grid, "2x3" is the
second row from the bottom and third column from the
left.
- Layers: Counted from bottom to top of the container.
Layer 1 is the bottommost level (closest to the
floor/base), and higher layers are numbered sequentially
upward.
- Levels: Counted from bottom to top, described by their
relative height within the container. (e.g., "low level,"
"middle level," "high level," or specific numerical
levels)
- Please ONLY consider the internal space and
organizational structure of the specific container
mentioned in the question.
Camera Distance Question Rules:
- When questions refer to "the camera", note that the
robot hand visible in the image is NOT the camera.
The camera is the viewpoint from which the image was
captured, which is separate from any robot hand or
manipulator visible in the scene.
- Distance is defined along the view trace from the
camera to the 3Dcenter of the object.
These are consecutive observations from the head camera
of a robot. Answer the question based on the given images.
The robot is rotating in place. The images show different
viewpoints as the robot turns.
The robot is navigating through the environment.
The images show the robot’s observations as it moves.
You are looking through the head camera of a mobile
robot.
All images except the last one are a CONTEXT TOUR:
earlier views recorded while moving through this
environment. Use them to learn where things are.
They were NOT taken from the robot’s current
position.
The LAST image is the robot’s CURRENT camera view.
All answers are relative to the robot’s current position
and heading in that last image.
Definitions (robot-centric, top-down):
- FRONT = the direction the camera is facing;
BACK = directly behind the robot.
- LEFT / RIGHT = the robot’s left and right when facing
forward.
- The target may be OUT OF VIEW (behind the robot, or
behind a wall). It still has a direction. Locate the
target from the tour, locate the robot from the current
view, and answer with the quadrant the target lies in.
Question: {question}
Options: {options}
E.2 Point-Grounding Evaluation Prompts
Pointing requires exactly one integer x/y on a 0–1000 scale and forbids null or multiple points, even when uncertain. Object and placement descriptions differ; layer instructions add a bottom-up hint. This forced-choice interface contributes to wrong points and makes unparseable responses distinct from valid but incorrect localization.
The robot’s task is: {instruction}
{layer_hint}
Predict the center of the target in the frame:
{target description}.
Output the spatial coordinate of the center as x, y
(integer coordinates normalized to a 0-1000 scale).
You must provide a valid prediction for the target ---
do not return null or empty values.
Predict exactly ONE point: x and y must each be a single
integer, never a list. If multiple objects are plausible,
commit to the single most likely one.
Respond ONLY with valid JSON in the exact format shown
below. Do not include any other text.
Example: {"results": {"target":
{"x": <int>,
"y": <int>}}}
the object that the robot must reach or manipulate
to accomplish this task
the target location where the robot must place the
object it is holding to accomplish this task
Layers are counted from bottom to top: for example,
"layer 5" is the fifth layer from the bottom of the fridge.
Appendix F Additional Experimental Analyses
Appendix F retains all extracted-backbone tests, perception/rollout examples, execution details, exact API methods, code-agent protocols, correlations, predicted-point controls, augmentation/scaling tables and navigation results.
F.1 Extracted VLA Backbones on Spatial VQA
Extracted OpenHelix and π0.5 achieve 9.6/0.9% under this particular four-option interface. Invalid answers count incorrect, so these results combine response validity and spatial answer correctness; they do not isolate catastrophic forgetting or knowledge loss.
Original mathematical definition and protocol
The extracted OpenHelix and backbones attain 9.6% and 0.9% single-frame accuracy under the tested VQA interface. Because invalid answers are scored as incorrect, these scores combine answer correctness with the ability to produce a valid option.
F.2 Qualitative Perception Examples
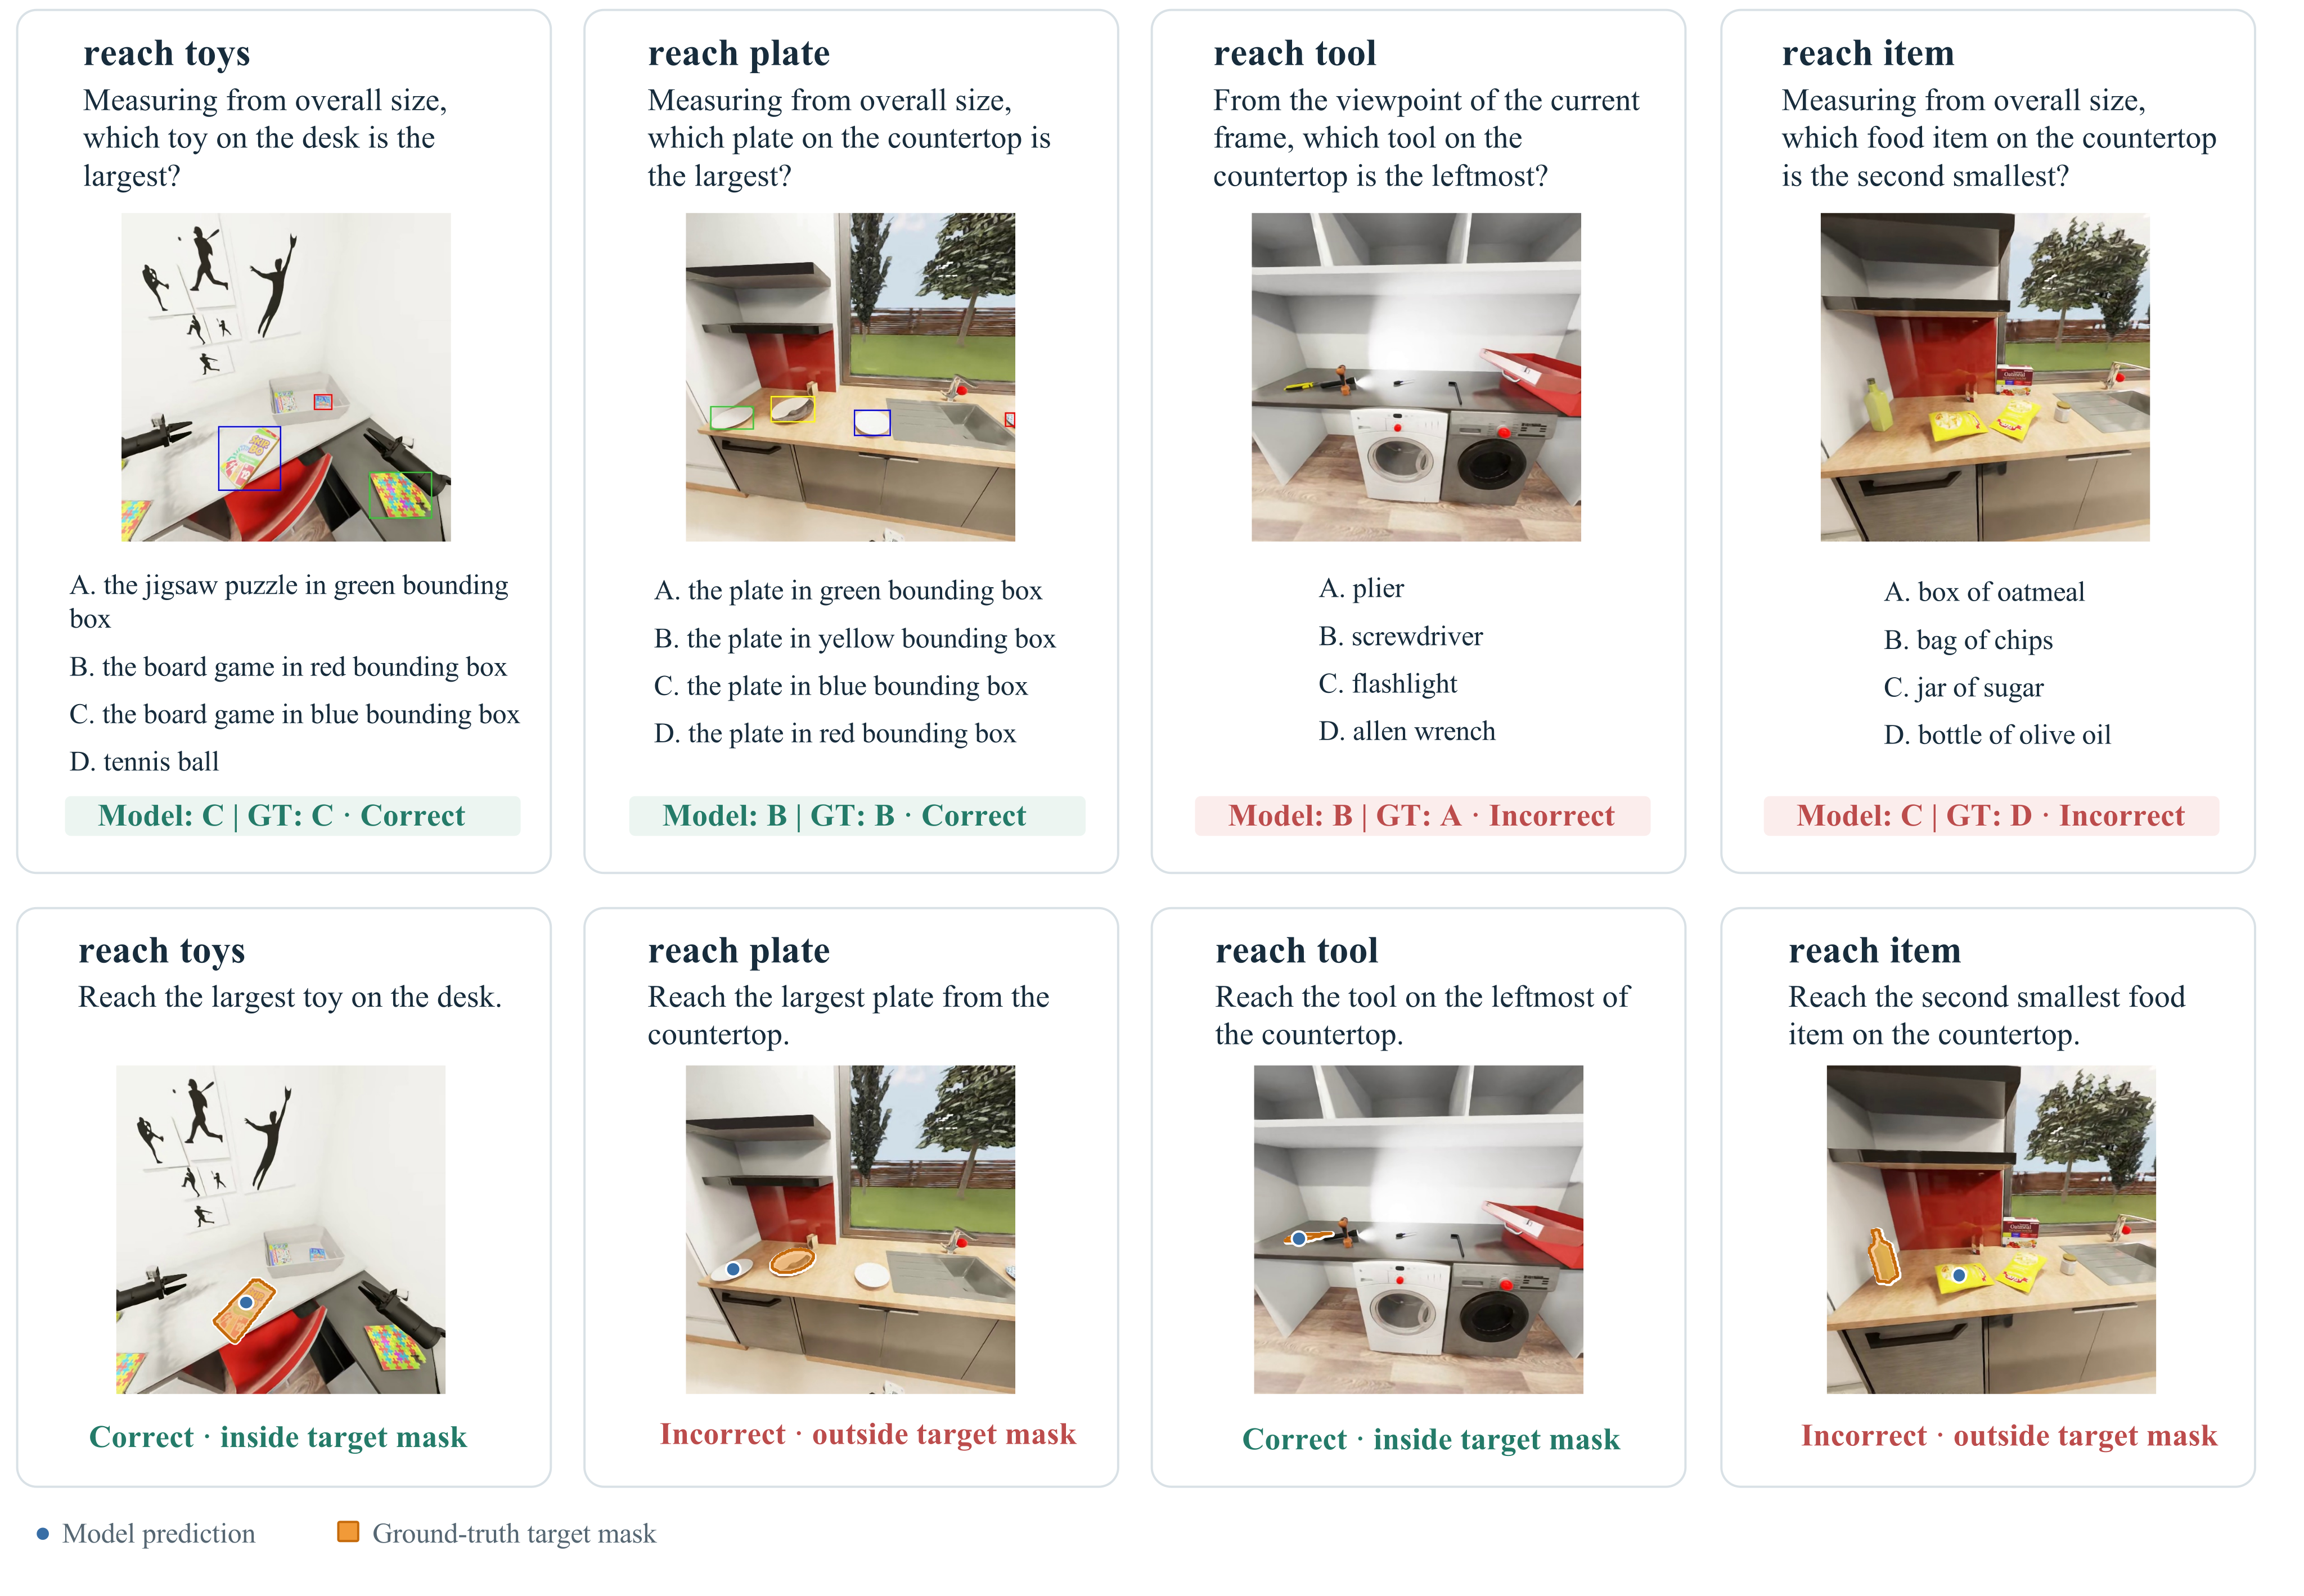
All eight paired VQA/pointing examples remain, including both correct, either-only correct and both wrong. Orange masks are evaluator references, blue points model outputs. These selected examples illustrate dissociation, not independent accuracy estimates.
F.3 Policy Execution and Checkpoint Selection
Chunks index actions from their observation timestamp, so late arrival skips early actions. Replan threshold ten is not a fixed ten-step commitment period. Up to three committed plans average non-gripper dimensions with almost equal .330/.333/.337 weights; grippers use the newest covering chunk, which may differ from the committed one. Fallback clamps the last chunk or repeats the prior action before commitment. Checkpoints differ at 90k/100k/110k updates.
Original mathematical definition and protocol
Non-gripper dimensions, including the mobile base, are averaged over the entries of a three-entry commitment history whose horizons cover the current step. The weights are , with ordered oldest to newest and ; for , they are approximately . Gripper commands instead come from the newest chunk covering the current step, which need not be the committed one. If no committed entry covers the current step, the controller uses the most recently committed chunk with its index clamped to the horizon. Before any chunk is committed, it repeats the last action.
F.4 Per-Task Baseline Results
The complete fourteen-task baseline table preserves denominators, strict/soft/wrong rates and candidate count, apparent size and training-data covariates. These correlate with difficulty but are not adjusted causal effects. Soft 70.8% versus strict 29.2% for knife placement differs from bowl’s 15%/15% with 77.5% wrong targets.
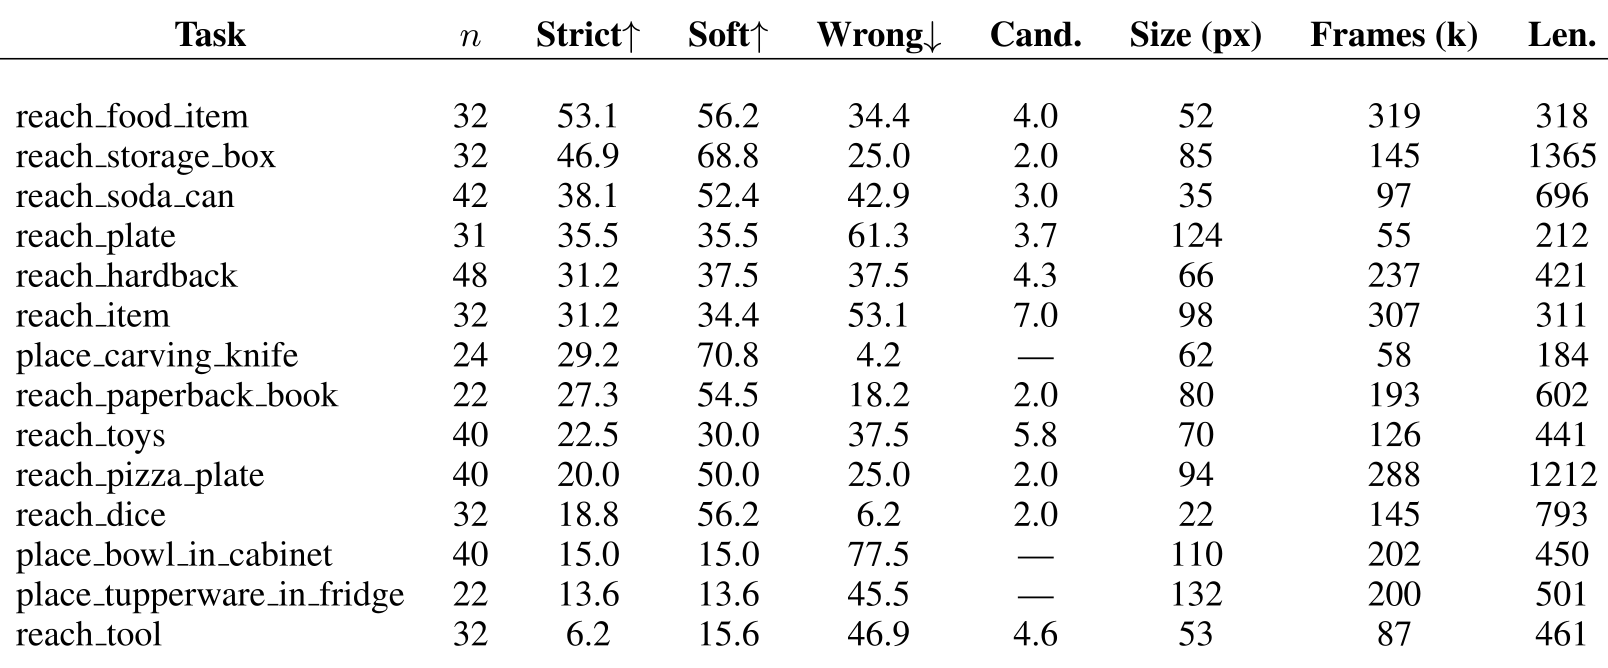
Accessible table, original values and citation links
| Task | Strict | Soft | Wrong | Cand. | Size (px) | Frames (k) | Len. | |
|---|---|---|---|---|---|---|---|---|
| reach_food_item | 32 | 53.1 | 56.2 | 34.4 | 4.0 | 52 | 319 | 318 |
| reach_storage_box | 32 | 46.9 | 68.8 | 25.0 | 2.0 | 85 | 145 | 1365 |
| reach_soda_can | 42 | 38.1 | 52.4 | 42.9 | 3.0 | 35 | 97 | 696 |
| reach_plate | 31 | 35.5 | 35.5 | 61.3 | 3.7 | 124 | 55 | 212 |
| reach_hardback | 48 | 31.2 | 37.5 | 37.5 | 4.3 | 66 | 237 | 421 |
| reach_item | 32 | 31.2 | 34.4 | 53.1 | 7.0 | 98 | 307 | 311 |
| place_carving_knife | 24 | 29.2 | 70.8 | 4.2 | — | 62 | 58 | 184 |
| reach_paperback_book | 22 | 27.3 | 54.5 | 18.2 | 2.0 | 80 | 193 | 602 |
| reach_toys | 40 | 22.5 | 30.0 | 37.5 | 5.8 | 70 | 126 | 441 |
| reach_pizza_plate | 40 | 20.0 | 50.0 | 25.0 | 2.0 | 94 | 288 | 1212 |
| reach_dice | 32 | 18.8 | 56.2 | 6.2 | 2.0 | 22 | 145 | 793 |
| place_bowl_in_cabinet | 40 | 15.0 | 15.0 | 77.5 | — | 110 | 202 | 450 |
| place_tupperware_in_fridge | 22 | 13.6 | 13.6 | 45.5 | — | 132 | 200 | 501 |
| reach_tool | 32 | 6.2 | 15.6 | 46.9 | 4.6 | 53 | 87 | 461 |
F.5 Code-as-Policy Agent Evaluation
Code-agent evaluation freezes programs after writer development/selection, while retaining closed-loop observations and tool calls at test time. All per-task results and pooled 469-episode denominators remain; the selected program and additional supervision differ from VLA training.
F.5.1 Program Development and Selection
Writers receive identical API/restriction/scoring/spatial context plus three recent exchanges. Ten development episodes include traces, images and privileged simulator outcome feedback. A mock check permits three attempts and fallback; reaching a 60-second/500-call screening cap still passes. One held-aside training-distribution validation selects the final program if strictly successful, otherwise the latest successful development version, otherwise even a failing final version. Validation does not guarantee success on the frozen test set.
F.5.2 Writer Implementation
The exact model identifiers, sampling/thinking settings and versions remain in the mathematical/protocol disclosure. Qwen writers use bf16 vLLM with temperature 1, top-p .95, top-k 20 and presence penalty 1.5. Proprietary writers use their stated high-thinking/reasoning modes. All share Molmo2-8B pointing and GPT-5 visual queries; writer category does not describe the entire perception stack.
Original mathematical definition and protocol
Qwen3.5-4B and Qwen3.5-9B use Qwen/Qwen3.5-4B and Qwen/Qwen3.5-9B, served with vLLM 0.19.1 in bf16. Both use thinking mode with the qwen3 reasoning parser, temperature 1.0, top- 0.95, top- 20, min- 0, and presence penalty 1.5.
F.5.3 Agent API
The full original API reference is retained, covering state/RGB/depth, camera projection/rays, pointing/VLM, base/end-effector/gripper/wait and logging. Coordinates are robot-base x-forward/y-left/z-up and must be re-expressed after base motion. Depth is optical-axis depth; projection samples a 5x5 median. End-effector moves do not control orientation. Automatic arm selection uses held-object state or target y. Exact errors, force-backoff behavior and allowed imports remain available.
Original mathematical definition and protocol
Programs define run(api) and interact with the robot only through the api object below. Positions are in metres in the robot base frame ( forward, left, up, origin on the floor under the robot); the frame moves with the robot, so positions must be re-expressed or re-observed after base motion. Cameras are head, left_wrist, and right_wrist. Perception and state calls do not advance simulated time; motion, gripper, and wait calls block until completion. Programs may import numpy, math, re, cv2, PIL, scipy, and the Python standard library.
Complete original robot API reference
- •
instruction: the natural-language instruction for the episode.
- •
get_state(): end-effector poses of both arms, gripper opening, grasp state, joint positions, and the current step.
- •
get_image(camera): the camera’s RGB image ().
- •
get_depth(camera): the camera’s depth image (metres along the optical axis, pixel-aligned with the RGB image).
Complete original robot API reference
- •
pixel_to_point(u, v, camera): the 3-D base-frame point seen at pixel , from the camera’s depth (median of a patch).
- •
point_to_pixel(p, camera): the pixel at which base-frame point appears, or none if behind the camera.
- •
pixel_to_ray(u, v, camera): the ray (origin, unit direction) through pixel .
Complete original robot API reference
- •
point_at(text, camera): image points for every instance of text in the current image, from an open-vocabulary pointing model (Molmo2-8B; prompt “Point to every {text} in the image.”, greedy decoding). text may be any description, including the full instruction.
- •
Complete original robot API reference
- •
approach(p, standoff, arm): turns the base to face point and drives until is standoff metres ahead (default 0.55), offset toward the reaching arm; returns re-expressed in the new base frame.
- •
move_base(dx, dy, dyaw): relative base motion; stops short if blocked.
- •
move_ee_to(p, arm, speed, use_torso): straight-line end-effector motion to point (orientation not controlled); use_torso lets the torso lean for extra reach.
- •
move_ee_by(d, arm, speed, use_torso): relative end-effector motion.
- •
open_gripper(arm), close_gripper(arm): gripper control.
- •
wait(seconds): hold still.
Original mathematical definition and protocol
Every motion call returns its success and, on failure, a reason (stalled: contact or reach limit; blocked: base obstructed; pushing: excessive force, after which the arm backs off; timeout). With arm="auto", the arm already holding an object is used; otherwise the left arm for targets with and the right arm otherwise.
Complete original robot API reference
- •
log(msg, **data): write to the episode log. Printed output is returned to the writer during development.
F.5.4 Execution and Evaluation
Computation, state and perception pause simulation; only blocking motion/gripper/wait advances it. There is no explicit test tool-call cap, network errors retry four times, and 900 seconds without a robot command stops computation. Nominal simulation budgets match VLA tasks, while wall-clock/computation conditions differ. The same strict/soft/wrong rules score all 469 held-out episodes; programs can branch/retry without writer revisions. Per-task whole-percent rounding differs from pooled count-based rates.
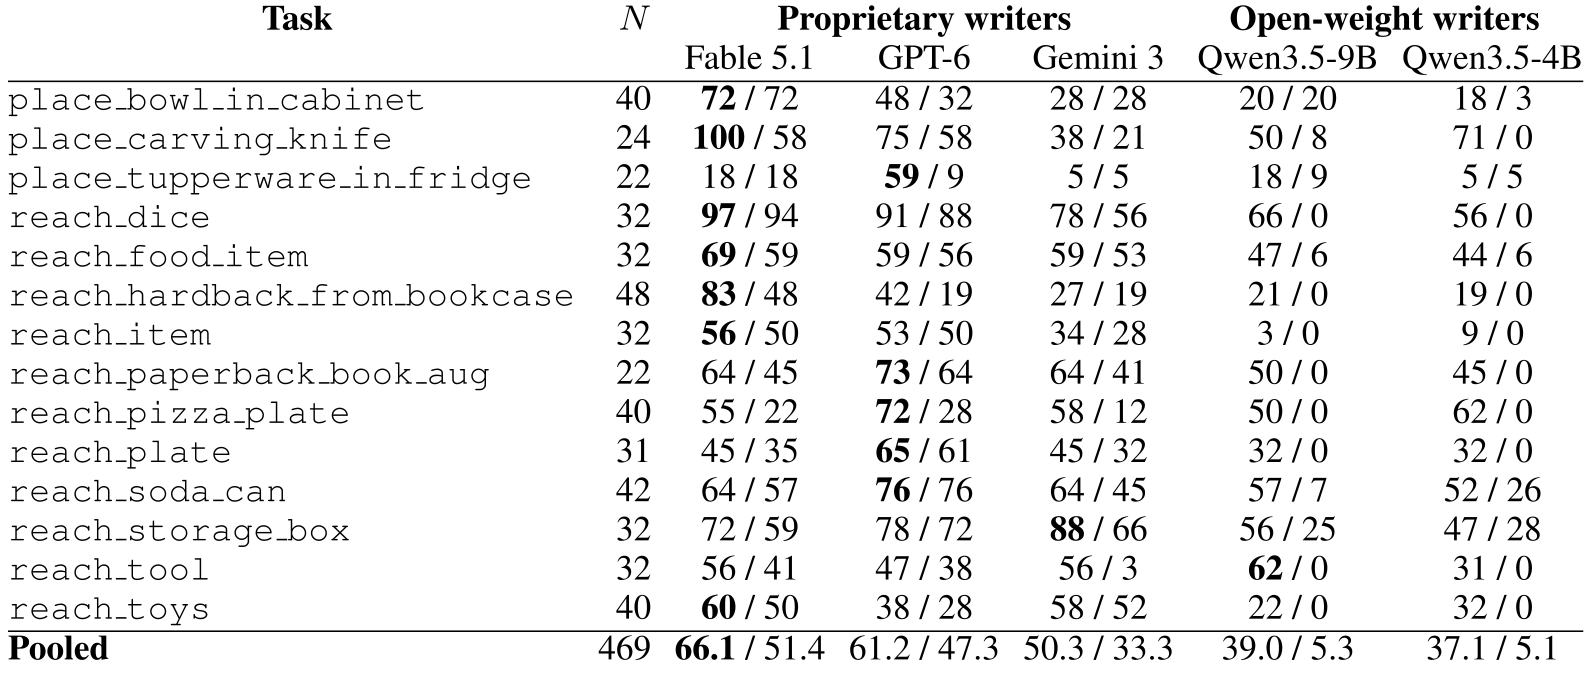
Accessible table, original values and citation links
| Task | Proprietary writers | Open-weight writers | ||||
|---|---|---|---|---|---|---|
| Fable 5.1 | GPT-6 | Gemini 3 | Qwen3.5-9B | Qwen3.5-4B | ||
| place_bowl_in_cabinet | 40 | 72 / 72 | 48 / 32 | 28 / 28 | 20 / 20 | 18 / 3 |
| place_carving_knife | 24 | 100 / 58 | 75 / 58 | 38 / 21 | 50 / 8 | 71 / 0 |
| place_tupperware_in_fridge | 22 | 18 / 18 | 59 / 9 | 5 / 5 | 18 / 9 | 5 / 5 |
| reach_dice | 32 | 97 / 94 | 91 / 88 | 78 / 56 | 66 / 0 | 56 / 0 |
| reach_food_item | 32 | 69 / 59 | 59 / 56 | 59 / 53 | 47 / 6 | 44 / 6 |
| reach_hardback_from_bookcase | 48 | 83 / 48 | 42 / 19 | 27 / 19 | 21 / 0 | 19 / 0 |
| reach_item | 32 | 56 / 50 | 53 / 50 | 34 / 28 | 3 / 0 | 9 / 0 |
| reach_paperback_book_aug | 22 | 64 / 45 | 73 / 64 | 64 / 41 | 50 / 0 | 45 / 0 |
| reach_pizza_plate | 40 | 55 / 22 | 72 / 28 | 58 / 12 | 50 / 0 | 62 / 0 |
| reach_plate | 31 | 45 / 35 | 65 / 61 | 45 / 32 | 32 / 0 | 32 / 0 |
| reach_soda_can | 42 | 64 / 57 | 76 / 76 | 64 / 45 | 57 / 7 | 52 / 26 |
| reach_storage_box | 32 | 72 / 59 | 78 / 72 | 88 / 66 | 56 / 25 | 47 / 28 |
| reach_tool | 32 | 56 / 41 | 47 / 38 | 56 / 3 | 62 / 0 | 31 / 0 |
| reach_toys | 40 | 60 / 50 | 38 / 28 | 58 / 52 | 22 / 0 | 32 / 0 |
| Pooled | 469 | 66.1 / 51.4 | 61.2 / 47.3 | 50.3 / 33.3 | 39.0 / 5.3 | 37.1 / 5.1 |
F.6 Task-Level Correlation Plots
Every scatter point is one of fourteen task-level aggregates; fitted lines are descriptive linear trends, whereas Table 3 reports Spearman ranks. Repeated task points across policy variants are not independent experimental units. The plotted associations do not show that improving question answering necessarily improves control.
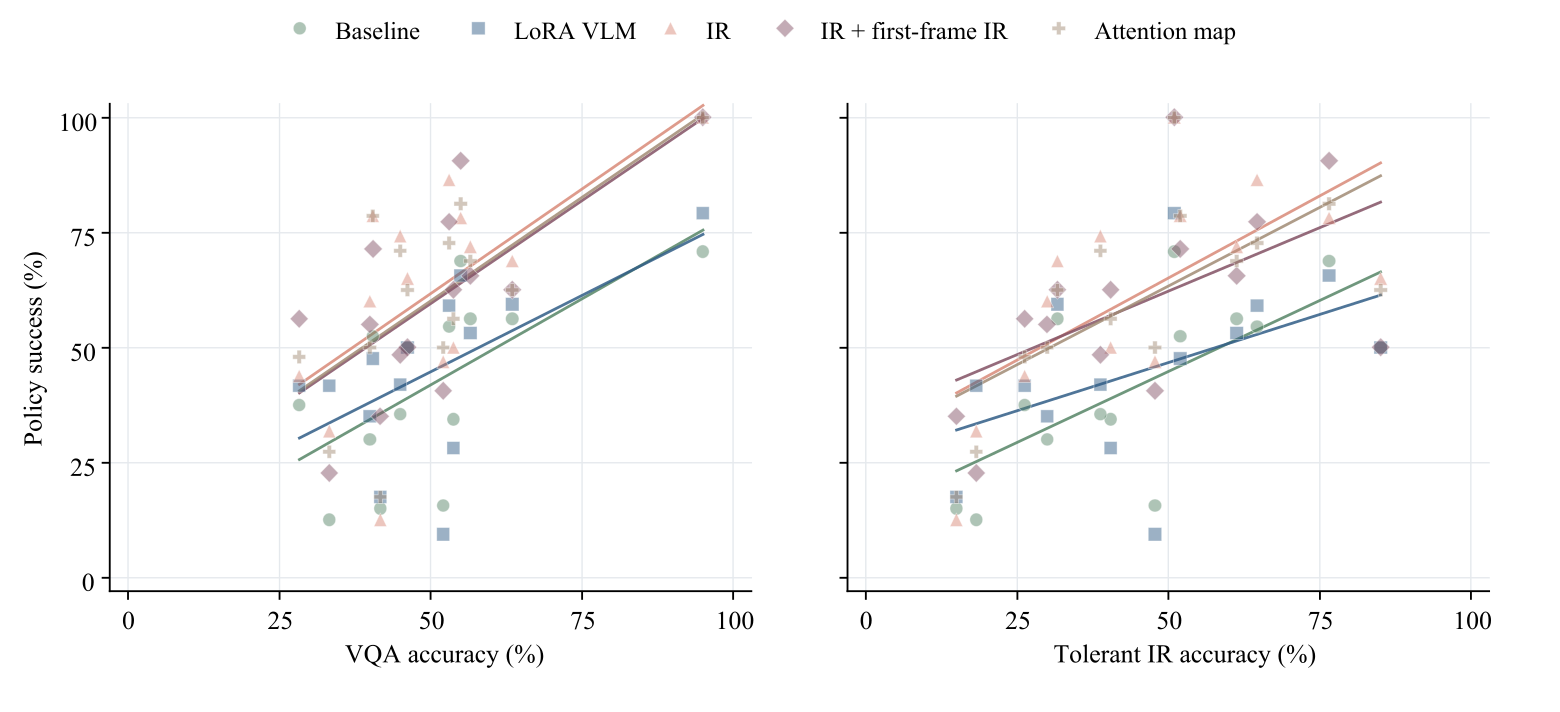
F.7 Ground-truth vs. VLM-Predicted IR at Rollout
A fixed oracle-trained dot policy receives current-frame predicted points from 512-square head images, rescaled to 224. Failed parsing yields an unmarked image without simulator fallback. Three grounding VLMs yield 47.1–48.8% soft and 33.5–34.5% strict success, recovering about 29–39% of oracle gain. Qwen9B has higher standalone strict IR but does not dominate rollout success; cue quality, task aggregation and control interaction all differ. Oracle training remains required here.
Original mathematical definition and protocol
To test whether explicit target conditioning remains beneficial with predicted grounding, we replace the simulator-derived dot at inference with a VLM-predicted point while keeping the oracle-trained dot-IR policy fixed. The grounding VLM receives the current head-camera image at resolution and the task instruction, and predicts the target object location for reaching or the destination for placement. The predicted point is rescaled to the policy image and rendered using the same dot interface. A failed prediction produces an unmarked image; simulator coordinates are not used as a fallback. We evaluate Qwen3.5-4B, Qwen3.5-9B, and Molmo2-8B as grounding VLMs, with the same Qwen3.5-4B policy in all three cases.
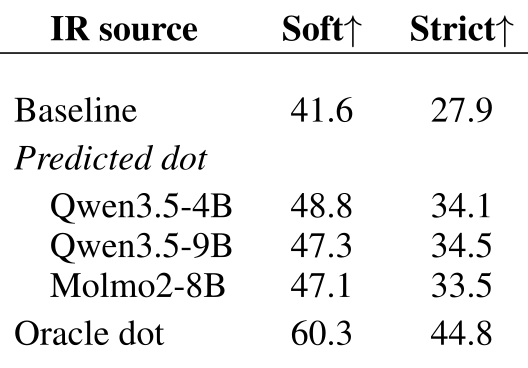
Accessible table, original values and citation links
| IR source | Soft | Strict |
|---|---|---|
| Baseline | 41.6 | 27.9 |
| Predicted dot | ||
| Qwen3.5-4B | 48.8 | 34.1 |
| Qwen3.5-9B | 47.3 | 34.5 |
| Molmo2-8B | 47.1 | 33.5 |
| Oracle dot | 60.3 | 44.8 |
F.8 Training-Distribution Case Study
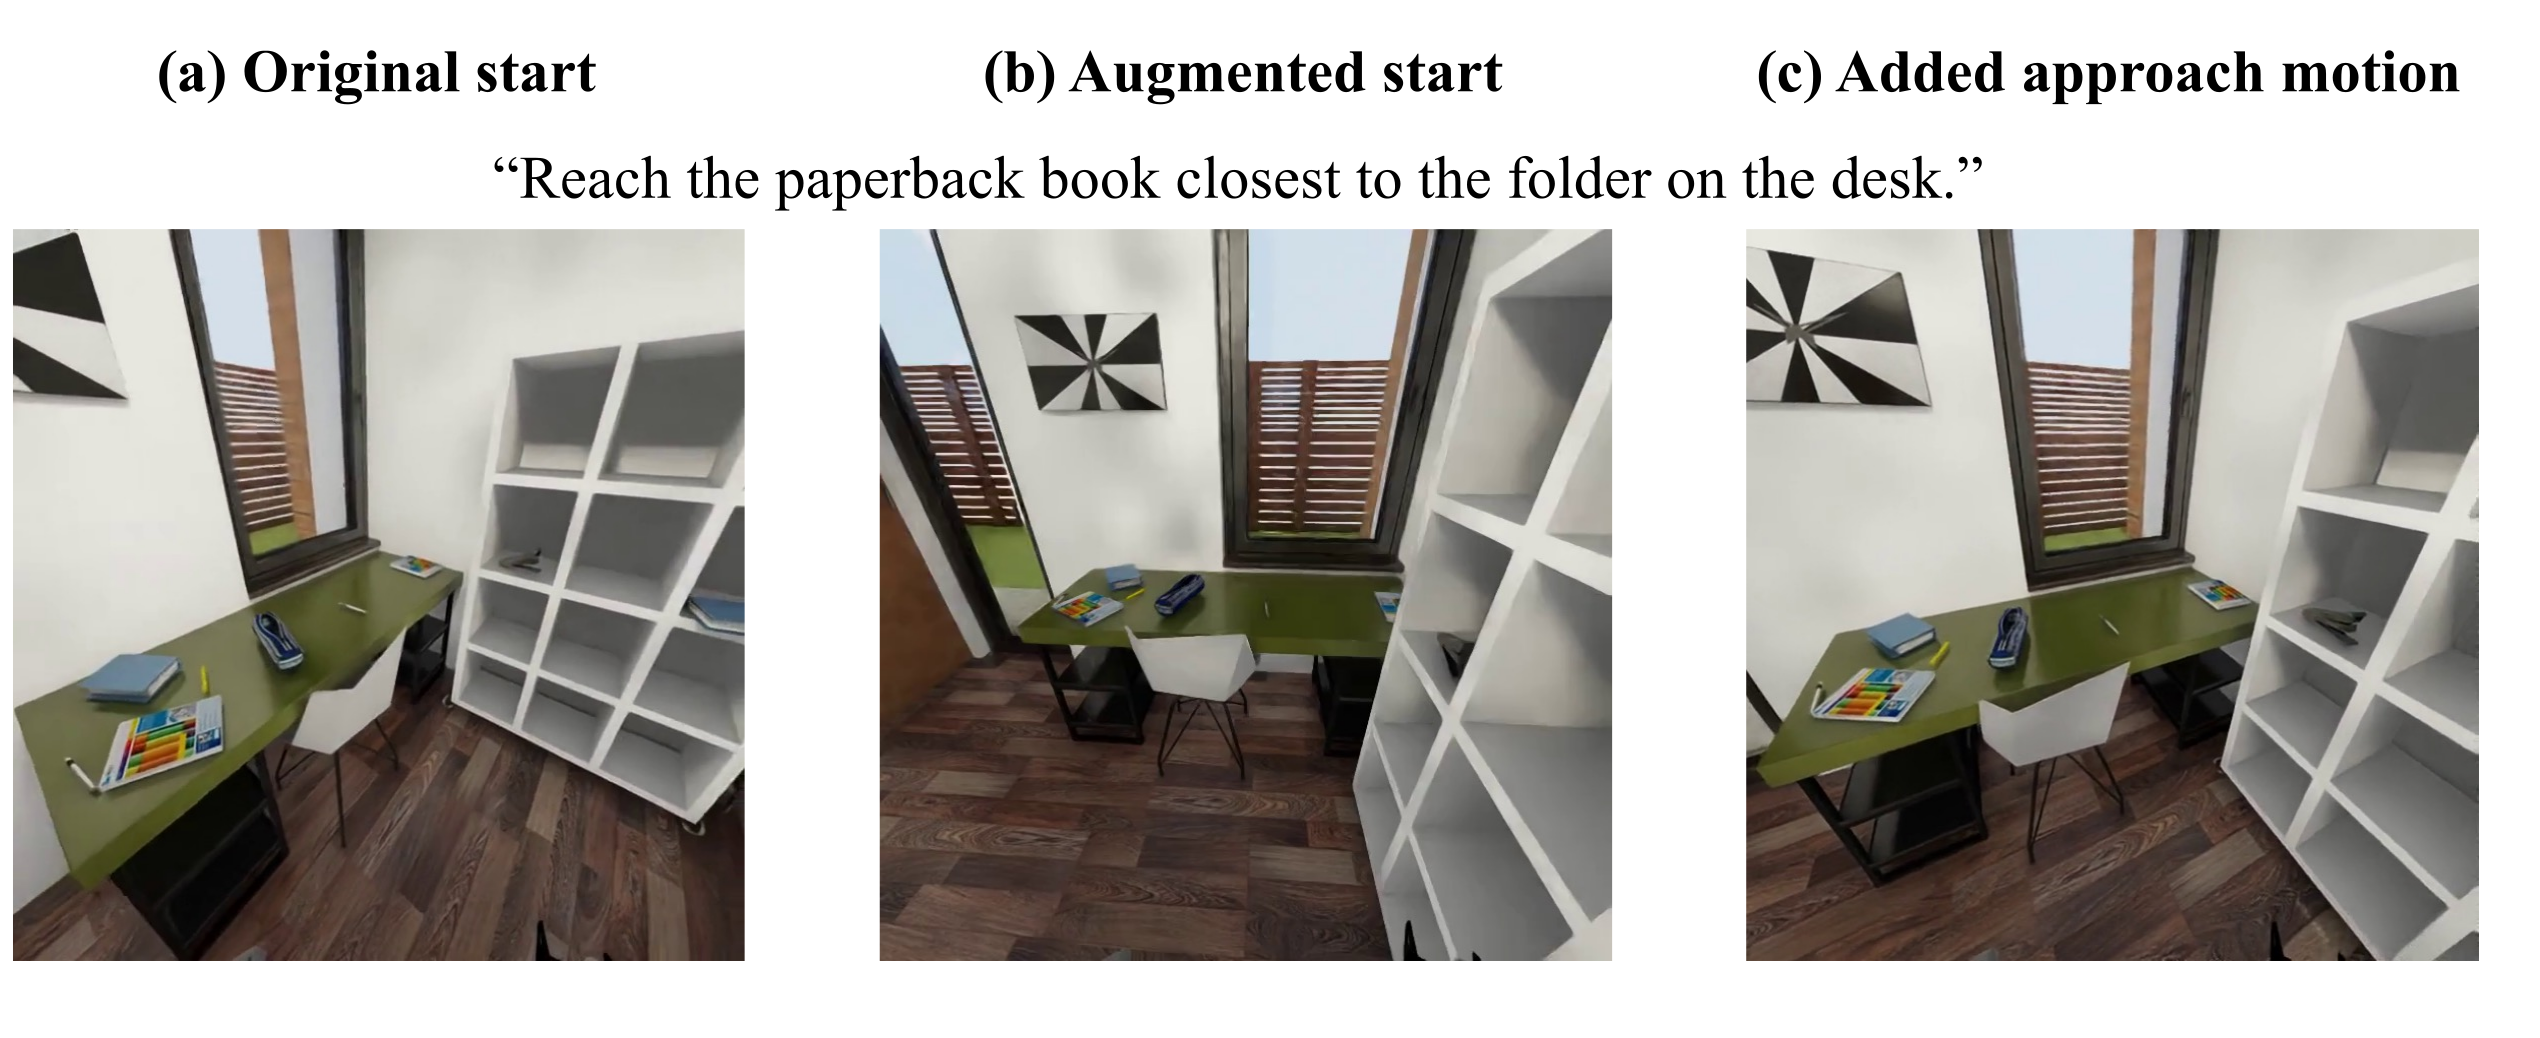
On a separate shared 69-case paperback probe, prefix approach motion reduces wrong-target rate 79.7→43.5% and raises soft 11.6→36.2%, leaving strict 10.1%. Main benchmark uses the augmented demonstrations. Added geometry, trajectory length and data exposure change together, so the result does not isolate removal of side bias or show improved completion.
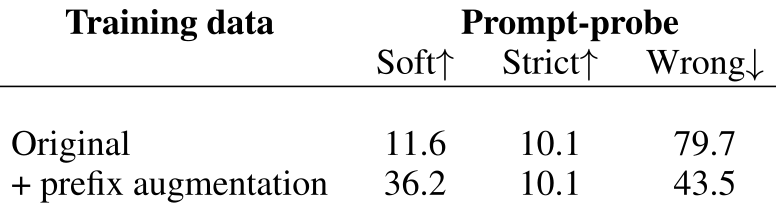
Accessible table, original values and citation links
| Training data | Prompt-probe | ||
|---|---|---|---|
| Soft | Strict | Wrong | |
| Original | 11.6 | 10.1 | 79.7 |
| + prefix augmentation | 36.2 | 10.1 | 43.5 |
F.9 Data Scaling
Nested task-balanced 30/50% subsets train for equal update counts, hence different repeat exposure. Full-data dot is best pooled, but 50% trails 30%, and bowl performs best with less data. Increased data changes both soft progress and strict completion; no universal monotonic scaling law follows. Full per-task strict/soft values retain regressions and ties.
Original mathematical definition and protocol
The full-data model achieves the highest pooled soft and strict success on both evaluation sets. From 30% to 100% data, held-out soft success increases from 56.1% to 60.3% ( percentage points), while strict success increases from 34.5% to 44.8% ( points). Prompt-probe soft and strict success also improve, from 32.6% to 38.0% ( points) and from 19.9% to 24.9% ( points), respectively. The prompt-probe wrong-object commitment rate decreases from 46.6% to 43.9%. Thus, additional demonstrations improve both success and object selection in the aggregate; these results do not isolate the benefit to execution alone.
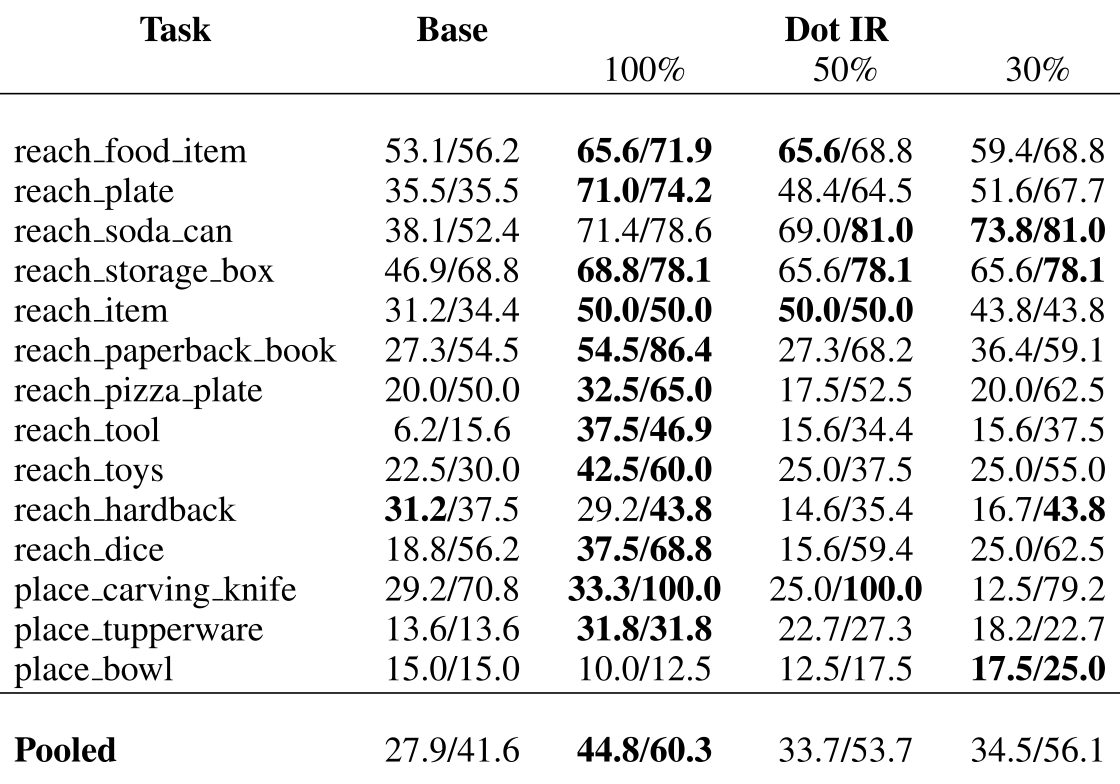
Accessible table, original values and citation links
| Task | Base | Dot IR | ||
| 100% | 50% | 30% | ||
| reach_food_item | 53.1/56.2 | 65.6/71.9 | 65.6/68.8 | 59.4/68.8 |
| reach_plate | 35.5/35.5 | 71.0/74.2 | 48.4/64.5 | 51.6/67.7 |
| reach_soda_can | 38.1/52.4 | 71.4/78.6 | 69.0/81.0 | 73.8/81.0 |
| reach_storage_box | 46.9/68.8 | 68.8/78.1 | 65.6/78.1 | 65.6/78.1 |
| reach_item | 31.2/34.4 | 50.0/50.0 | 50.0/50.0 | 43.8/43.8 |
| reach_paperback_book | 27.3/54.5 | 54.5/86.4 | 27.3/68.2 | 36.4/59.1 |
| reach_pizza_plate | 20.0/50.0 | 32.5/65.0 | 17.5/52.5 | 20.0/62.5 |
| reach_tool | 6.2/15.6 | 37.5/46.9 | 15.6/34.4 | 15.6/37.5 |
| reach_toys | 22.5/30.0 | 42.5/60.0 | 25.0/37.5 | 25.0/55.0 |
| reach_hardback | 31.2/37.5 | 29.2/43.8 | 14.6/35.4 | 16.7/43.8 |
| reach_dice | 18.8/56.2 | 37.5/68.8 | 15.6/59.4 | 25.0/62.5 |
| place_carving_knife | 29.2/70.8 | 33.3/100.0 | 25.0/100.0 | 12.5/79.2 |
| place_tupperware | 13.6/13.6 | 31.8/31.8 | 22.7/27.3 | 18.2/22.7 |
| place_bowl | 15.0/15.0 | 10.0/12.5 | 12.5/17.5 | 17.5/25.0 |
| Pooled | 27.9/41.6 | 44.8/60.3 | 33.7/53.7 | 34.5/56.1 |
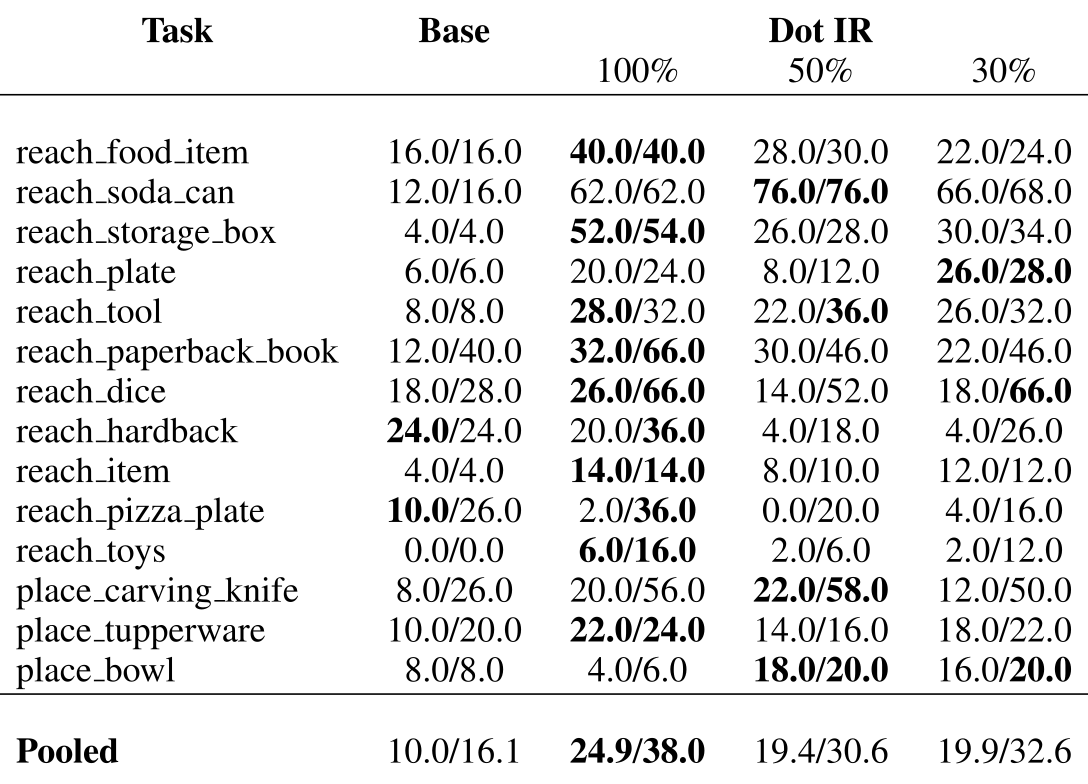
Accessible table, original values and citation links
| Task | Base | Dot IR | ||
| 100% | 50% | 30% | ||
| reach_food_item | 16.0/16.0 | 40.0/40.0 | 28.0/30.0 | 22.0/24.0 |
| reach_soda_can | 12.0/16.0 | 62.0/62.0 | 76.0/76.0 | 66.0/68.0 |
| reach_storage_box | 4.0/4.0 | 52.0/54.0 | 26.0/28.0 | 30.0/34.0 |
| reach_plate | 6.0/6.0 | 20.0/24.0 | 8.0/12.0 | 26.0/28.0 |
| reach_tool | 8.0/8.0 | 28.0/32.0 | 22.0/36.0 | 26.0/32.0 |
| reach_paperback_book | 12.0/40.0 | 32.0/66.0 | 30.0/46.0 | 22.0/46.0 |
| reach_dice | 18.0/28.0 | 26.0/66.0 | 14.0/52.0 | 18.0/66.0 |
| reach_hardback | 24.0/24.0 | 20.0/36.0 | 4.0/18.0 | 4.0/26.0 |
| reach_item | 4.0/4.0 | 14.0/14.0 | 8.0/10.0 | 12.0/12.0 |
| reach_pizza_plate | 10.0/26.0 | 2.0/36.0 | 0.0/20.0 | 4.0/16.0 |
| reach_toys | 0.0/0.0 | 6.0/16.0 | 2.0/6.0 | 2.0/12.0 |
| place_carving_knife | 8.0/26.0 | 20.0/56.0 | 22.0/58.0 | 12.0/50.0 |
| place_tupperware | 10.0/20.0 | 22.0/24.0 | 14.0/16.0 | 18.0/22.0 |
| place_bowl | 8.0/8.0 | 4.0/6.0 | 18.0/20.0 | 16.0/20.0 |
| Pooled | 10.0/16.1 | 24.9/38.0 | 19.4/30.6 | 19.9/32.6 |
F.10 Per-Task Policy Comparisons
S9/S10 contain the full frozen baseline and dot-policy comparison at 100/50/30% training data. Column order is strict/soft, while several main tables use soft then strict; labels are preserved to prevent inversion. Pooled rows weight episode counts rather than averaging task percentages.
F.11 Navigation Results
All ten navigation results retain scene identity, VQA and binary success, plus pooled 30.2% VQA/59.9% action. The 401 action starts come from nine 40-case tasks and one 41-case task. Perceptual question counts and action denominators differ, and navigation has no soft-credit metric.
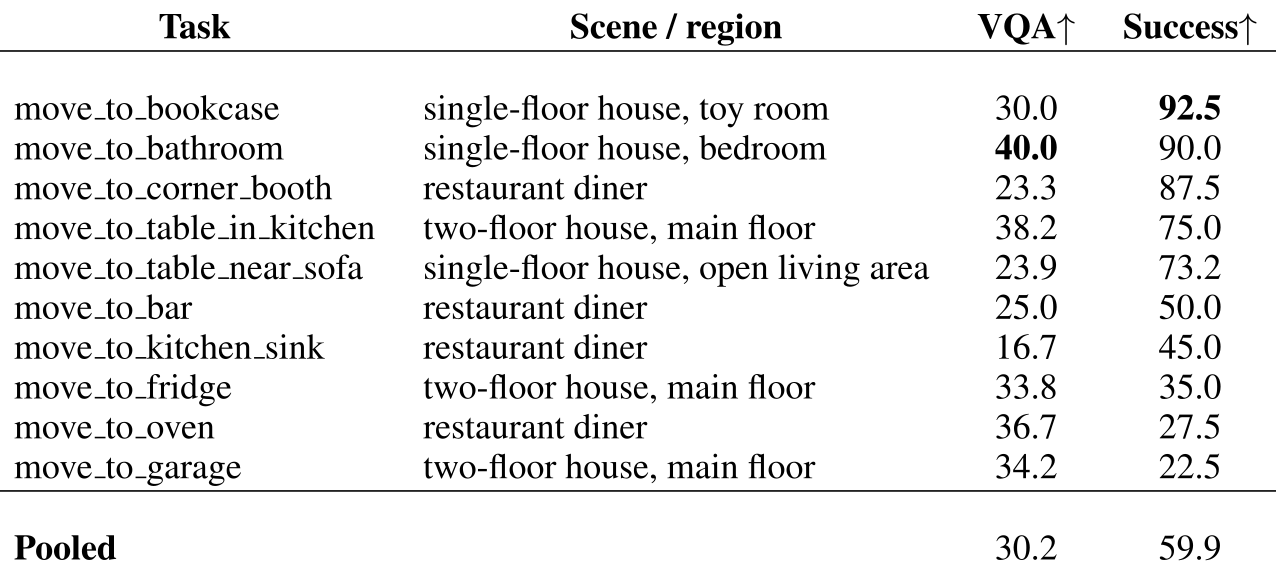
Accessible table, original values and citation links
| Task | Scene / region | VQA | Success |
|---|---|---|---|
| move_to_bookcase | single-floor house, toy room | 30.0 | 92.5 |
| move_to_bathroom | single-floor house, bedroom | 40.0 | 90.0 |
| move_to_corner_booth | restaurant diner | 23.3 | 87.5 |
| move_to_table_in_kitchen | two-floor house, main floor | 38.2 | 75.0 |
| move_to_table_near_sofa | single-floor house, open living area | 23.9 | 73.2 |
| move_to_bar | restaurant diner | 25.0 | 50.0 |
| move_to_kitchen_sink | restaurant diner | 16.7 | 45.0 |
| move_to_fridge | two-floor house, main floor | 33.8 | 35.0 |
| move_to_oven | restaurant diner | 36.7 | 27.5 |
| move_to_garage | two-floor house, main floor | 34.2 | 22.5 |
| Pooled | 30.2 | 59.9 | |
F.12 Qualitative Policy and Navigation-VQA Examples
Selected manipulation, navigation and navigation-VQA frames show successes and failures. Reverse-tour tasks and unfamiliar starts perform worse in examples, but geometry/context familiarity/motion are confounded. A separate 19/20 trained-region versus 0/20 novel-start probe is diagnostic, not an isolated test of context interpretation. Full filmstrips, target marks, frame times, questions/options and outputs remain. The project URL was unavailable at review, so no unverified movies were added.