Overview
This edition covers all 23 pages and Appendices A–F. It preserves the six figures, seven complete tables, annotated Equations 5/6, full offline/online algorithm, all other equations and original project presentations/paired rollouts. Kaichen Zhou and Zhiyan Li contributed equally; Mengyu Wang and Paul Pu Liang share supervision. The 24-rollout adaptation budget is separate from prior task fine-tuning and shared SAE training.
At a glance
SteerAct improves a frozen, task-fine-tuned action policy by editing one selected sparse-feature direction. Ordinal activation-history descriptors choose a task-specific feature offline, then support/failure gates and a signed coefficient search control interventions online. Main simulation gains over Base range from about 3.4 to 9.6 percentage points across four benchmark/backbone settings; physical success rises 31.1→52.2%. These are empirical improvements on selected tasks, not a guarantee that one feature always helps. Model weights stay fixed during steering, while the shared SAE and base task policies have been trained beforehand.
1 Introduction
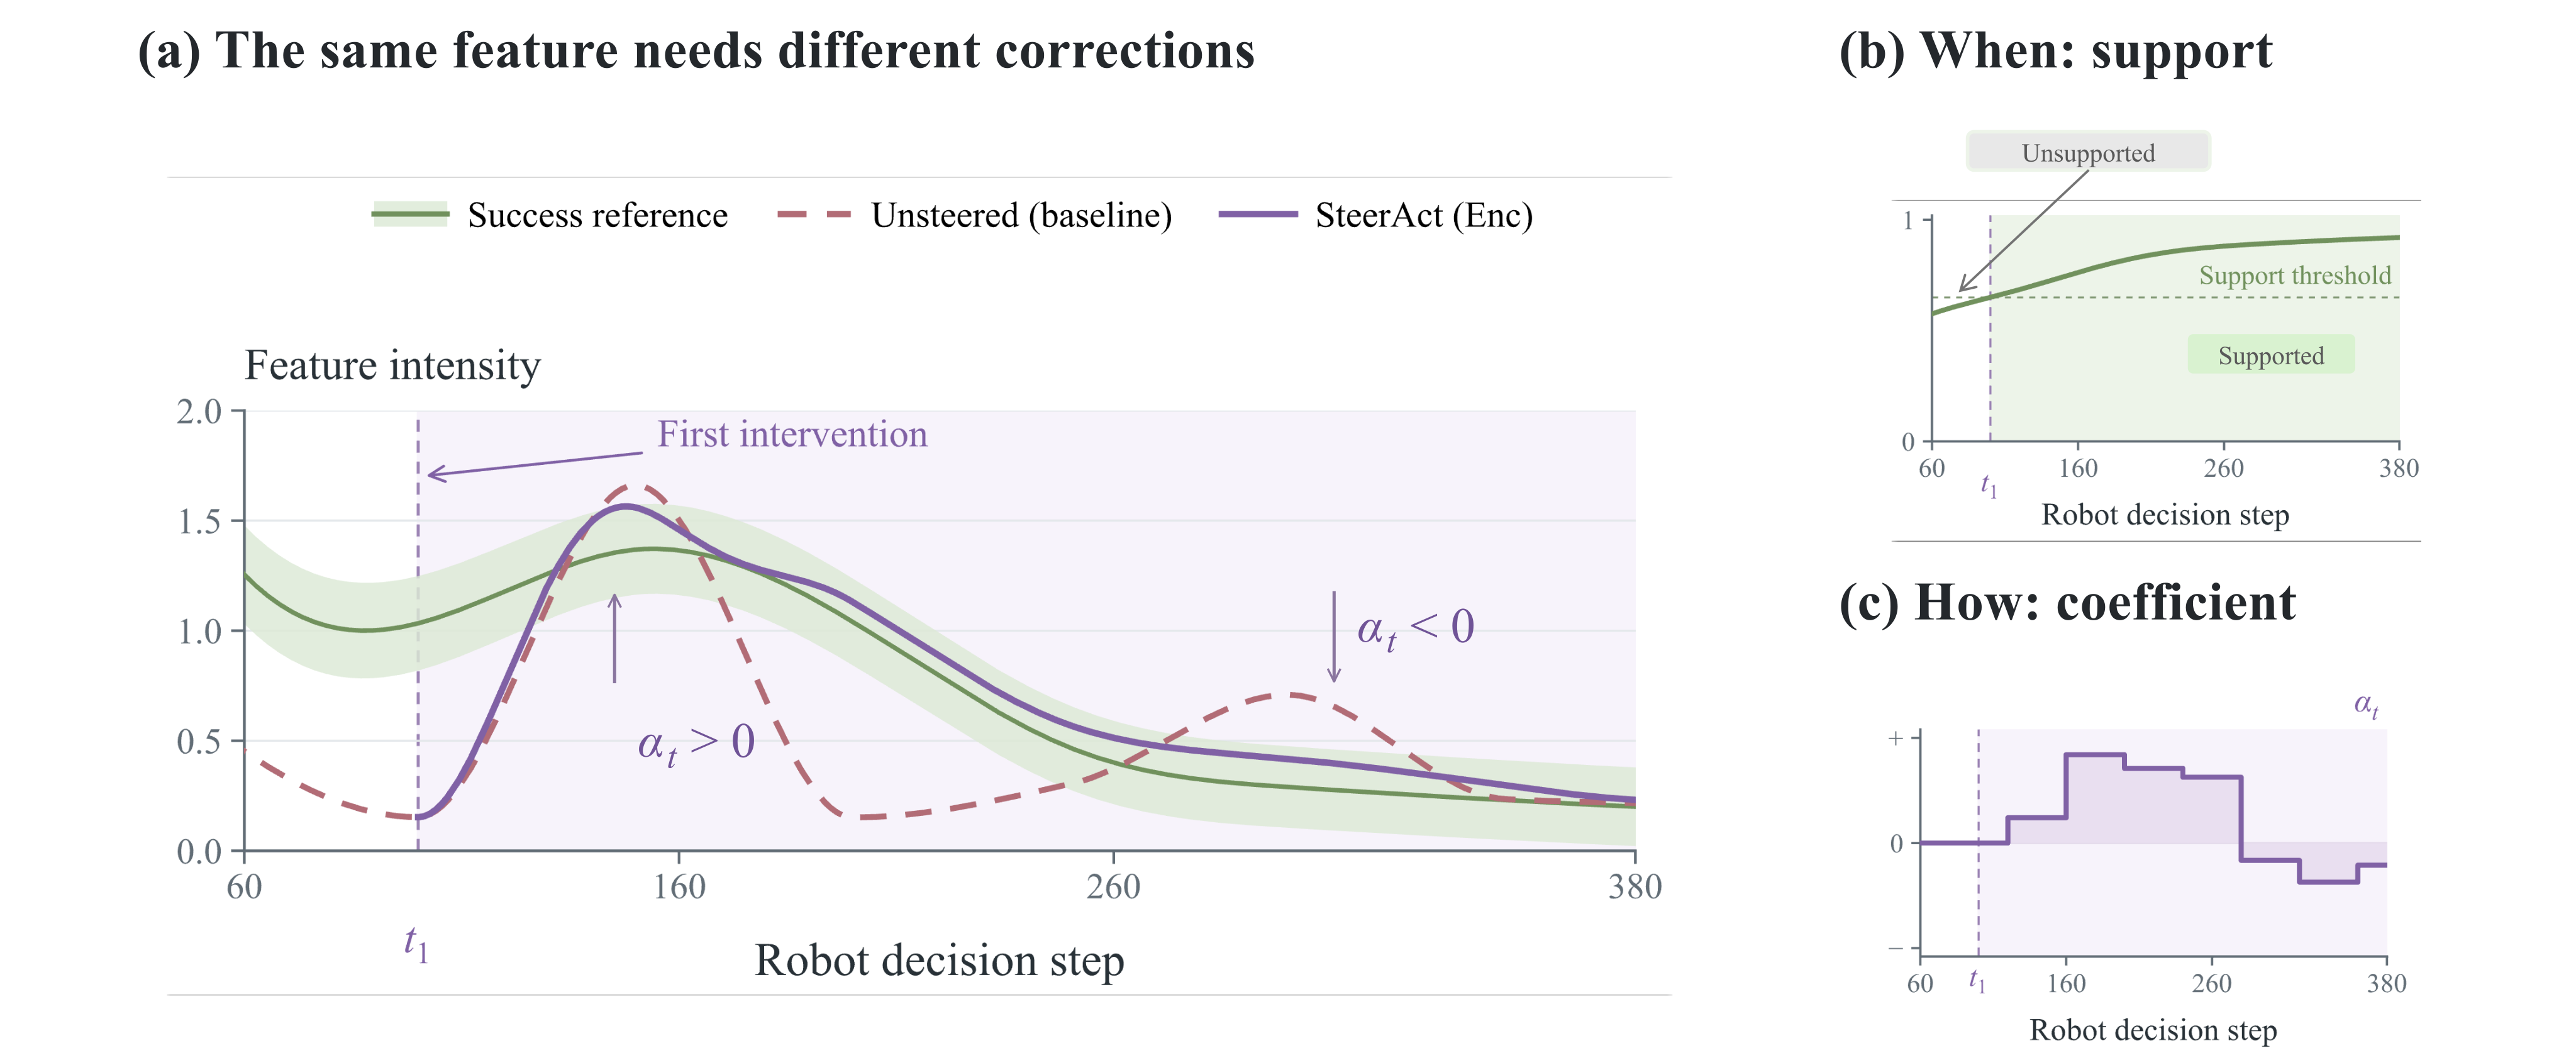
Successful and failed rollouts can differ in how a feature rises/falls even when their mean activations resemble each other. A common temporal descriptor lets selection and intervention use that outcome-related structure without aligning rollouts by timestep. Hidden-state access and a suitable learned dictionary are required. The method avoids training a separate RL steering controller, rather than avoiding all task-specific preparation.
2 Related Work
Related work separates candidate action verification, sampler/noise guidance, representation steering and sparse-feature interpretation. SteerAct intervenes directly at one configured residual stream and uses observed activation history to choose when and how much to edit.
2.1 Inference-time Steering
Value-guided candidate selection and latent-noise controllers change generation through sampling, ranking or learned guidance. This method instead reuses a frozen hidden-state direction. It needs internal activations and a pretrained SAE, with its own offline preparation and online gate/search overhead.
2.2 Representation-level Steering and Sparse Autoencoders
Sparse autoencoders provide decoder columns as candidate intervention directions. Prior robot steering uses interpretable features or success/failure subspaces; SteerAct adds ordinal-history selection and online reference matching. Outcome separation is associational until an edit is evaluated, and a chosen feature need not have a clean semantic label. Source comparisons: Cunningham et al. (2024) on sparse features, Swann et al. (2026) on robot feature steering, and Miao et al. (2026) on COAST.
3 Methodology
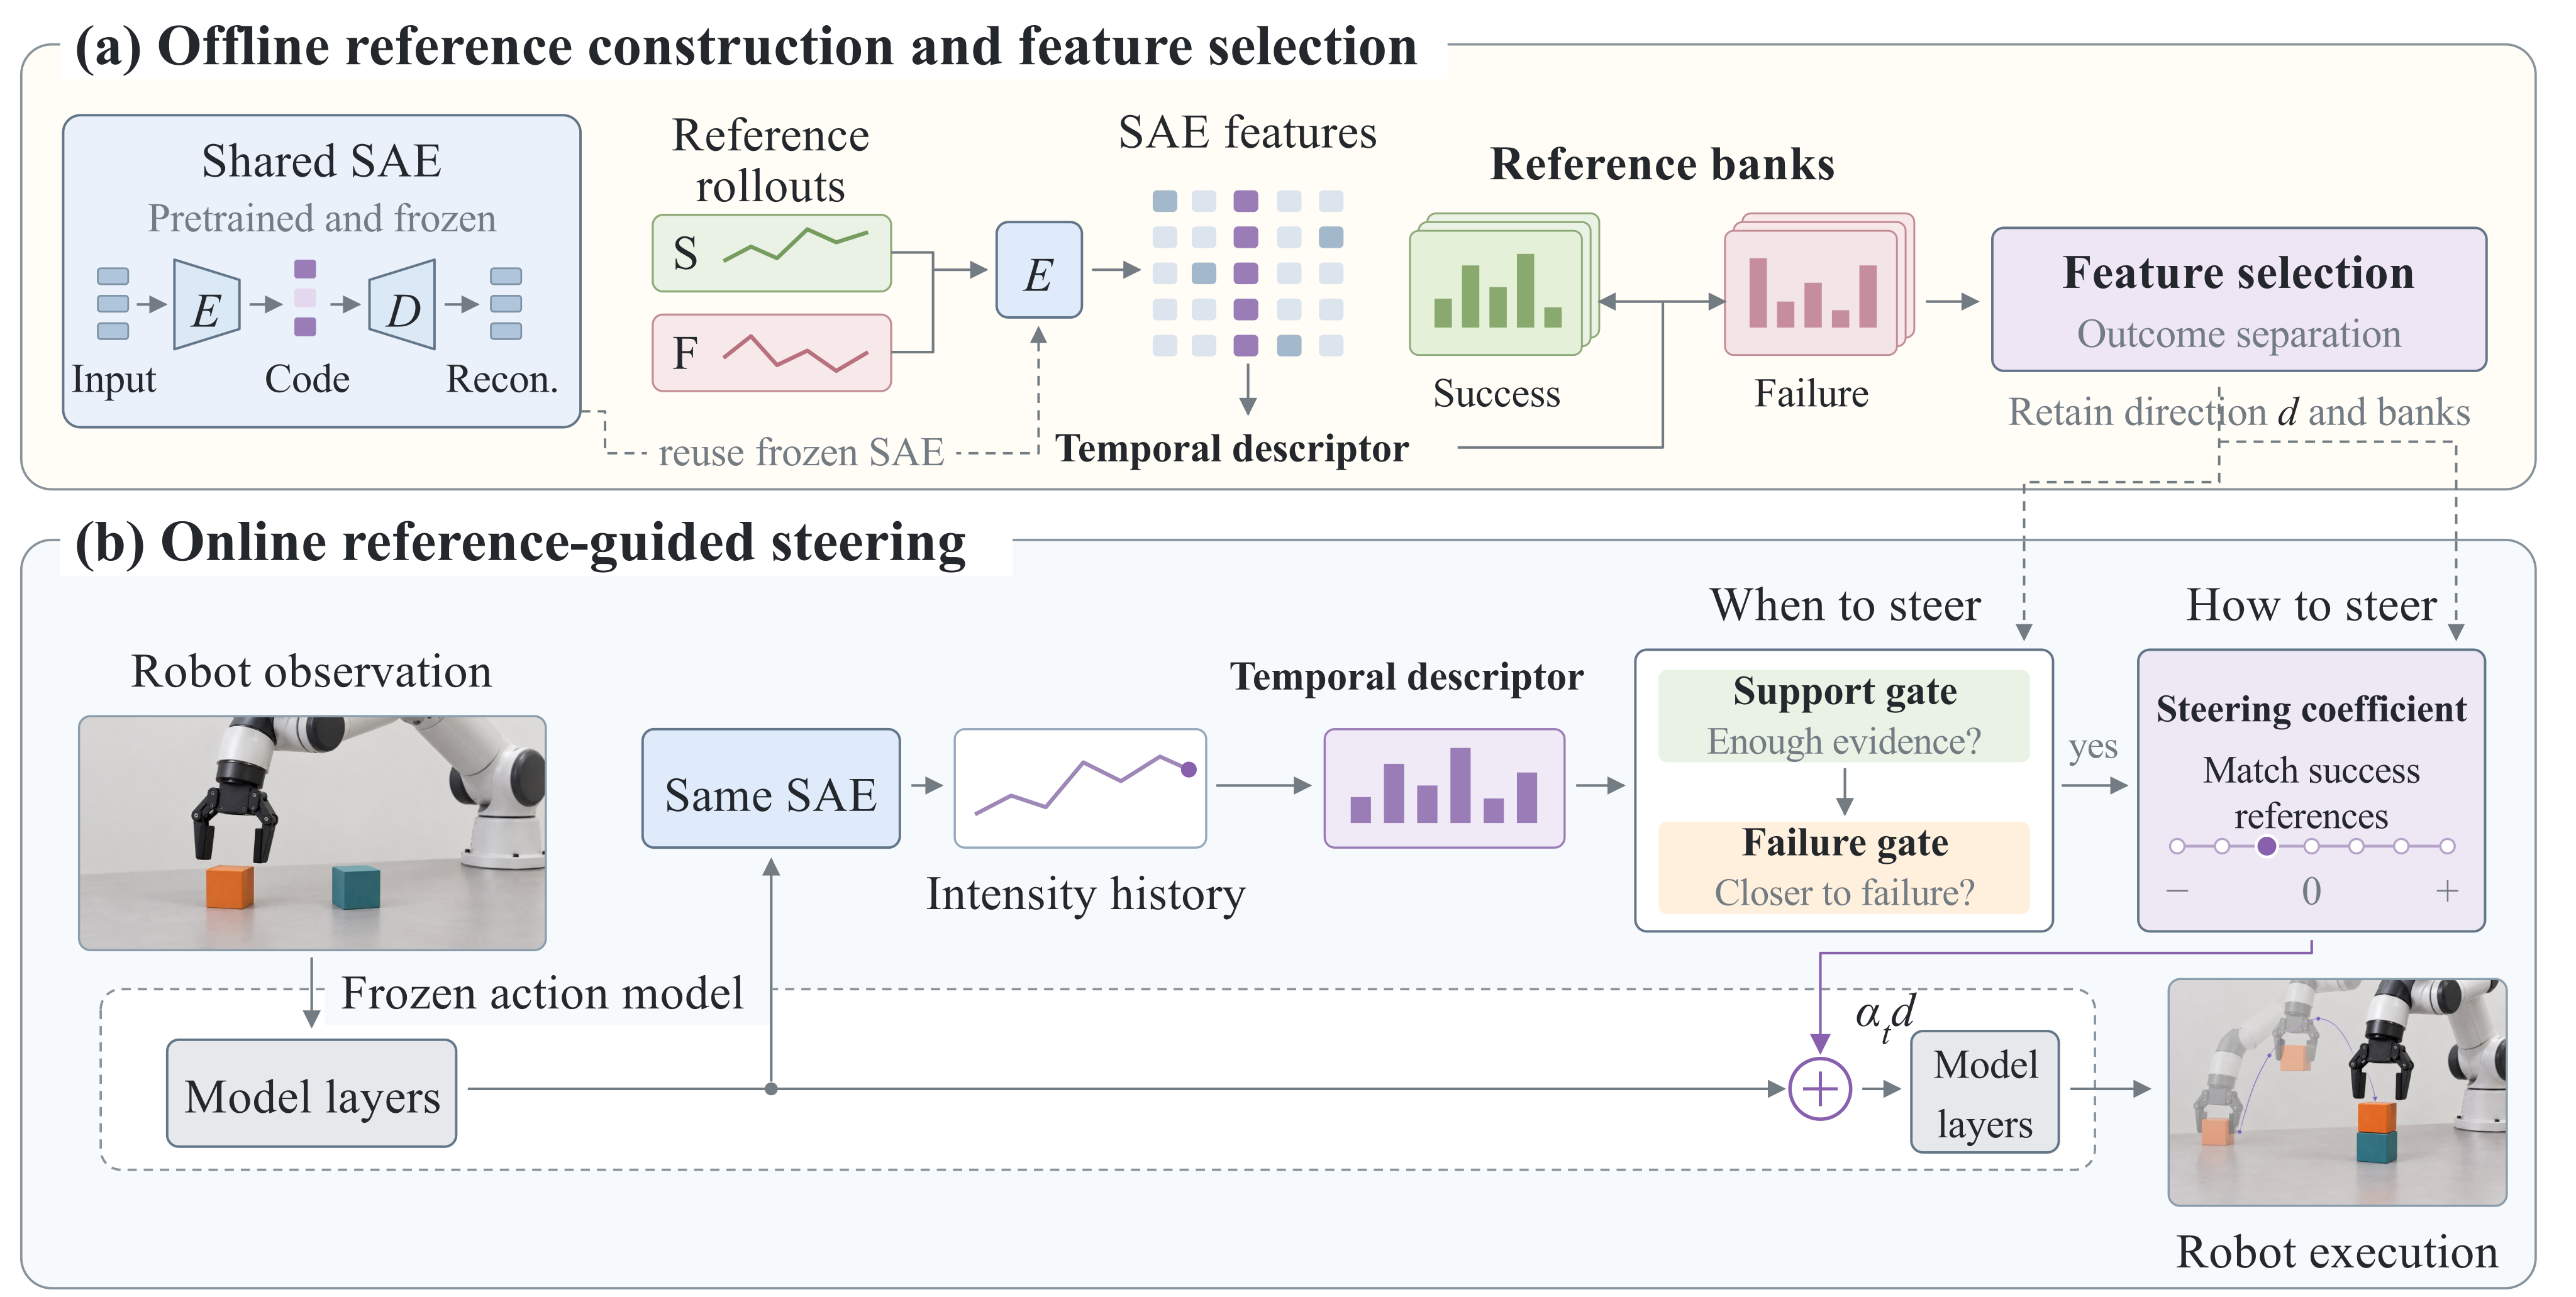
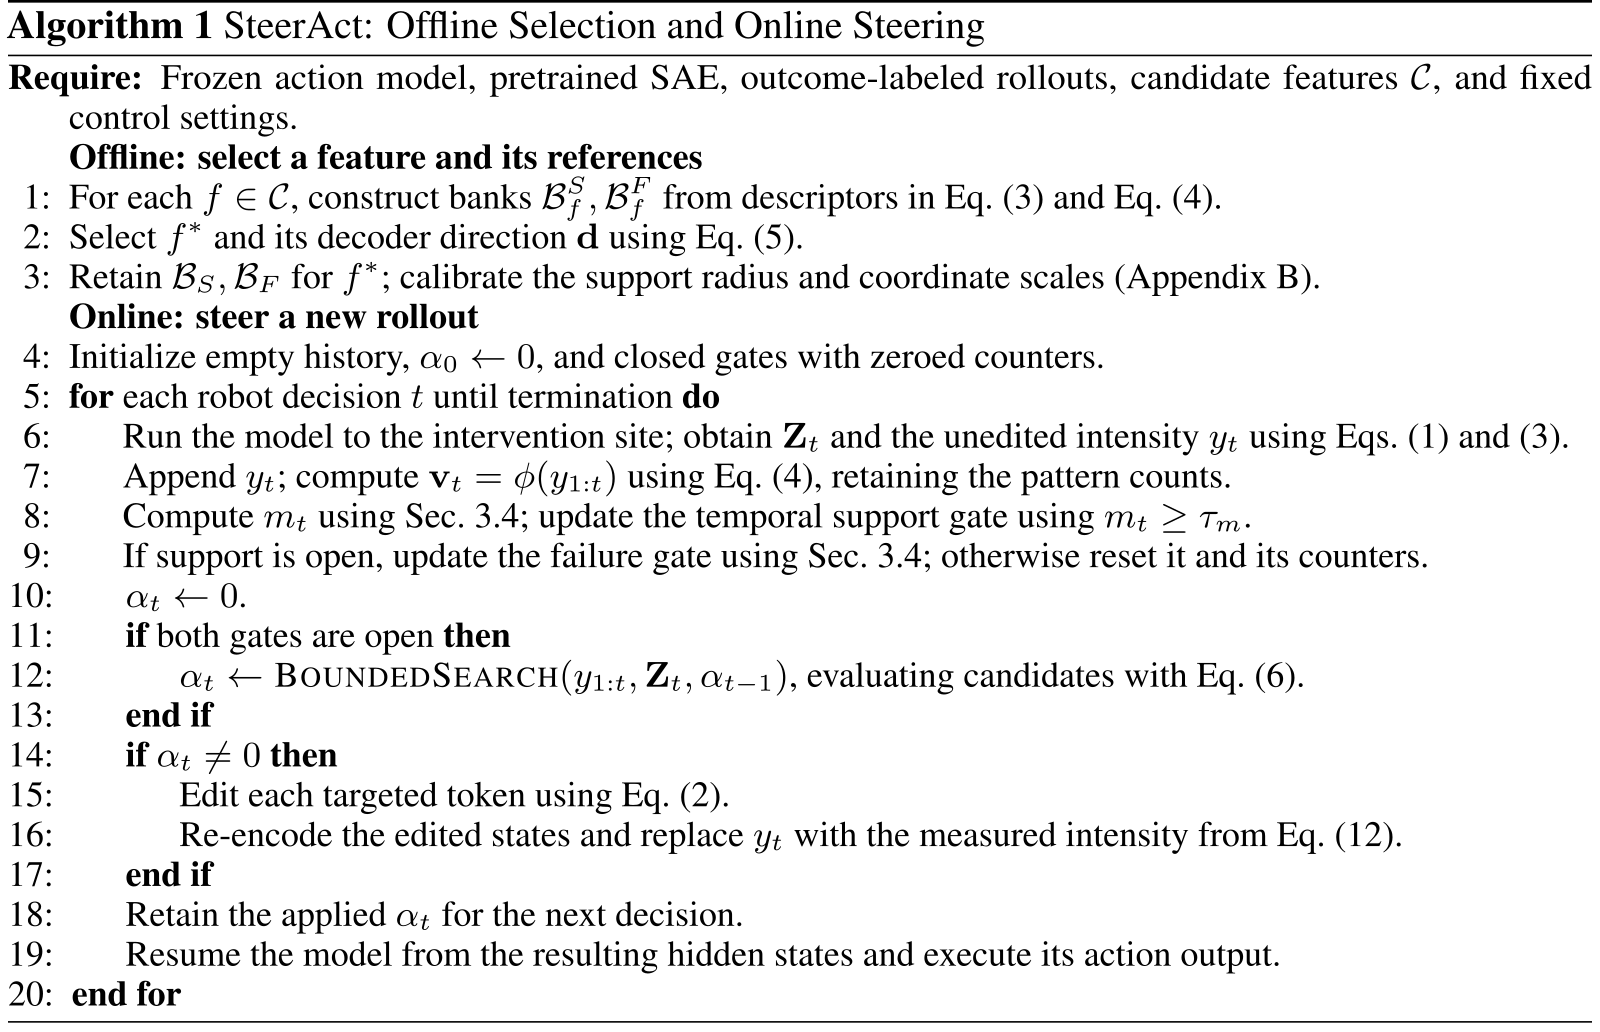
Offline, complete reference-rollout descriptors form success and failure banks and determine one feature. Online, the current prefix is assessed against those fixed banks, then a local coefficient search edits the original hidden states. Both the SAE and action model remain frozen throughout deployment.
3.1 Problem Setting
The SAE maps hidden states to sparse activations with fixed decoder directions. The selected direction d is added as α(t)d to every targeted token at a robot decision. Robot decisions are distinct from diffusion/flow denoising iterations. Encoder-branch and action-expert interventions target different model locations; the latter applies enabled edits at every denoising step.
Equations 1–2
| (1) |
| (2) |
3.2 Temporal Descriptor
Feature intensity averages rectified SAE activations over measured tokens. At spacings one and two, all available triples receive one of six ordinal patterns, with ties ranked by temporal order. Six frequencies, normalized entropy, tie fraction and availability per spacing form an eighteen-dimensional descriptor. It discards absolute timing and much magnitude/order information, and therefore cannot uniquely identify execution phase. The monotone log preprocessing leaves these order patterns unchanged in exact arithmetic.
Equations 3–4
| (3) |
| (4) |
3.3 Offline Reference Construction and Feature Selection
For each candidate, the score is twice the mean cross-outcome distance minus within-success and within-failure mean distances, excluding self-pairs. Highest score selects the feature, decoder direction and fixed banks. This requires at least two examples of each outcome. Complete reference histories are compared with potentially short online prefixes; the support gate addresses evidence adequacy empirically. Missing numeric candidate-filter/intervention-site details limit exact reconstruction from the manuscript alone.
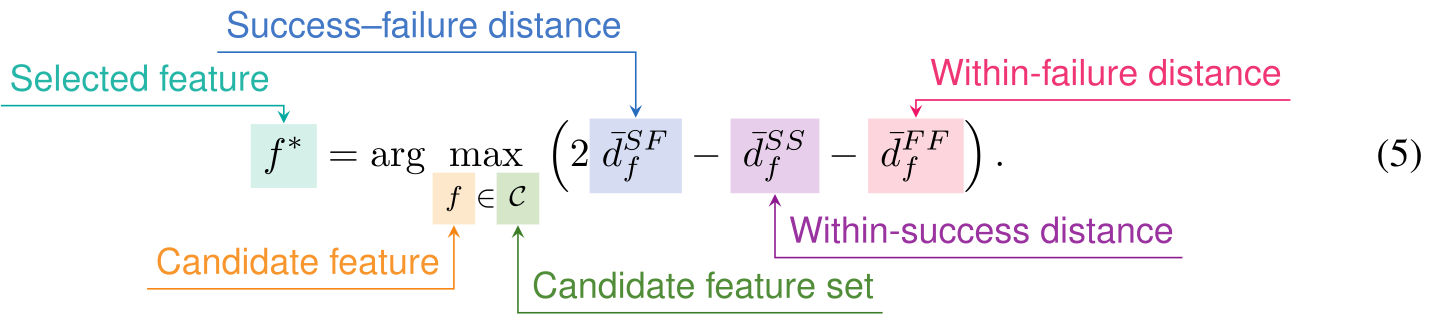
Original equation notation and annotations
Equation 5
| (5) |
Original callouts: Selected feature; Candidate feature; Candidate feature set; Success–failure distance; Within-success distance; Within-failure distance.
3.4 Online Reference-Guided Steering
The support gate samples plausible ordinal-frequency descriptors from a Dirichlet model and checks nearby pooled references. If supported, a scaled nearest-bank distance check detects failure-like prefixes; hysteresis controls both gates. When enabled, a bounded signed grid chooses the coefficient whose predicted last-intensity edit minimizes success-bank distance. This is local feature-statistic matching, not a model of future reward or task success. Re-encoding after an actual edit replaces the latest stored intensity, so subsequent history includes interventions. Many candidate values can share identical ordinal patterns; coefficient tie-breaking is not numerically specified.

Original equation notation and annotations
Equation 6
| (6) |
Original callouts: Steering coefficient; Candidate coefficients; Success-bank distance; Temporal descriptor; Past intensities; Predicted current intensity.
4 Experiments
Evaluation spans two backbones, two selected nine-task simulation subsets, three physical tasks and eight-task timing/gating controls. All compared methods within a setting share the same fine-tuned policy checkpoint. The 24 outcome-labeled references and held-out evaluation rollouts serve different roles.
4.1 Experimental Setup
Simulation fine-tunes each backbone on 500 scripted successful demonstrations per task before freezing it. Steering then uses 24 separate outcome-labeled policy rollouts, and evaluation uses 200 held-out rollouts per task/method. The shared TopK SAE is trained on pooled hidden activations from those online rollout sets. Real π0.5 uses thirty task demonstrations and thirty evaluation trials per task. Baselines include one positive-only COAST variant; DSRL-SAC is reported only for π0.5. The latency table is per-decision inference on an RTX 6000, separate from offline fitting/selection costs. The noise-controller baseline follows Wagenmaker et al. (2025).
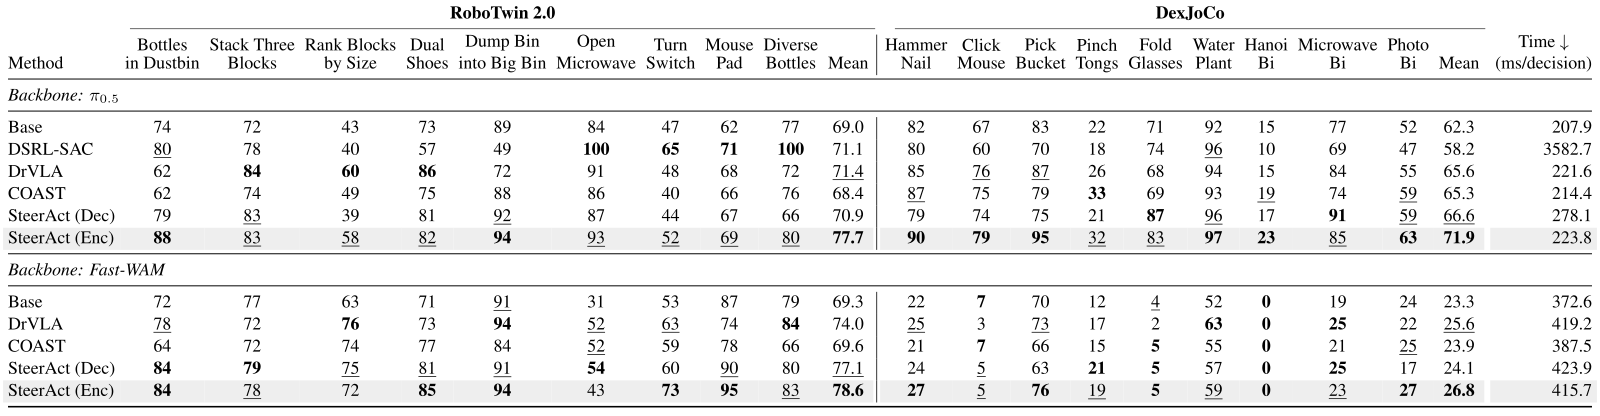
Accessible table, original values and citation links
| RoboTwin 2.0 | DexJoCo | ||||||||||||||||||||
| Method | Bottles in Dustbin | Stack Three Blocks | Rank Blocks by Size | Dual Shoes | Dump Bin into Big Bin | Open Microwave | Turn Switch | Mouse Pad | Diverse Bottles | Mean | Hammer Nail | Click Mouse | Pick Bucket | Pinch Tongs | Fold Glasses | Water Plant | Hanoi Bi | Microwave Bi | Photo Bi | Mean | Time (ms/decision) |
| Backbone: | |||||||||||||||||||||
| Base | 74 | 72 | 43 | 73 | 89 | 84 | 47 | 62 | 77 | 69.0 | 82 | 67 | 83 | 22 | 71 | 92 | 15 | 77 | 52 | 62.3 | 207.9 |
| DSRL-SAC | 80 | 78 | 40 | 57 | 49 | 100 | 65 | 71 | 100 | 71.1 | 80 | 60 | 70 | 18 | 74 | 96 | 10 | 69 | 47 | 58.2 | 3582.7 |
| DrVLA | 62 | 84 | 60 | 86 | 72 | 91 | 48 | 68 | 72 | 71.4 | 85 | 76 | 87 | 26 | 68 | 94 | 15 | 84 | 55 | 65.6 | 221.6 |
| COAST | 62 | 74 | 49 | 75 | 88 | 86 | 40 | 66 | 76 | 68.4 | 87 | 75 | 79 | 33 | 69 | 93 | 19 | 74 | 59 | 65.3 | 214.4 |
| SteerAct (Dec) | 79 | 83 | 39 | 81 | 92 | 87 | 44 | 67 | 66 | 70.9 | 79 | 74 | 75 | 21 | 87 | 96 | 17 | 91 | 59 | 66.6 | 278.1 |
| SteerAct (Enc) | 88 | 83 | 58 | 82 | 94 | 93 | 52 | 69 | 80 | 77.7 | 90 | 79 | 95 | 32 | 83 | 97 | 23 | 85 | 63 | 71.9 | 223.8 |
| Backbone: Fast-WAM | |||||||||||||||||||||
| Base | 72 | 77 | 63 | 71 | 91 | 31 | 53 | 87 | 79 | 69.3 | 22 | 7 | 70 | 12 | 4 | 52 | 0 | 19 | 24 | 23.3 | 372.6 |
| DrVLA | 78 | 72 | 76 | 73 | 94 | 52 | 63 | 74 | 84 | 74.0 | 25 | 3 | 73 | 17 | 2 | 63 | 0 | 25 | 22 | 25.6 | 419.2 |
| COAST | 64 | 72 | 74 | 77 | 84 | 52 | 59 | 78 | 66 | 69.6 | 21 | 7 | 66 | 15 | 5 | 55 | 0 | 21 | 25 | 23.9 | 387.5 |
| SteerAct (Dec) | 84 | 79 | 75 | 81 | 91 | 54 | 60 | 90 | 80 | 77.1 | 24 | 5 | 63 | 21 | 5 | 57 | 0 | 25 | 17 | 24.1 | 423.9 |
| SteerAct (Enc) | 84 | 78 | 72 | 85 | 94 | 43 | 73 | 95 | 83 | 78.6 | 27 | 5 | 76 | 19 | 5 | 59 | 0 | 23 | 27 | 26.8 | 415.7 |
4.2 Evaluation Across Benchmarks, Embodiments, and Backbones
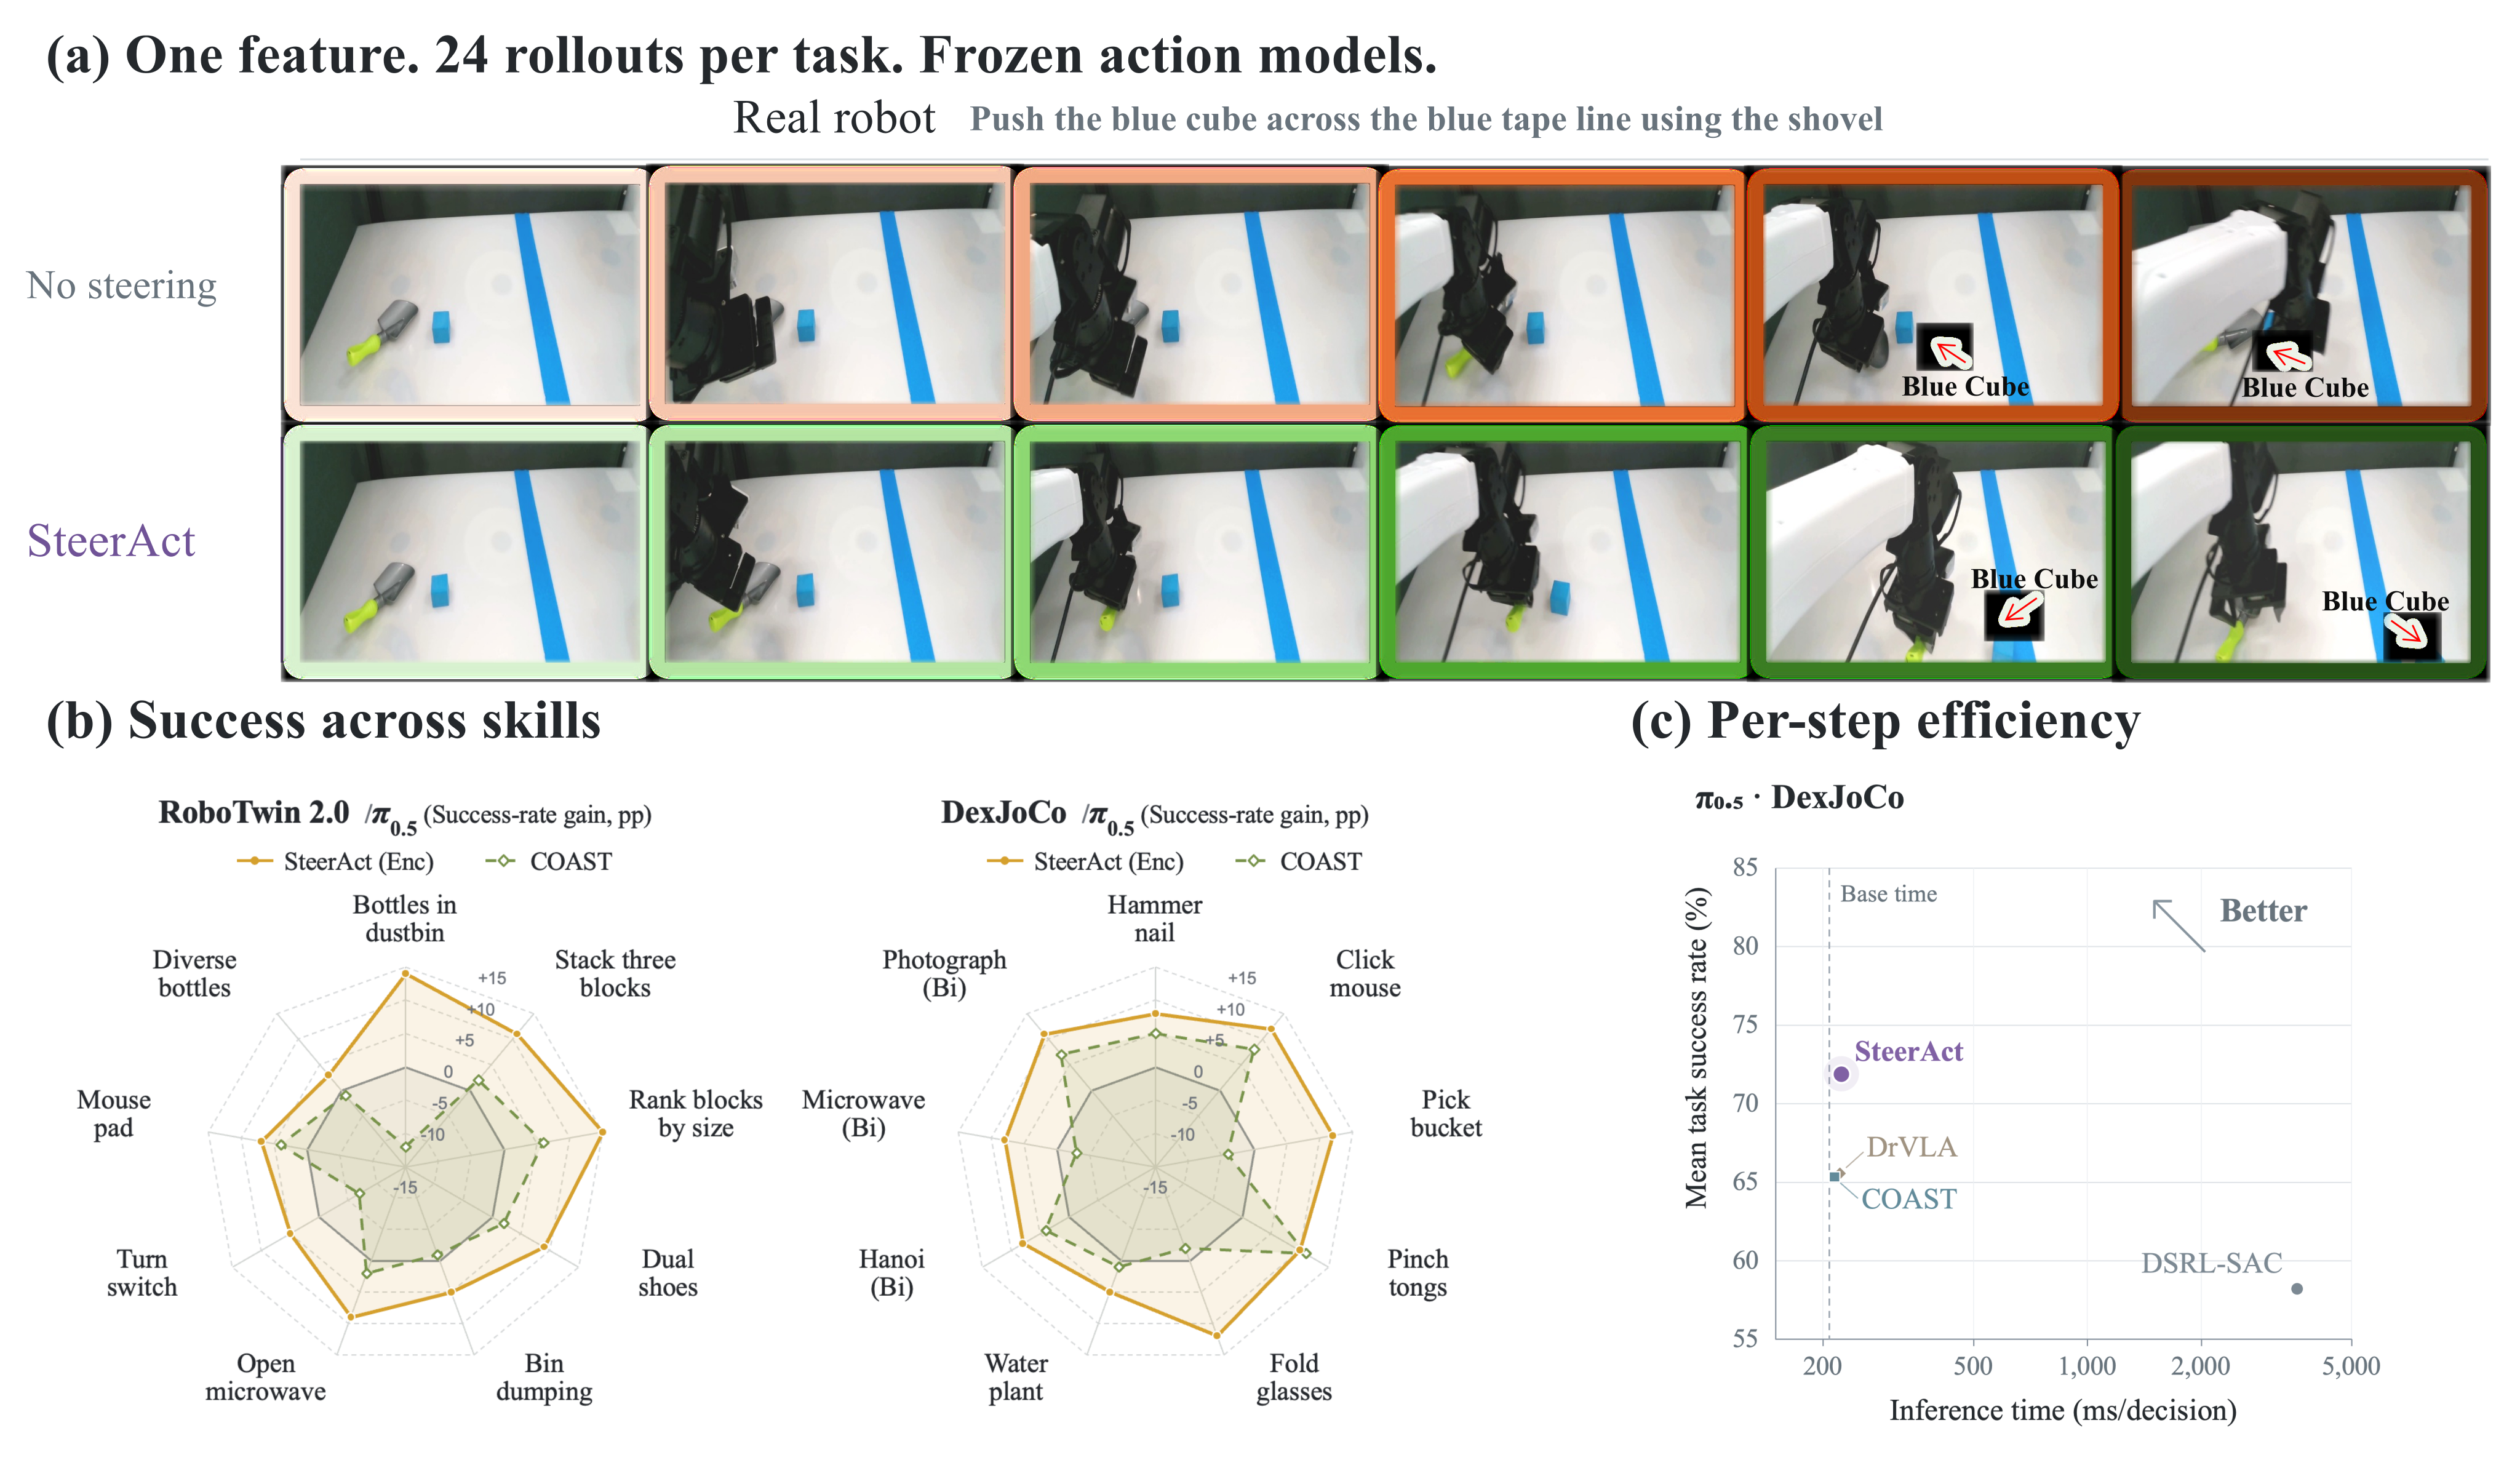
Encoder steering yields RoboTwin means 69.0→77.7% for π0.5 and 69.3→78.6% for Fast-WAM, plus DexJoCo 62.3→71.9% and 23.3→26.8%. The reported gains use unrounded task means. It improves 34/36 pairs, with Fast-WAM Click Mouse dropping 7→5% and Hanoi remaining zero. π0.5 encoder latency adds 15.9 ms (7.6%); Fast-WAM adds 43.1 ms (11.6%). Pooled two-proportion tests support aggregate gains under the reported trial model, without independent training-seed uncertainty or guarantees for every task. Fast-WAM’s dexterous performance remains much lower than π0.5’s.
4.3 Real-Robot Evaluation
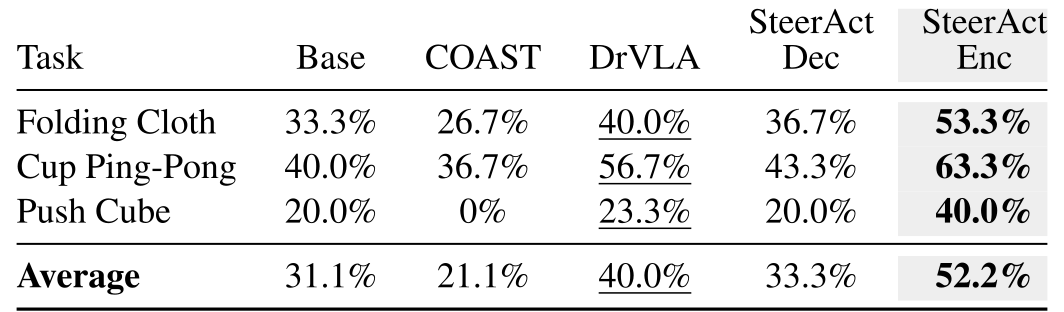
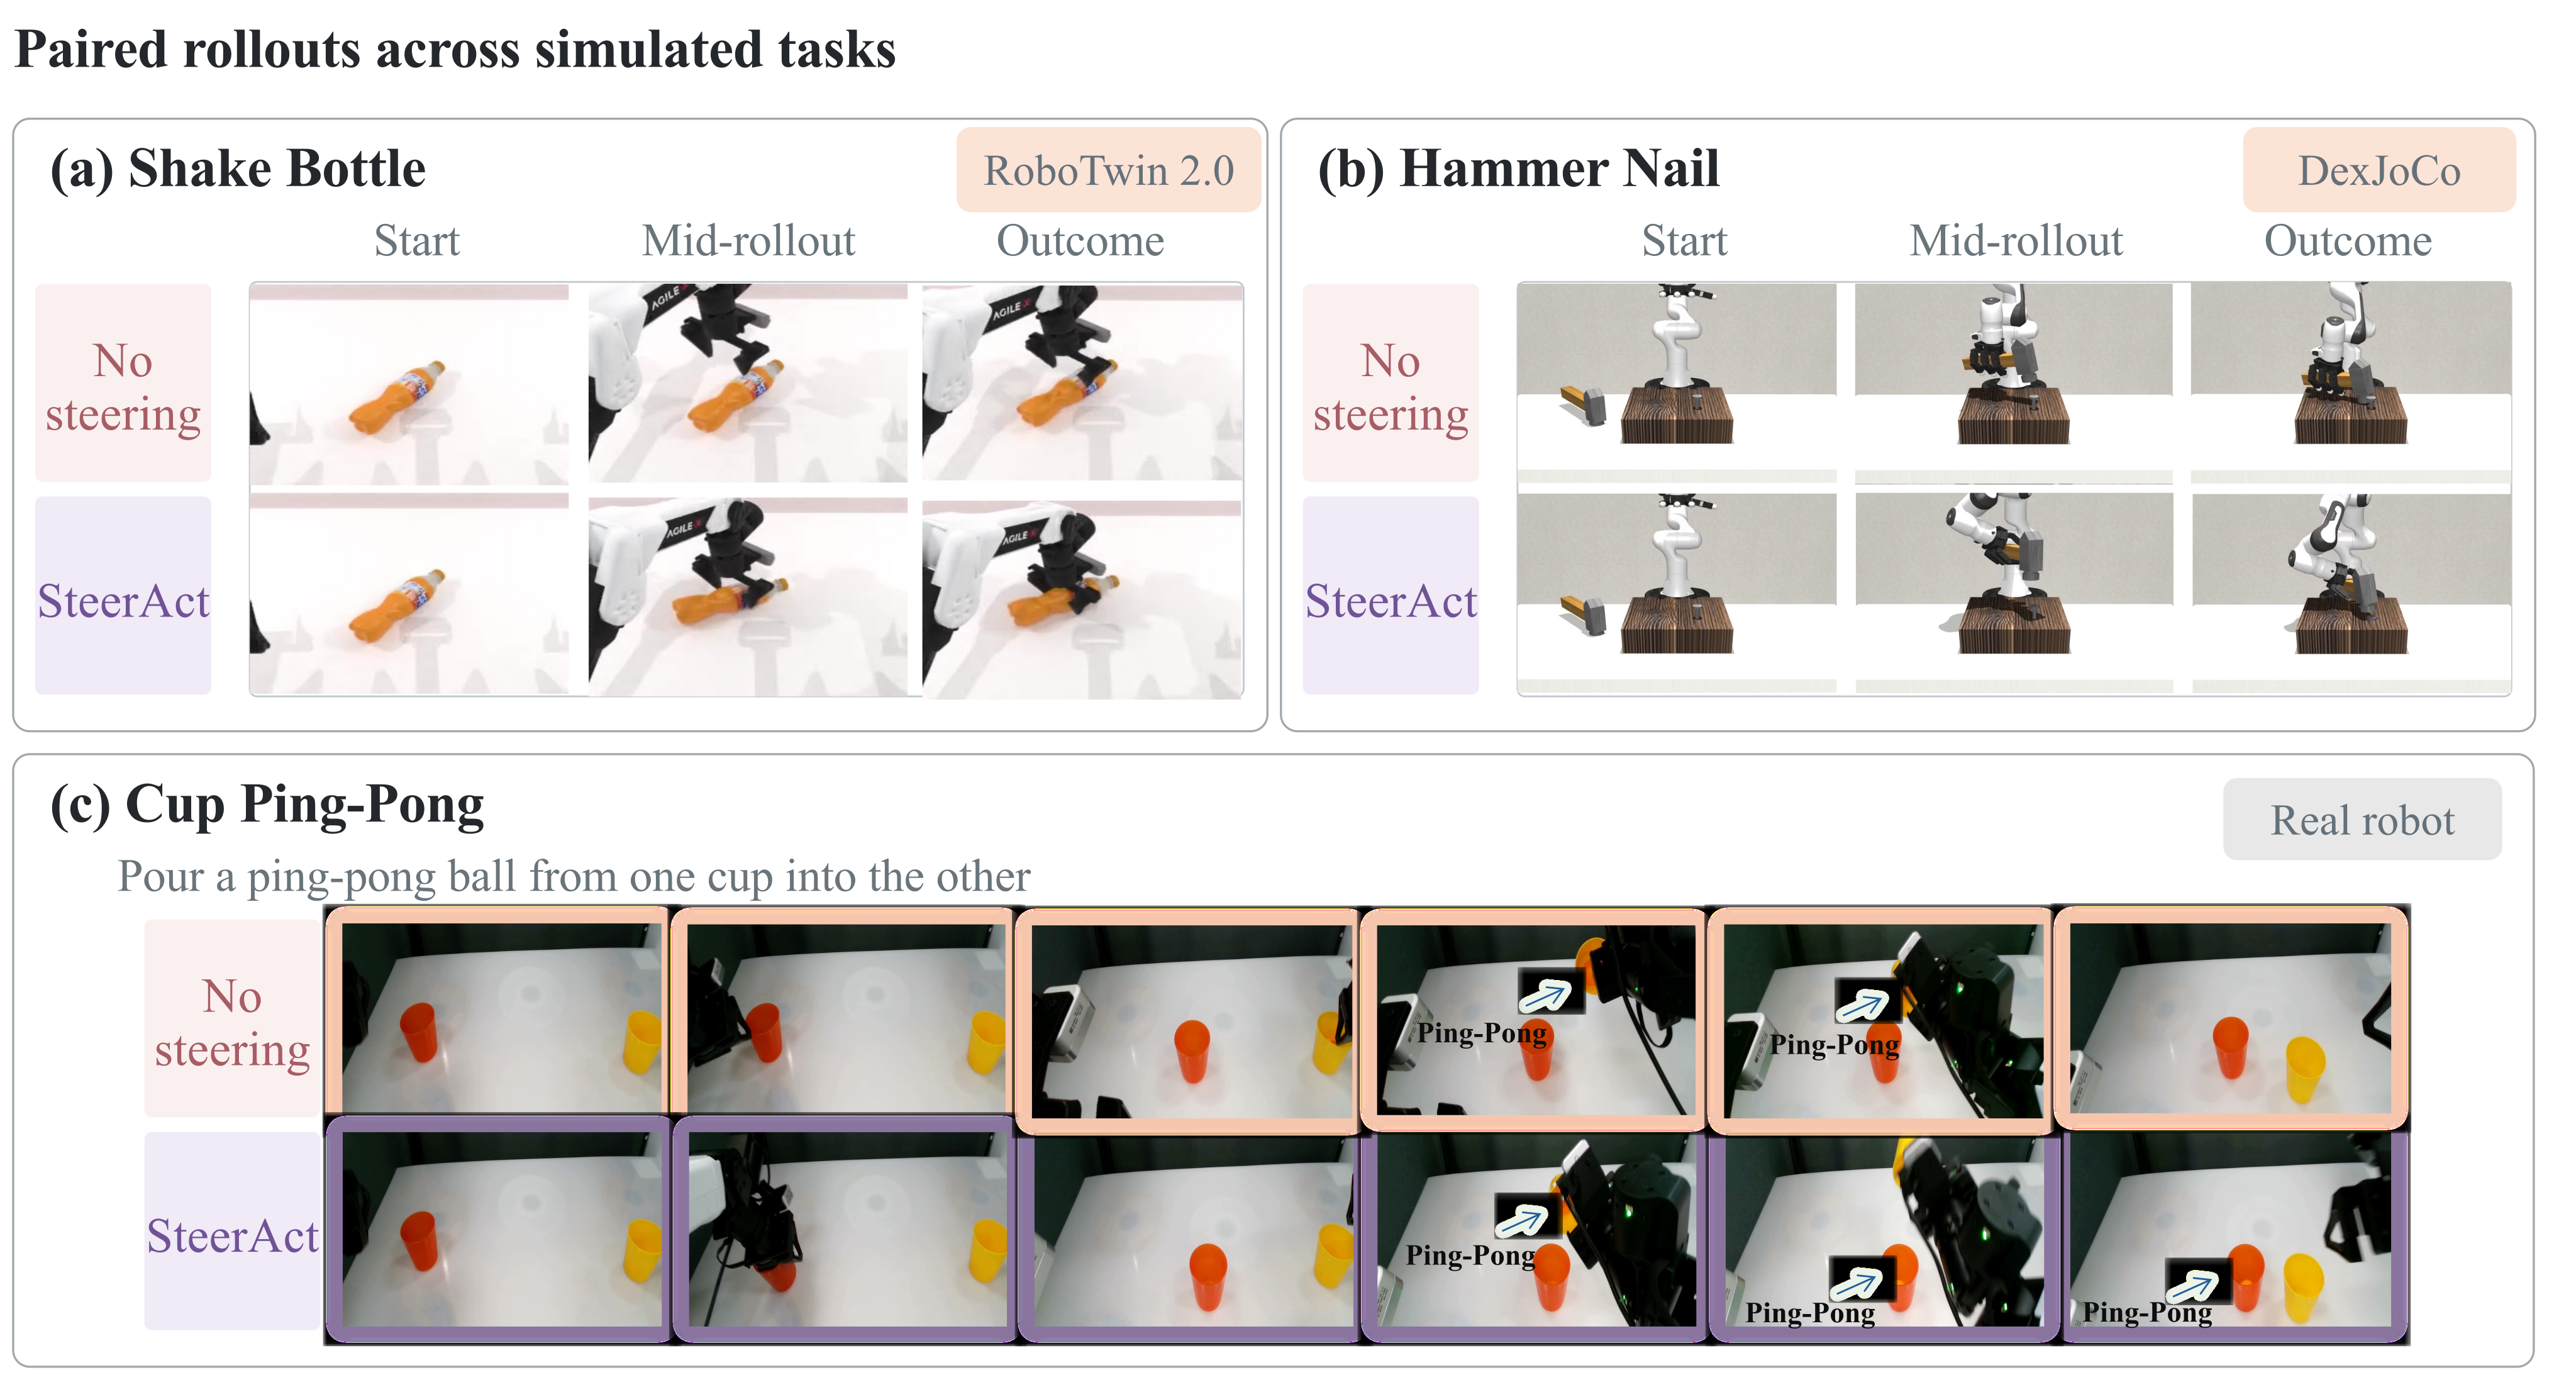
On I2RT YAM with two D405 and one D435i cameras, encoder success is 16/30 Folding Cloth, 19/30 Cup Ping-Pong and 12/30 Push Cube, versus Base 10/30, 12/30 and 6/30. Across ninety trials this is 47/90 versus 28/90, a 21.1-point gain (reported pooled p=.004). The 12.2-point margin over DrVLA’s 36/90 has reported p=.10, so it is not statistically established by that test. Decoder steering averages 33.3%, close to Base’s 31.1%. Selected before/after examples illustrate behavior rather than expanding the trial denominator.
4.4 Ablation Studies
The ordinal descriptor scores 77.7%, versus 73.9% for the strongest tested alternative, a combined autocorrelation/spectral descriptor. Larger reference banks are not monotonically better: twelve total rollouts give 73.6%, default twenty-four 77.7%, and forty-eight/ninety-six 77.3%. Successful-only counts in another ablation exclude failed references and must not be read as total budgets. Top-two/four features reach 79.6/80.0%, so one feature is efficient rather than the best tested count. Fixed coefficients 1/2 retain gates but score 75.8/75.7%. On VLABench, full gates give 36.13%, versus frozen 23.63%; removing both gives 22.38%. These controls test the combined temporal/gating design, not an isolated causal role of behavioral phase.
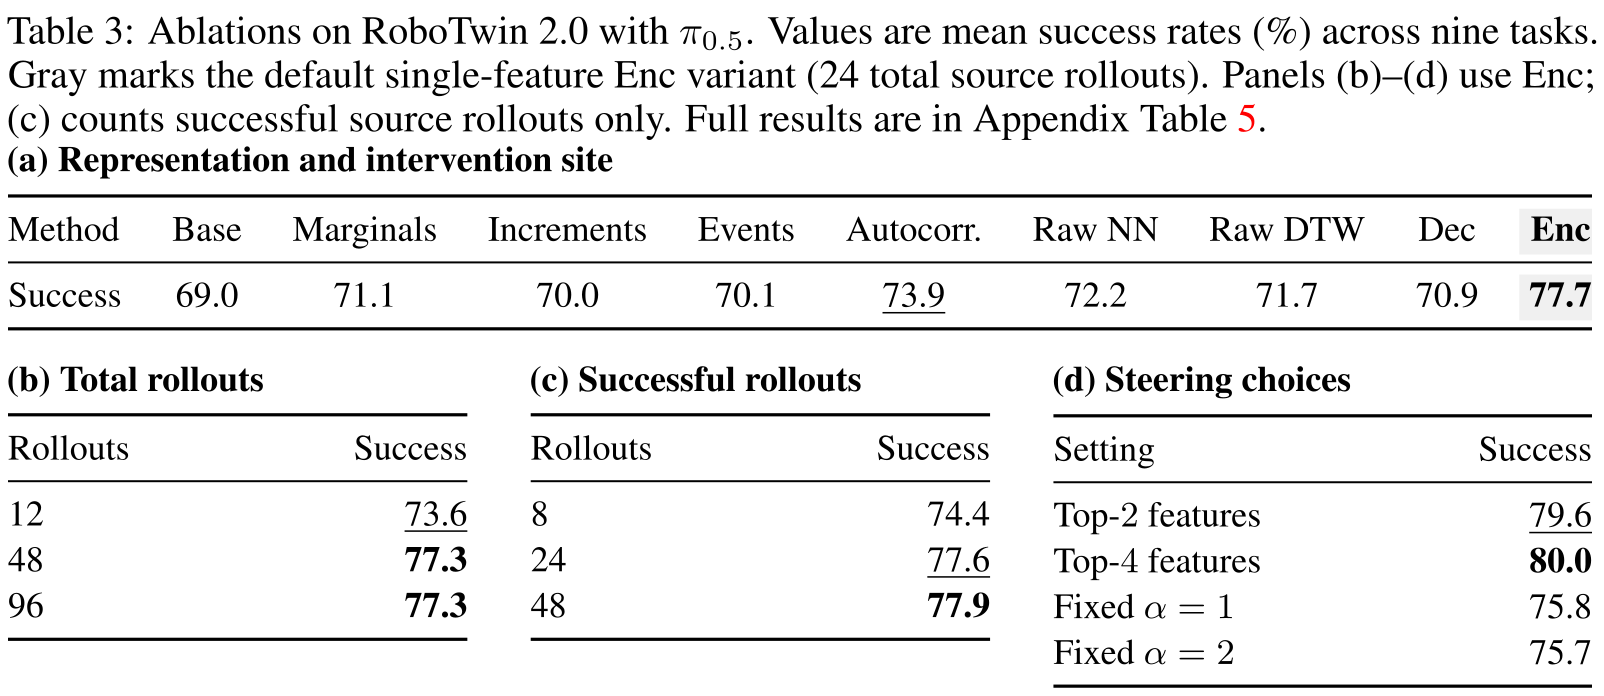
Accessible table, original values and citation links
(a) Representation and intervention site
| Method | Base | Marginals | Increments | Events | Autocorr. | Raw NN | Raw DTW | Dec | Enc |
|---|---|---|---|---|---|---|---|---|---|
| Success | 69.0 | 71.1 | 70.0 | 70.1 | 73.9 | 72.2 | 71.7 | 70.9 | 77.7 |
(b) Total rollouts
| Rollouts | Success |
|---|---|
| 12 | 73.6 |
| 48 | 77.3 |
| 96 | 77.3 |
(c) Successful rollouts
| Rollouts | Success |
|---|---|
| 8 | 74.4 |
| 24 | 77.6 |
| 48 | 77.9 |
(d) Steering choices
| Setting | Success |
|---|---|
| Top- features | 79.6 |
| Top- features | 80.0 |
| Fixed | 75.8 |
| Fixed | 75.7 |

Accessible table, original values and citation links
| Setting | Frozen | Delay 10 | Delay 20 | Without support gate | Without failure gate | Without gates | Ours |
|---|---|---|---|---|---|---|---|
| Mean | 23.63 | 24.63 | 24.88 | 23.13 | 29.88 | 22.38 | 36.13 |
5 Conclusion
A single sparse feature can improve frozen-policy execution when reference matching guides edits. Results remain backbone-, task- and intervention-site-dependent. The method supplies empirical adaptation rather than a safety guarantee or a solution to every zero-success task.
Original presentations and paired robot demonstrations
The primary project supplies two presentations, three real-robot failure/success pairs, eight simulation pairs and a separate mechanism pair: all 26 original movies remain unchanged, with the two original presentation posters and generated first-frame previews elsewhere. The interactive mechanism display maps video time to decisions differently for steered/unsteered clips (.37/.999 seconds per decision); that visualization timing is separate from Table 1’s measured inference latency. Selected movies do not add independent quantitative trials.
Appendix
The complete appendix includes model context, algorithm and mathematical details, training/control protocols, full ablation tables, selected rollout filmstrips and limitations. Main figure/table/equation numbering continues through the appendix.
Appendix A Foundation Action Models
This work adapts already learned/fine-tuned representations rather than introducing a new action architecture. The full detailed ablation Tables 5 and 6 retain every task, reference budget, descriptor variant, coefficient setting, gate removal and tie in the reported means.
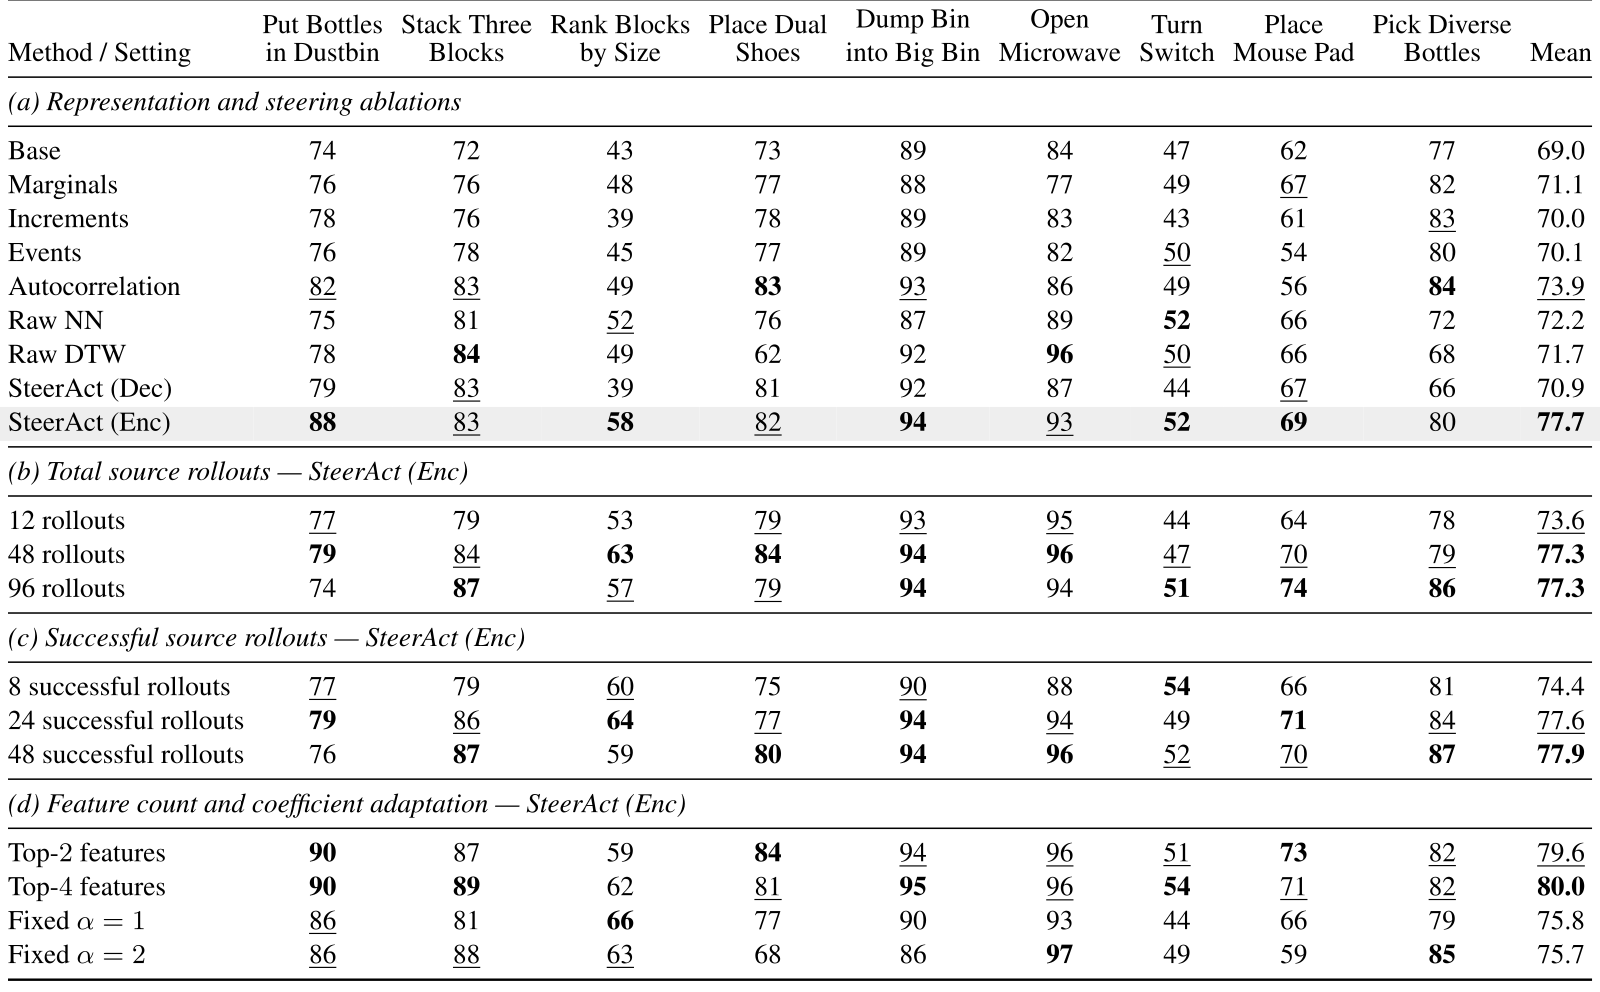
Accessible table, original values and citation links
| Method / Setting | Put Bottles in Dustbin | Stack Three Blocks | Rank Blocks by Size | Place Dual Shoes | Dump Bin into Big Bin | Open Microwave | Turn Switch | Place Mouse Pad | Pick Diverse Bottles | Mean |
| (a) Representation and steering ablations | ||||||||||
| Base | 74 | 72 | 43 | 73 | 89 | 84 | 47 | 62 | 77 | 69.0 |
| Marginals | 76 | 76 | 48 | 77 | 88 | 77 | 49 | 67 | 82 | 71.1 |
| Increments | 78 | 76 | 39 | 78 | 89 | 83 | 43 | 61 | 83 | 70.0 |
| Events | 76 | 78 | 45 | 77 | 89 | 82 | 50 | 54 | 80 | 70.1 |
| Autocorrelation | 82 | 83 | 49 | 83 | 93 | 86 | 49 | 56 | 84 | 73.9 |
| Raw NN | 75 | 81 | 52 | 76 | 87 | 89 | 52 | 66 | 72 | 72.2 |
| Raw DTW | 78 | 84 | 49 | 62 | 92 | 96 | 50 | 66 | 68 | 71.7 |
| SteerAct (Dec) | 79 | 83 | 39 | 81 | 92 | 87 | 44 | 67 | 66 | 70.9 |
| SteerAct (Enc) | 88 | 83 | 58 | 82 | 94 | 93 | 52 | 69 | 80 | 77.7 |
| (b) Total source rollouts — SteerAct (Enc) | ||||||||||
| 12 rollouts | 77 | 79 | 53 | 79 | 93 | 95 | 44 | 64 | 78 | 73.6 |
| 48 rollouts | 79 | 84 | 63 | 84 | 94 | 96 | 47 | 70 | 79 | 77.3 |
| 96 rollouts | 74 | 87 | 57 | 79 | 94 | 94 | 51 | 74 | 86 | 77.3 |
| (c) Successful source rollouts — SteerAct (Enc) | ||||||||||
| 8 successful rollouts | 77 | 79 | 60 | 75 | 90 | 88 | 54 | 66 | 81 | 74.4 |
| 24 successful rollouts | 79 | 86 | 64 | 77 | 94 | 94 | 49 | 71 | 84 | 77.6 |
| 48 successful rollouts | 76 | 87 | 59 | 80 | 94 | 96 | 52 | 70 | 87 | 77.9 |
| (d) Feature count and coefficient adaptation — SteerAct (Enc) | ||||||||||
| Top- features | 90 | 87 | 59 | 84 | 94 | 96 | 51 | 73 | 82 | 79.6 |
| Top- features | 90 | 89 | 62 | 81 | 95 | 96 | 54 | 71 | 82 | 80.0 |
| Fixed | 86 | 81 | 66 | 77 | 90 | 93 | 44 | 66 | 79 | 75.8 |
| Fixed | 86 | 88 | 63 | 68 | 86 | 97 | 49 | 59 | 85 | 75.7 |
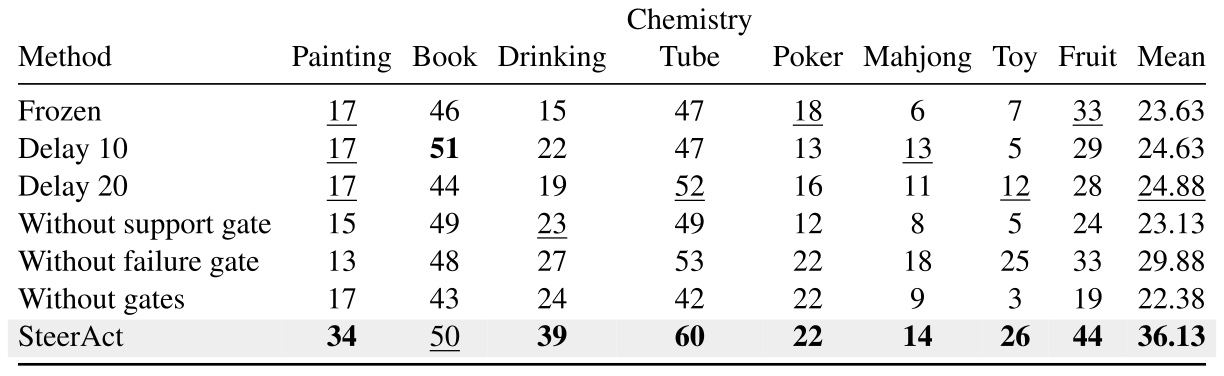
Accessible table, original values and citation links
| Method | Painting | Book | Drinking | Chemistry Tube | Poker | Mahjong | Toy | Fruit | Mean |
|---|---|---|---|---|---|---|---|---|---|
| Frozen | 17 | 46 | 15 | 47 | 18 | 6 | 7 | 33 | 23.63 |
| Delay 10 | 17 | 51 | 22 | 47 | 13 | 13 | 5 | 29 | 24.63 |
| Delay 20 | 17 | 44 | 19 | 52 | 16 | 11 | 12 | 28 | 24.88 |
| Without support gate | 15 | 49 | 23 | 49 | 12 | 8 | 5 | 24 | 23.13 |
| Without failure gate | 13 | 48 | 27 | 53 | 22 | 18 | 25 | 33 | 29.88 |
| Without gates | 17 | 43 | 24 | 42 | 22 | 9 | 3 | 19 | 22.38 |
| SteerAct | 34 | 50 | 39 | 60 | 22 | 14 | 26 | 44 | 36.13 |
Original selectable algorithm
Appendix B Additional Details of Reference-Guided Steering
Algorithm 1 preserves offline bank construction/selection/calibration and every online gate, coefficient, re-encoding and execution step. Two reference rollouts per outcome are a minimum for the within-bank score, not a guarantee that such examples are easy to collect for a failing policy.
B.1 Details of the Support Gate
Each spacing gets six ordinal counts plus 1/2 pseudo-counts. Five hundred sampled probability vectors supply approximate support uncertainty; adjacent overlapping triples violate the independent-count model, as the appendix acknowledges. Tie/availability values stay observed rather than sampled. Offline radius calibration uses three times a specified quantile of pooled k-th-neighbor distances, excluding self-neighbors. The quantile, neighbor counts, minimum triple counts and hysteresis lengths are described as fixed but their numeric values are absent from the four-row hyperparameter table. Support is a representation-coverage check, not a calibrated probability of successful or physically safe execution.
B.2 Details of the Failure Gate
Outcome matching uses fixed coordinate scales combining equally weighted success/failure population variances and their squared mean difference, with a 1e-8 floor. It averages equal effective nearest-neighbor counts from both banks. Only the support gate uses unscaled distances and sampled descriptors; feature selection also stays raw Euclidean. The main text describes outcome neighbors using k(sup), while the appendix distinguishes a separate requested k; the latter supplies the detailed rule without a reported numeric setting.
Equations 7–8
| (7) |
| (8) |
B.3 Details of the Steering Coefficient
Candidate response is α·ρ·wᵀd under an affine selected preactivation, unchanged active set and identical measured/edited token sets. A TopK SAE is not globally affine, and threshold/rank changes can invalidate this local approximation. Nonfinite or tiny estimated response triggers abstention. Search changes only the latest raw intensity and compares the resulting ordinal descriptor with success references, then actual edited states are re-encoded. It does not predict a future trajectory. The algorithm’s measured-intensity cross-reference points to the approximate-response equation; the stated re-encoding operation is retained. Log(1+y/s) preprocessing is monotone and does not add ordinal information.
Equations 9–12
| (9) |
| (10) |
| (11) |
| (12) |
Appendix C Experimental Protocol and Hyperparameters
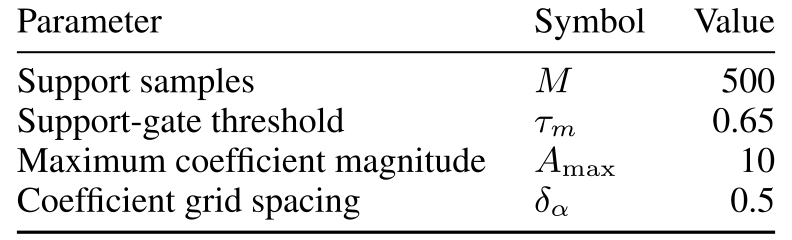
The full protocol distinguishes 500 successful scripted demonstrations for simulation fine-tuning, thirty demonstrations for real fine-tuning, twenty-four outcome-labeled online references per task, pooled SAE training and separate 200/30-trial evaluations. The SAE expands to eight times hidden width and retains the hundred largest activations per token. Table 7 reports M=500, support threshold .65, coefficient bound 10 and grid spacing .5. Exact layer/token sites, some candidate controls, gate thresholds/counts, response minimum and coefficient-tie handling are not fully specified in the manuscript. Frozen steering should not be read as adaptation from only twenty-four episodes starting with no task training.
Accessible table, original values and citation links
| Parameter | Symbol | Value |
|---|---|---|
| Support samples | 500 | |
| Support-gate threshold | 0.65 | |
| Maximum coefficient magnitude | 10 | |
| Coefficient grid spacing | 0.5 |
Appendix D Representation and Intervention-Site Ablations
Marginals, increments, threshold events and autocorrelation/spectral summaries are custom control descriptors. Raw nearest-neighbor/DTW variants compare histories directly but retain the ordinal support gate, so those rows do not remove all ordinal machinery. Enc/Dec compare intervention locations. Complete definitions remain in these notes and full task results remain in the retained tables; no alternative is described as an exact reproduction of a separate published system.
Appendix E Qualitative Paired Simulation Rollouts
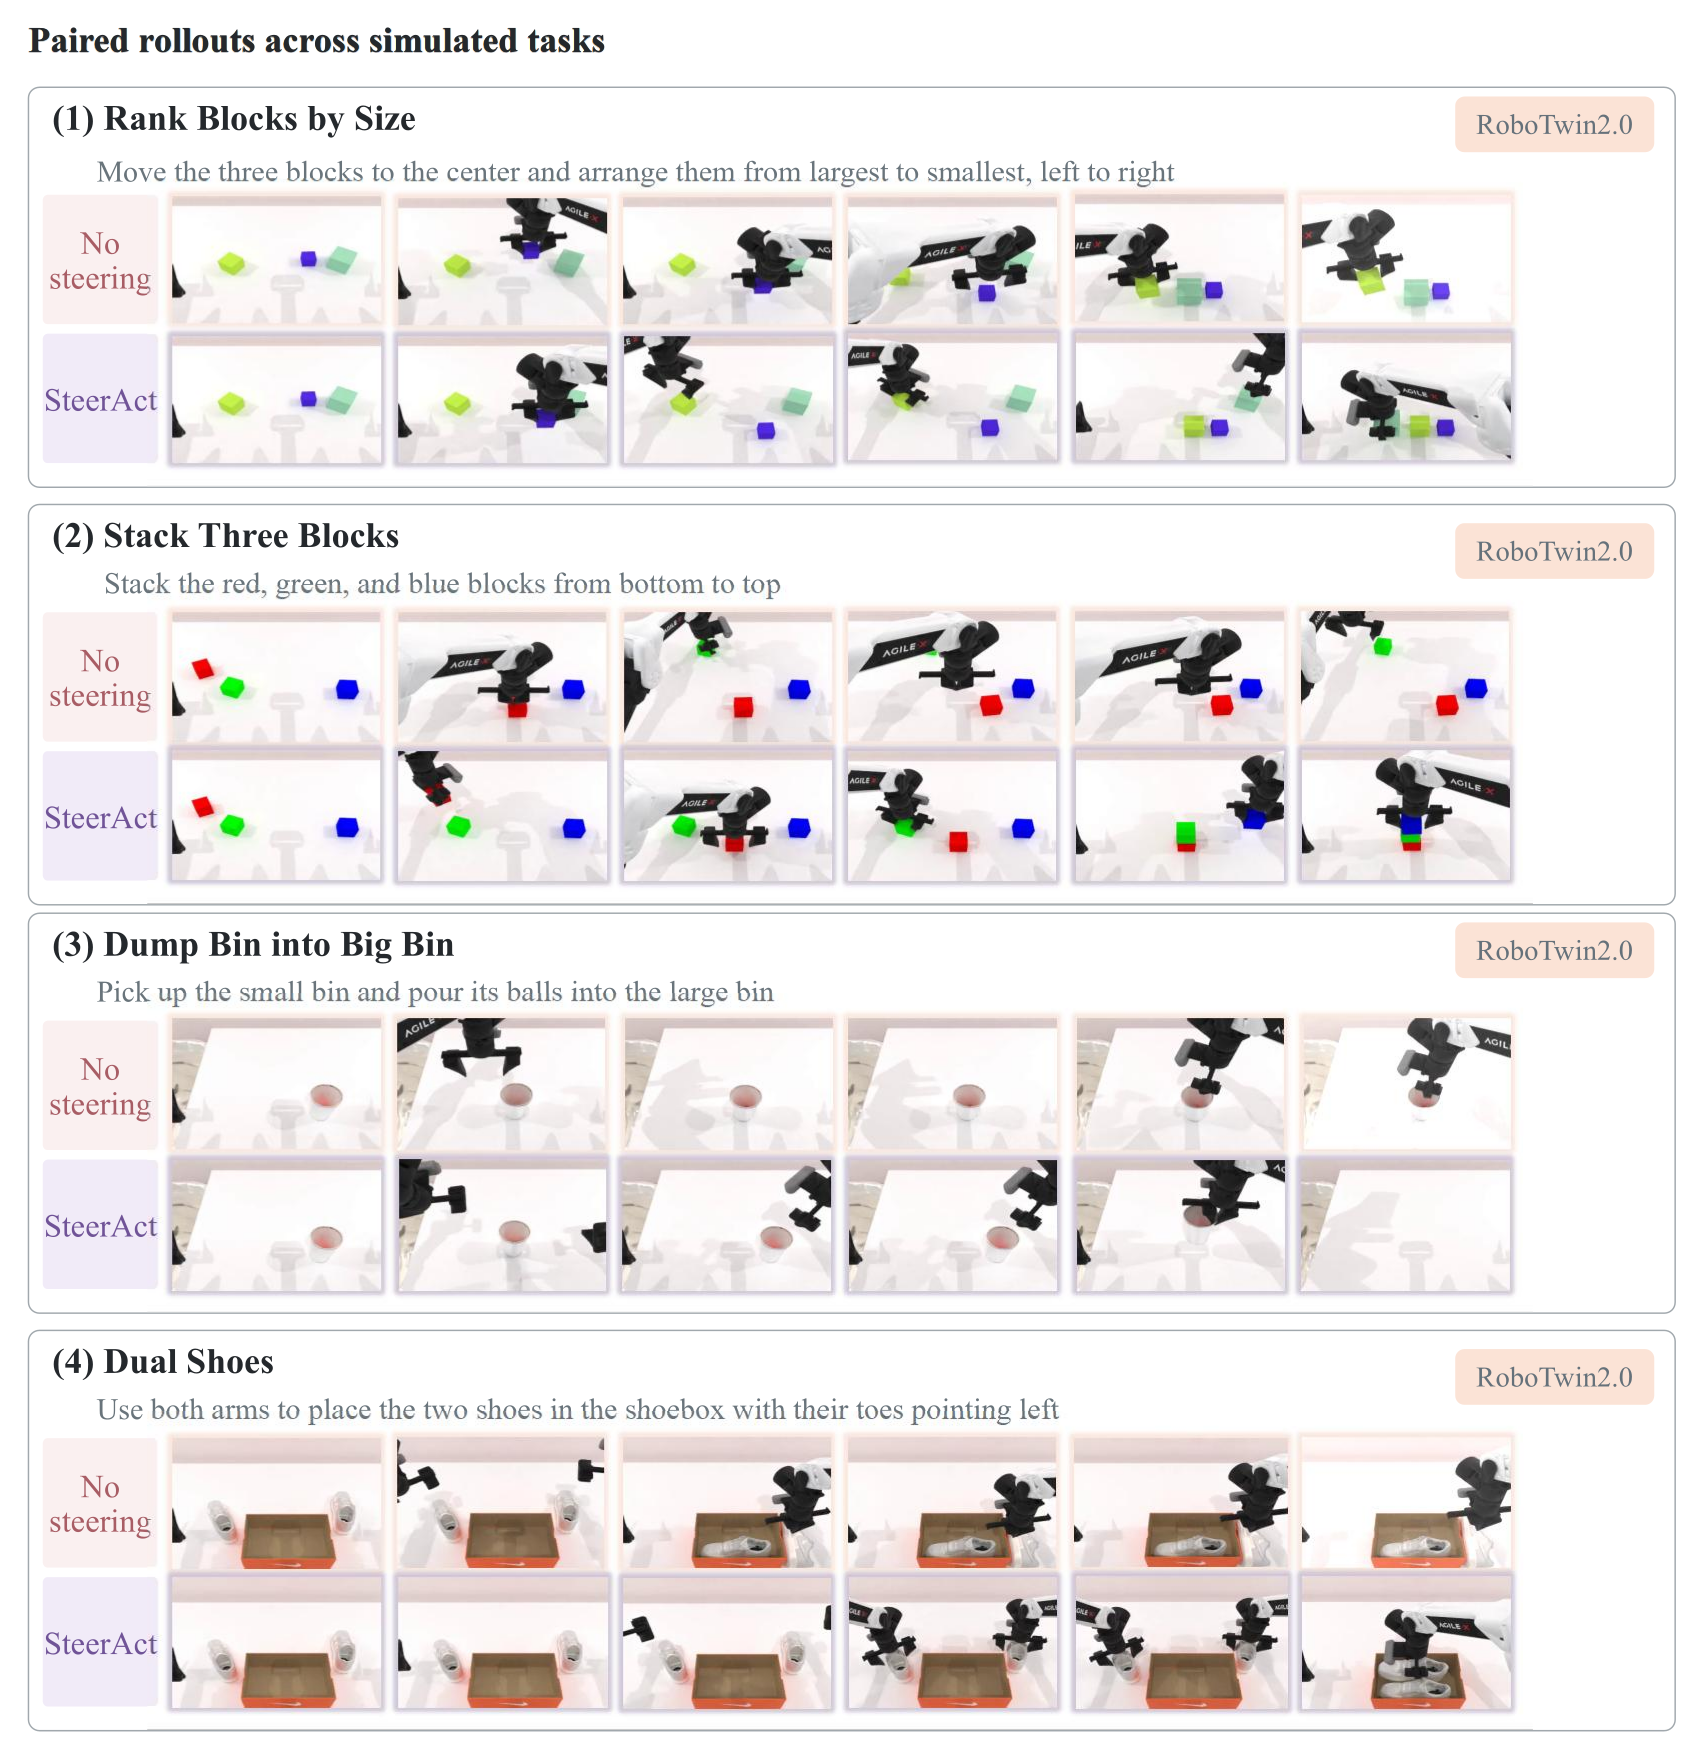
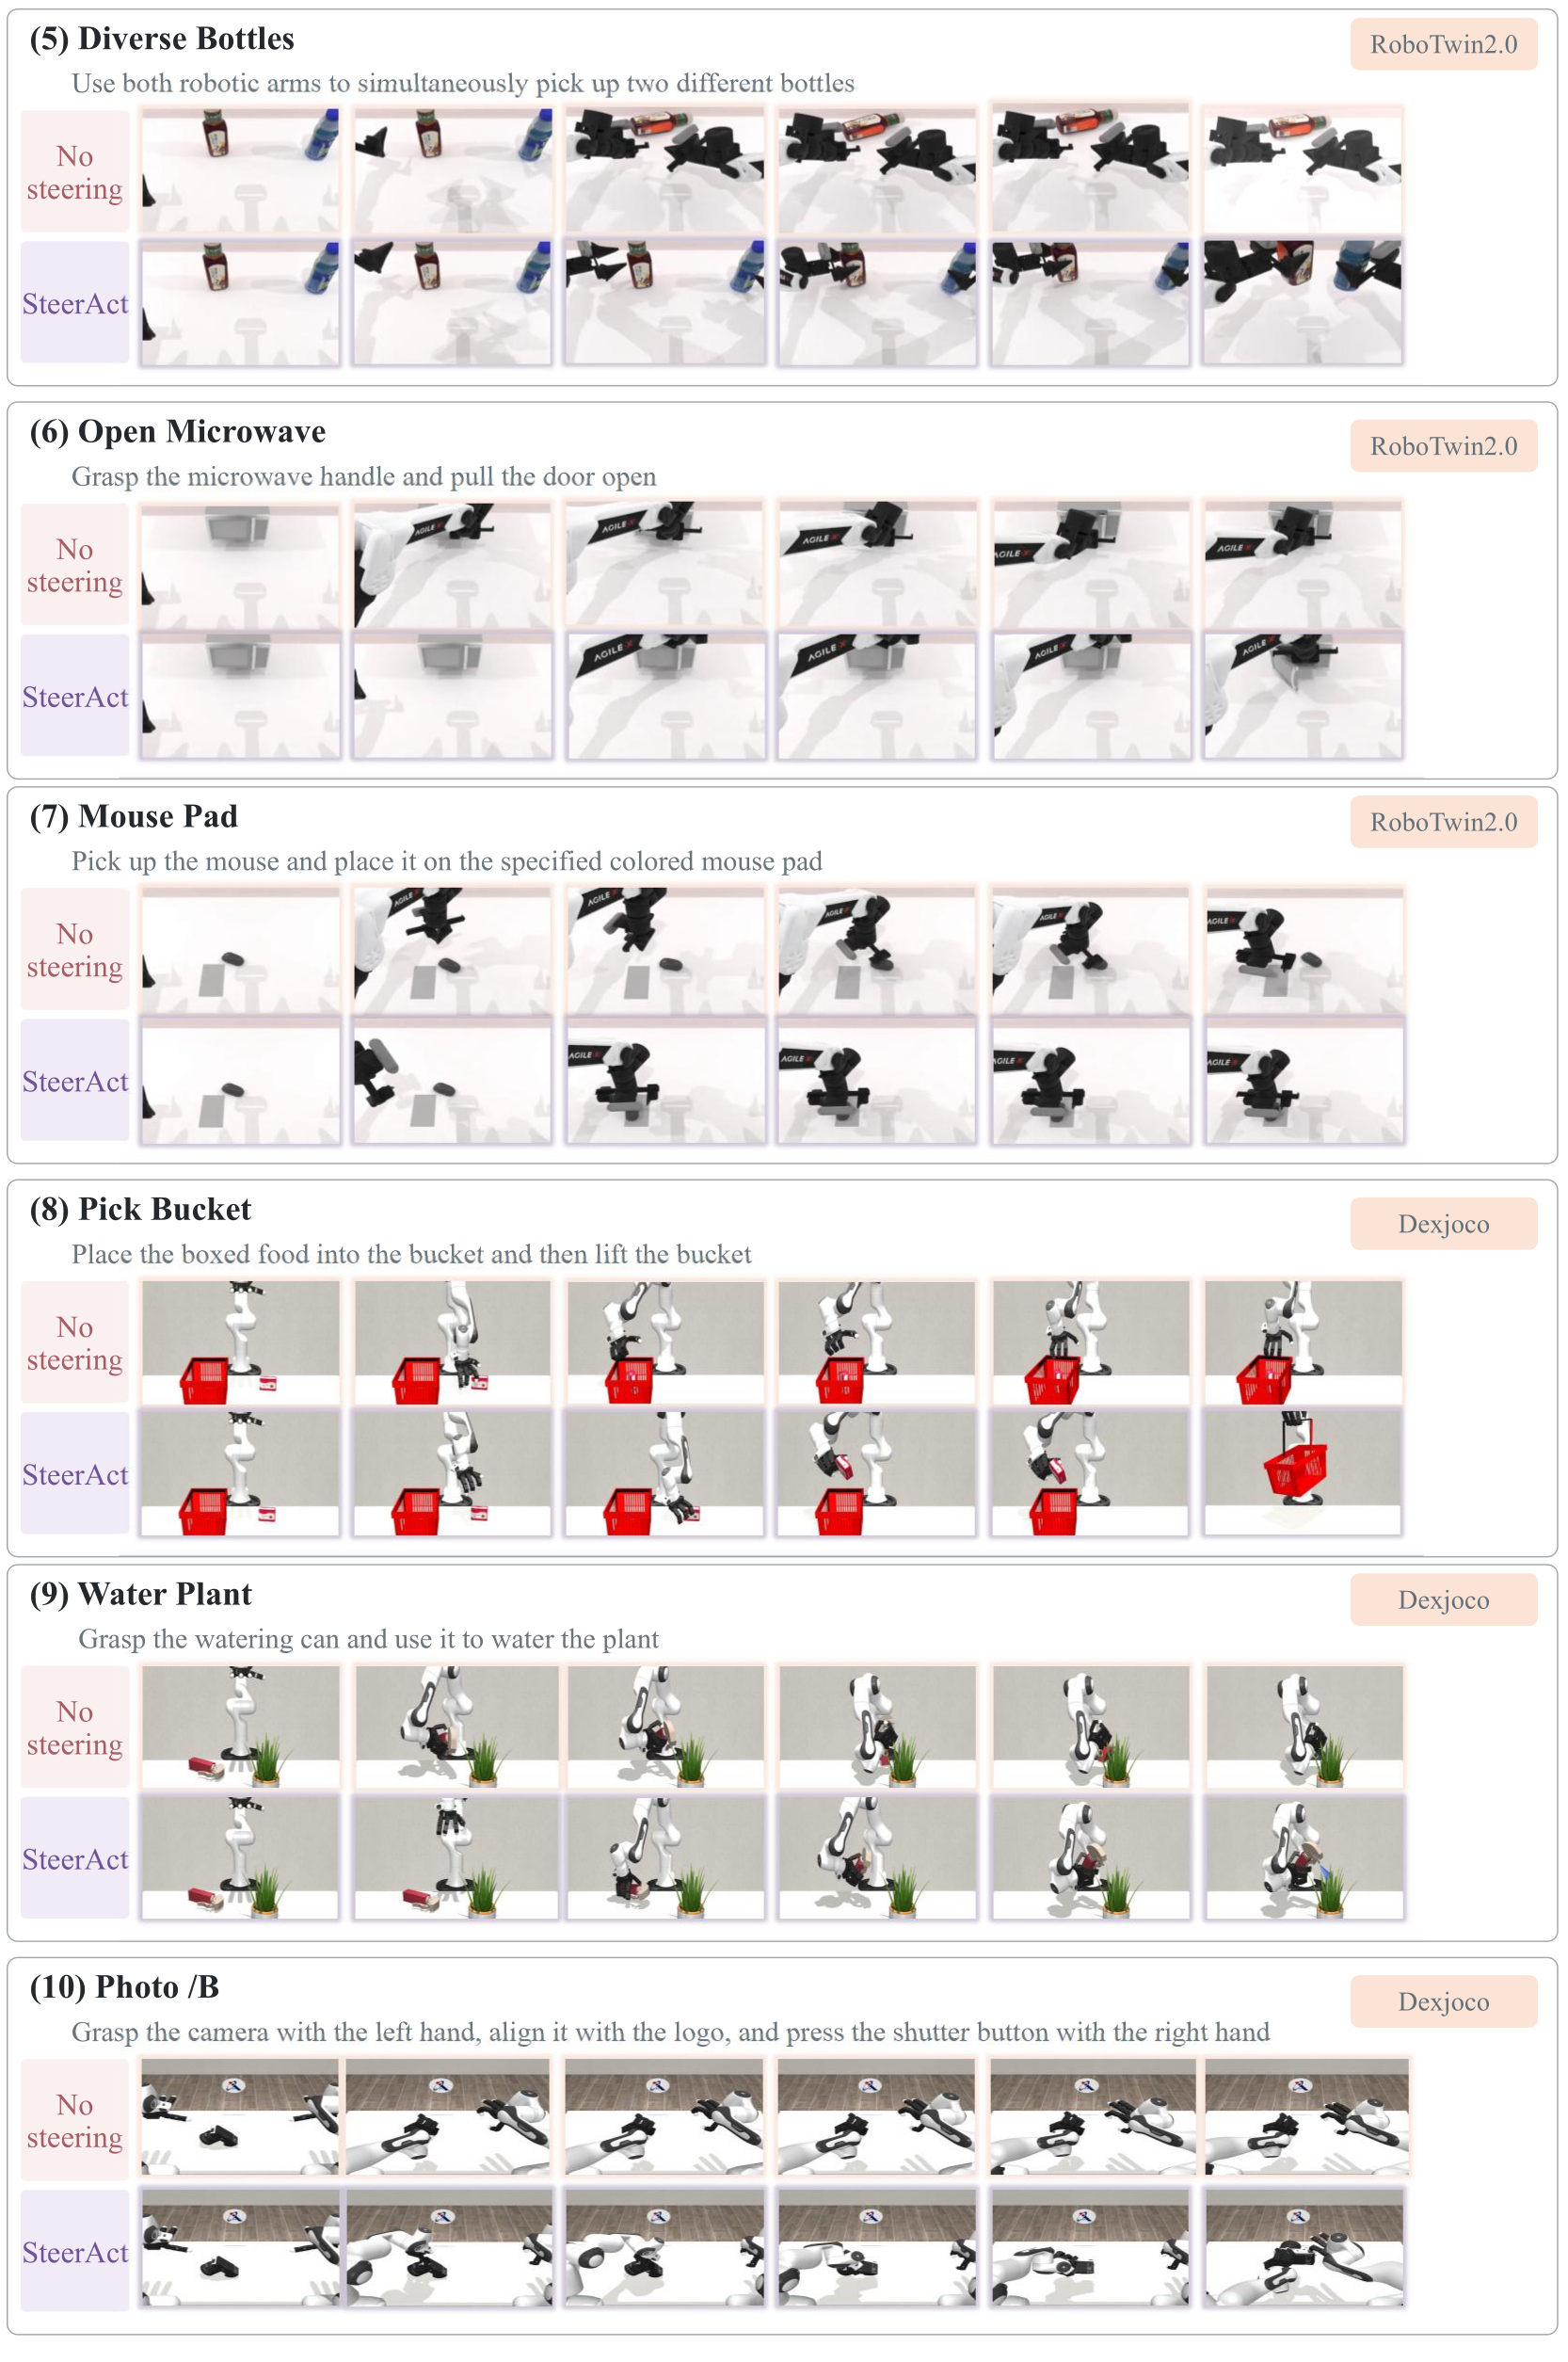
The two full filmstrips retain ten selected matched-initial-scene comparisons, all unsteered/steered rows, instructions and temporal frames. They intentionally show failure-to-success cases. They illustrate possible corrections and do not estimate their frequency independently of the quantitative tables.
Appendix F Limitations.
Timing evidence comes from gate and fixed-delay ablations, without an experiment isolating behavioral phase from instantaneous state. Hidden-state access, SAE feature quality and underlying policy competence constrain transfer. Some tasks still regress or remain at zero, and multiple features outperform the single-feature default in the reported ablation.