Overview
This edition follows arXiv v2 (29 October 2026), retaining all eight figures, 17 tables, 14 displayed equations and six implementation appendices. Read the headline gains as results from eight specified tasks under equal additional trajectory counts. Active takeover time is measured, but total supervision time and independent training-seed uncertainty are not.
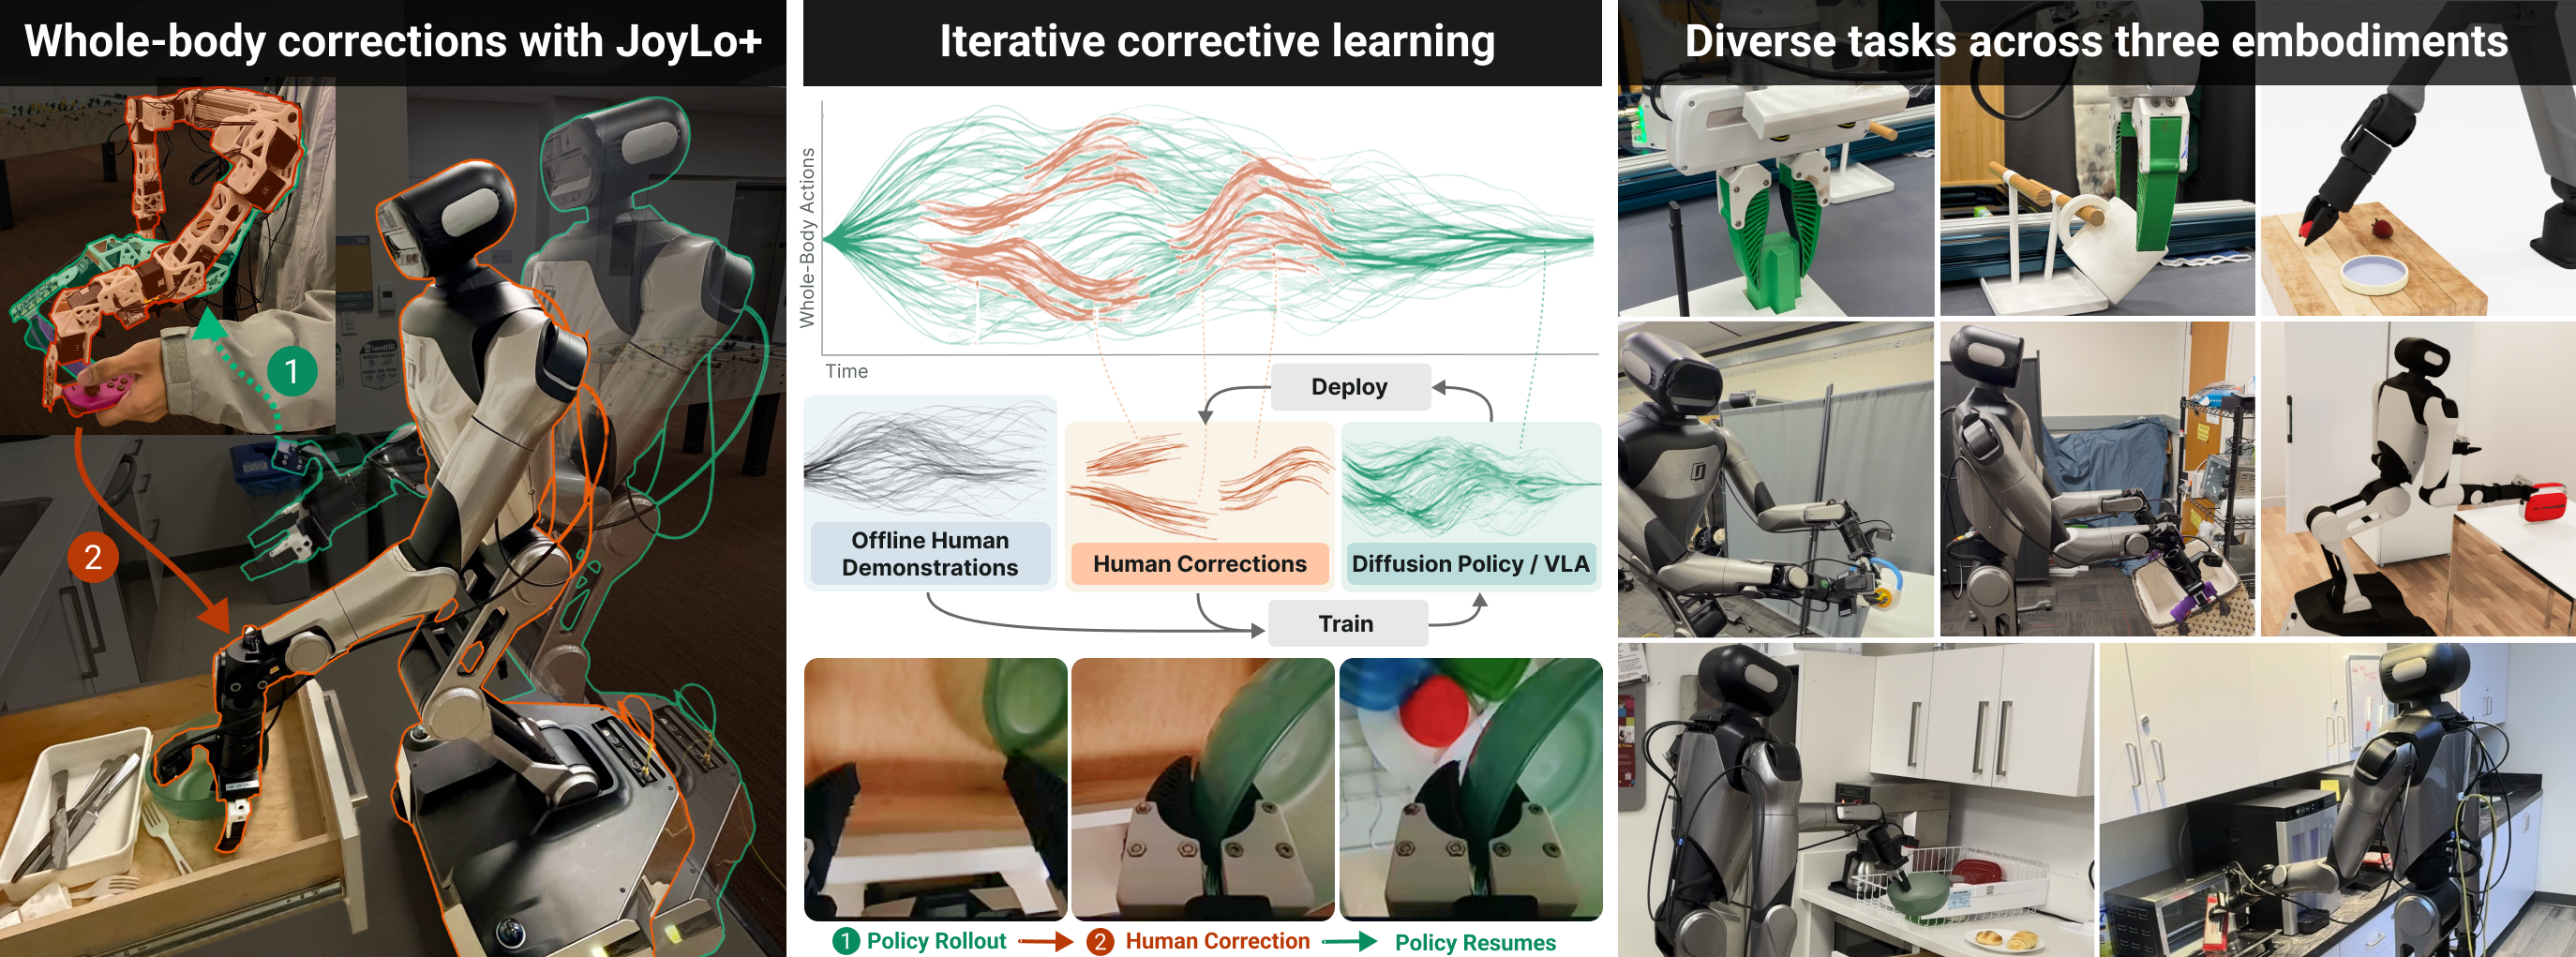
At a glance
I3L combines motorized, touch-triggered whole-body teleoperation with repeated corrective imitation learning. Four rounds of human-gated corrections raise mean autonomous success from 25.6% to 93.9% across eight tasks, 35.6 percentage points above adding the same number of demonstrations. Every final task rate is at least 90%. Mean active takeover duration falls 72% across collection rounds. These results use human-triggered scripted corrections in simulation and physical JoyLo+ leaders on real robots; the three-operator study excludes failed collection attempts.
I Introduction
Long manipulation sequences amplify distribution shift: a small error in the arm, torso or base can invalidate an otherwise competent policy. Corrections target such policy-visited failures instead of replaying already-mastered behavior. I3L contributes an integrated interface and repeated collection/retraining protocol, then examines reliability and intervention burden on four real mobile tasks plus two fixed-arm and two simulated tasks. It builds on DAgger and human-gated DAgger; its evidence concerns an implemented whole-body system rather than a new guarantee against compounding error.
II Related Work
Motorized leader interfaces keep the operator aligned with autonomous commands; touch sensing makes takeover practical. Prior interactive-learning methods differ in intervention triggers and treatment of autonomous, corrective and pre-intervention data. I3L combines these interface ideas with comparisons of collection schedules and learning rules. Its mobile experiments extend earlier corrective manipulation systems, while algorithm comparisons are concentrated in simulation rather than performed across all physical tasks.
III Method
Deploy a policy, label operator takeovers, merge useful corrective segments with demonstrations, retrain, and deploy the new policy. JoyLo+ makes coordinated physical corrections possible; the learning study determines which collected segments are used.
| System | Mobile | Bimanual | Multi-embodiment | Actuated | Correction |
| ALOHA/2 [2, 51] | – | – | – | – | |
| GELLO [20] | – | – | – | ||
| Mobile ALOHA [31] | – | – | – | ||
| TeleMoMa [32] | – | – | |||
| JoyLo [21] | – | – | |||
| UME [52] | – | ||||
| CR-DAgger [18] | – | – | – | – | |
| HACTS [34] | – | – | – | ||
| RoboCopilot [17] | – | ||||
| JoyLo+ (ours) |
Mobile: coordinated arm and mobile-base control; torso where available. Multi-embodiment: distinct arm kinematics on real hardware. Actuated: leader motors respond to robot state, torque, or policy targets. Correction: takeover or kinesthetic guidance during autonomous rollouts. JoyLo+: R1 Pro (mobile, bimanual); R1 Pro and Franka (multi-embodiment).
III-A JoyLo+: A Hardware Interface for Whole-Body Policy Intervention
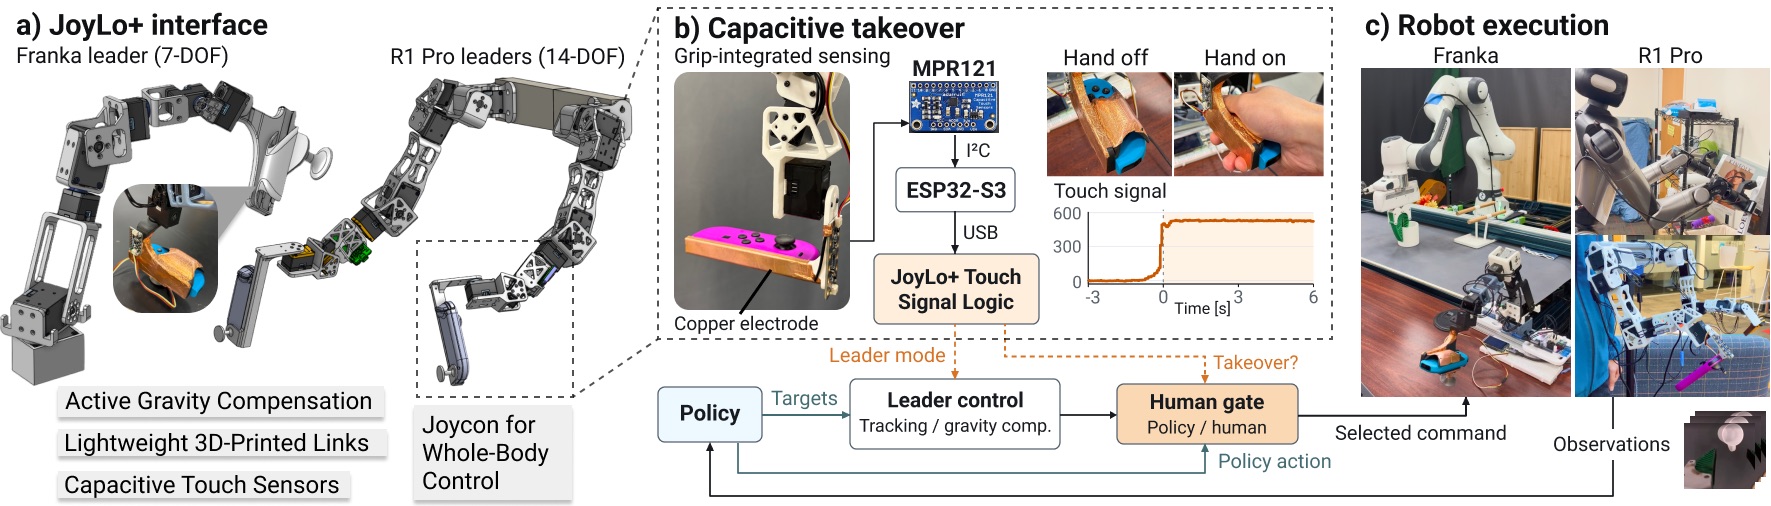
JoyLo+ has one seven-joint leader for Franka or two for R1 Pro. It follows policy targets during autonomy and permits gravity-compensated hand guidance during takeover. Table I compares demonstrated capabilities of related interfaces; a dash means a capability was not demonstrated in the cited work.
Actuated leaders for tracking and correction
Printed links and calibrated joint maps match each robot. Leader motors track commanded policy poses, then support hand-guided correction. The quoted $1,257.49 is one R1 Pro leader and listed accessories; the two-leader estimate is about $2,515 and excludes the robot and several assembly costs.
Grip-integrated sensing for direct takeover
Copper grip electrodes connect an MPR121 sensor to an ESP32-S3. Separate touch/release thresholds and delayed release prevent brief contact loss from returning authority prematurely. Touch detection, serial publication and authority switching have distinct timing; takeover is not a measured zero-latency process.
Coordinated takeover and policy resumption
Either grip or active Joy-Con input transfers the entire R1 Pro command to the human: both arms, torso, base and grippers. Leaders specify arm targets and Joy-Cons control the rest. Release triggers replanning from the corrected state. The appendix additionally specifies a two-second command blend at R1 takeover entry.
III-B Intervention Detection and Recording
Each frame stores observation, executed command, counterfactual policy proposal and supervision category: demonstration, intervention, the preceding 15 frames, or autonomy. Executed commands follow the human/oracle during correction. These labels support filtering and reweighting; they are separate from manually annotated task stages.
III-C Iterative Interactive Imitation Learning
Each round changes both the dataset and the policy that generates the next collection distribution.
Data aggregation
HG-DAgger retains original demonstrations and active correction starts from every round. The preserved aggregation equation formalizes this union. For diffusion-policy chunks, filtering selects start frames; contiguous action targets can cross a takeover boundary, so an eligible chunk need not contain exclusively corrective actions.
Equation 1
| (1) |
Policy retraining and redeployment
Every round restarts from the same initial weights or pretrained checkpoint and trains on the accumulated dataset. It is repeated retraining, not an incremental update to the previous trained policy. The resulting policy collects corrections against its remaining errors.
IV Experiments
The experiments separate practical whole-body deployment, precise fixed-arm manipulation and controlled simulation comparisons. They examine additional demonstrations versus corrections, single versus iterative collection, body-part involvement, learning-rule choice and variation across operators.
IV-A Experimental Setup
Because multi-round physical collection is expensive, alternative algorithms and schedules are compared on two simulated tasks. Real experiments validate the selected four-round HG-DAgger protocol rather than establish a hardware-wide ranking of every method.
Tasks and platforms
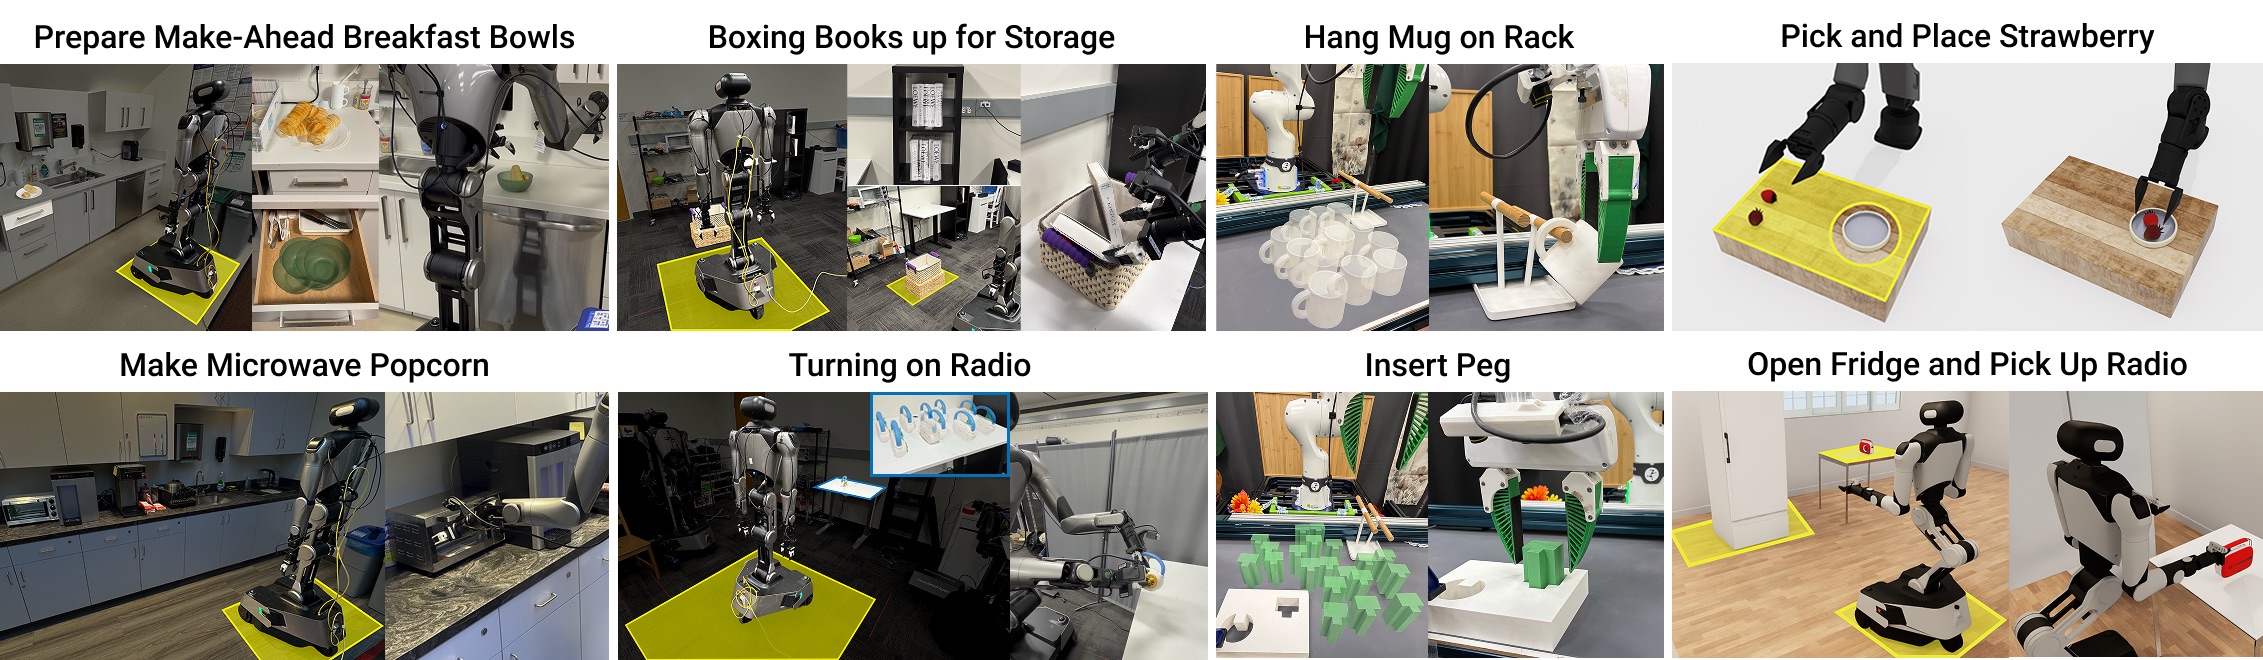
Eight tasks span 29 stages and three embodiments: simulated A1 strawberry placement and R1 fridge/radio retrieval; real Franka mug hanging and peg insertion; and real R1 breakfast preparation, book storage, microwave loading and radio activation. Simulated corrections use privileged-state cuRobo oracles selected by a human. Real mobile tasks average about 83 seconds, with breakfast and books near two minutes; initialization regions appear in Figure 3.
Evaluation protocol
Each real evaluation condition uses 25 autonomous rollouts. Simulation uses 50 rollouts for each of five evaluation seeds. Those seeds randomize evaluation of one trained checkpoint, not five independent trainings. During supervised collection, takeover-free completion is a separate outcome from the final autonomous evaluation rate.
Training
A1 and Franka use task-trained Diffusion Policy with ImageNet encoders; R1 uses pretrained π0.5. Every round trains DP for 200,000 steps or the VLA for 40,000, then evaluates the final checkpoint. Initialization is held common across rounds; dataset size and policy-induced state coverage change.
IV-B Q1: Targeted Corrections Improve Task Performance
Adding 100 correction trajectories in four rounds improves mean success by 68.3 points, versus 32.7 points from 100 extra demonstrations, a 35.6-point difference. The real mobile subset gains 81 points over base policies and 30 over extra demonstrations. Individual outcomes remain visible: fridge simulation actually falls from 39.6% to 30.4% with extra demonstrations, while correction reaches 90%. Equal trajectory counts do not establish equal frame counts, compute or total operator time.
| Task | Base | 100 Demos | 100 Corr. (Ours) |
|---|---|---|---|
| Simulation | |||
| Pick-and-Place Strawberries | 53.2% | 55.6% | 92.8% |
| Open Fridge and Pick Up Radio | 39.6% | 30.4% | 90.0% |
| Real world (Franka, Diffusion Policy) | |||
| Mug Hanging | 6/25 (24%) | 17/25 (68%) | 23/25 (092%) |
| Peg Insertion | 7/25 (28%) | 12/25 (48%) | 23/25 (092%) |
| Real world (R1 Pro, VLA) | |||
| Prepare Make-Ahead Breakfast Bowls | 1/25 (04%) | 19/25 (76%) | 24/25 (096%) |
| Boxing Books up for Storage | 3/25 (12%) | 13/25 (52%) | 23/25 (092%) |
| Make Microwave Popcorn | 5/25 (20%) | 20/25 (80%) | 25/25 (100%) |
| Turning on Radio | 6/25 (24%) | 14/25 (56%) | 24/25 (096%) |
IV-C Q2: Iteration Improves Performance and Reduces Intervention Burden
Iteration lets later data target the updated policy, while the burden analysis tracks active takeover during collection.
| Setting | Residual | BC (all data) | SIRIUS | HG-DAgger |
|---|---|---|---|---|
| Open Fridge and Pick Up Radio (VLA) | ||||
| Single round (100) | ||||
| Round 1 (25) | ||||
| Round 2 (50) | ||||
| Round 3 (75) | ||||
| Round 4 (100) | ||||
| Pick-and-Place Strawberries (Diffusion Policy) | ||||
| Single round (100) | ||||
| Round 1 (25) | ||||
| Round 2 (50) | ||||
| Round 3 (75) | ||||
| Round 4 (100) | ||||
Iteration improves success under the same collection budgets
Four rounds of 25 correction episodes beat one 100-episode batch against the fixed base policy by 3.6 points on strawberries and 10 points on fridge/radio under HG-DAgger. This isolates collection scheduling within the reported protocol; other learning rules do not show the same consistent benefit.
Active intervention burden decreases across rounds
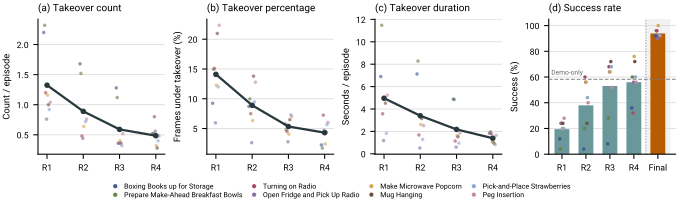
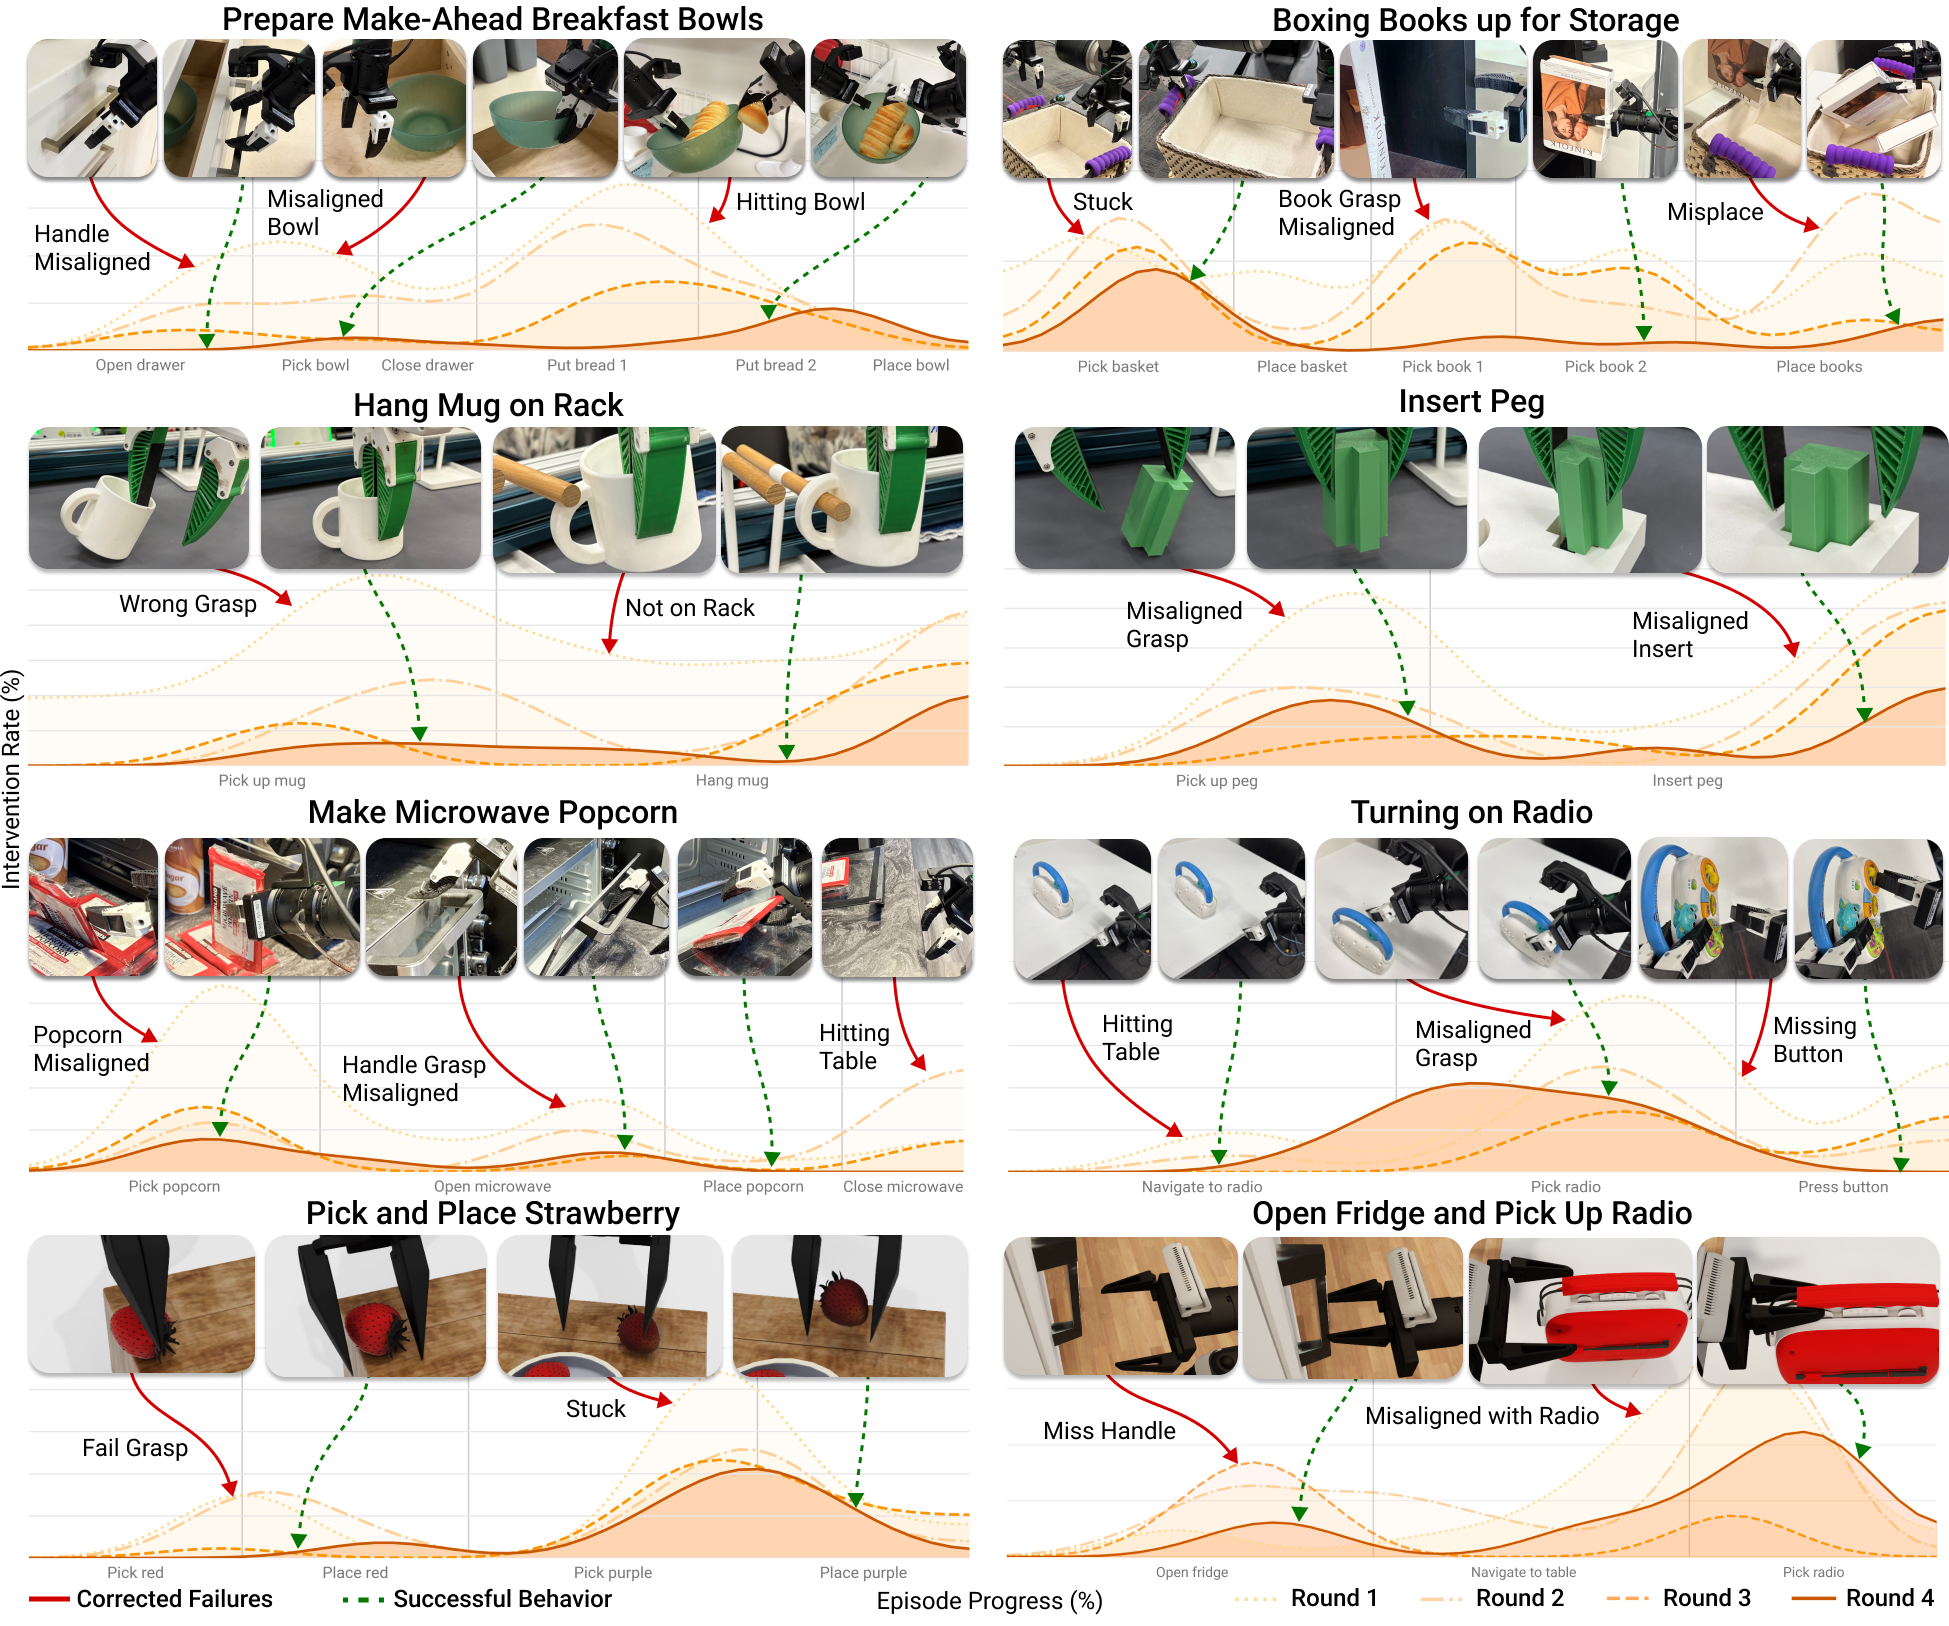
From round 1 to round 4, equal-weight task averages decrease 63.4% for takeover count, 69.5% for intervention-frame share and 72.0% for duration per episode. The final bar is autonomous evaluation, whereas earlier Figure 4 success bars count takeover-free collection episodes. Operators still supervise the whole execution.
Remaining bottlenecks are task dependent
Corrections become concentrated at task-specific bottlenecks: coordinated basket-handle pickup persists after book grasping improves, and the smaller second bread item remains difficult after drawer opening improves. Figure 5 aligns whole-episode progress, with smoothed intervention rates; peaks are descriptive rather than causal tests of these explanations.
IV-D Q3: Corrections Span the Whole Body
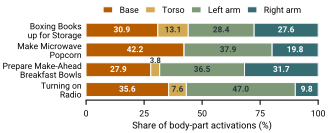
The base contributes 34.2% of normalized body-part votes on average; torso contributes 8.2% across the three tasks where it is active. A takeover can earn votes for several parts, with grippers assigned to arms. These shares measure qualifying segment activations, not time shares or fractions of episodes, and show why arm-only correction can be insufficient.
IV-E Q4: Correction-Learning Algorithm Comparison
Each method collects its own policy-induced corrections and trains on its accumulated data. Table III reports mean and sample standard deviation across evaluation seeds; the datasets are not a shared fixed batch across algorithms.
IV-E 1 Residual Policy
A ResNet/MLP residual adds action-chunk corrections to a frozen base policy, with zero targets outside intervention and half of training draws from corrections. The residual model is reinitialized each round; large required corrections and the frozen base may limit improvement. Full target clipping and sampling rules appear in Appendix F.
IV-E 2 BC (all data)
All-data behavioral cloning samples every collected category, including potentially unsuccessful autonomous behavior. It reaches 88% on fridge/radio but only 10.8% on strawberries after four rounds, illustrating strong task dependence.
IV-E 3 SIRIUS
SIRIUS assigns 50% sampling mass to intervention, up to 50% to demonstrations, and the remainder to autonomy. Four-round HG-DAgger has the best final means: 92.8% on strawberries and 90.0% on fridge/radio. SIRIUS fluctuates and its fridge result is below single-round collection; residual learning gains little from iteration. These observations support the selected protocol on these two tasks, not universal algorithm superiority.
IV-F Q5: Operator Study
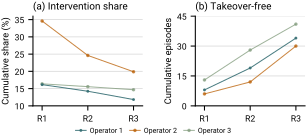
Three operators separately collect three rounds of 25 retained mug-hanging episodes. Cumulative intervention shares fall from 16.1 to 11.8%, 34.6 to 19.9%, and 16.4 to 14.7%; cumulative takeover-free episodes reach roughly 40–55%. These pooled retained-episode measures are not final held-out policy success or round-only intervention rates. Participants receive familiarization, and failed attempts are excluded.
V Conclusion and Limitations
The system combines practical coordinated takeover with targeted iterative data collection and substantially improves the tested policies. Limits include only eight tasks, simulation-only algorithm comparisons, three operators on one task, repeated full retraining and active-intervention rather than total human-time accounting. Broader tasks/users, cheaper incremental updates and failure-aware assistance remain open.
Appendix A Robot Hardware, Observations, and Control
The appendix specifies robot-space commands before normalization. Real and simulated R1 action vectors have the same dimensions but different base semantics and gripper signs; they must not be treated as interchangeable.
A-A Action Representations
The retained equations define each platform’s action layout, while the notes distinguish policy state from the larger recorded state.
Franka (Real)
Real Franka commands seven absolute arm angles and one gripper value: negative opens, positive closes. Policy state contains measured angles and the previous gripper command; recording also includes velocities. The configured full opening is 80 mm.
Equation A1
| (A1) |
R1 Pro (Real)
Real R1 commands 23 values: three base velocities, four torso angles, two seven-joint arms and two grippers. Base velocities are local-frame m/s and rad/s; joints are absolute radians; −1 opens grippers. The adapter applies Table A1 limits and deadbands. The VLA selects 26 of 46 recorded state/velocity coordinates, including base pose and velocity, then pads to 32.
Equation A2
| (A2) |
A1 (Simulation)
Simulated A1 commands six absolute joint angles and a gripper; +1 opens and −1 closes, opposite the real convention. It uses position control and physical grasping. Policy state derives a binary gripper state from the 0.024 m finger-position threshold.
Equation A3
| (A3) |
R1 Pro (Simulation)
Simulated R1 base actions are local translation/yaw increments per step, converted to position targets; +1 opens grippers. It uses position control with assisted grasping. The 23 selected policy-state entries include base velocity but exclude base pose, then pad to 32.
A-B Home Poses and Kinematic Calibration
Home postures and encoder maps are platform-specific calibration settings, not learned universal transforms.
Franka (Real)
Table A2 retains Franka signs, offsets and home angles. Encoder conversion uses zero 2048 and π/2048 radians per count. Peg insertion changes joint 7 home to −3π/4 and adds a −π/2 leader offset to preserve the physical leader posture.
| Joint | Sign | Leader offset | Home angle |
|---|---|---|---|
| 1 | |||
| 2 | |||
| 3 | |||
| 4 | |||
| 5 | |||
| 6 | |||
| 7 |
R1 Pro (Real)
Real R1 starts with zero torso angles and zero base velocity, while base pose varies within the task’s marked region. Mirrored leaders use distinct sign vectors and zero additive offsets; encoder scale matches Franka.
A1 (Simulation)
A1 uses the specified six-joint home pose and 0.03 m fingers. Its base and bowl stay fixed while strawberry positions vary.
R1 Pro (Simulation)
Simulated R1 uses torso (−0.63, 1.65, 1.05, 0), elbows at −1.57 radians and 0.05 m fingers. Base translation varies ±0.15 m and heading ±18°.
A-C Camera Layout and Image Formation
All policies use RGB rather than depth. Cropping and state/prompt preparation differ by platform.
Franka (Real)
Franka uses external and wrist ZED cameras, selects the left stereo eye, applies Table A3 crops and resizes to 240². DP takes random 224² crops for training and centered crops for evaluation. Camera firmware, exposure settings and viewpoints stay fixed across rounds.
R1 Pro (Real)
Real R1 uses head and both wrist views. The interface supplies 240² images, datasets store 224², and VLA resizing preserves aspect ratio with padding. It also receives a task prompt.
A1 (Simulation)
A1 renders external and wrist views at 240² and applies training-random/evaluation-centered 224² crops. Table A4 preserves camera translations and quaternion conventions.
| View | Translation | Quaternion |
|---|---|---|
| External | ||
| Wrist |
R1 Pro (Simulation)
Simulated R1 uses head and two wrist cameras from the robot asset, processed to 224² alongside the task prompt.
A-D Frequencies, Timing, and Input Devices
Table A5 separates 30 Hz action/rendering loops, 120 Hz simulation physics, 100 Hz leader control and 200 Hz touch-state publication. Publication frequency does not equal touch-sensor detection latency.
Franka (Real)
Franka uses Deoxys with a 100 Hz client and joint gains 200/14, while environment actions run at 30 Hz. Two observations condition DP; eight actions execute between plans. Table A6 retains recording and gripper controls.
| Control | Function |
|---|---|
| R | Close gripper |
| ZR | Open gripper |
| X | Start recording |
| A | Accept and save trial |
| Y | Discard trial |
| Home | Home robot and leader |
| End collection block |
R1 Pro (Real)
Real R1 targets a 30 Hz environment loop with 100 Hz joint interpolation. Leaders control arms; Joy-Cons control other parts. Inputs use a 20% dead zone and smoothing coefficient 0.9; Table A7 gives all mappings.
| Control | Function |
|---|---|
| Left stick, unpressed | Base translation (up to 0.3 m/s per axis) |
| Left stick, pressed | Base yaw via horizontal deflection (up to 0.4 rad/s) |
| Right stick, vertical | Torso pitch (joint 3) |
| Right stick, horizontal | Torso yaw (joint 4) |
| Left D-pad, up / down | Move torso joints 1–2 toward stand / squat |
| ZL / ZR | Toggle left / right gripper |
| X / A / Y | Start recording / save / discard trial |
| Home | Home robot and leaders |
| End collection block |
A1 and R1 Pro (Simulation)
Both simulations apply actions/render at 30 Hz with physics at 120 Hz. Keyboard input gates privileged scripted corrections.
Appendix B JoyLo+ Mechanical and Takeover Design
The physical interfaces combine existing kinematic leader designs with policy tracking and capacitive takeover. Simulation uses a separate keyboard/oracle protocol rather than the hardware.
B-A Mechanical Structure and Actuation
At 100 Hz, autonomy sends joint targets to onboard position controllers. Takeover switches leaders to current mode with gravity compensation and current limits. This is leader hand-guidance control, not a claimed robot contact-force controller.
Franka (Real)
Franka uses three XM430 and four XC330 servos on separate 12 V/5 V buses. Its configuration adds no autonomous tracking-current cap; hand-guidance proportional, integral and damping gains are zero, with empirical gravity multipliers plus velocity assistance and a deadband.
R1 Pro (Real)
Each R1 leader has four XM430 and three XC330 motors; both leaders share one bus per family. Autonomous tracking caps are 1.076 A for larger motors and 0.150 A for smaller ones. Hand guidance uses reduced proportional/damping gains and mirrored empirical gravity compensation.
A1 and R1 Pro (Simulation)
Simulated corrections need no physical leaders, motor buses or hand-guidance tuning.
B-B Touch Hardware, Wiring, and Firmware
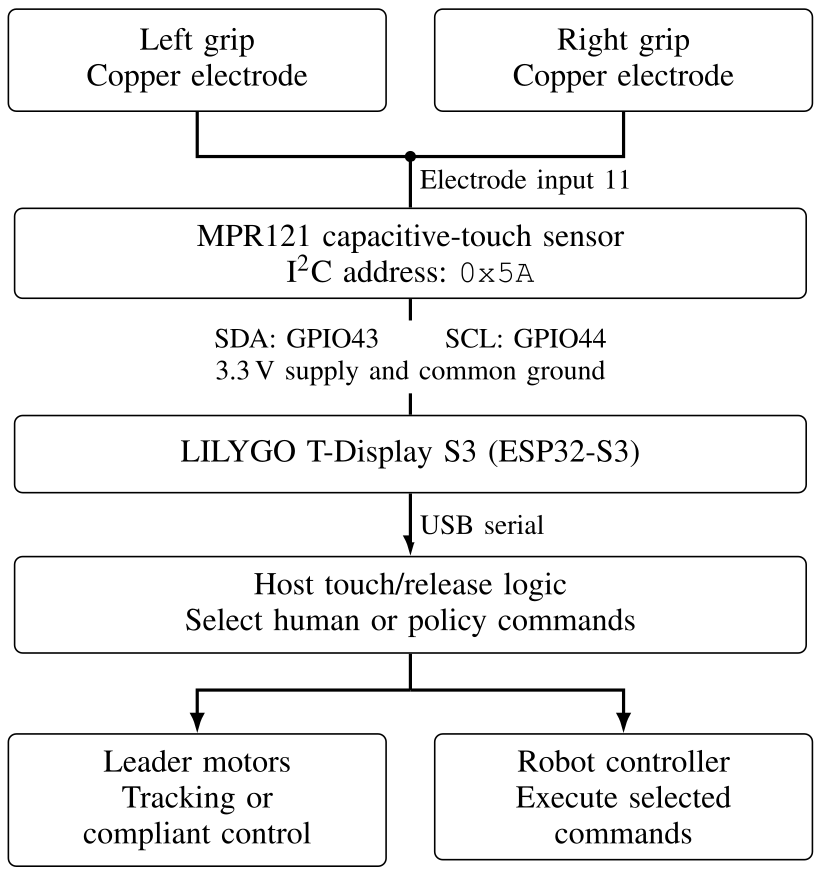
The original wiring diagram and Table A8 retain the electrical connections and sensor settings.
Shared electronics: Franka and R1 Pro (Real)
One MPR121 and ESP32-S3 read the grip electrode at input 11 using address 0x5A and GPIO 43/44. Sampling is every 16 ms; host publication is 200 Hz. Calibration collects untouched/held readings, sets touch between their robust percentiles and release at 60% of touch, then reflashes firmware. Disconnected or >0.5 s stale sensing is treated as inactive and follows release unless another input is active; this is not a fail-safe hold guarantee.
| Setting | Value |
|---|---|
| Enabled electrodes | All 12 channels |
|
Thresholds
(touch / release) |
195 / 117 |
| Charge current | 63 A |
| Sample interval | 16 ms |
|
Debounce
(touch / release) |
Three consecutive qualifying detections |
| Baseline calibration | Automatic configuration and tracking |
Franka (Real)
Franka keeps human authority for 0.5 seconds after contact ends, unless another input renews it.
R1 Pro (Real)
Both R1 grip electrodes share one sensor input, so either grip triggers global authority. Release waits 0.3 seconds after both are clear, subject to other active inputs.
A1 and R1 Pro (Simulation)
Simulation has no touch thresholds or grip-release delay; keyboard input selects the oracle.
B-C Authority Switching and Policy Resumption
The resumption logic prevents stale autonomous plans from simply continuing after correction; platform implementations differ.
Franka (Real)
Franka selects human commands on touch/Joy-Con input, clears pending plans at takeover and release, and holds while awaiting a fresh policy prediction. At release, the leader target is first set to its measured pose before tracking resumes. Predictions during correction remain enabled, but temporary hold commands are not valid counterfactual policy actions.
R1 Pro (Real)
R1 transfers all body parts together, even if the human moves only one. Entry linearly blends policy and human commands over two seconds; the release step retains human commands before fresh policy execution. This qualification matters when interpreting “instant” touch-triggered takeover.
A1 (Simulation)
For strawberries, the human chooses intervention and resumption times; a simulator-state/cuRobo oracle generates arm and gripper motion. The learned policy receives only cameras/proprioception and replans afterward.
R1 Pro (Simulation)
For fridge/radio, the oracle corrects base, torso, arms and grippers from current task state. Human keyboard gating and recorded intervention labels remain the same.
B-D Bill of Materials and Cost Scope
Table A9 preserves component quantities and prices. Estimates exclude the robot, tax, shipping, cabling, fasteners, bearings and mounting hardware; project CAD is linked in the source.
Franka (Real)
One Franka leader and listed accessories total $1,087.49, including three larger and four smaller servos.
R1 Pro (Real)
One R1 leader and accessories total $1,257.49. The paper estimates the dual-leader arrangement at roughly twice that, about $2,515.
| Quantity | |||
| Component | Unit cost | Franka | R1 Pro |
| XM430-W350-T servo | $220 | 3 | 4 |
| XC330-M288-T servo | $50 | 4 | 3 |
| U2D2 USB adapter | $30 | 2 | 2 |
| Power supply (12 V/5 V) | $25 | 2 | 2 |
| Printed links (set) | $15 | 1 | 1 |
| Joy-Con pair | $80 | 1 | 1 |
| Adafruit MPR121 | $7.95 | 1 | 1 |
| LILYGO T-Display S3 | $9.54 | 1 | 1 |
| Copper tape | $5 | 1 | 1 |
| Estimated total | $1,087.49 | $1,257.49 | |
A1 and R1 Pro (Simulation)
These physical-interface costs do not apply to the keyboard-based simulation protocol.
Appendix C Simulation Setup and Data Collection
Simulation supplies controlled initialization and privileged motion oracles, allowing collection and learning comparisons at scale.
C-A Simulator Configuration
OmniGibson runs A1 in an empty scene and R1 in Rs_int, using BEHAVIOR assets. Actions/rendering run at 30 Hz and physics at 120 Hz. A1 uses physical grasping; R1 uses assisted grasping. Goals must hold for 20 steps; timeouts are 800 and 900 action steps respectively.
C-B Task Initialization
Randomization is bounded and task-specific; the study does not evaluate arbitrary new environments.
Strawberries
Strawberries are randomized with at least 0.15 m separation from each other and the fixed bowl. Robot initialization stays fixed.
Fridge and radio
The fridge begins closed and the radio on a separate table. Base pose varies ±0.15 m and ±18°; fridge/table offsets are shared up to ±0.10 m on one axis and independently ±0.05 m on the other.
C-C Demonstration and Correction Collection
The same privileged-state planners generate demonstrations and human-gated corrections. The oracle selects its next motion from current task state; these low-level sequences are grouped into the manually annotated stages used for analysis.
Strawberries (14 motion substeps)
Fourteen motions perform the same seven-step sequence for red then purple strawberry: open, approach above, lower, grasp, lift, move over bowl and release.
Fridge and radio (14 motion substeps)
Fourteen motions open the gripper, approach/reach/grasp/pull/release the fridge handle, reset torso/retract arms/open, navigate to the separate table, then approach/reach/grasp/lift the radio.
Appendix D Data Recording and Processing
Recordings retain both executed and proposed commands plus supervision labels; analysis annotations are produced separately.
D-A Recorded Data and Intervention Labels
A correction trajectory includes autonomous and intervention segments. It is an entire recorded rollout, not a trajectory composed only of human actions.
Franka
Franka records two 240² views, eight action values and 16 state/velocity values. Gripper velocity is a zero placeholder; policy input uses a smaller state subset.
Real R1 Pro
Real R1 records three views, 23 actions and 46 state/velocity values in matching body-part order. Gripper openings are mapped to command range and their velocity entries are zero placeholders.
Intervention labels
Demonstrations, active correction, preceding 15 frames and autonomy receive labels 1–4. Active intervention wins when pre-intervention windows overlap; the retained piecewise equation specifies precedence.
Equation A4
| (A4) |
D-B Training-Data Preparation
Normalization and eligible-start sampling define which parts of recorded trajectories train the policy.
Normalization
DP scales joint and other non-gripper action groups to [−1,1] using configured limits. Grippers retain platform-specific encodings. The VLA uses its separate state/action adaptation.
Equation A5
| (A5) |
Sampling by supervision source
HG-DAgger samples uniformly over eligible demonstration/intervention starts, so correction mass depends on their counts. All-data BC preserves observed proportions of all four labels. SIRIUS uses intervention mass 0.5, demonstration mass min(fD,0.5), zero pre-intervention mass and residual autonomous mass, renormalizing when categories are absent. Action chunks can cross label transitions.
Equations A6–A8
| (A6) |
| (A7) |
| (A8) | ||||||
D-C Subtask Annotation
Humans mark named subtask start/end frames from episode videos. These intervals support analysis only; takeover labels select training data.
Intervention-rate curves
Figure 5 bins normalized whole-episode progress into 50 bins and pools frame counts. Takeovers shorter than 15 frames are excluded from intervention counts while their frames remain in the denominator; Gaussian smoothing uses σ=3 bins with reflected boundaries.
Displayed subtask boundaries
Displayed boundaries are mean normalized subtask ends from a reference round: round 2 for books/popcorn and round 4 for other tasks. Curves are not separately time-aligned within each subtask.
Appendix E Policy Learning and Deployment
Every round restarts DP/VLA training and uses the final checkpoint. Multiple accelerator types support training, while all real deployments use RTX 4090. Tables A10–A12 preserve hyperparameters and prompts.
E-A Diffusion Policy
DP begins with 75 strawberry demonstrations or 100 per Franka task. Separate ResNet-18 encoders and proprioceptive features yield 1024-dimensional two-observation conditioning for a small 1D U-Net. Training predicts noise with padding-masked squared loss over 16 actions and 100 diffusion steps. It stops at 200k steps on a 300k cosine schedule. Inference uses 16 DDIM steps, discards the first predicted action for alignment and executes eight actions (~0.27 s) before replanning; takeover/reset clears plan/history.
| Setting | Value |
|---|---|
| Initialization | ImageNet ResNet-18 |
| Trainable params. | 27.8M |
| Image input | 2 views |
| Image resolution | |
| Optimizer | AdamW, wd 0 |
| Batch size | 128 |
| Peak / min. LR | / |
| Warmup / cosine | 1k / 300k steps |
| Training steps | 200k |
| Grad. clipping | 1.0 |
| Precision / EMA | float32 / none |
| Prediction horizon | 16 |
| Execution horizon | 8 |
| Seed | 42 |
Equation A9
| (A9) |
E-B Vision–Language–Action Policy
π0.5 fine-tunes all approximately 3.35B parameters from 100 base demonstrations per task for 40k steps (~7 hours on eight H100s). Three views, current state and prompt condition 30 predicted actions; 15 execute per plan. Arm/torso targets become state-relative differences while base/gripper commands retain their semantics; values use checkpoint normalization and padding to 32. EMA decay is 0.99. Table A12’s fridge prompt additionally says to turn on the radio, while the stated evaluation criterion requires opening and lifting it; the edition preserves that source distinction.
| Setting | Value |
|---|---|
| Initialization | base checkpoint |
| Trainable params. | 3.35B (full model) |
| Image input | 3 views |
| Observation horizon | 1 (current observation) |
| Image resolution | |
| Optimizer | AdamW, wd |
| Batch size | 64 |
| Peak / min. LR | / |
| Warmup / cosine | 1k / 30k steps |
| Training steps | 40k |
| Grad. clipping | 1.0 |
| Precision / EMA | bfloat16 / 0.99 |
| Prediction horizon | 30 |
| Execution horizon | 15 |
| Seed | 42 |
| Task | Language instruction |
|---|---|
| Open Fridge and Pick Up Radio | Open the fridge, then pick up and turn on the radio. |
| Boxing Books up for Storage | Place the basket onto the table, and put the two books from the shelf into the basket. |
| Make Microwave Popcorn | Pick up the red popcorn bag from the shelf and place it into the microwave. |
| Prepare Make-Ahead Breakfast Bowls | Retrieve the bowl from the drawer, put the two bread in from the plate, and place the bowl on the right side of the countertop. |
| Turning on Radio | Pick up the radio on the table and poke the orange button. |
Appendix F Evaluation Metrics and Experimental Protocols
The final appendix defines success, intervention aggregation, body-part votes, baselines and the retained-episode operator study.
F-A Autonomous Evaluation and Collection Outcomes
Full-task completion, takeover-free collection and annotated-stage intervention rates are distinct measurements.
Simulation
Simulation success requires both strawberries in the bowl, or the fridge open and the radio lifted from its separate table.
Fixed-base manipulation
Franka success requires the mug supported by its handle on the rack or the peg inserted into its matching fixture.
Whole-body mobile manipulation
Real mobile success requires the bowl containing both breads on the far countertop with the drawer closed; both books in the basket on the table; popcorn inside a closed microwave; or holding the radio and pressing its activation button. These criteria do not require cooking popcorn.
Evaluation metrics
Real rates are counts out of 25. Simulation means and sample standard deviations come from five sets of 50 randomized evaluation rollouts on the same checkpoint. Tables A13/A14 retain every seed and baseline; they do not quantify retraining-seed variation.
| Method | Setting | Seed 0 | Seed 1 | Seed 2 | Seed 3 | Seed 4 | Mean |
|---|---|---|---|---|---|---|---|
| Demo-only | Base (100 demos) | 36.0 | 48.0 | 38.0 | 36.0 | 40.0 | 39.6 |
| Additional demos (200 total) | 30.0 | 28.0 | 42.0 | 26.0 | 26.0 | 30.4 | |
| Residual | Single round (100) | 10.0 | 12.0 | 46.0 | 6.0 | 34.0 | 21.6 |
| Round 1 (25) | 16.0 | 14.0 | 18.0 | 14.0 | 18.0 | 16.0 | |
| Round 2 (50) | 18.0 | 30.0 | 28.0 | 24.0 | 20.0 | 24.0 | |
| Round 3 (75) | 20.0 | 20.0 | 40.0 | 24.0 | 46.0 | 30.0 | |
| Round 4 (100) | 16.0 | 14.0 | 20.0 | 18.0 | 30.0 | 19.6 | |
| BC (all data) | Single round (100) | 86.0 | 84.0 | 88.0 | 56.0 | 82.0 | 79.2 |
| Round 1 (25) | 72.0 | 78.0 | 66.0 | 68.0 | 70.0 | 70.8 | |
| Round 2 (50) | 84.0 | 88.0 | 92.0 | 86.0 | 82.0 | 86.4 | |
| Round 3 (75) | 82.0 | 94.0 | 94.0 | 86.0 | 80.0 | 87.2 | |
| Round 4 (100) | 84.0 | 88.0 | 94.0 | 86.0 | 88.0 | 88.0 | |
| SIRIUS | Single round (100) | 70.0 | 86.0 | 82.0 | 54.0 | 74.0 | 73.2 |
| Round 1 (25) | 76.0 | 36.0 | 48.0 | 78.0 | 36.0 | 54.8 | |
| Round 2 (50) | 58.0 | 66.0 | 56.0 | 74.0 | 88.0 | 68.4 | |
| Round 3 (75) | 82.0 | 50.0 | 84.0 | 54.0 | 82.0 | 70.4 | |
| Round 4 (100) | 78.0 | 66.0 | 64.0 | 68.0 | 82.0 | 71.6 | |
| HG-DAgger | Single round (100) | 86.0 | 90.0 | 82.0 | 54.0 | 88.0 | 80.0 |
| Round 1 (25) | 70.0 | 58.0 | 40.0 | 44.0 | 46.0 | 51.6 | |
| Round 2 (50) | 70.0 | 80.0 | 66.0 | 68.0 | 78.0 | 72.4 | |
| Round 3 (75) | 84.0 | 90.0 | 88.0 | 90.0 | 58.0 | 82.0 | |
| Round 4 (100) | 88.0 | 88.0 | 90.0 | 90.0 | 94.0 | 90.0 |
| Method | Setting | Seed 0 | Seed 1 | Seed 2 | Seed 3 | Seed 4 | Mean |
|---|---|---|---|---|---|---|---|
| Demo-only | Base (75 demos) | 50.0 | 42.0 | 58.0 | 48.0 | 68.0 | 53.2 |
| Additional demos (175 total) | 52.0 | 54.0 | 62.0 | 54.0 | 56.0 | 55.6 | |
| Residual | Single round (100) | 48.0 | 44.0 | 48.0 | 42.0 | 44.0 | 45.2 |
| Round 1 (25) | 56.0 | 46.0 | 50.0 | 46.0 | 48.0 | 49.2 | |
| Round 2 (50) | 48.0 | 46.0 | 46.0 | 44.0 | 44.0 | 45.6 | |
| Round 3 (75) | 50.0 | 36.0 | 44.0 | 30.0 | 40.0 | 40.0 | |
| Round 4 (100) | 56.0 | 42.0 | 42.0 | 36.0 | 58.0 | 46.8 | |
| BC (all data) | Single round (100) | 12.0 | 14.0 | 16.0 | 14.0 | 18.0 | 14.8 |
| Round 1 (25) | 0.0 | 0.0 | 0.0 | 2.0 | 0.0 | 0.4 | |
| Round 2 (50) | 0.0 | 2.0 | 2.0 | 0.0 | 2.0 | 1.2 | |
| Round 3 (75) | 8.0 | 2.0 | 2.0 | 6.0 | 4.0 | 4.4 | |
| Round 4 (100) | 10.0 | 6.0 | 16.0 | 6.0 | 16.0 | 10.8 | |
| SIRIUS | Single round (100) | 76.0 | 78.0 | 74.0 | 74.0 | 78.0 | 76.0 |
| Round 1 (25) | 84.0 | 64.0 | 64.0 | 76.0 | 66.0 | 70.8 | |
| Round 2 (50) | 76.0 | 86.0 | 76.0 | 76.0 | 80.0 | 78.8 | |
| Round 3 (75) | 46.0 | 28.0 | 40.0 | 34.0 | 40.0 | 37.6 | |
| Round 4 (100) | 80.0 | 74.0 | 74.0 | 78.0 | 88.0 | 78.8 | |
| HG-DAgger | Single round (100) | 90.0 | 90.0 | 92.0 | 90.0 | 84.0 | 89.2 |
| Round 1 (25) | 78.0 | 84.0 | 74.0 | 76.0 | 66.0 | 75.6 | |
| Round 2 (50) | 86.0 | 90.0 | 84.0 | 94.0 | 88.0 | 88.4 | |
| Round 3 (75) | 92.0 | 94.0 | 82.0 | 86.0 | 88.0 | 88.4 | |
| Round 4 (100) | 96.0 | 90.0 | 94.0 | 94.0 | 90.0 | 92.8 |
F-B Intervention Burden and Aggregation
Figure 4 counts retained takeover runs within annotated intervals, divides intervention frames by annotated coverage, and converts duration using recorded frame rate. It averages episodes within tasks, then weights tasks equally. The operator plot instead pools all recorded timesteps cumulatively through each round and counts cumulative takeover-free episodes. These differing denominators explain why the plots should not be read interchangeably.
Equations A10–A11
| (A10) |
| (A11) |
F-C Whole-Body Activation Analysis
Pool four 25-episode rounds. A part earns at most one vote per takeover after three consecutive active frames; multiple parts may vote. Thresholds are 0.003 m/s or rad/s base commands, 0.01 rad torso error, 0.02 rad arm error and 0.75 gripper-command error. Grippers count toward arms, and shares normalize by all body-part votes rather than intervention duration.
Equation A12
| (A12) |
F-D Baseline Configurations
Both augmentation conditions add 100 trajectories. Scheduling compares one fixed-policy batch with four updated-policy rounds. Each algorithm collects its own evolving data, and only the residual baseline keeps its base policy permanently frozen.
Residual learning
The residual network uses image/state/base-plan inputs and a zero-initialized output; it always adds an 8-step A1 or 15-step R1 chunk. Targets subtract the frozen base action, clip non-gripper differences to [−2,2], then halve; deployment doubles the output and clips composed commands to [−1,1]. Grippers are absolute commands. Demonstration/autonomous targets are zero and pre-intervention starts are excluded. Sampling masses are 0.3/0.5/0.2, with one fifth of correction draws from each episode’s first 20 correction frames. A padding-masked squared loss plus equally weighted zero-residual penalty trains for 200k steps. Each round reinitializes the residual on accumulated data; stored base predictions keep target meaning fixed.
Equation A13
| (A13) |
F-E Operator Study Protocol
Three lab participants—two experienced and one novice—complete about 25 familiarization episodes, then separately train from the same base checkpoint over three rounds of 25 retained mug-hanging episodes. Failed attempts are excluded. Intervention and takeover-free metrics therefore describe the 225 retained episodes, not all attempts or total practice/supervision time; this small, single-task study cannot establish broad user independence.