Overview
This reading edition covers the complete 27-page paper and appendices A–H. It preserves every original figure at full resolution, including the two demonstration-quality charts grouped together by the HTML source. All tables, equations, procedure, task definitions, data schema and original project videos remain available alongside the notes.
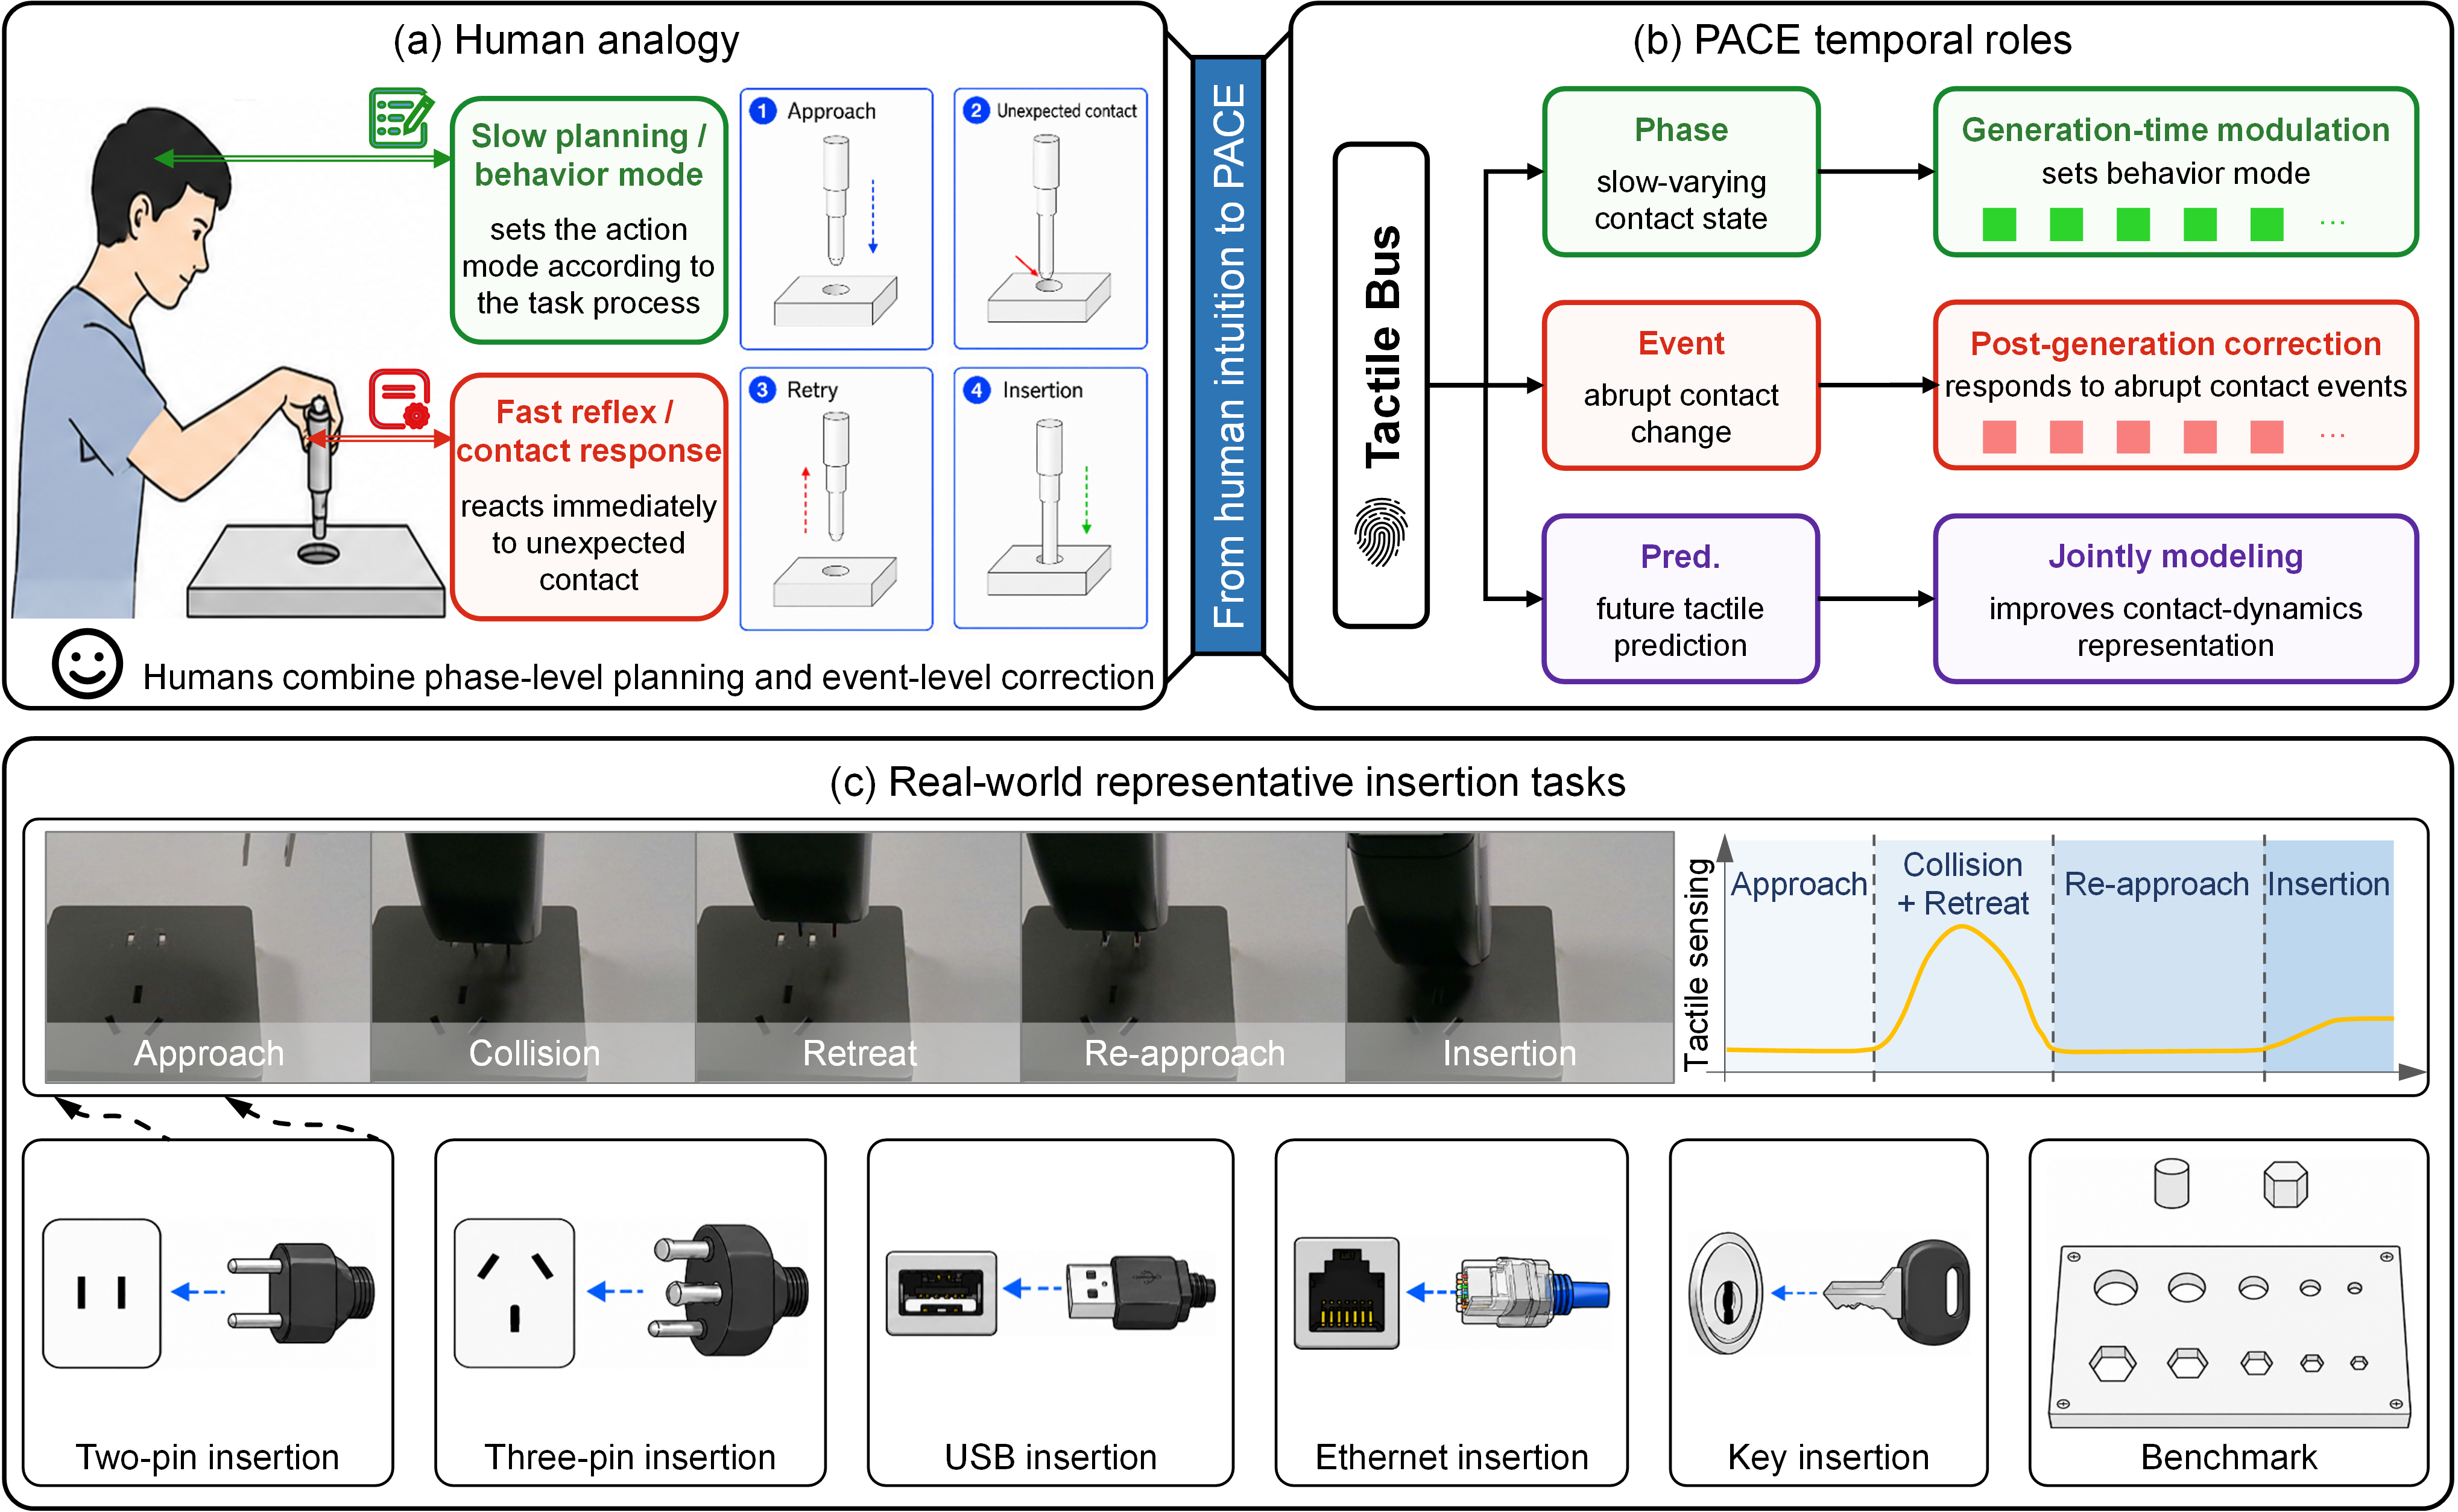
At a glance
PACE gives one contact stream three jobs: smoothed contact state conditions chunk generation, recent contact changes gate a residual correction, and prediction of future tactile changes supplies a training-only auxiliary loss. It achieves 136/150 successes across five physical insertion tasks (90.7%), versus 69/150 for the strongest reported fusion baseline (46.0%). The separate ManipulationNet result is 133/150 (88.7%) over six geometry/clearance conditions; the 0.1 mm subset alone is 40/50 (80%).
1 Introduction
Visual alignment becomes ambiguous when fingers or connectors occlude the contact. A single generation-time tactile pathway must simultaneously represent persistent contact, sudden collisions and action consequences. PACE separates those roles within an ACT-style policy. It is a learned conditioning/correction design, rather than an explicit physical phase estimator or a proven collision-recovery controller. Experiments also distinguish policy architecture from the force-feedback teleoperation used to collect its training data.
2 Related Work
The related work covers compliant insertion, action-chunk execution and visuotactile representation learning. The proposed distinction is where contact information enters the policy pipeline. Existing systems already use tactile fusion or reactive execution; the comparison should not be read as all prior tactile policies lacking every temporal mechanism.
2.1 Precision Insertion and Contact-Rich Manipulation
Classical impedance, hybrid force/position and operational-space methods use structured control laws, while learned methods acquire contact behavior from experience. Occlusion and small clearances motivate physical feedback [7] [9] [10]. PACE evaluates precision insertion with learned corrections; it does not replace those control-law guarantees with an equivalent formal result.
2.2 Action-Chunk Imitation Learning
ACT and Diffusion Policy predict short future action sequences [11] [12]. Execution methods address continuity and observation delay; RDP explicitly combines slow visual generation with fast tactile decoding [34]. PACE corrects a generated chunk using the current tactile window. Its ACT appendix regenerates the full chunk at every control step, so this implementation is not a separately documented asynchronous fast corrector running while a slow generator waits.
2.3 Visuotactile Policy Learning
Prior fusion includes concatenated tokens, cross-attention, adaptive modality weights and predictive tactile objectives. PACE combines generation-time affine modulation, a gated action residual and a contact-prediction auxiliary objective. Their empirical complementarity is tested by ablation rather than established from the human motor analogy alone.
3 Method: PACE
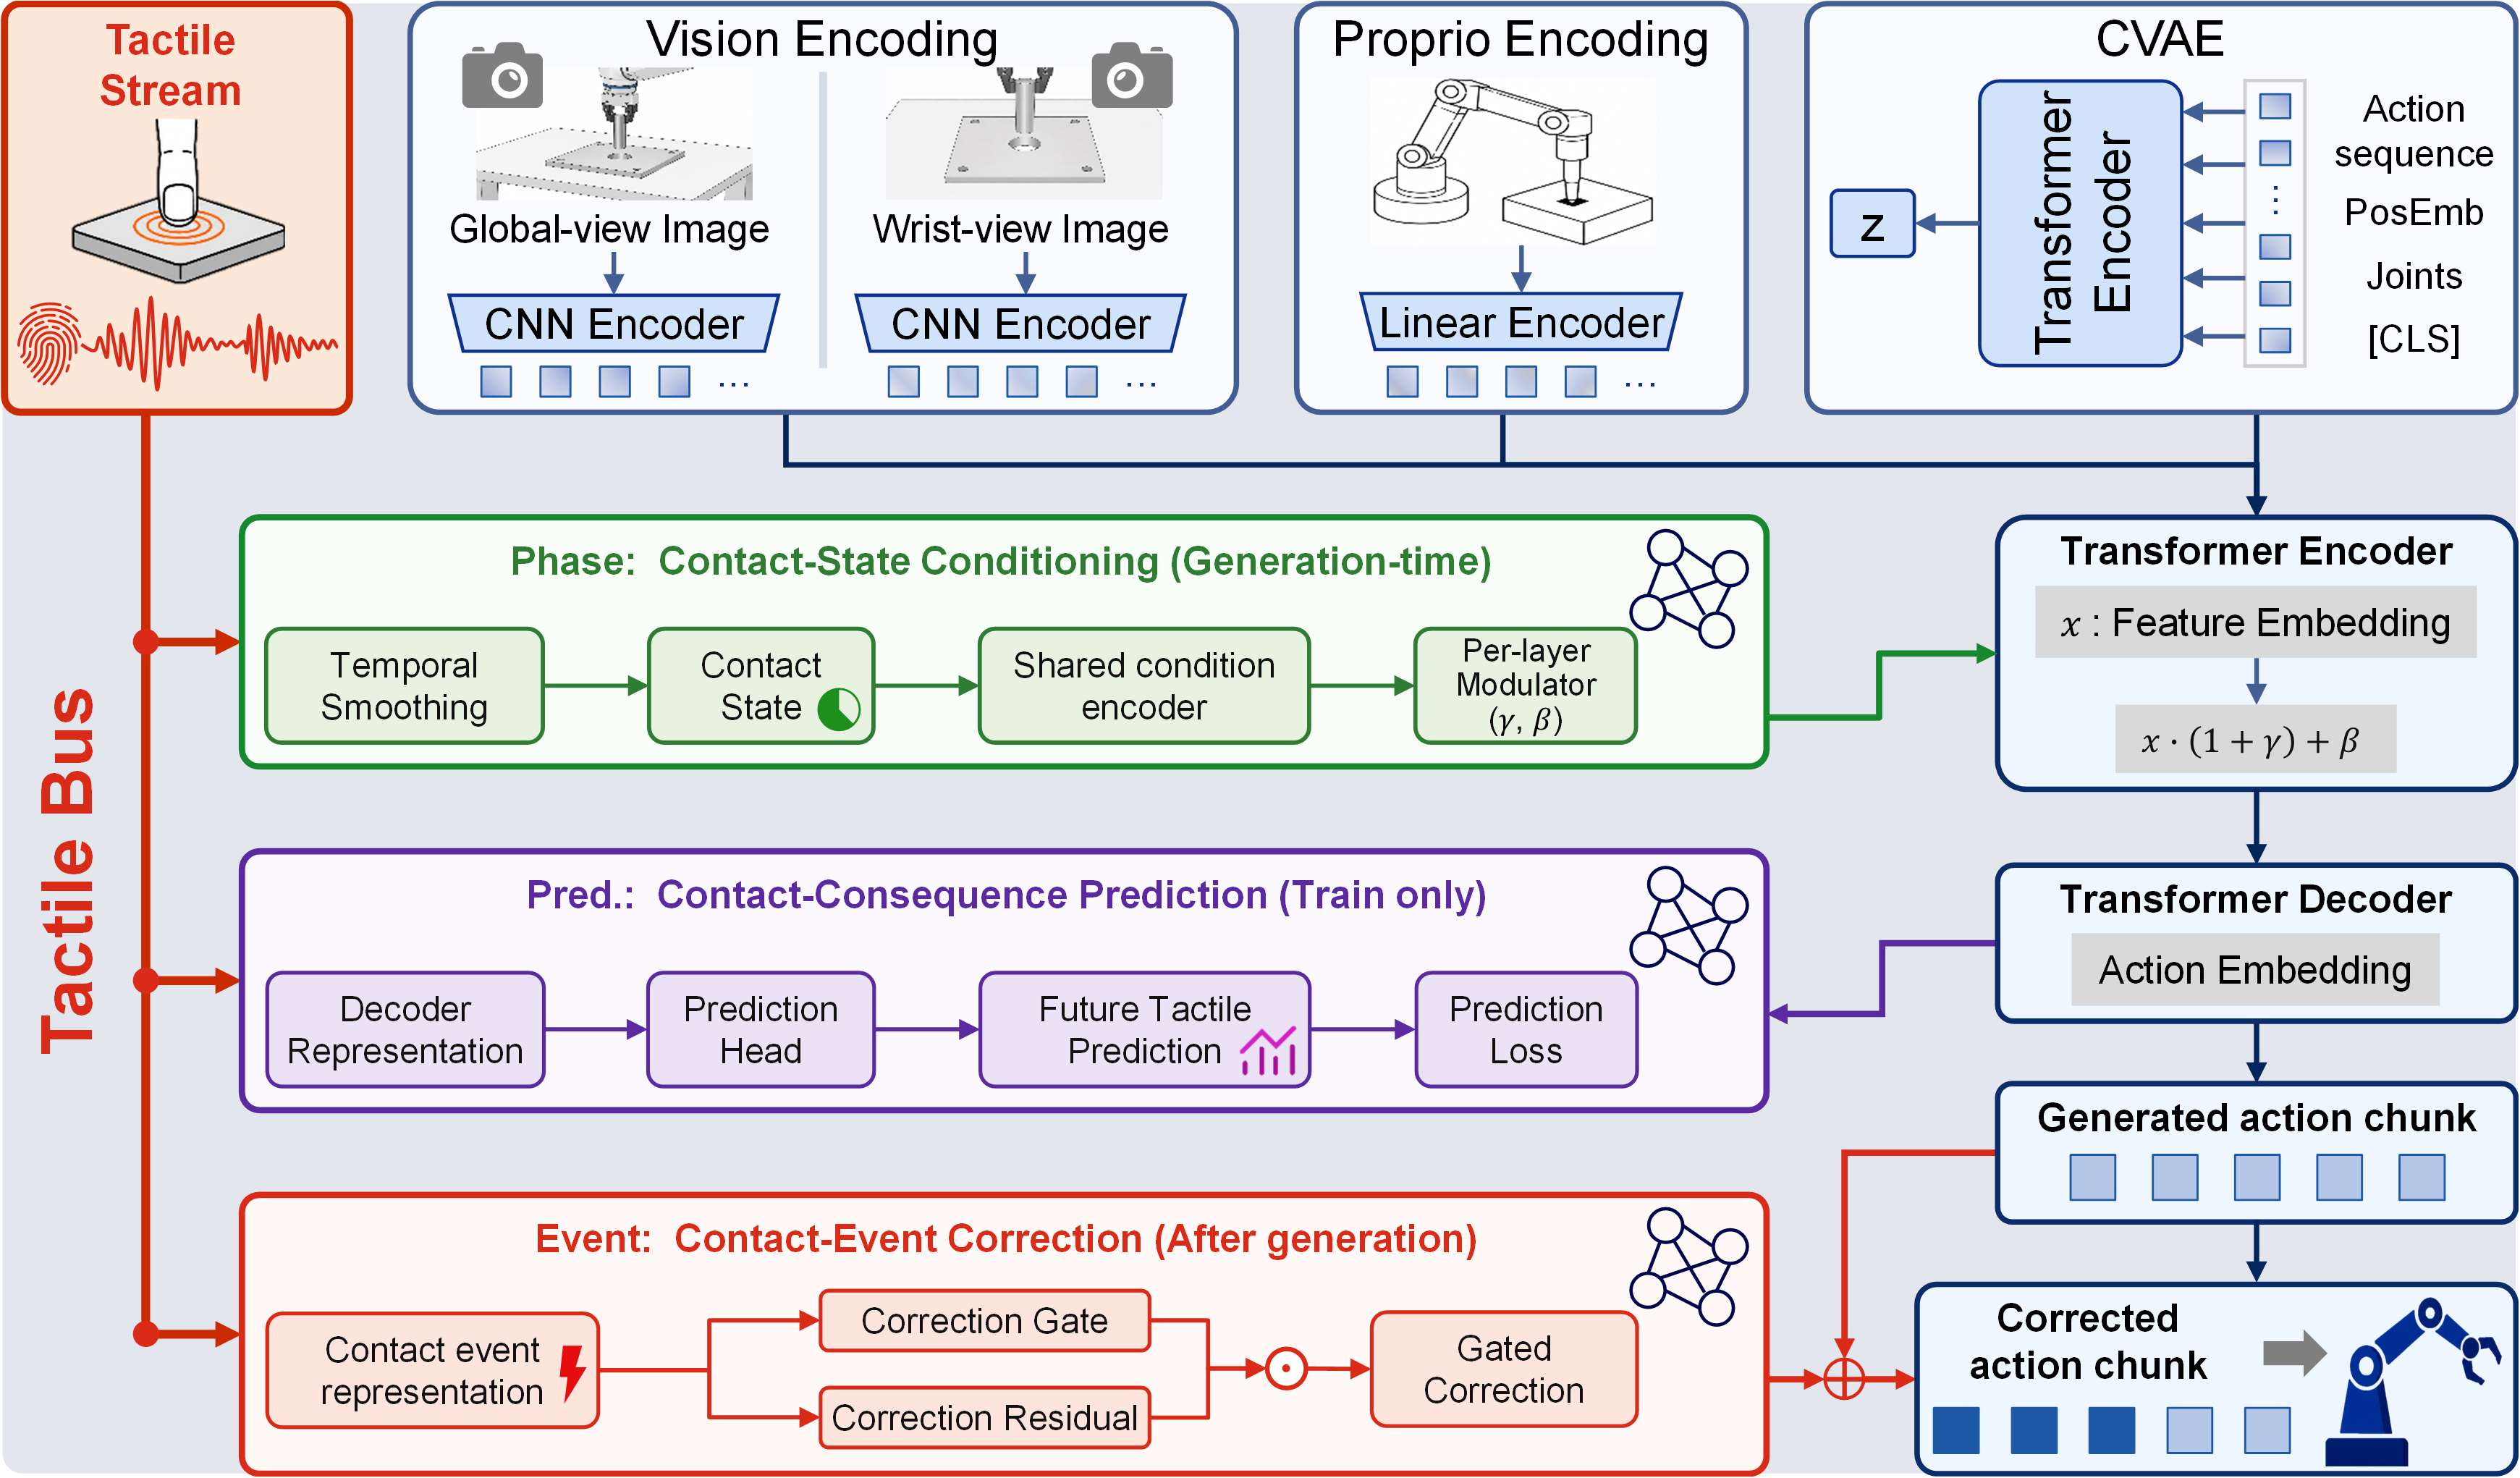
An ACT CVAE-Transformer receives two RGB views, proprioception and a six-dimensional tactile-force signal. The model uses the same physical feedback through three explicit branches. Phase and Event remain at inference, while the consequence-prediction head is removed after training.
3.1 Problem Definition and Method Overview
The default policy uses low-dimensional tactile force, rather than raw tactile images, depth or marker fields. Those richer sensor channels are recorded in the dataset but are not the described default model input. The three branches operate on different representations: encoder features, generated actions and decoder hidden states.
3.2 Contact-State Conditioning for Action-Chunk Generation
An exponential moving average with default α=0.05 filters the tactile stream. A shared contact encoder and per-layer modulators produce scales/shifts applied after encoder LayerNorm. No explicit phase labels supervise approach, search or insertion classes. The term Phase describes the intended role of a learned continuous conditioning signal.
Equations 1–2
| (1) |
| (2) |
3.3 Contact-Event Correction of the Generated Chunk
The event cue combines normalized endpoint difference over a four-frame window with its norm. A sigmoid gate has one value per action coordinate; a separate history MLP predicts residuals for the first five of twenty actions. The corrected prefix spans 0.25 s at 20 Hz. Each new forward pass recomputes the residual from its latest tactile history, then stores the corrected chunk for overlapping temporal ensembling. The longer prefix is a prediction horizon, not a guarantee that five commands execute without further observation.
Equations 3–5
| (3) |
| (4) |
| (5) |
3.4 Contact-Consequence Prediction
A training-only head predicts future normalized tactile increments from the ACT decoder representations. Masked squared error encourages action representations to carry contact information. Removing the head at deployment means the evaluated policy does not score candidate actions by predicted tactile consequences or use that branch as an online safety filter.
Equation 6
| (6) |
3.5 Training Objective
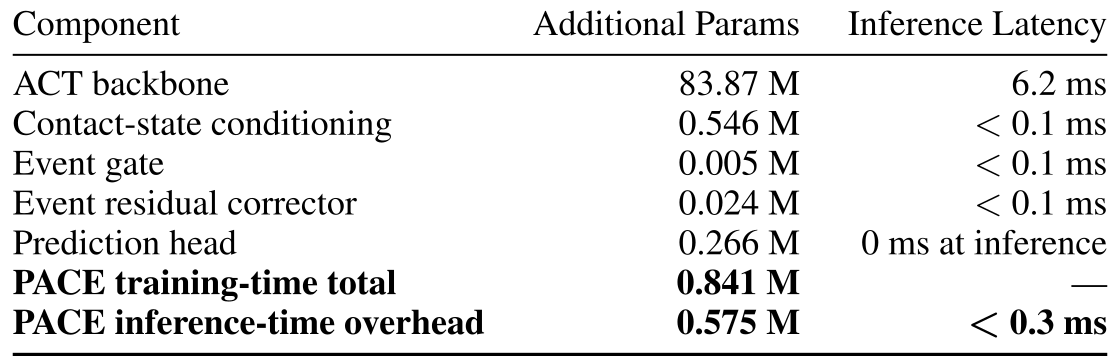
Training sums corrected-chunk L1 imitation loss, CVAE KL weighted by 10 and future-contact MSE weighted by 0.05. The first five action targets supervise Event-corrected predictions; the remainder supervise generated actions directly. The added modules have 0.841 million parameters in training and 0.575 million at inference, against an approximately 83.87 million-parameter ACT backbone.
Equation 7
| (7) |
4 Experiments and Analysis
The evaluation separates task success, structural ablations, pathway diagnostics, alternative physical signals, a diffusion backbone and demonstration quality. All complete result tables remain. The studies use a single physical platform and task-specific training configurations, so they are not evidence of zero-shot transfer across arbitrary connectors or robots.
4.1 Experimental Setup
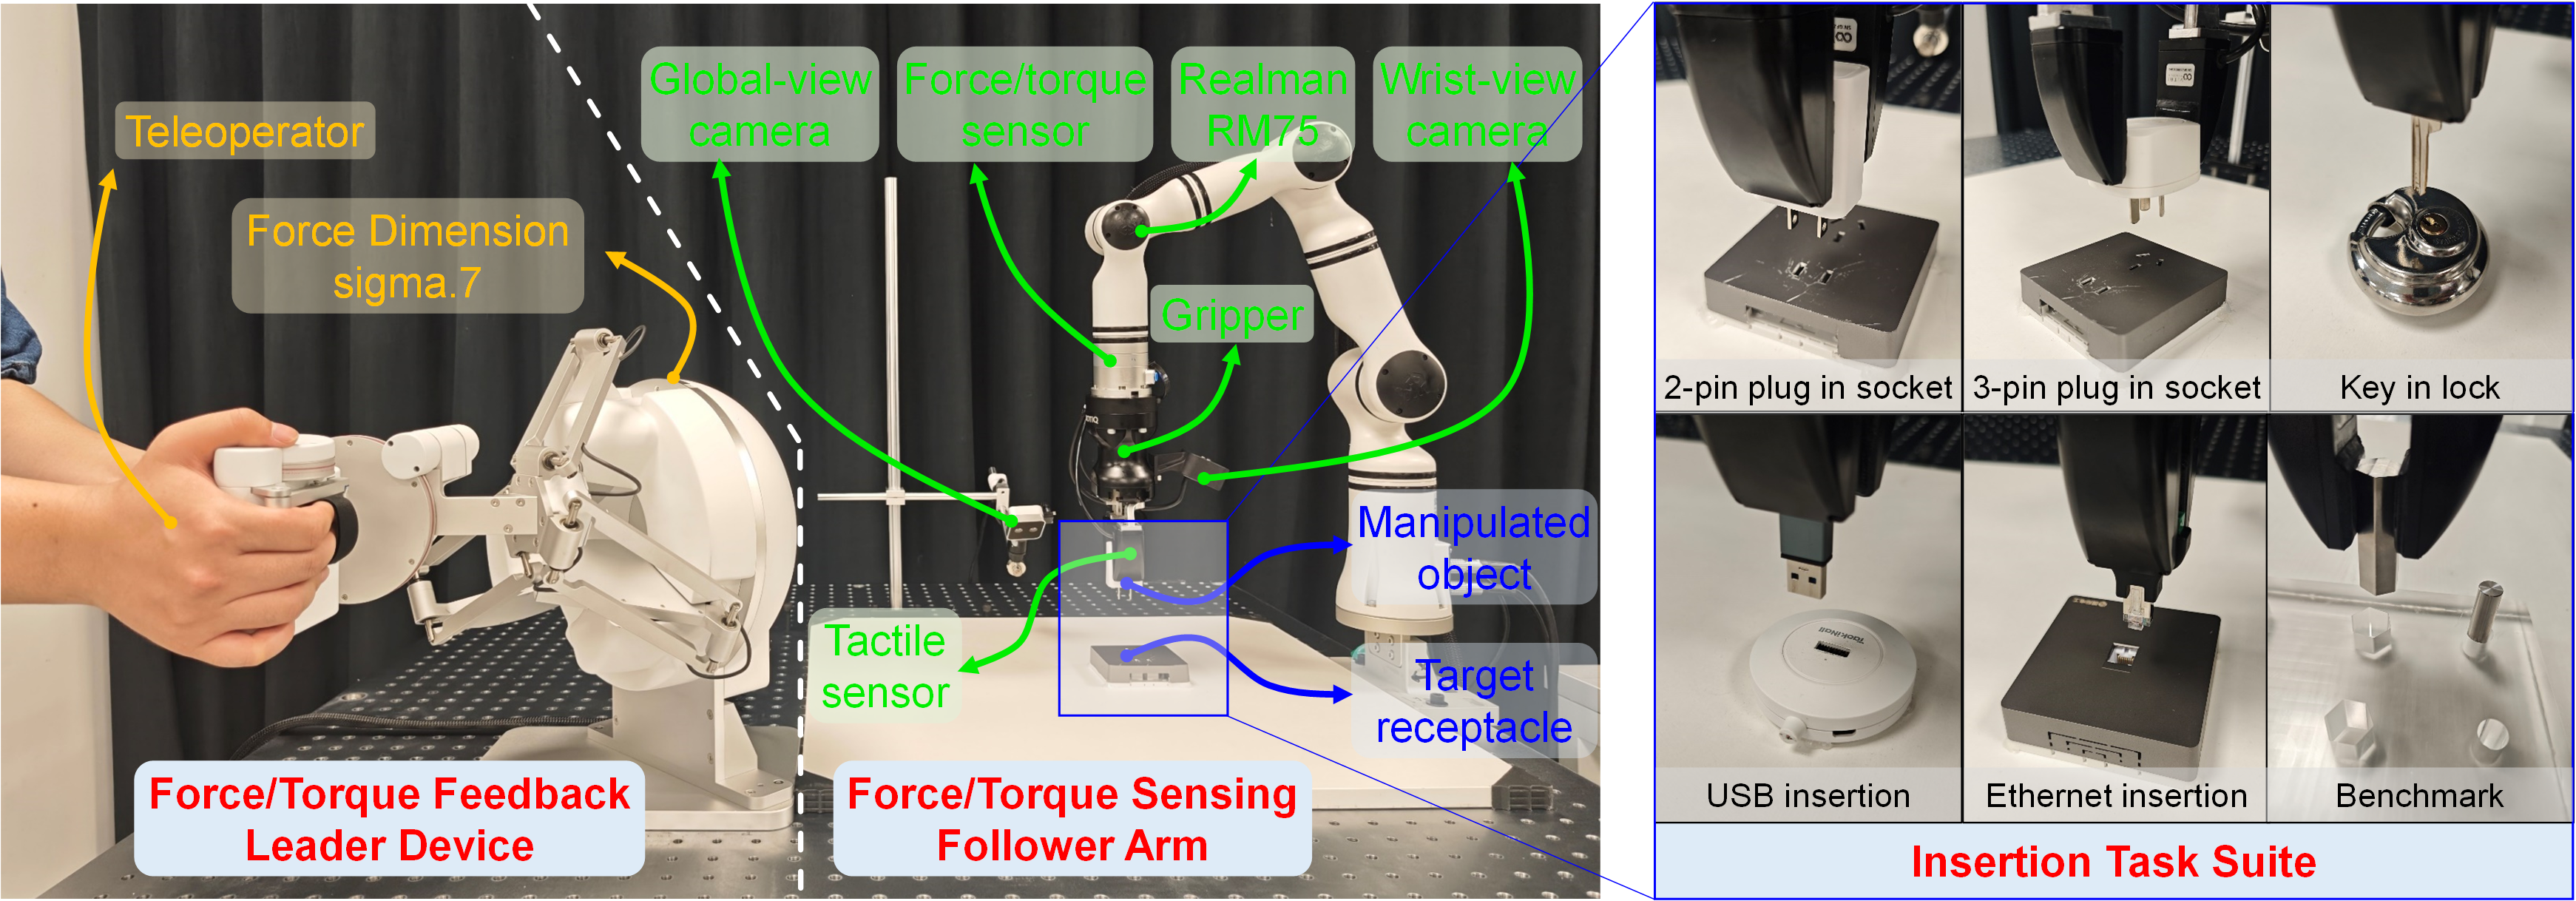
A Realman RM75 arm, Robotiq Hand-E gripper, two D405 cameras and GF225 tactile sensing perform insertion. Force-feedback sigma.7 demonstrations provide about 160 episodes of roughly 300 steps per task. Each real method/task receives 30 trials with target position varied within a demonstrated 25×25 mm workspace. ManipulationNet adds cylindrical/hexagonal pegs at 3/1/0.1 mm clearance, 25 trials for each condition. The complete task definitions and failure criteria remain.
4.2 Baselines
Vision-only ACT, DP and fine-tuned π0, plus ACT tactile concatenation/cross-attention, share demonstrations, observations/action space and evaluation setup where applicable. Thus the main architecture comparison does not also change demonstration collection. A targeted RDP comparison uses the same data on Key and Two-pin. These controls do not imply matched parameter count, pretraining or every optimization detail across all backbones.
4.3 Main Results
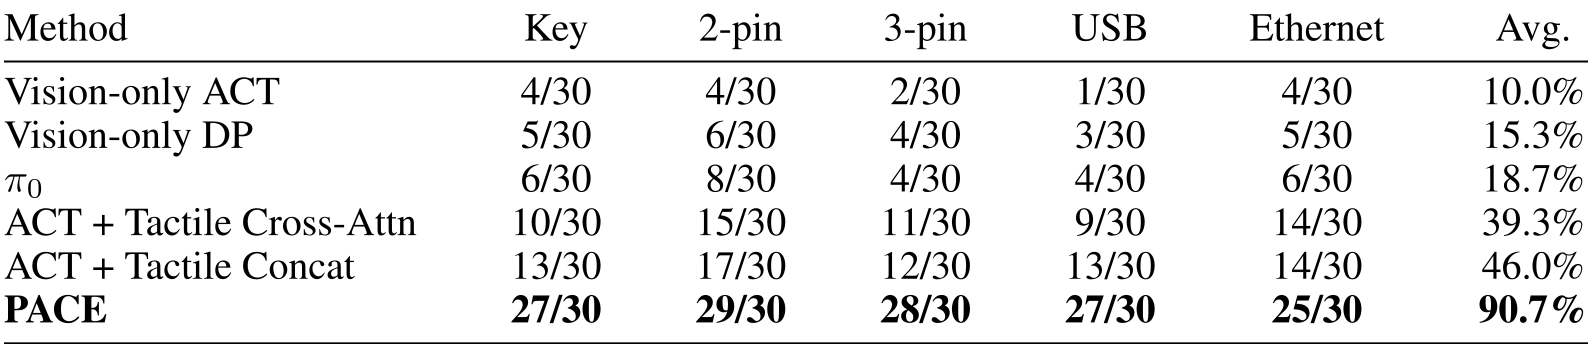
PACE succeeds in 27/29/28/27/25 of 30 Key/Two-pin/Three-pin/USB/Ethernet trials. Its 90.7% mean is 44.7 percentage points above tactile concatenation’s 46.0%. ManipulationNet averages 88.7%, with 84% cylindrical and 76% hexagonal success at 0.1 mm. The tighter-clearance claim should be read at those task-specific rates, rather than applying the overall mean to every condition. Wilson intervals preserve the uncertainty from the small per-task trial counts.
Accessible table and original citation links
| Method | Key | 2-pin | 3-pin | USB | Ethernet | Avg. |
| Vision-only ACT | 4/30 | 4/30 | 2/30 | 1/30 | 4/30 | 10.0% |
| Vision-only DP | 5/30 | 6/30 | 4/30 | 3/30 | 5/30 | 15.3% |
| 6/30 | 8/30 | 4/30 | 4/30 | 6/30 | 18.7% | |
| ACT + Tactile Cross-Attn | 10/30 | 15/30 | 11/30 | 9/30 | 14/30 | 39.3% |
| ACT + Tactile Concat | 13/30 | 17/30 | 12/30 | 13/30 | 14/30 | 46.0% |
| PACE | 27/30 | 29/30 | 28/30 | 27/30 | 25/30 | 90.7% |
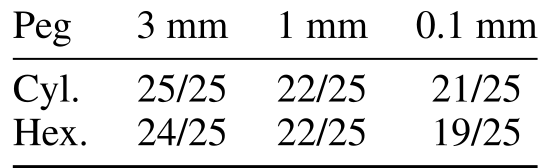
Accessible table and original citation links
| Peg | 3 mm | 1 mm | 0.1 mm |
| Cyl. | 25/25 | 22/25 | 21/25 |
| Hex. | 24/25 | 22/25 | 19/25 |
4.4 Structural and Design Ablations
Removing Event lowers mean success to 66.7%, Phase to 78.7% and Pred. to 85.3%; Phase-only reaches 60.0%. This supports complementary contributions within the tested training/execution recipe. Reducing Phase-only’s horizon from twenty to ten actions gives 49.3%. Appendix A.6 already queries at every 20 Hz control step, so that ablation changes horizon/ensemble content without a clearly documented separate change in query frequency. It does not by itself isolate frequency as the cause.
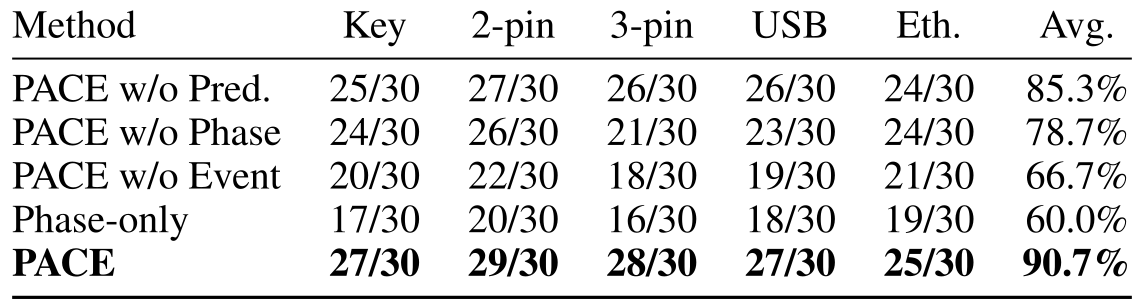
Accessible table and original citation links
| Method | Key | 2-pin | 3-pin | USB | Eth. | Avg. |
| PACE w/o Pred. | 25/30 | 27/30 | 26/30 | 26/30 | 24/30 | 85.3% |
| PACE w/o Phase | 24/30 | 26/30 | 21/30 | 23/30 | 24/30 | 78.7% |
| PACE w/o Event | 20/30 | 22/30 | 18/30 | 19/30 | 21/30 | 66.7% |
| Phase-only | 17/30 | 20/30 | 16/30 | 18/30 | 19/30 | 60.0% |
| PACE | 27/30 | 29/30 | 28/30 | 27/30 | 25/30 | 90.7% |
4.5 Mechanistic Analysis
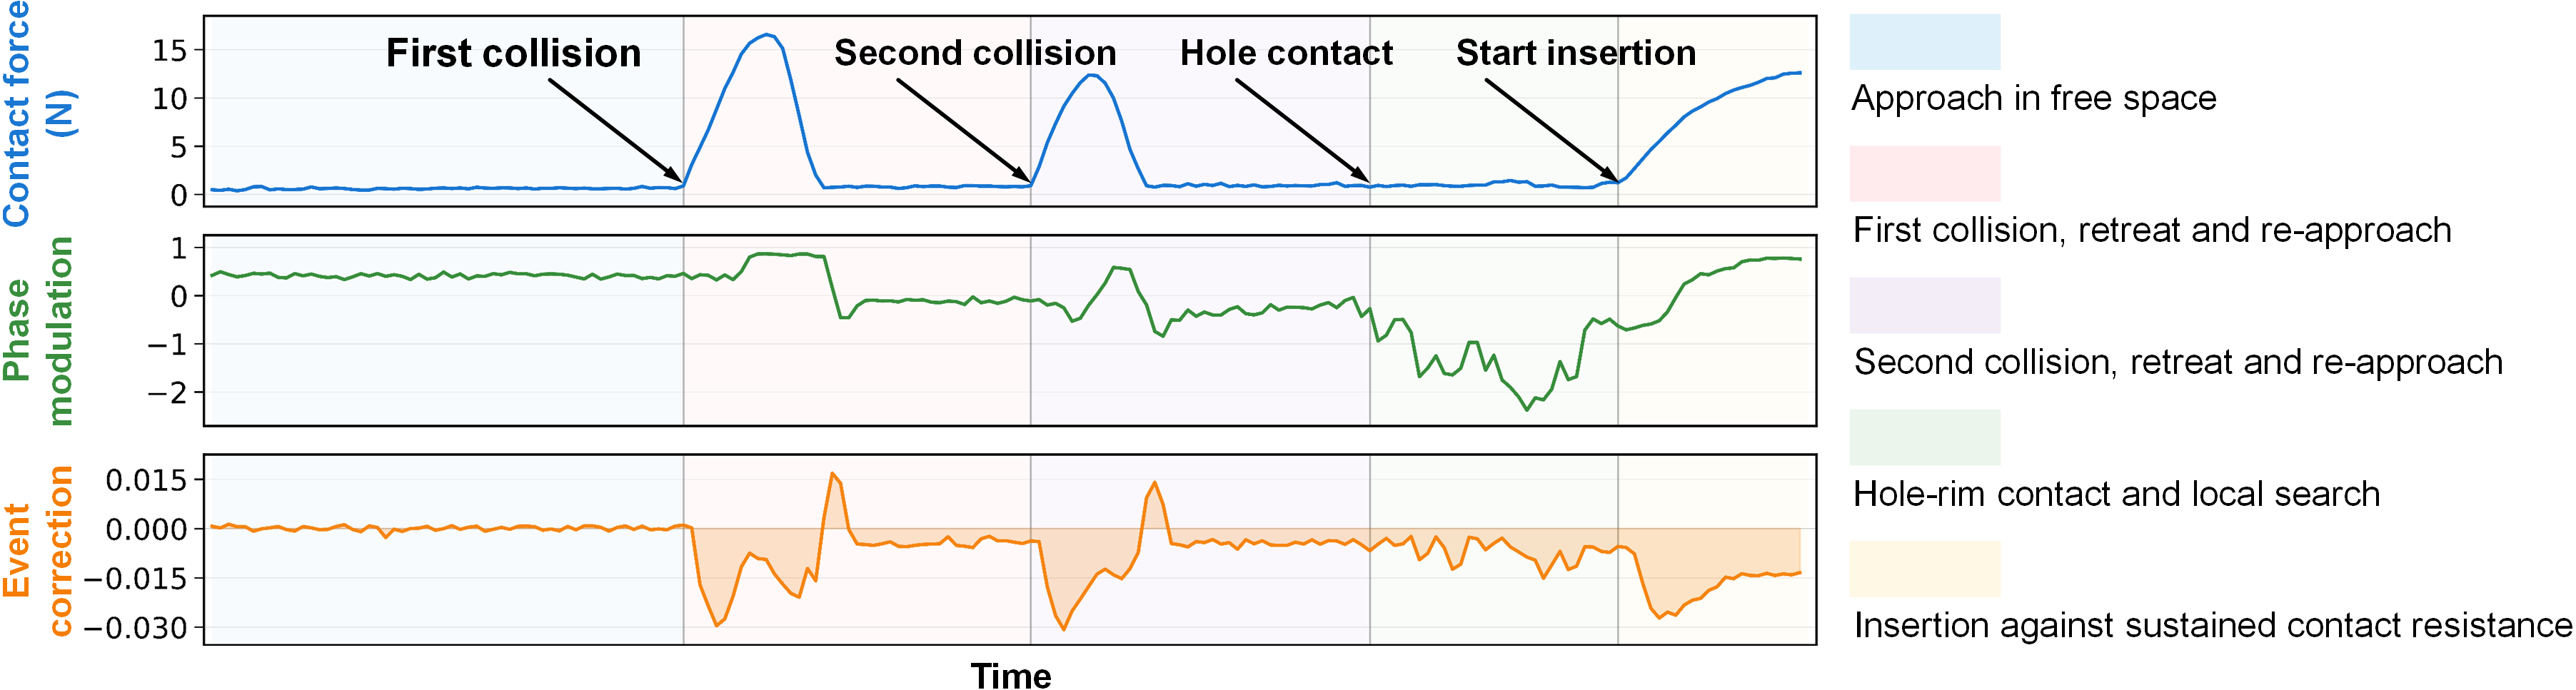
A selected rollout plots force, the second principal component of modulation parameters and a baseline-centered Event correction level. Sustained Phase shifts and transient Event excursions are consistent with intended roles, but PCA axes are not semantic phase labels. The source reports ANOVA F=8.36 and Event/contact-change Pearson r=0.356, p<0.001 using summaries from 30 Two-pin rollouts. The number/independence of paired summaries is not specified: one pair per rollout would instead give a two-sided Pearson p≈0.0535. Treat the reported significance as insufficiently specified rather than as proof of causal phase/event separation.
4.6 Cross-Signal-Source Generality
Separately trained variants replace tactile input with six-axis end-effector wrench or seven joint currents on Two-pin and Key. Means are 93.3% tactile, 90.0% wrench and 88.3% currents. These show that the design can use different available contact-sensitive signals in those tasks. They do not demonstrate one model transferring between signal sources without retraining or normalization changes.
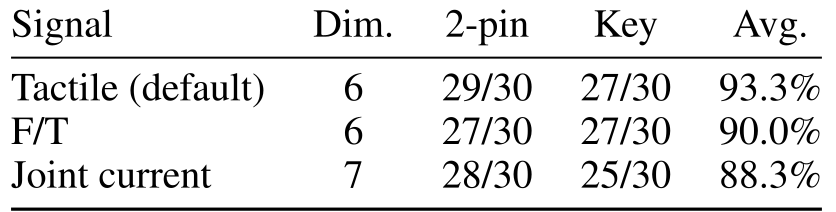
Accessible table and original citation links
| Signal | Dim. | 2-pin | Key | Avg. |
| Tactile (default) | 6 | 29/30 | 27/30 | 93.3% |
| F/T | 6 | 27/30 | 27/30 | 90.0% |
| Joint current | 7 | 28/30 | 25/30 | 88.3% |
4.7 Cross-Architecture Validation
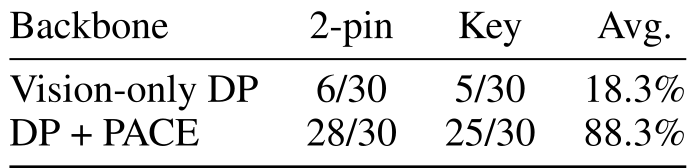
DP+PACE scores 28/30 Two-pin and 25/30 Key, averaging 88.3%, versus 18.3% for vision-only DP on those two tasks. The appendix adapts the branches to a diffusion UNet; its auxiliary predictor receives global conditioning features instead of ACT decoder states. Its described Event training also modifies clean action targets before noising, differing from the ACT corrected-output imitation loss. The result supports an adapted second-backbone implementation rather than an identical architecture-independent training rule.
4.8 Demonstration Quality from Force Feedback
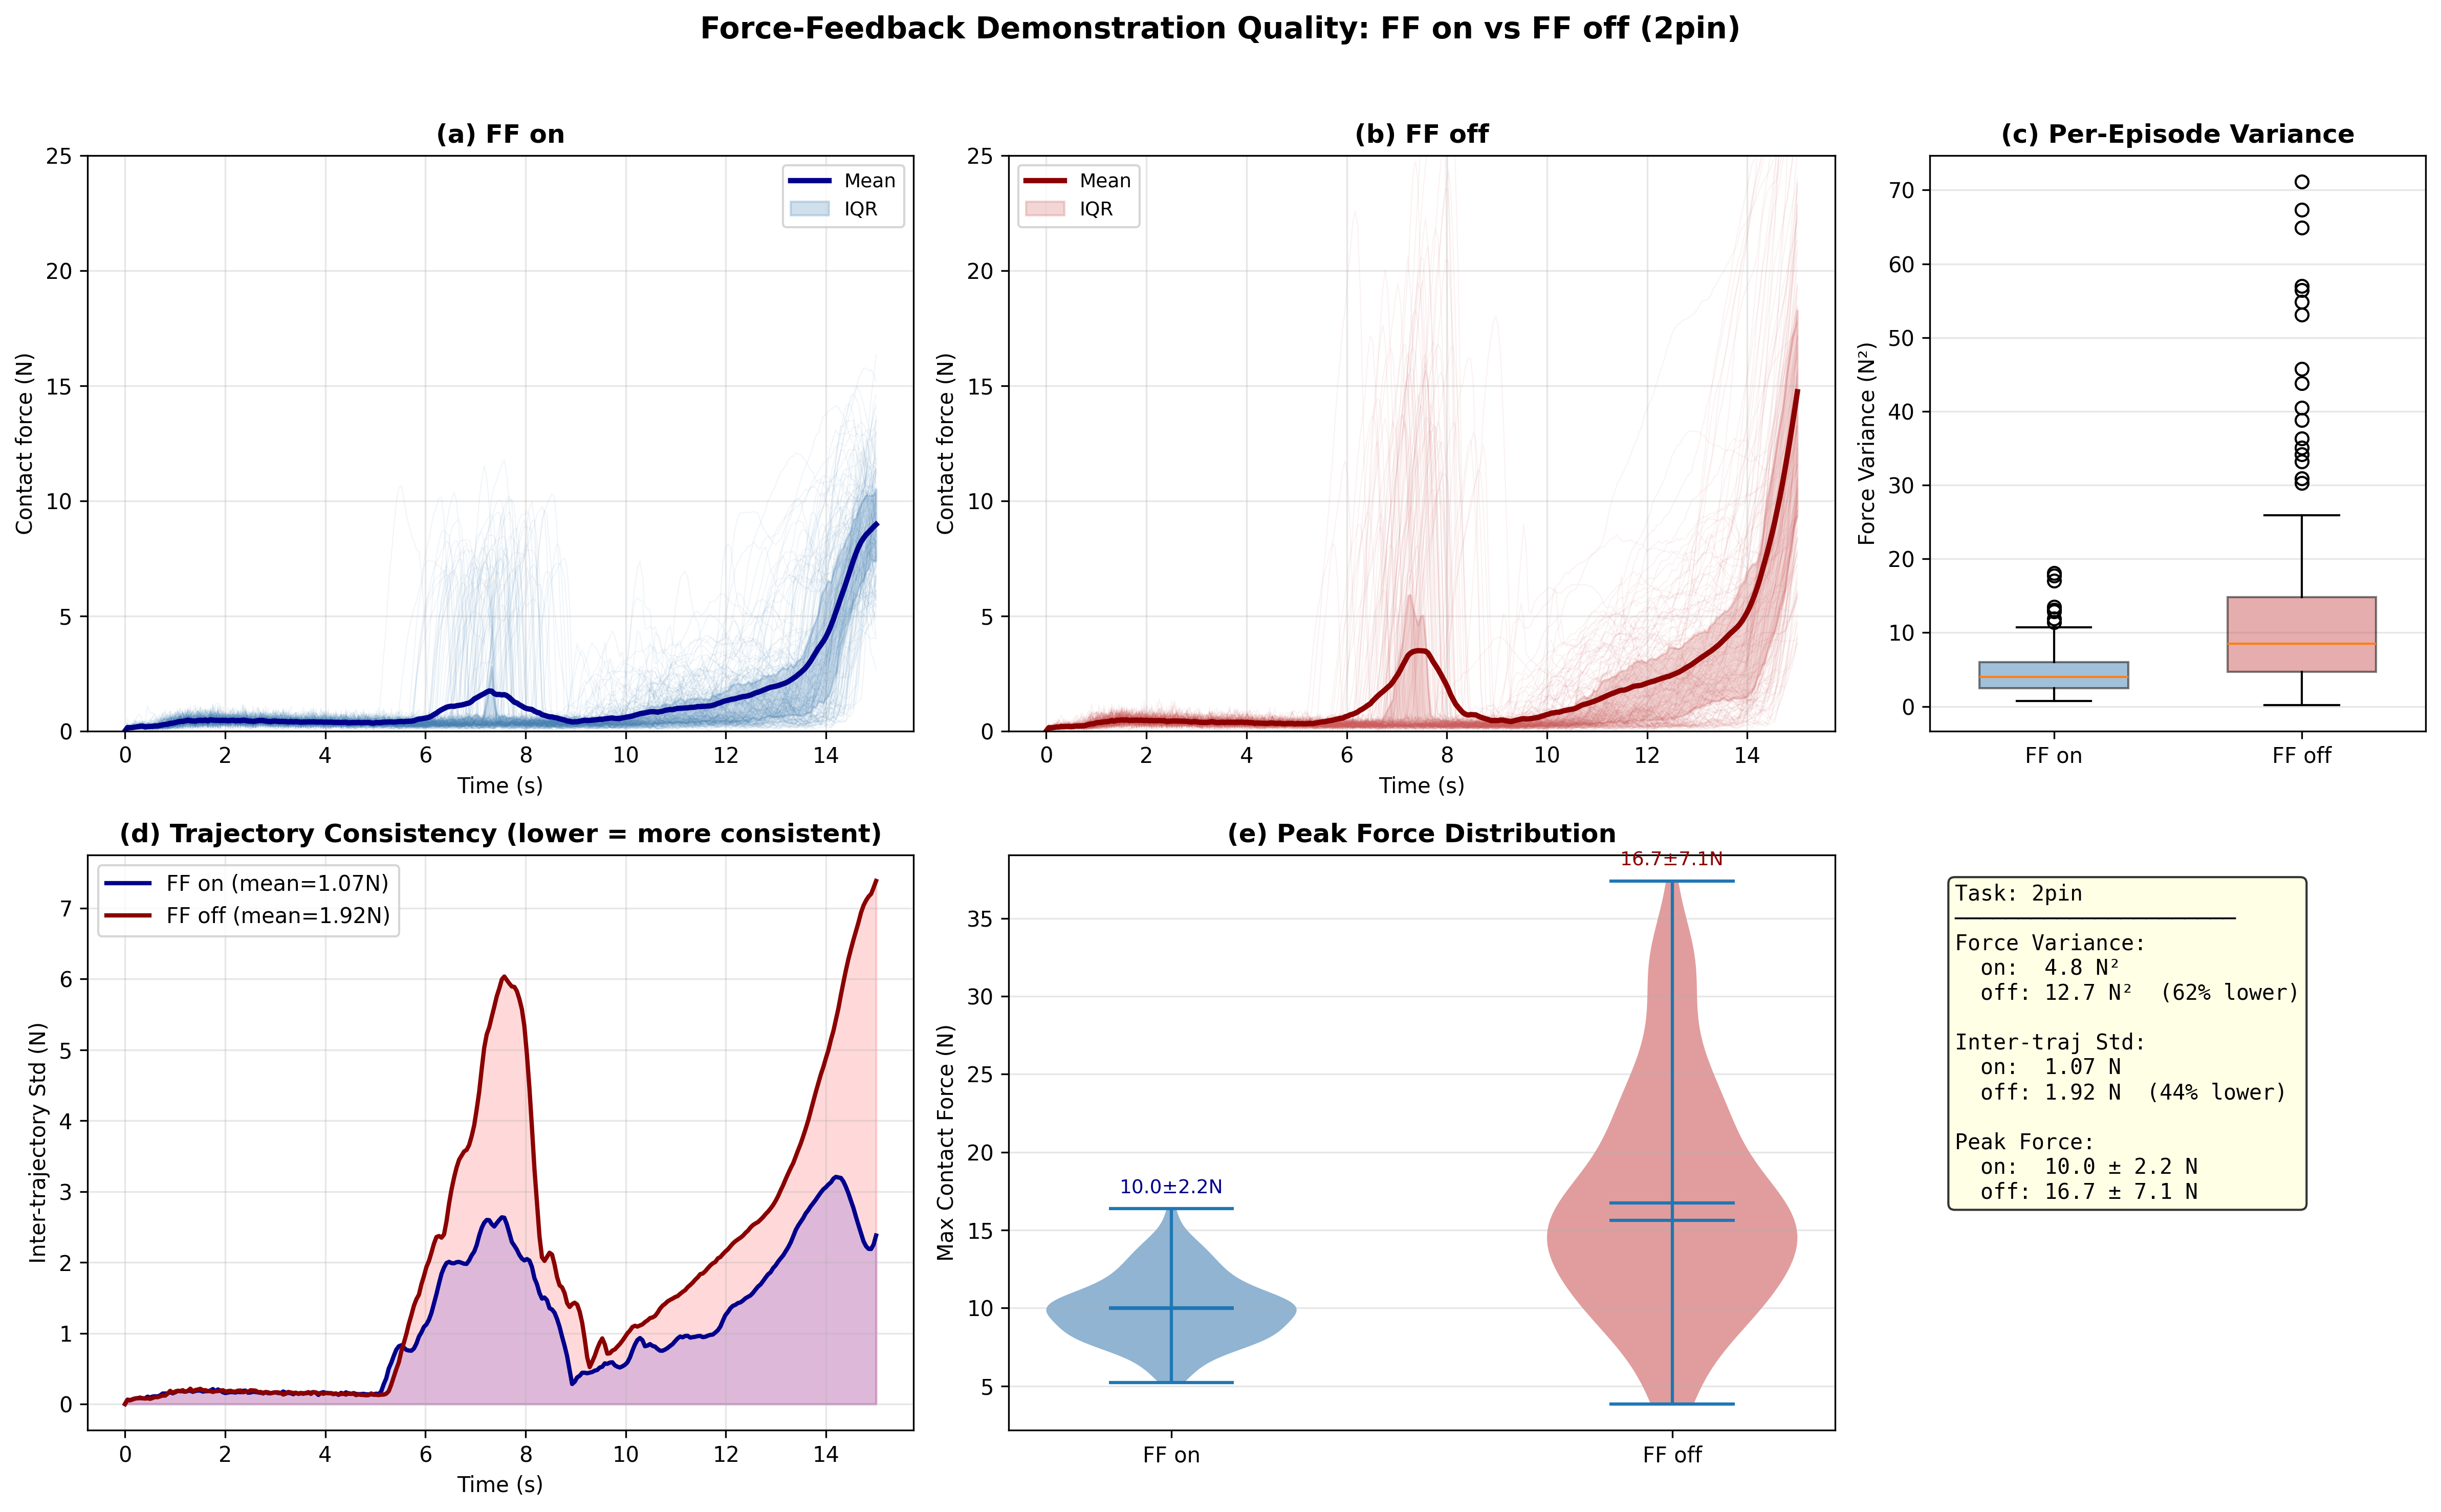
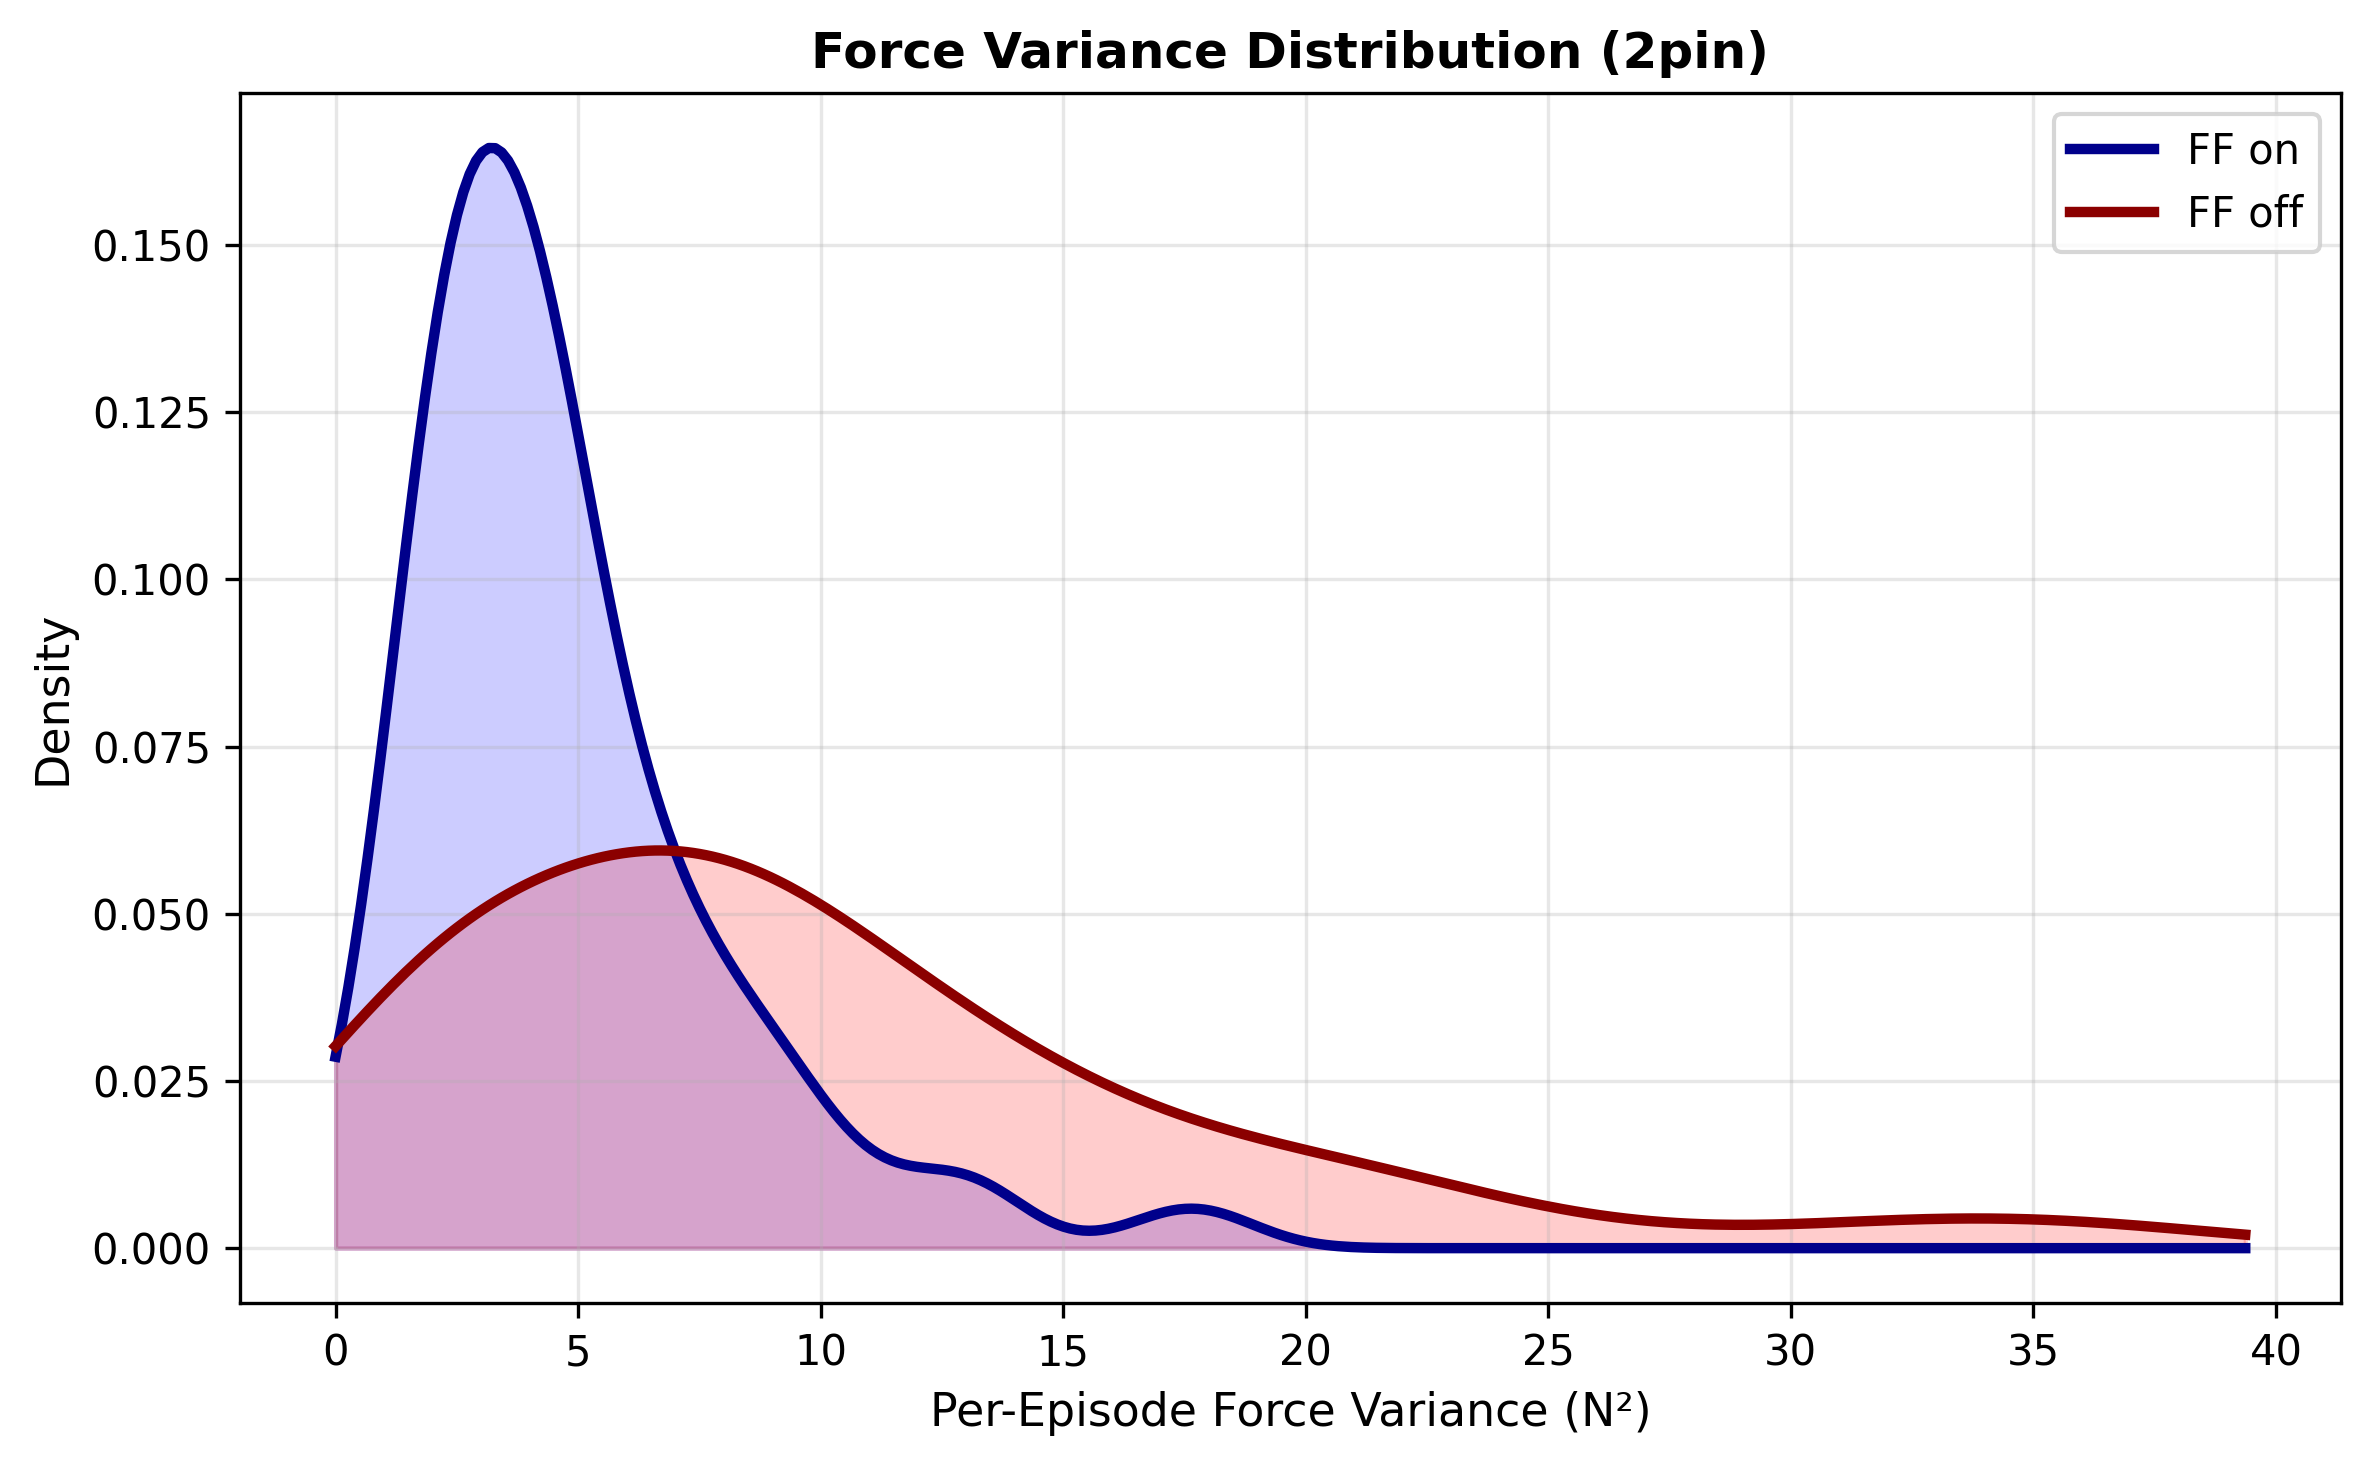
The collection study toggles haptic force rendering with device, operator and setup held fixed. Within each condition both policies share the same Two-pin demonstrations. Feedback-on/off success is 29/21 of 30 for PACE and 17/7 for tactile concatenation. The 162 episodes per condition have lower force variance and peaks with feedback. Other tasks were excluded because successful feedback-off demonstrations were too scarce; the evidence is scoped to the controlled Two-pin/operator setting.
5 Conclusion and Limitations
Separating sustained contact conditioning, local event correction and future-contact supervision improves these insertion policies. Limits include fixed temporal hyperparameters, reliance on informative/calibrated signals and failures when repeated recovery motions tilt an object in a weak grip. Broader manipulation, learned time scales and inference-time consequence scoring remain future work.
Original project demonstrations
The primary project page supplies 27 original videos: four paired collection/data-stream views, five connector demonstrations, six benchmark conditions, nine signal-source trials and three DP trials. These unchanged clips retain source resolution and playback timing, with preview frames generated locally. Collection pairs show the same episodes at the stated 1× speed. They complement the trial tables; code, models and datasets are described as a planned release.
Appendix A Network Architecture
The architecture appendix preserves branch dimensions, parameter counts and the full six-step control procedure. ACT and diffusion adaptations share the temporal-role idea but differ in where representations and losses are attached.
A.1 ACT Backbone
ACT has four encoder and seven decoder layers, width 512, eight attention heads, feed-forward width 3,200 and a 32-dimensional CVAE latent. It predicts twenty seven-joint actions. The source describes sampling z from its prior at inference; the concrete public code/model release is not available through the project at review time to independently verify that detail.
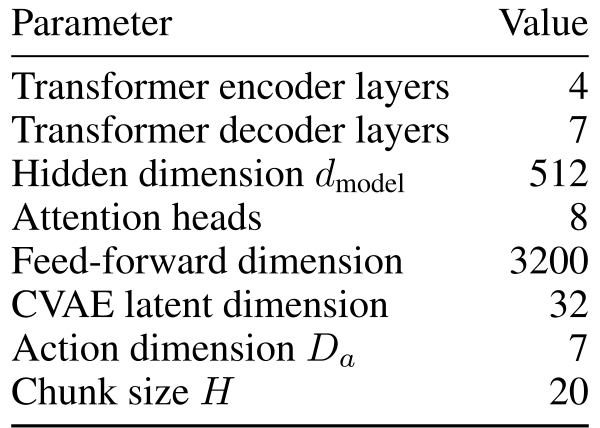
Accessible table and original citation links
| Parameter | Value |
| Transformer encoder layers | 4 |
| Transformer decoder layers | 7 |
| Hidden dimension | 512 |
| Attention heads | 8 |
| Feed-forward dimension | 3200 |
| CVAE latent dimension | 32 |
| Action dimension | 7 |
| Chunk size | 20 |
Equation 8
| (8) |
A.2 Contact-State Conditioning
A two-layer 128-unit ReLU MLP maps the smoothed contact signal to a 128-dimensional conditioning vector. Each encoder layer independently projects it to 1,024 values, split into 512 scales and shifts. Layer-specific modulation permits distinct feature responses without explicit stage supervision.
A.3 Contact-Event Correction of the Generated Chunk
The gate uses two 64-unit hidden layers and sigmoid output over seven action dimensions. The residual MLP uses two 128-unit layers and predicts a five-by-seven correction. Both are evaluated from the current history alongside each full policy query. The source mentions similar preliminary performance for correction horizons three through seven but provides no systematic table for that sweep.

Accessible table and original citation links
| Component | Input | Hidden layers | Output | Final activation |
| 64, 64 | sigmoid | |||
| 128, 128 | - |
A.4 Contact-Consequence Prediction
A 512-unit ReLU prediction head maps each ACT decoder representation to future tactile increments. It trains the representation and is discarded at inference. The diffusion adaptation later uses a different conditioning input for its auxiliary branch.

Accessible table and original citation links
| Component | Input | Hidden layers | Output |
| 512 (ReLU) |
A.5 Parameter Count
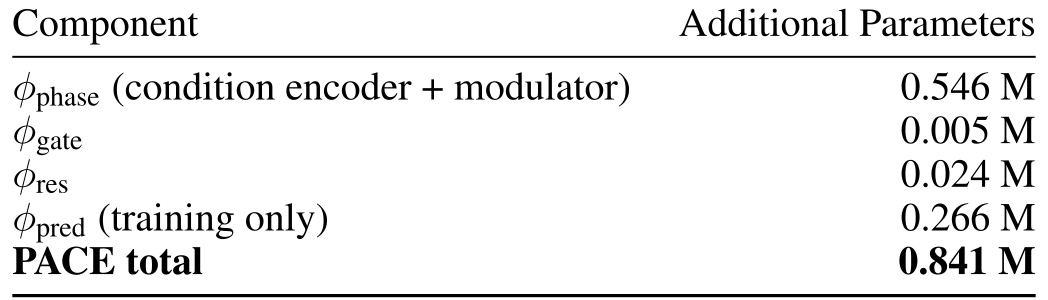
Additional parameters split into 0.546 million Phase, 0.005 million gate, 0.024 million residual and 0.266 million training-only prediction. Their sum is 0.841 million, about 1% of the ACT backbone. Inference keeps 0.575 million rather than the whole training increment.
A.6 Inference Procedure
The original six-step procedure remains verbatim. At every control step the system reads observations, updates the EMA, runs the full vision/Phase/decode/Event pass, stores the corrected chunk, averages overlapping predictions and dispatches one action. This resolves the meaning of fresh tactile correction in the evaluated ACT deployment: complete chunks are regenerated at 20 Hz, then blended across query times.
1. Read the current observation (RGB, proprioception, tactile).
2. Update the contact state: .
3. Run the full PACE forward pass: encode visual and proprioceptive features, apply Phase modulation with , decode an action chunk , and apply Event correction to the front steps using the latest tactile history .
4. Store the corrected chunk in the temporal-ensemble buffer.
5. Aggregate overlapping chunk predictions at time using exponential-decay weights to obtain the final action .
6. Dispatch to the robot.
Appendix B Force-Feedback Data-Collection System
The collection system maps human device offsets and robot wrench into a common contact-point coordinate convention. Its anchoring, moment-arm correction, scaling and recording gates are explicit. These collection mechanics are separate from the learned action policy evaluated at deployment.
B.1 System Overview
The sigma.7 background process handles high-rate device pose and force output. A separate 20 Hz process controls the follower, reads sensors and writes HDF5. Robot and device coordinate mappings aim to make the rendered resistance correspond to the point being manipulated, rather than the force sensor origin alone.
B.2 Contact-Point Anchoring
Enabling teleoperation records synchronized robot/device anchor poses. Device motion is measured relative to that anchor. Pausing and reenabling rebuilds the anchor at the current robot pose, reducing startup jumps rather than repeatedly returning the robot to its original trajectory start.
Equation 9
| (9) |
B.3 Action Mapping
Position offsets rotate from contact frame to end-effector frame; rotation increments are conjugated by the same frame transform. They update the anchored target pose. The complete original equations retain frame superscripts and multiplication order, which matter for interpreting this mapping.
Equations 10–12
| (10) |
| (11) |
| (12) |
B.4 Wrench Transformation for Force Feedback
The wrench path low-pass filters and subtracts bias, rotates force, and subtracts the moment-arm cross product before rotating torque. Force and torque have separate contact-frame gains before device output. The full block-matrix transform remains. This is data-collection feedback, not the policy’s learned Event gate or an online calibrated contact-force estimator for all object poses.
Equations 13–17
| (13) |
| (14) |
| (15) |

Original selectable mathematics
| (16) |
| (17) |
B.5 Collection Gating and Data Format
The complete HDF5 schema is preserved verbatim, including both cameras, joint/end-effector states, tactile force/images/depth/markers, wrist wrench, currents and action representations. Only enabled samples after a warm-up discard count as valid data. The schema logs richer channels than the default six-dimensional contact input used in policy training.
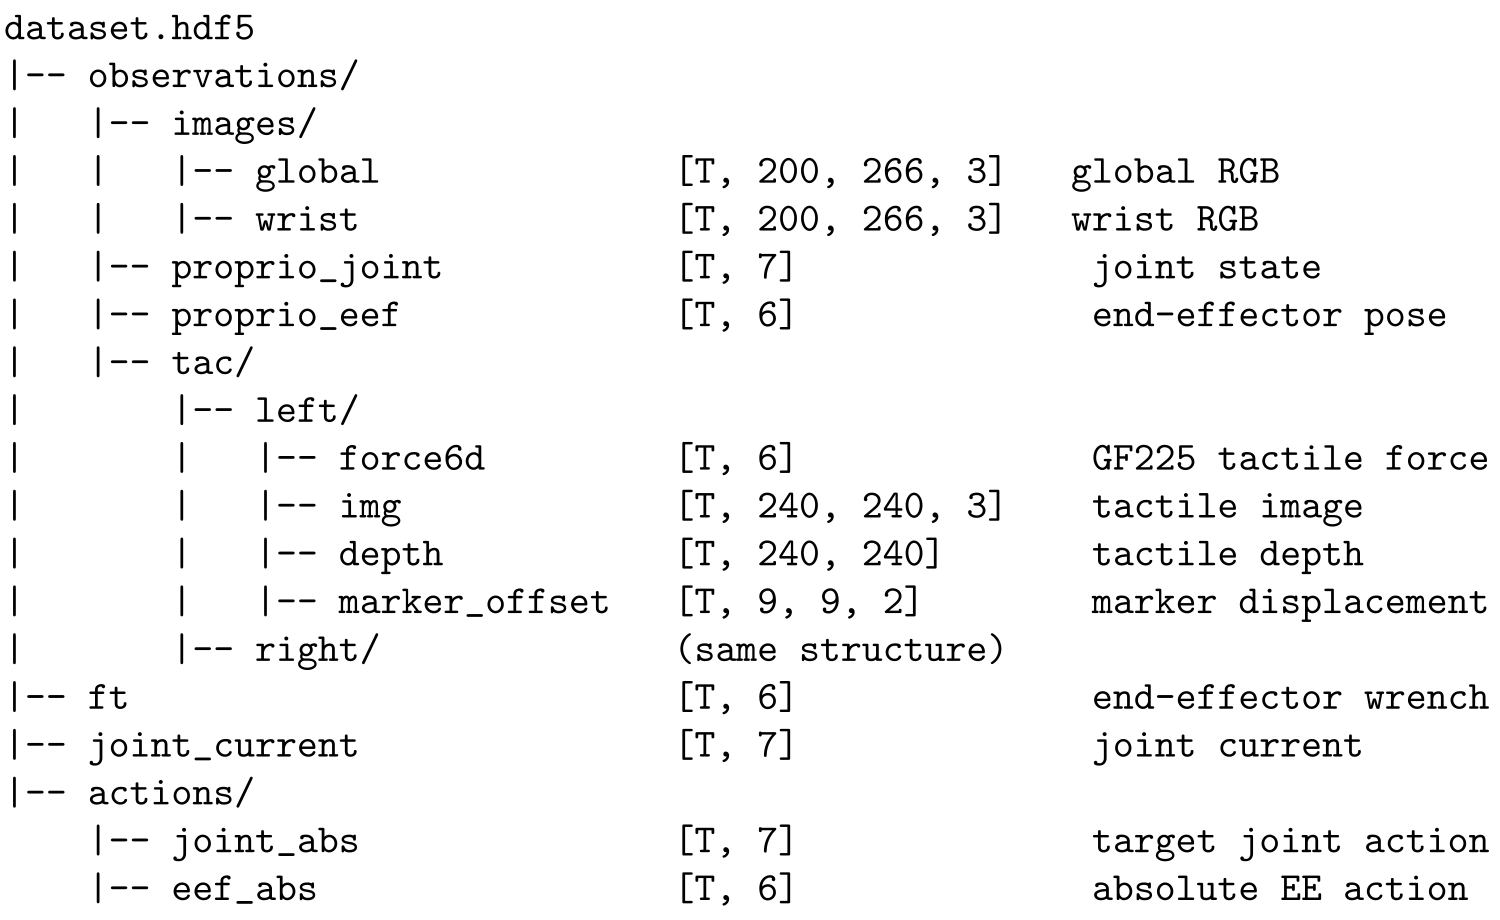
Exact selectable data schema
dataset.hdf5
|-- observations/
|   |-- images/
|   |   |-- global              [T, 200, 266, 3]   global RGB
|   |   |-- wrist               [T, 200, 266, 3]   wrist RGB
|   |-- proprio_joint           [T, 7]              joint state
|   |-- proprio_eef             [T, 6]              end-effector pose
|   |-- tac/
|       |-- left/
|       |   |-- force6d         [T, 6]              GF225 tactile force
|       |   |-- img             [T, 240, 240, 3]    tactile image
|       |   |-- depth           [T, 240, 240]       tactile depth
|       |   |-- marker_offset   [T, 9, 9, 2]        marker displacement
|       |-- right/              (same structure)
|-- ft                          [T, 6]              end-effector wrench
|-- joint_current               [T, 7]              joint current
|-- actions/
    |-- joint_abs               [T, 7]              target joint action
    |-- eef_abs                 [T, 6]              absolute EE action
Appendix C Training Details
Training and deployment details retain the full hyperparameter/checkpoint tables and baseline recipe. Evaluation uses a moderate randomized workspace, resets/zeros sensors between runs and counts force-stop or unstable insertion as failure.
C.1 Hyperparameters
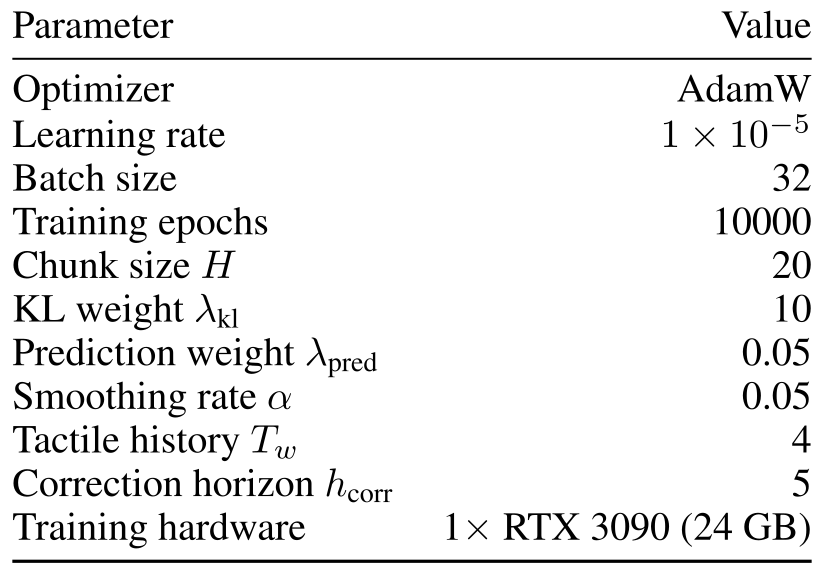
ACT training uses AdamW at 10⁻⁵, batch 32, 10,000 epochs and one RTX 3090. Default horizon/history/correction lengths are twenty/four/five; α=0.05, KL weight ten and auxiliary weight 0.05. Epoch counts are not optimizer-step counts.
C.2 Training Convergence
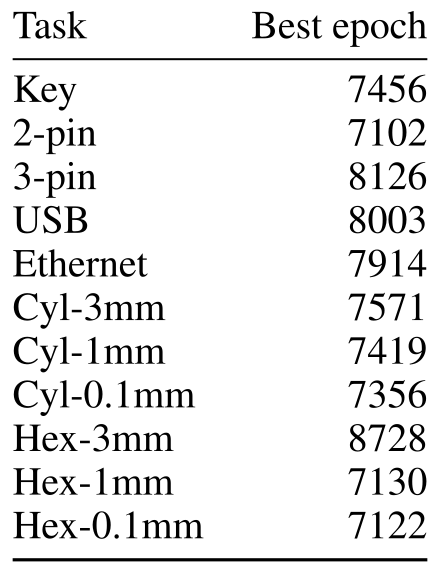
Each configuration trains for all 10,000 epochs and chooses the saved checkpoint with lowest held-out validation action loss. The eleven selected epochs range from 7,102 to 8,728. There is no early stopping, and the table describes task/configuration-specific checkpoints rather than one demonstrated universal model.
Accessible table and original citation links
| Task | Best epoch |
| Key | 7456 |
| 2-pin | 7102 |
| 3-pin | 8126 |
| USB | 8003 |
| Ethernet | 7914 |
| Cyl-3mm | 7571 |
| Cyl-1mm | 7419 |
| Cyl-0.1mm | 7356 |
| Hex-3mm | 8728 |
| Hex-1mm | 7130 |
| Hex-0.1mm | 7122 |
C.3 Loss
The action loss supervises the corrected prefix and uncorrected suffix. Future-contact supervision uses masked MSE so padding near episode ends does not contribute. The CVAE latent term remains the ACT KL regularizer.
C.4 Signal Preprocessing
Images use ImageNet standardization, while ACT proprioception, actions and low-dimensional tactile signals use training-set z-scores. Short initial tactile histories repeat the most recent available frame. This differs from the diffusion appendix’s min-max action normalization and separately described observation scaling.
C.5 Dataset Statistics
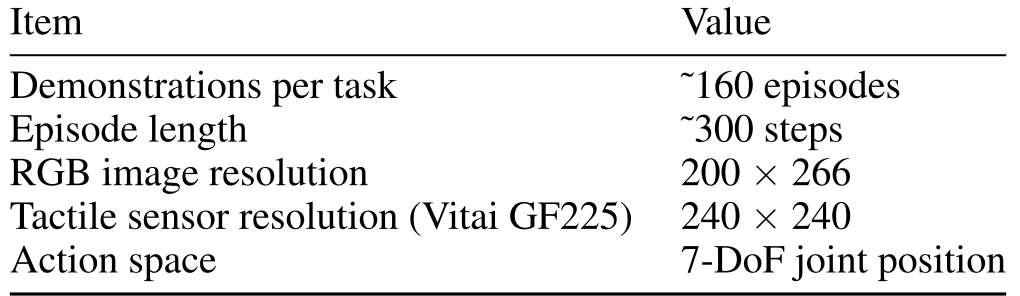
The typical task dataset has about 160 episodes of 300 steps, RGB resolution 200×266 and tactile images 240×240. Model output is seven-dimensional joint position. The raw tactile image resolution should not be mistaken for the dimensionality of the default tactile-force input.
C.6 Evaluation Protocol and Task Definitions
Targets move within 25×25 mm while remaining inside the demonstrated workspace. Before each trial the robot resets and force/tactile sensors are zeroed. Excessive wrist force stops execution and counts as failure; per-step action clamping exists but was disabled for these comparisons. Success requires timely, stable mechanical insertion or functional connection. The original five task definitions are retained in full; the numerical time limit and force threshold are not specified here.
1. Key insertion. The slot is non-axisymmetric and imposes a clear orientation constraint. Small rotational errors cause side interference, rim contact, or jamming. This task stresses the ability to distinguish productive contact from contact that requires retreat or re-alignment.
2. Two-pin plug insertion. The dual-pin geometry creates a parallel constraint. During approach, the wrist camera does not directly observe the pins, so the policy must infer contact state and correct local misalignment after first contact.
3. Three-pin plug insertion. This task adds asymmetric multi-point constraints and tighter pose tolerance. It is difficult for vision-only policies because neither the global nor wrist view reliably exposes the pin-hole relationship near contact.
5. Ethernet insertion. Ethernet contains an elastic latch and requires sustained insertion force. Here a force increase can indicate either normal progress or harmful jamming, making force semantics especially important.
C.7 Baseline Implementation Details
ACT removes tactile branches for the vision baseline. DP models actions by diffusion; π0 is fine-tuned on the same demonstrations. Cross-attention and concatenation add the same tactile signal during generation. Data and trial protocol are shared, while these architectures retain different pretraining and capacity. The appendix does not provide a complete per-baseline optimization/capacity-matched table.
C.8 ManipulationNet Evaluation Details
ManipulationNet crosses two peg shapes with three clearances, with 25 trials per configuration. Main Table 1(b) keeps PACE’s shape-specific counts; Appendix D5 averages each baseline over the two shapes. The standardized geometry study complements connector-specific occlusion, latches and stable-connection requirements.
Appendix D Supplementary Analysis
The supplement separates temporal averaging from event-conditioned action changes, tests shorter horizons, supplies RDP/Wilson/benchmark comparisons, details DP integration and analyzes force-feedback demonstrations. All corresponding tables and both demonstration-quality figures remain.
D.1 Temporal Ensemble and Event Adaptation
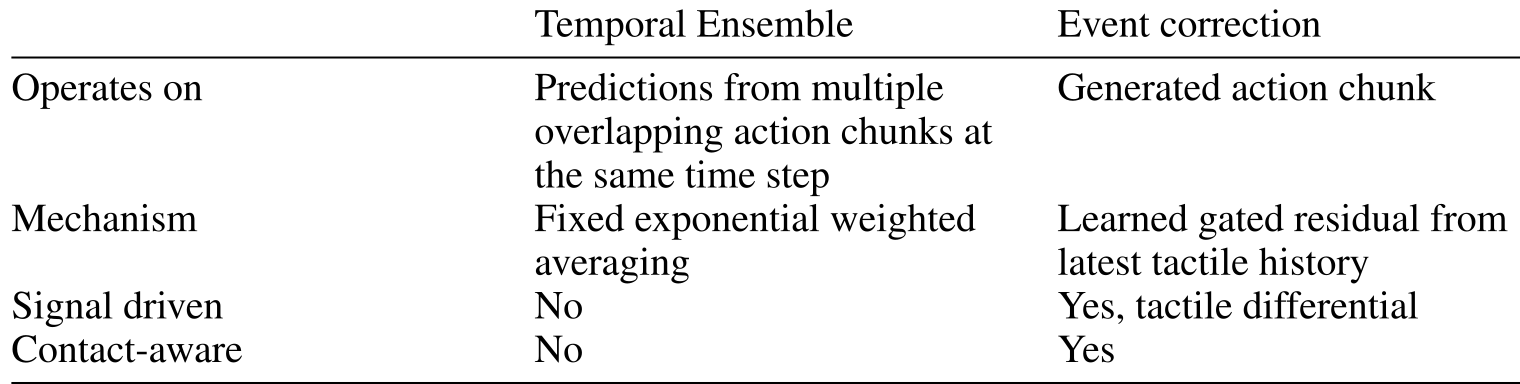
Temporal ensembling averages previous chunks using fixed exponential weights, adding no new sensed information. Event changes each newly generated chunk using the latest contact history before that averaging. Their roles differ, though ensembling can smooth the effect of a new correction. The implementation does not report a matched no-ensemble/event-latency ablation here.
Accessible table and original citation links
| Temporal Ensemble | Event correction | |
| Operates on | Predictions from multiple overlapping action chunks at the same time step | Generated action chunk |
| Mechanism | Fixed exponential weighted averaging | Learned gated residual from latest tactile history |
| Signal driven | No | Yes, tactile differential |
| Contact-aware | No | Yes |
D.2 Action-Chunk Length Analysis
Phase-only success falls from 60.0% at horizon twenty to 49.3% at ten, especially on sustained-force Ethernet insertion. The source interprets this as evidence against frequency alone replacing Event. Since its full inference procedure already queries every control step, the comparison clearly tests chunk horizon but does not document an isolated higher-query-rate intervention.

D.3 Comparison with RDP
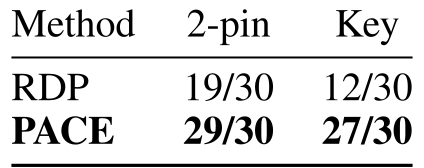
RDP uses its authors’ public implementation and the same demonstrations/trial setup [34]. It scores 19/30 Two-pin and 12/30 Key, versus 29/30 and 27/30 for PACE. The targeted comparison covers those two tasks, not every connector or benchmark condition.
D.4 Statistical Reliability
Wilson 95% intervals accompany the real-task PACE and strongest fusion-baseline counts. For example, 29/30 Two-pin gives [0.83,0.99], while 17/30 gives [0.39,0.73]. These are uncertainty intervals for binomial rollout success; they do not summarize variation across independent model-training seeds or different operators/platforms.
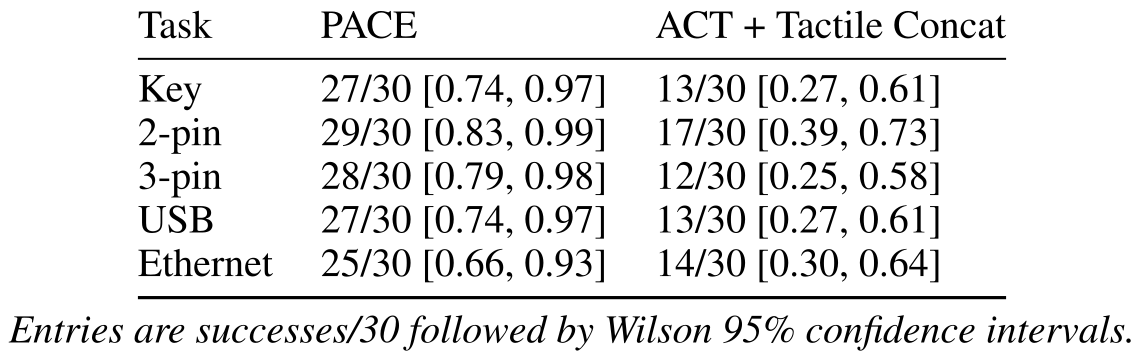
Accessible table and original citation links
| Task | PACE | ACT + Tactile Concat |
| Key | 27/30 [0.74, 0.97] | 13/30 [0.27, 0.61] |
| 2-pin | 29/30 [0.83, 0.99] | 17/30 [0.39, 0.73] |
| 3-pin | 28/30 [0.79, 0.98] | 12/30 [0.25, 0.58] |
| USB | 27/30 [0.74, 0.97] | 13/30 [0.27, 0.61] |
| Ethernet | 25/30 [0.66, 0.93] | 14/30 [0.30, 0.64] |
Entries are successes/30 followed by Wilson 95% confidence intervals.
D.5 ManipulationNet Baseline Performance
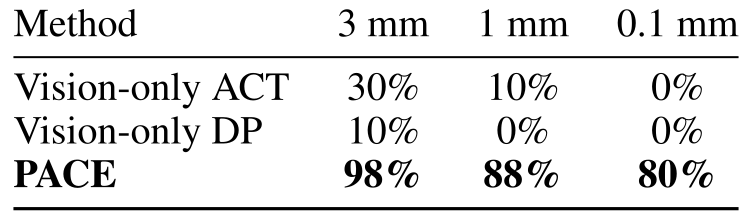
Averaging over peg geometries, PACE scores 98/88/80% at 3/1/0.1 mm clearance. Vision ACT scores 30/10/0% and vision DP 10/0/0%. Baselines are trained/evaluated by these authors under the shared benchmark conditions, rather than copied from unrelated protocols.
D.6 Cross-Architecture Validation: DP+PACE Implementation
DP uses independent ResNet18 camera encoders and a conditional 1D UNet with widths 512/1,024/2,048. It trains a 100-step DDPM and deploys fewer-step DDIM at under 10 ms per query, serving at 20 Hz. The action horizon is twenty, with eight action steps and two visual observation steps; tactile history uses four. Phase enters global FiLM conditioning, Event corrects the sampled prefix, and auxiliary prediction uses global conditioning. The stated training correction is applied to clean action targets before adding noise, unlike ACT’s corrected-output L1 objective. Seven-joint degree actions use min-max scaling to [−1,1] for clipped diffusion; the source separately describes image scaling both via ImageNet preprocessing and [−1,1] conversion without fully resolving their composition. The 310.5 million-parameter model trains for 8,000 epochs with a separate recipe and 3.6 million added parameters. Cross-backbone success therefore tests a concrete adaptation, not equal architecture/optimization cost.
Equations 18–19
| (18) |
| (19) |
D.7 Supplementary Note on Temporal Window Setting
Default α/history settings are fixed rather than learned. Preliminary runs with different Phase/Event windows and α=0.2 are described as stable, but no systematic window-combination success table is supplied. Robustness across arbitrary temporal scales is left unestablished.
D.8 Force-Feedback Demonstration Quality Analysis
The feedback study uses 162 Two-pin demonstrations per condition from the same operator/setup, with no timing instruction. Feedback-on/off force variance is 4.8/12.7 N², inter-trajectory deviation 1.07/1.92 N and peak force 10.0±2.2/16.7±7.1 N. Full distributions, correlation and duration variation remain in Table D7 and Figures D1/D2. Reported Mann–Whitney statistics concern these demonstrations; they do not establish broad multi-operator gains. Only Two-pin supports the controlled policy-training comparison because other feedback-off tasks had below 30% collection success.


Appendix E Failure Cases
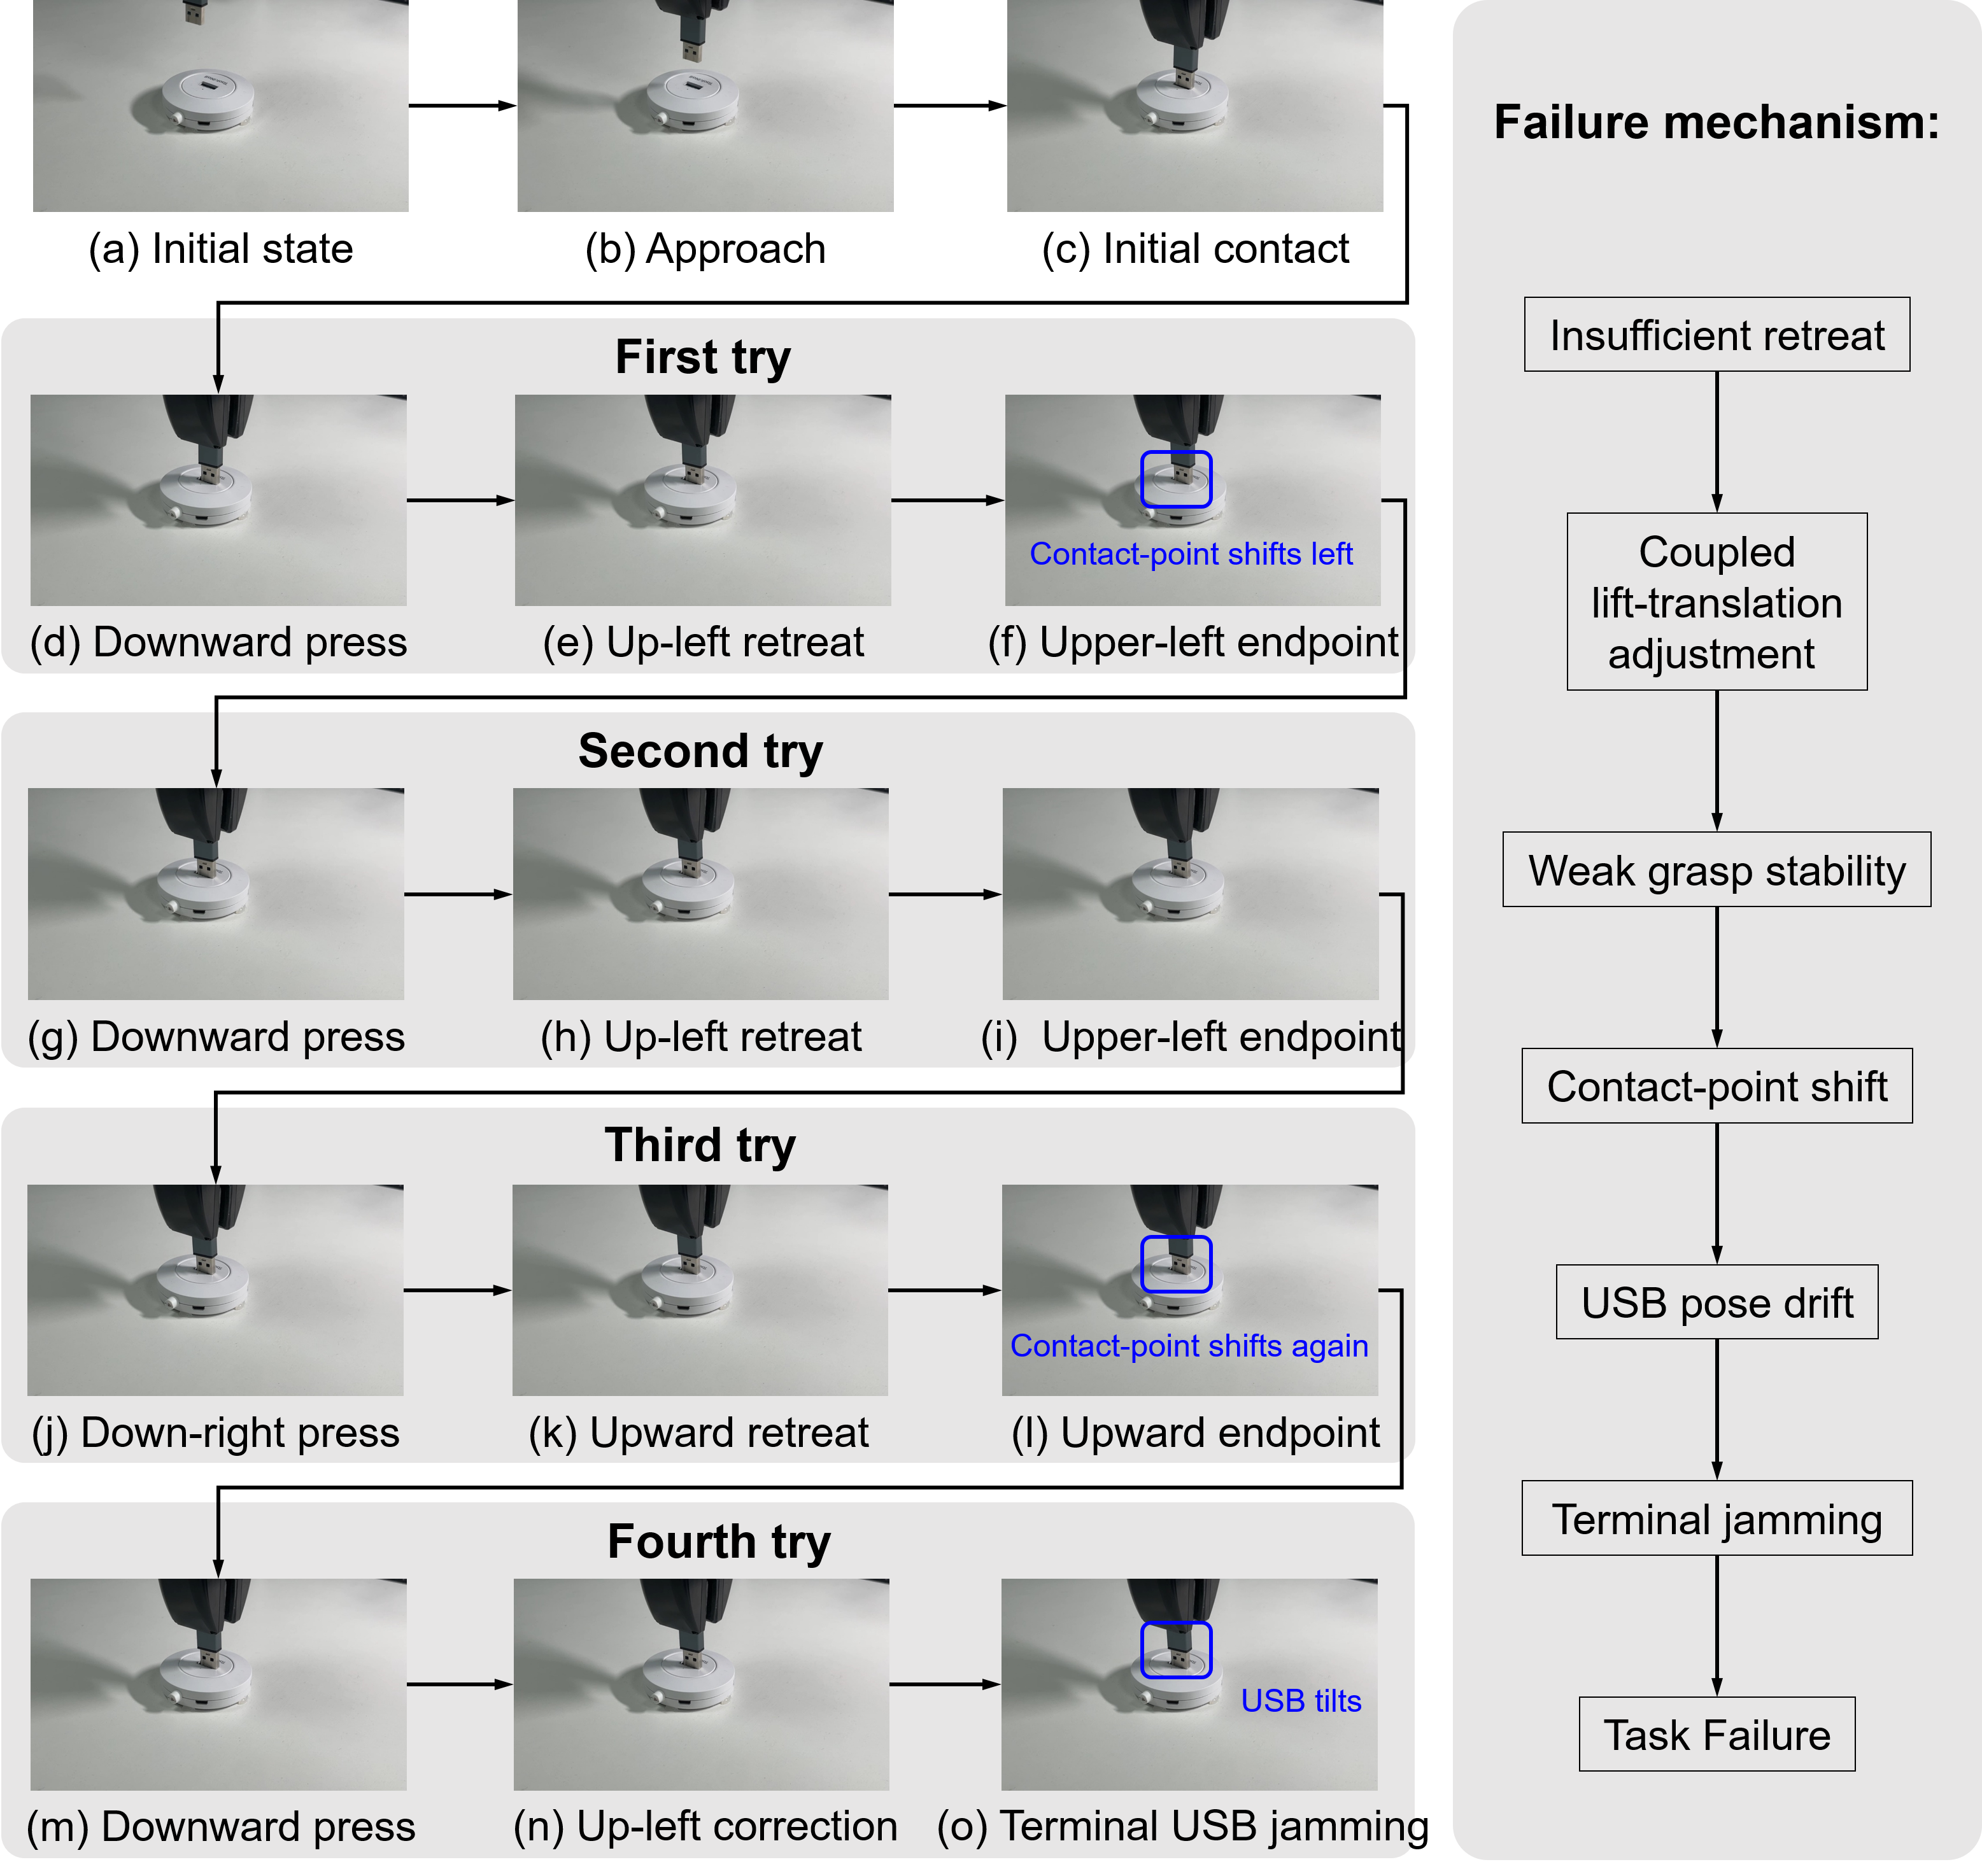
Repeated coupled lifting/lateral corrections can keep a connector tip against the socket as a pivot. A weak silicone grip lets the object slip/rotate, so each correction accumulates tilt until jamming despite motion toward the target. The complete fifteen-frame USB failure sequence and mechanism diagram remain. More recovery demonstrations are proposed as mitigation, rather than a reported solved failure mode.
Appendix F Computational Overhead
The table reports an ACT backbone around 6.2 ms and less than 0.3 ms PACE-specific inference overhead; the prose rounds total ACT+PACE to about 6.2 ms. The auxiliary head incurs no inference cost. These single-platform latency estimates are separate from 20 Hz control scheduling and do not establish a high-rate asynchronous tactile-only execution channel.
Accessible table and original citation links
| Component | Additional Params | Inference Latency |
| ACT backbone | 83.87 M | 6.2 ms |
| Contact-state conditioning | 0.546 M | < 0.1 ms |
| Event gate | 0.005 M | < 0.1 ms |
| Event residual corrector | 0.024 M | < 0.1 ms |
| Prediction head | 0.266 M | 0 ms at inference |
| PACE training-time total | 0.841 M | — |
| PACE inference-time overhead | 0.575 M | < 0.3 ms |
Appendix G Force Calibration
Analysis subtracts the first static frame’s force vector from every later reading. This measures change relative to an initial loaded pose. It is not full orientation-dependent gravity compensation, so changes in object/gripper loading can remain when the pose changes. Interpret force curves as the source’s calibrated-relative measurements rather than universally isolated contact forces.
Equation 20
| (20) |
Appendix H Extended Limitations and Future Work
Future work includes broader contact tasks, learned history/correction time scales, candidate selection using predicted contact consequences and sensor-quality-aware gating. Inference-time planning with Pred. is explicitly proposed rather than evaluated. Weak contact, drift, calibration errors and new contact-phase structures remain limitations.