At a glance
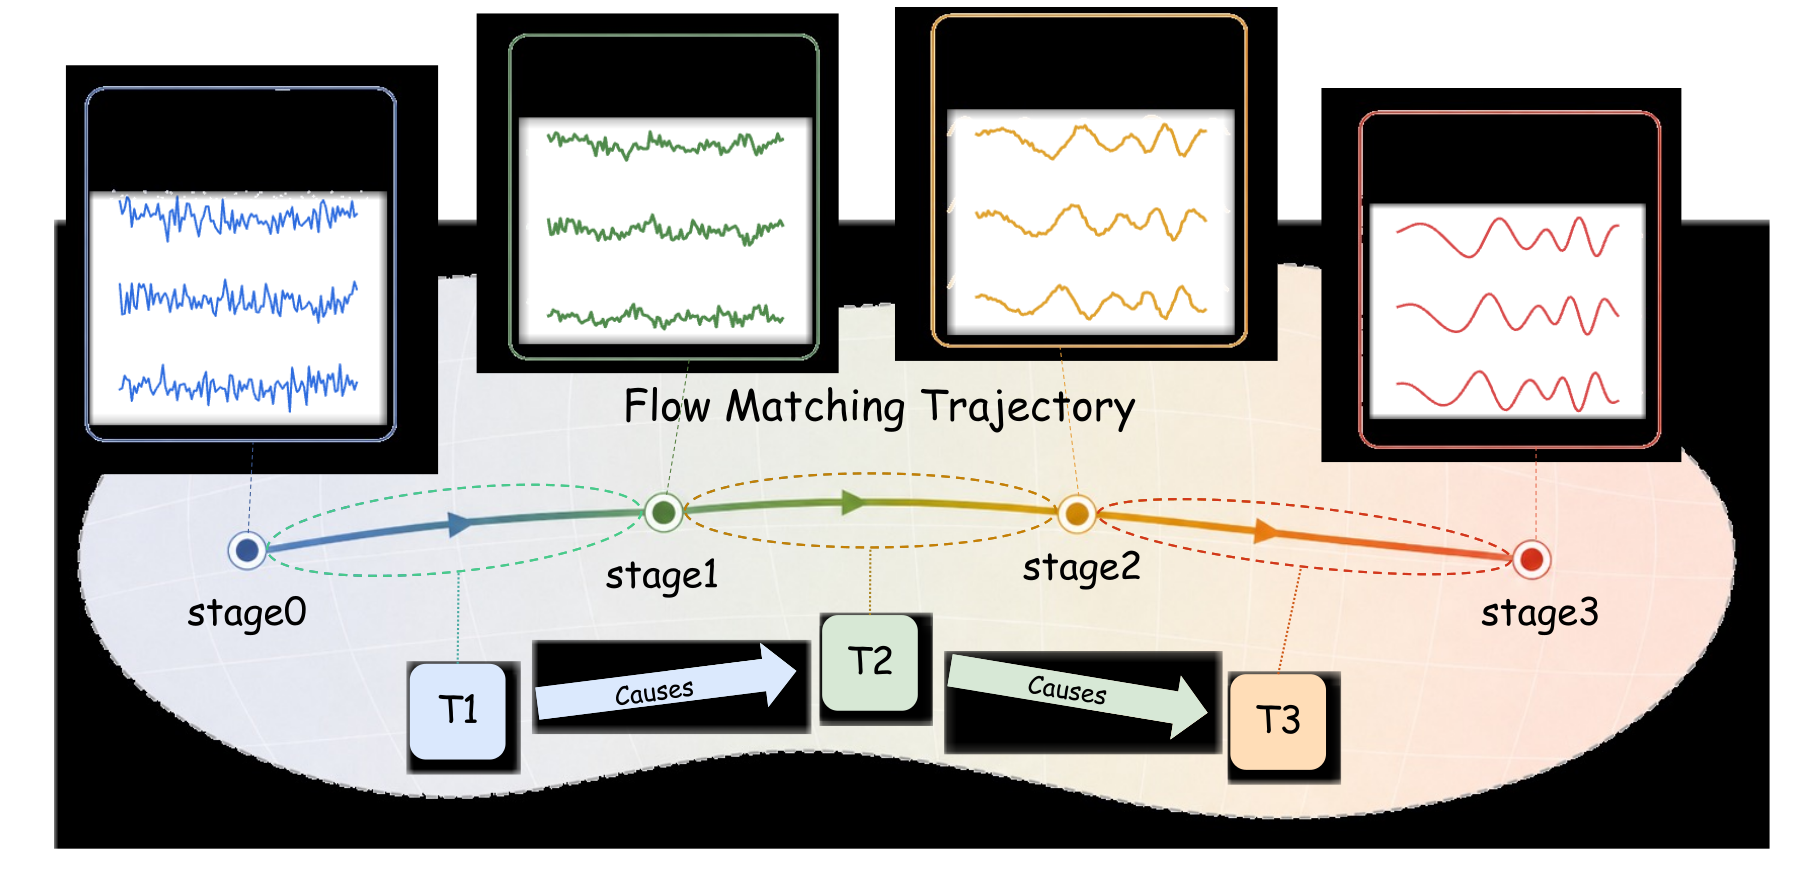
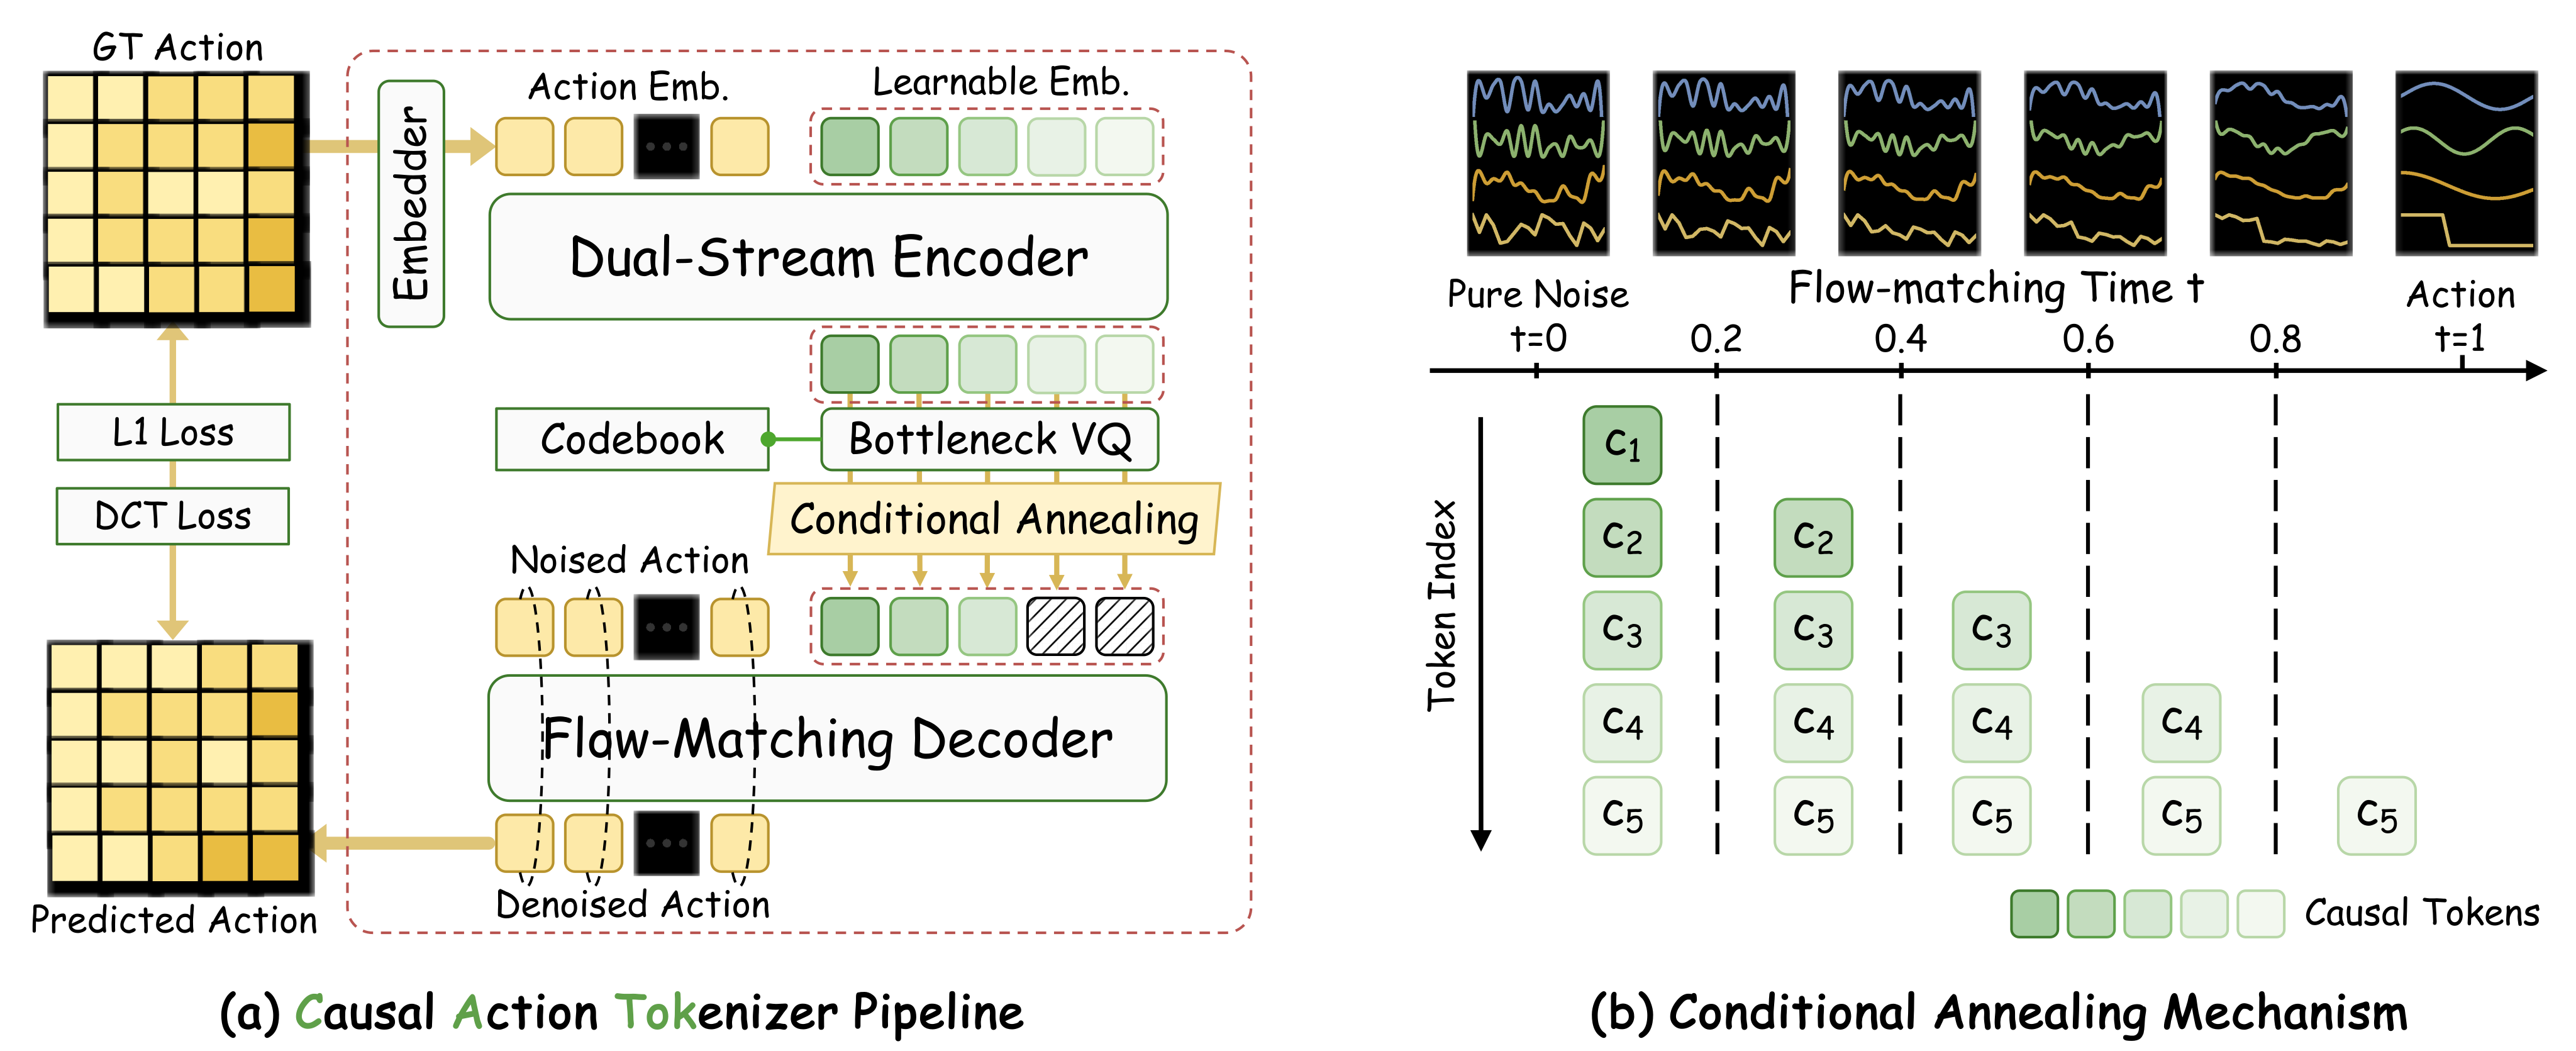
CATok compresses continuous action chunks into discrete tokens and reconstructs them with a flow-matching decoder. During tokenizer training, a time-dependent suffix mask assigns token positions different roles along the noise-to-action trajectory.
Frozen tokens/decoder then support next-token VLA training. CATok reports the strongest aggregate success among tested tokenizers on three simulation benchmarks and a 20-percentage-point hardware gain over FAST in three suites. Evidence concerns this learned ordering and tested systems; it does not establish physical causal discovery or guarantee preservation of all pretrained language knowledge.
1 Introduction
Uniform action binning creates long sequences; compression methods shorten them but may not provide an order suited to autoregressive prediction. CATok uses conditional annealing to encourage early-token global guidance and later-token refinement.
The policy predicts token prefixes autoregressively. The tokenizer itself uses a bidirectional action/query encoder, followed by quantization and a time-masked decoder. Thus the claimed causal structure concerns learned token order and decoder influence, rather than a causal encoder that sees only earlier physical timesteps.
2 Related Works
VLAs can predict discrete action tokens or use continuous action heads. The paper compares binning, FAST’s DCT/BPE compression and OAT’s learned ordered tokens. CATok retains a discrete policy interface with a continuous flow decoder.
Its differences combine a dual-stream encoder, bottleneck quantizer, flow matching and conditional masking. The appendix includes controlled comparisons to separate part of the masking benefit from decoder architecture [13] [15].
3 Method
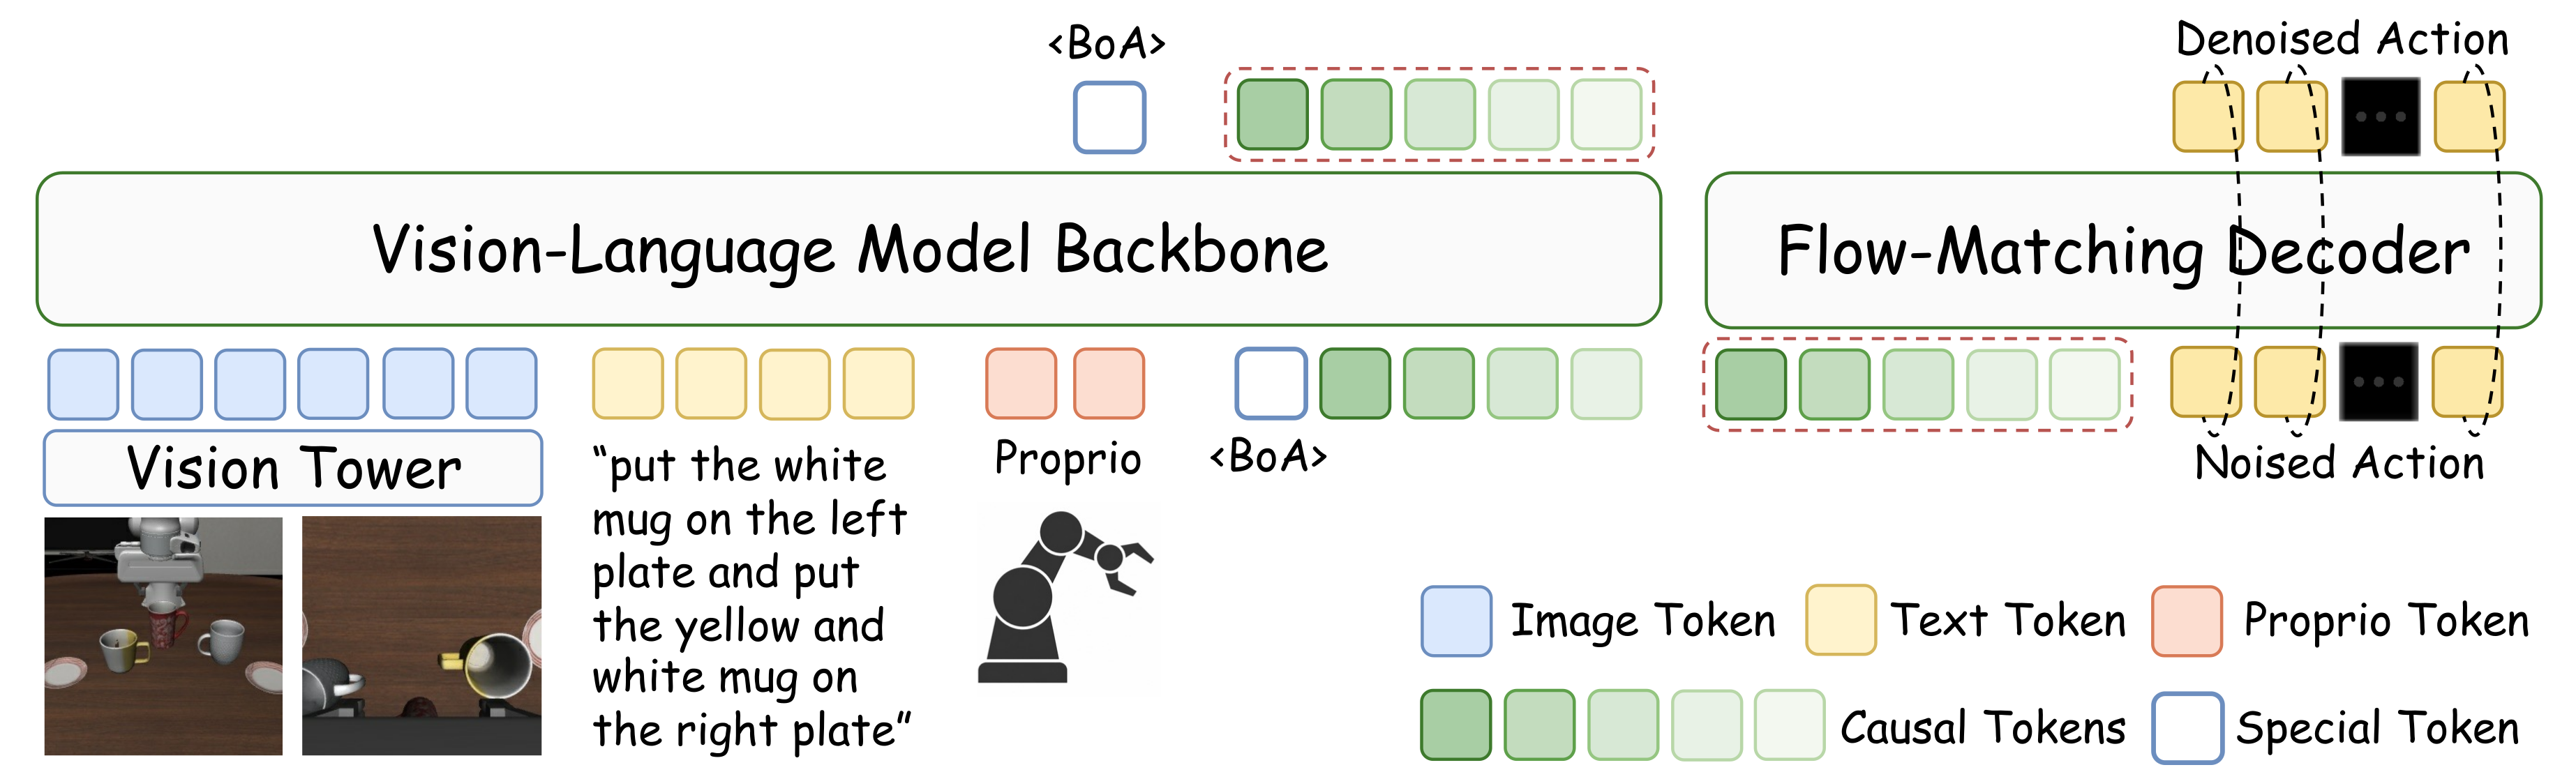
The method first trains an action-only tokenizer, then freezes it for VLA learning. Observations, language and optional proprioception condition the policy; discrete action codes connect that policy to the frozen decoder.
3.1 Problem Formulation
An encoder maps an H-step action chunk to K finite-codebook indices. A decoder reconstructs continuous actions, while the policy learns teacher-forced next-token prediction on the frozen codes.
The initial reconstruction objective formalizes the goal. Later equations specify the actual flow, spectral and quantization losses; the original numbered and unnumbered displays are preserved.
Equations
3.2 CATok Architecture
Quantile-normalized actions pass through a weight-normalized 2D convolutional encoder with positional embeddings. A symmetric multimodal transformer lets action features and K learned queries attend bidirectionally; final query states are quantized.
Each query is projected into a smaller codebook space, assigned its nearest Euclidean code and projected back to the model width. This separates codebook dimensionality from transformer hidden size.
The decoder interpolates from noise at t=0 to action at t=1. At time t, it removes the first floor(tK) token embeddings and retains the suffix. All tokens are available at the start; earlier tokens disappear first, while later ones remain available for refinement. At the terminal endpoint all are masked.
The L1 velocity objective trains the network under that schedule. Stage-dependent token support is partly imposed by construction; learned coarse/fine content still requires the empirical probes below [17] [18].
Equations 1–3
| (1) |
| (2) |
| (3) |
3.3 CATok Training and Inference
Tokenizer training combines L1 flow-velocity error, a DCT-domain velocity discrepancy and a commitment term. Codebook entries use exponential-moving-average updates, with rarely used entries reinitialized from batch embeddings.
Equation 6 subtracts the bottleneck projection of a query from its post-projected quantized embedding. The preceding definitions place those terms in different dimensions when the bottleneck is smaller. This notation is retained as printed; the paper does not resolve which space the commitment comparison uses.
Equation 7 describes continuous ODE decoding with the changing suffix mask. The VLA section and architecture caption state single-step decoding. The numerical integration choice and how a single deployment step uses the multistage conditioning schedule are not detailed. Exact loss weights, architectural sizes and codebook-reset thresholds are also not fully specified.
Equations 4–7
| (4) |
| (5) |
| (6) |
| (7) |
3.4 VLA- CATok
Visual, language and proprioceptive tokens enter a VLM that predicts action codes. The tokenizer/codebook/decoder remain frozen, while cross-entropy updates the autoregressive backbone.
This blocks continuous decoder-loss gradients from reaching the VLM during policy training. Action-token cross-entropy still changes the backbone; the experiments do not include an independent language/vision knowledge-retention benchmark. The paper’s broader knowledge-insulation claim should be scoped to this training interface [26].
Equation 8
| (8) |
4 Experiments
Experiments evaluate downstream simulation/hardware policies, representation probes, tokenizer metrics and ablations. All aggregate and per-task results remain alongside the original experimental figures.
4.1 Experimental Setup
BIN uses 256 bins per scalar, FAST applies DCT/BPE and OAT learns ordered VQ codes. LIBERO policies finetune π0-FAST-base; SimplerEnv and RoboTwin use the same Qwen3-VL-4B-Instruct backbone trained from scratch.
LIBERO evaluates 40 tasks with 50 rollouts each. SimplerEnv tests four WidowX tasks using Bridge training data and 24 rollouts per task. RoboTwin evaluates 50 clean/randomized tasks with 20 rollouts per task and condition.
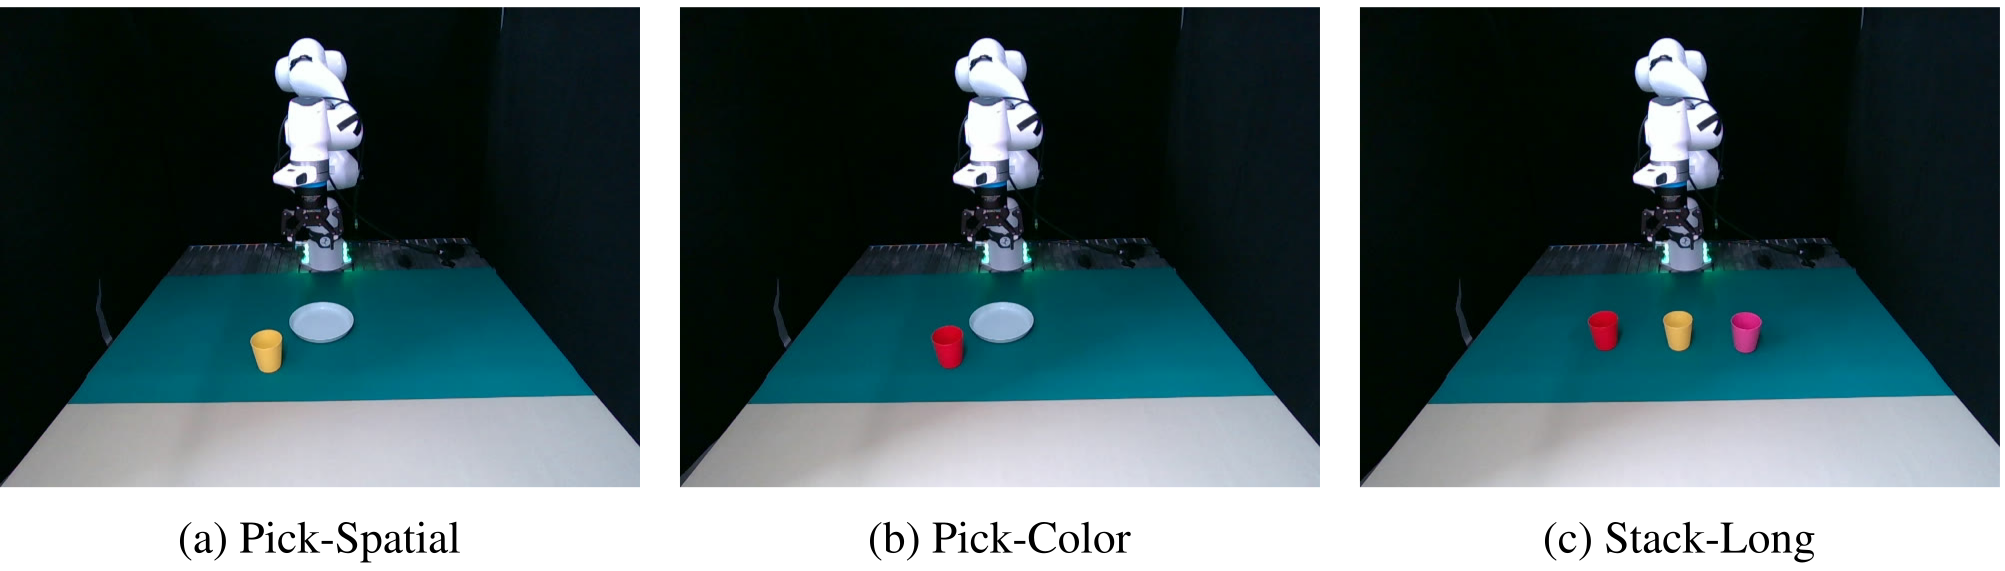
Hardware uses a Franka robot, 362 picking and 220 stacking demonstrations, and shared Qwen3.5-VL training protocols. CATok tokenizer pre-training additionally uses InternA1 joint data to match FAST reconstruction quality. This is a comparison of the resulting trained pipelines rather than identical tokenizer pre-training data [37] [38] [39].
Original panel captions

Accessible table and original citation links
| LIBERO | SimplerEnv | RoboTwin 2.0 | ||||||||||
| Method | Spatial | Object | Goal | Long | Avg. | Spoon | Carrot | Stack | Eggplant | Avg. | Clean | Randomized |
| BIN | 0.586 | 0.878 | 0.680 | 0.604 | 0.687 | 0.542 | 0.333 | 0.208 | 0.708 | 0.448 | 0.213 | 0.221 |
| FAST | 0.960 | 0.998 | 0.962 | 0.901 | 0.955 | 0.500 | 0.375 | 0.375 | 0.625 | 0.469 | 0.478 | 0.478 |
| OAT | 0.428 | 0.876 | 0.704 | 0.276 | 0.571 | 0.417 | 0.208 | 0.167 | 0.667 | 0.365 | 0.229 | 0.233 |
| CATok | 0.978 | 0.994 | 0.954 | 0.910 | 0.959 | 0.458 | 0.417 | 0.542 | 0.542 | 0.490 | 0.489 | 0.531 |
4.2 Can CATok Help VLA Training?
Aggregate simulation success is 95.9% on LIBERO, 49.0% on SimplerEnv, and 48.9/53.1% on clean/randomized RoboTwin. Corresponding FAST values are 95.5%, 46.9% and 47.8/47.8%. Gains vary substantially across settings.
CATok does not win every task: FAST is stronger on LIBERO Object/Goal and SimplerEnv Spoon/Eggplant. SimplerEnv stacking rises from 37.5% to 54.2%, a 16.7-percentage-point gain, about 44.5% relative. The source’s percentage wording should not merge those quantities.
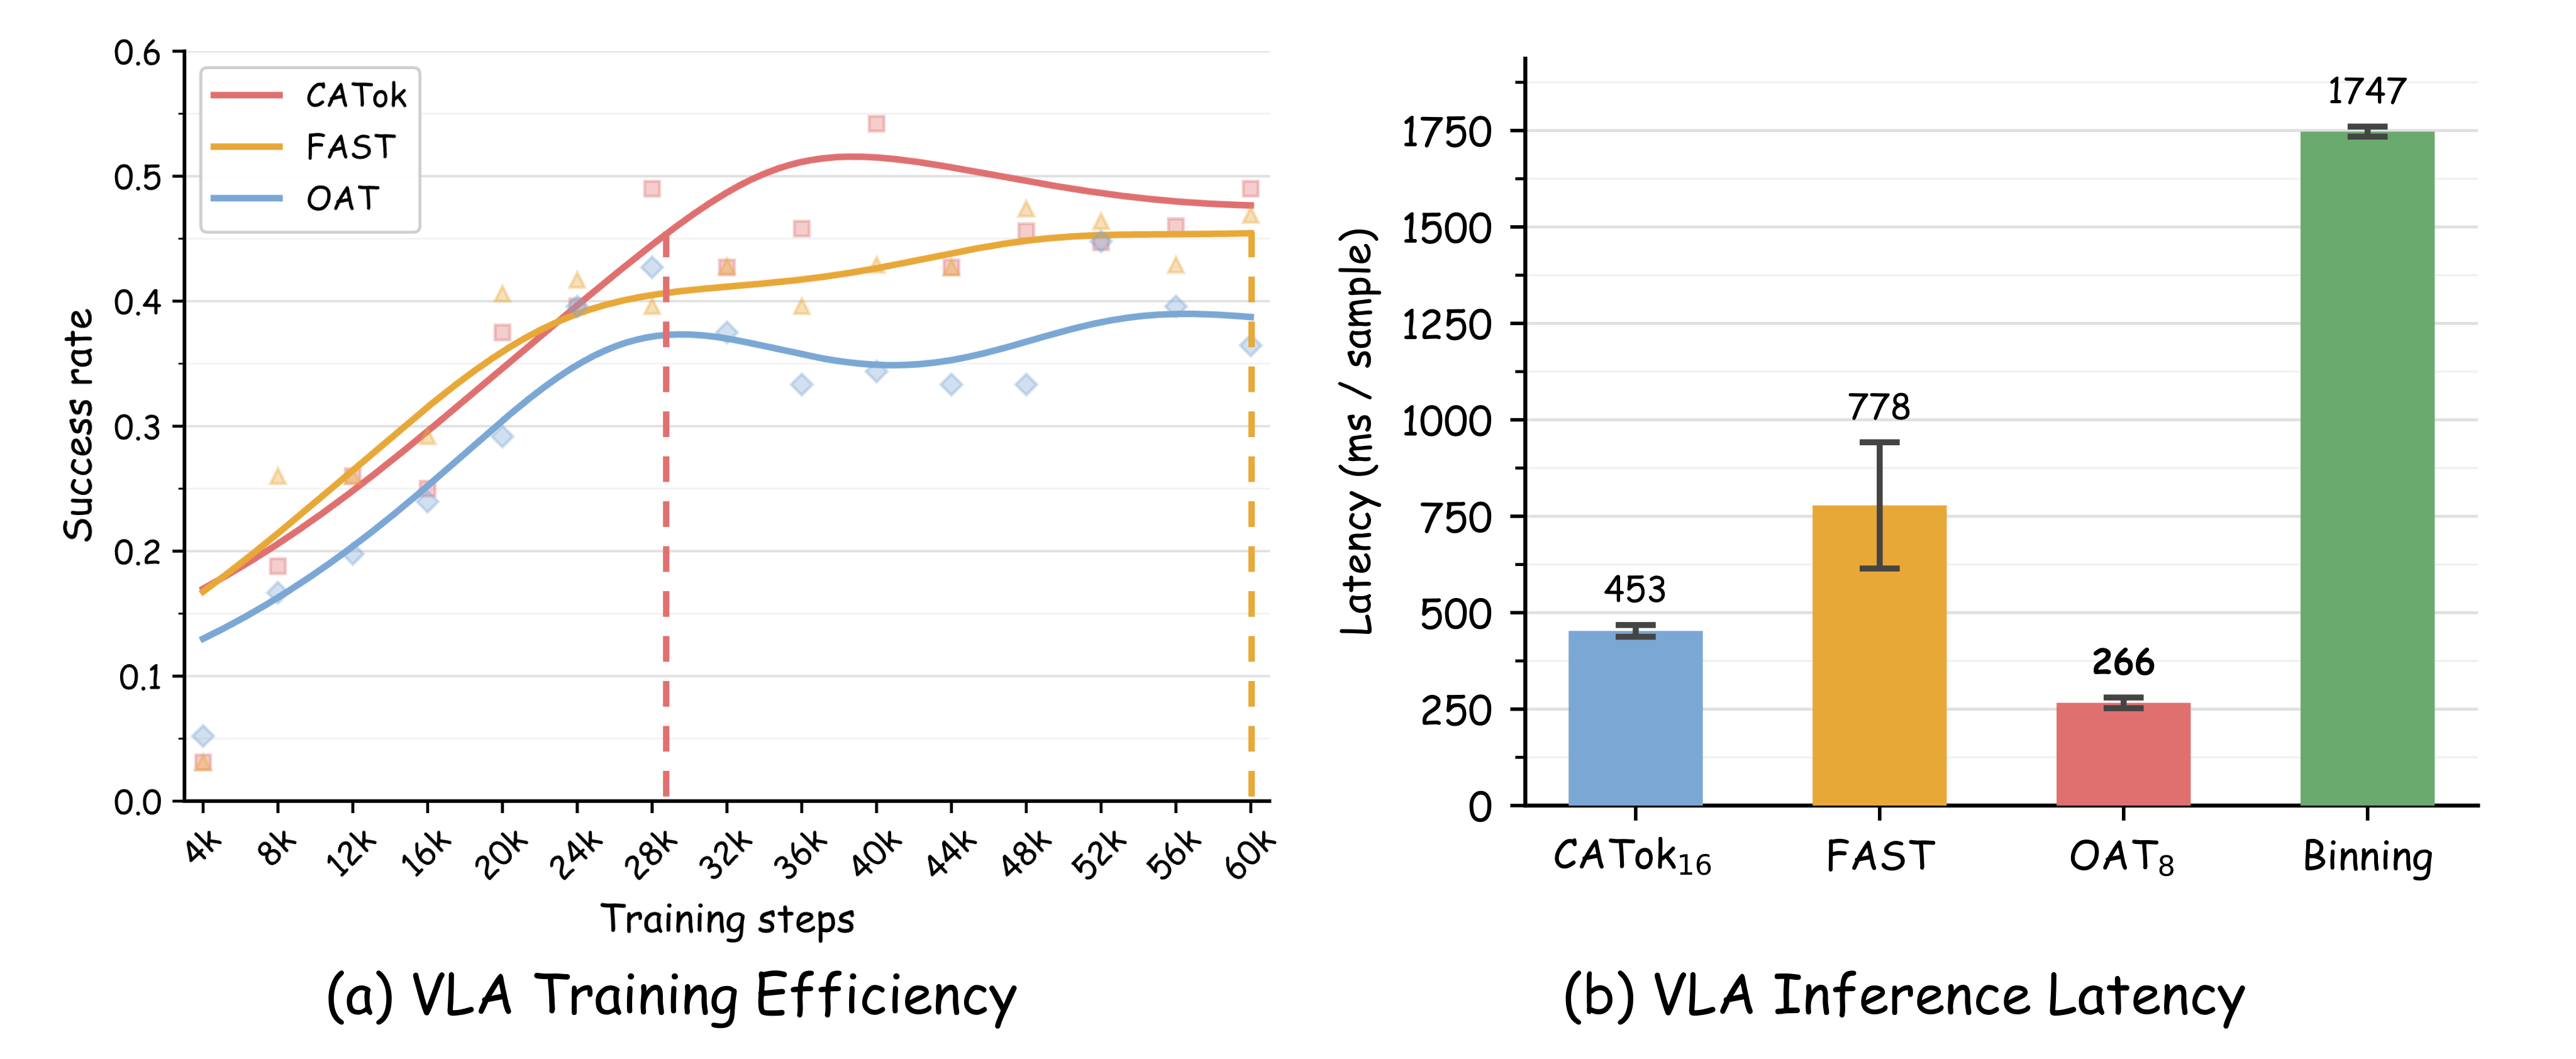
The smoothed training curve reaches FAST’s best plotted result at about half the steps. Figure 5 reports 453 ms VLA latency versus FAST’s 778 ms, about 1.7× faster; OAT is faster still at 266 ms but much less successful. Step counts are not a full wall-clock training-cost comparison.
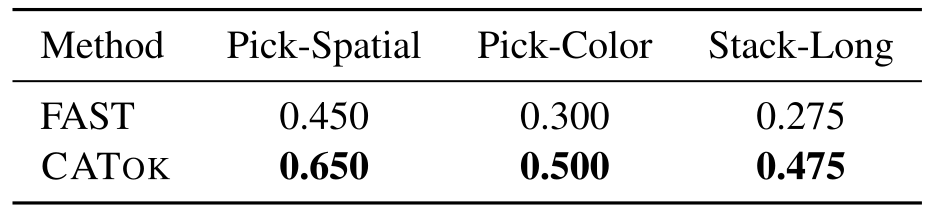
Hardware scores 65/50/47.5% versus FAST’s 45/30/27.5%. The project specifies 20 spatial, ten unseen-red-cup and 40 stacking rollouts. These are small tests on one robot, without reported confidence intervals or independent training-seed variability.
4.3 Does CATok Produce Causal Tokens with Generative Semantics?
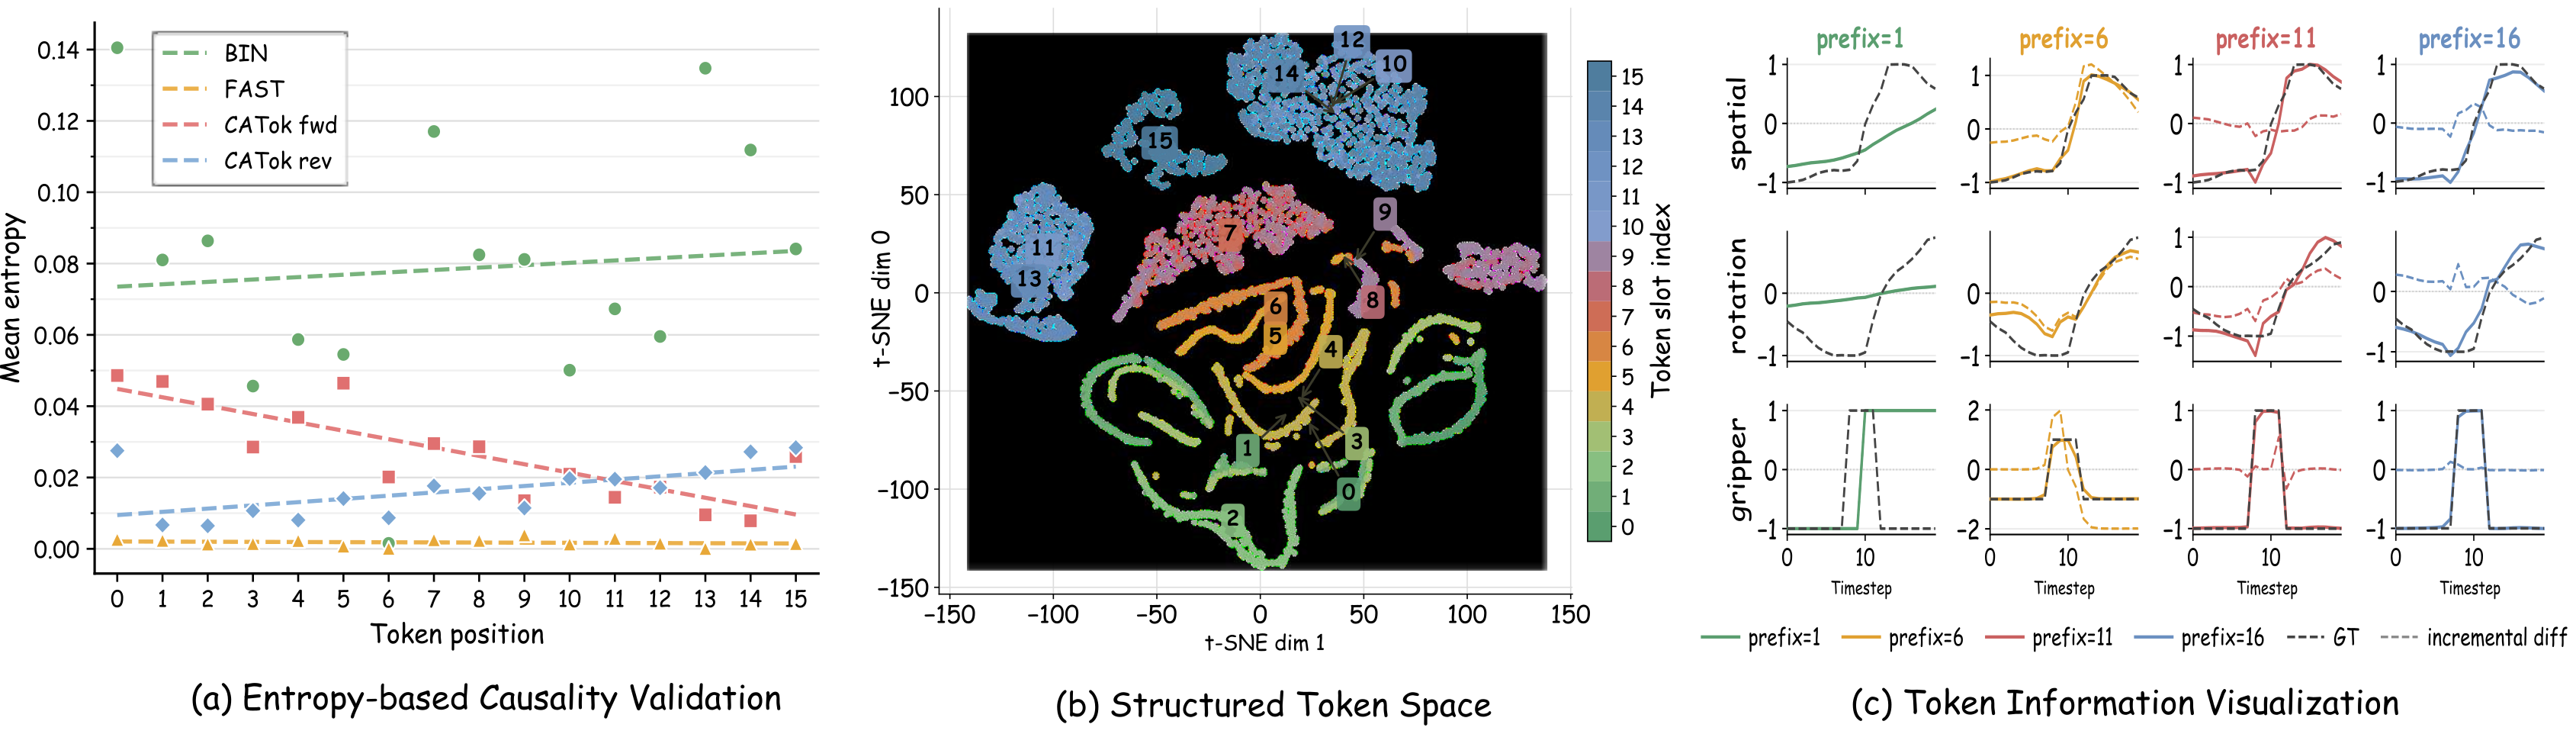
An action-only autoregressive probe measures next-token entropy on held-out mixed action chunks. CATok entropy falls in forward order and rises in reverse; this supports a directional predictive organization. Entropy also depends on positional code distributions and model fitting, so that trend alone is not a proof of causal dependence.
t-SNE of embeddings from 32,768 normalized LIBERO chunks shows slot-dependent geometry. Prefix reconstructions at 1, 6, 11 and 16 tokens show structured trajectory changes. These are representation/decoder probes rather than guarantees that every token has a human-interpretable semantic meaning.
Native-decoder swaps and removals in Appendix C.1 test positional influence directly. Their triangular time support follows the masking schedule; variation within active stages supplies the additional learned-behavior evidence.
4.4 Intrinsic Properties of CATok
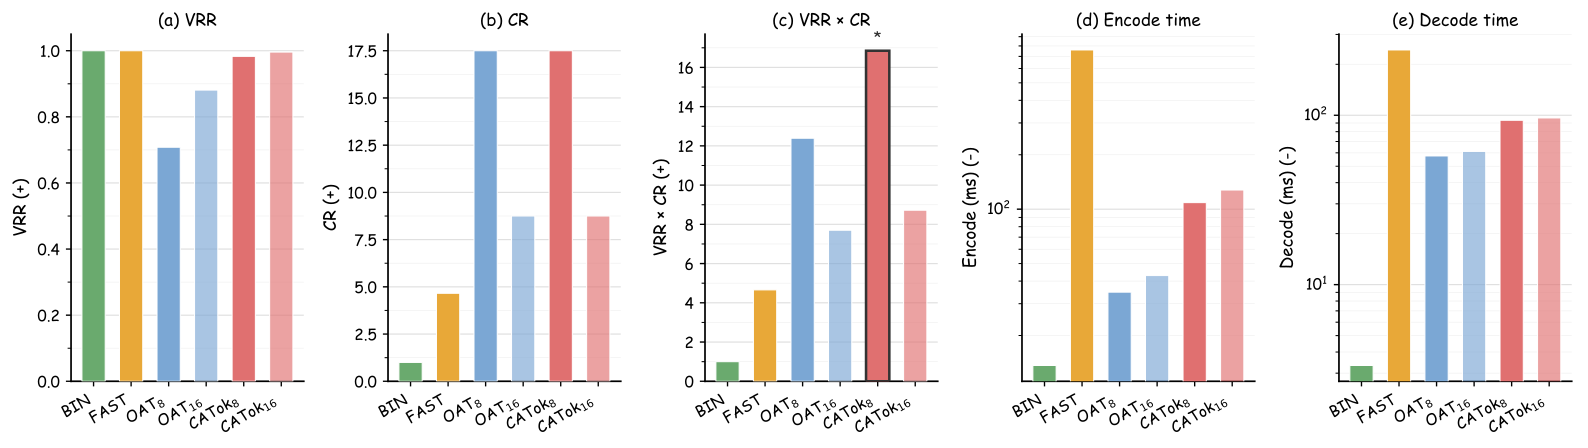
Valid Reconstruction Rate counts chunks below a reconstruction threshold, and Compression Rate divides raw scalar count by token count. Their product summarizes one chosen fidelity/compression trade-off.
CATok with eight tokens reaches the best plotted product, 16.85; sixteen tokens are used in the main LIBERO policy. These are different operating points. Figure 7’s 3.6× comparison concerns the product metric rather than a 3.6× improvement in task success or reconstruction accuracy alone.
CATok tokenization is faster than FAST in the plotted setting, while binning is intrinsically cheaper and OAT decoding remains competitive. End-to-end policy latency additionally includes autoregressive generation. Exact metric and timing limitations remain in Appendix B.
4.5 Ablations and Analysis
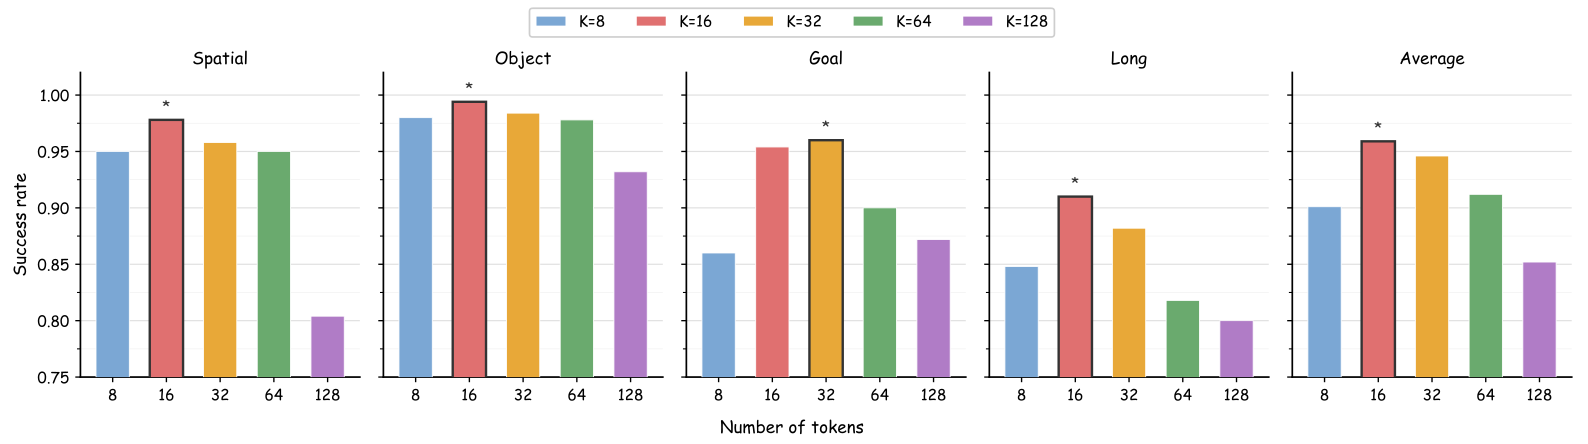
Ablations compare annealing, random masking, decoder architecture and token count. Full numerical controls and all token-budget plots are retained in Appendix C.
5 Conclusion
CATok combines compact autoregressive action prediction with a frozen flow decoder, with gains on the evaluated aggregate policy metrics and a useful stage-ordered inductive bias.
Limits include one hardware platform, constrained datasets, no broad cross-embodiment scaling study, limited uncertainty reporting and incomplete implementation specifications. The source’s causality and knowledge-preservation language is stronger than the specific measurements establish.
Original project comparisons
The authors’ project page includes six original successful rollouts, comparing CATok and FAST on spatial picking, unseen-red-cup picking and stacking. All files are unchanged and stored locally with generated preview frames.
These selected successes illustrate execution rather than supply additional unbiased trials. The public code and project’s detailed donor-swap explanation remain linked.
Appendix A Implementation Details
LIBERO/Bridge tokenizer training mixes the datasets at weights 1:5 before separate policy training; RoboTwin trains its tokenizer and policy on its full data. Action horizons are 20/10/20 and token counts 16/16/32, with codebook size 4,096.
The complete table retains tokenizer steps, batch sizes, learning rates, warm-up, weight decay and four-H100 policy training configuration. It does not supply a complete latency measurement setup or total training time.
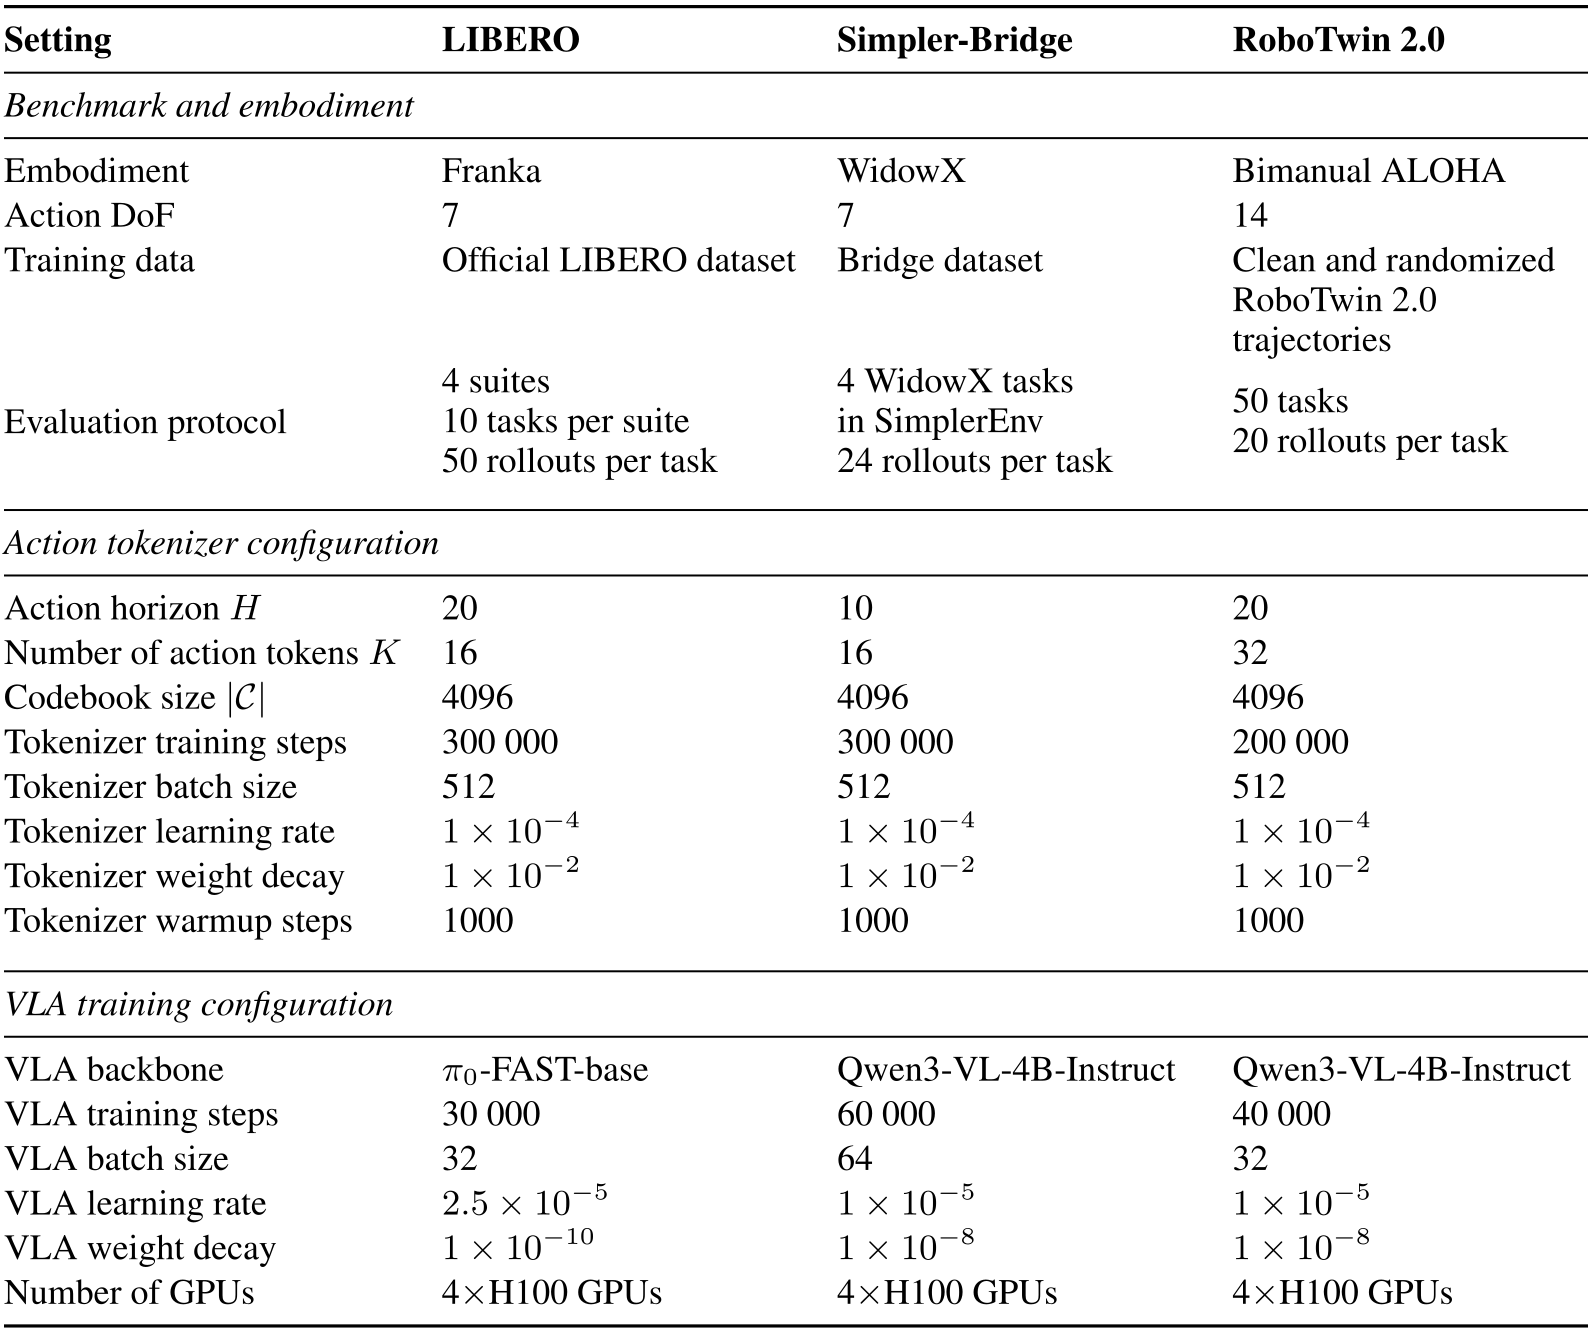
Accessible table and original citation links
| Setting | LIBERO | Simpler-Bridge | RoboTwin 2.0 |
| Benchmark and embodiment | |||
| Embodiment | Franka | WidowX | Bimanual ALOHA |
| Action DoF | 7 | 7 | 14 |
| Training data | Official LIBERO dataset | Bridge dataset | Clean and randomized RoboTwin 2.0 trajectories |
| Evaluation protocol |
4 suites 10 tasks per suite 50 rollouts per task |
4 WidowX tasks in SimplerEnv 24 rollouts per task |
50 tasks 20 rollouts per task |
| Action tokenizer configuration | |||
| Action horizon | 20 | 10 | 20 |
| Number of action tokens | 16 | 16 | 32 |
| Codebook size | 4096 | 4096 | 4096 |
| Tokenizer training steps | 300 000 | 300 000 | 200 000 |
| Tokenizer batch size | 512 | 512 | 512 |
| Tokenizer learning rate | |||
| Tokenizer weight decay | |||
| Tokenizer warmup steps | 1000 | 1000 | 1000 |
| VLA training configuration | |||
| VLA backbone | -FAST-base | Qwen3-VL-4B-Instruct | Qwen3-VL-4B-Instruct |
| VLA training steps | 30 000 | 60 000 | 40 000 |
| VLA batch size | 32 | 64 | 32 |
| VLA learning rate | |||
| VLA weight decay | |||
| Number of GPUs | 4H100 GPUs | 4H100 GPUs | 4H100 GPUs |
Appendix B Evaluation Metrics
The appendix defines the intrinsic tokenizer metrics and timing protocol. These quantities evaluate action reconstruction and computation, rather than physical task success.
B.1 Valid Reconstruction Rate (VRR)
VRR uses the norm of the complete reconstructed action-chunk error divided by horizon H, then thresholds it at σ. The norm spans both time and action coordinates.
The expression is not simply a mean of per-timestep norms or a dimension-normalized error. This version does not state the numerical threshold σ, limiting reproduction and comparison across action dimensions or horizons.
Equation 9
| (9) |
B.2 Compression Rate (CR)
CR divides B×H×D raw action scalars by the discrete token count. Higher values mean fewer tokens per scalar representation.
This is an element/token count ratio, not a byte-storage or bitrate comparison: scalar precision, code-index bits, codebook storage and decoder parameters are outside the formula.
Equation 10
| (10) |
B.3 Encoding and Decoding Latency
Encoding measures action-to-code conversion and decoding measures code-to-action reconstruction. The paper averages timings across batches under a shared setting.
It does not report the exact intrinsic-timing batch size, hardware/device configuration, synchronization or warm-up procedure. Table 3’s four-H100 training allocation does not itself specify those measurement details.
Appendix C Ablations and Analysis
The full appendix separates conditional annealing from selected architectural controls, then examines token budget and decoder interventions. All four ablation rows and every plotted token count are retained.
Conditional Annealing and Architecture Ablations.
Removing conditional annealing lowers LIBERO mean success from 95.9% to 91.4%. A parameter-comparable VQ-VAE/MMDiT with random masking scores 73.7%, versus 48.6% without masking.
The A-versus-B comparison is the clearest direct annealing ablation. The additional VQ-VAE comparisons change reconstruction/training design as well as masking, so the entire gap should not be assigned to token causality alone.
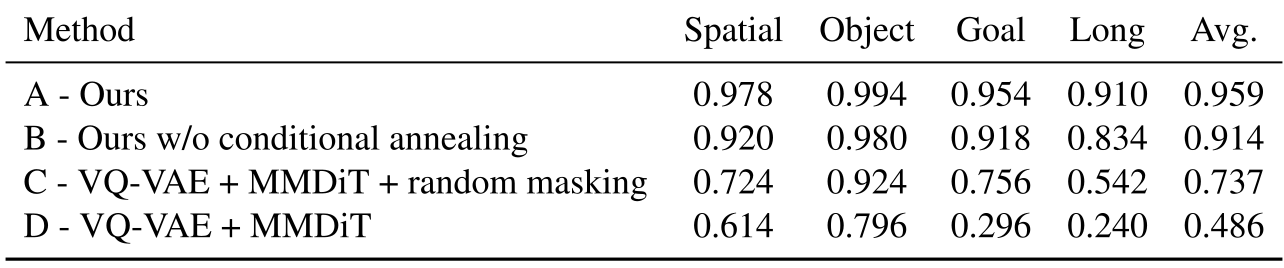
Accessible table and original citation links
| Method | Spatial | Object | Goal | Long | Avg. |
| A - Ours | 0.978 | 0.994 | 0.954 | 0.910 | 0.959 |
| B - Ours w/o conditional annealing | 0.920 | 0.980 | 0.918 | 0.834 | 0.914 |
| C - VQ-VAE + MMDiT + random masking | 0.724 | 0.924 | 0.756 | 0.542 | 0.737 |
| D - VQ-VAE + MMDiT | 0.614 | 0.796 | 0.296 | 0.240 | 0.486 |
Number of Tokens.
The study sweeps 8, 16, 32, 64 and 128 tokens, holding other settings fixed. Sixteen gives the strongest aggregate LIBERO performance; larger budgets degrade it.
The authors attribute this to harder autoregressive modeling of long sequences. This is a plausible interpretation of the tested sweep, rather than proof that sixteen is optimal across datasets, action horizons or model scales. Some individual suites do not improve uniformly from eight to sixteen.
C.1 Causality Validation
Frozen-native-decoder interventions replace one token while holding the others fixed, measuring changes in generated actions or velocity. This establishes sensitivity within the trained decoder, with its masking rules fixed.
Donor-Swap Intervention.
Donor swaps substitute another chunk’s embedding at the same slot and evaluate the change over flow time. Same-slot donors preserve the positional embedding distribution better than arbitrary replacement.
The project further describes fixed state/time/noise and normalization within each token’s active interval. A token cannot influence stages where the architecture masks it, so triangular support alone verifies the schedule.
Single-Token Removal.
Single-token removal uses a neutral/zero embedding and compares with complete-code reconstruction. The heatmap shows position-dependent joint/gripper influence.
A zero embedding can fall outside normal encoded examples. These controlled model interventions characterize decoder roles without proving causal relations among physical actions or environment states.
Results.
Early slots show stronger coarse task/gripper effects and earlier-stage influence; later slots contribute joint/trajectory refinements. The combined geometry, reconstruction and intervention evidence supports a useful ordered representation.
That evidence should be distinguished from a universal semantic interpretation, an autoregressive encoder factorization or an identified real-world causal model.
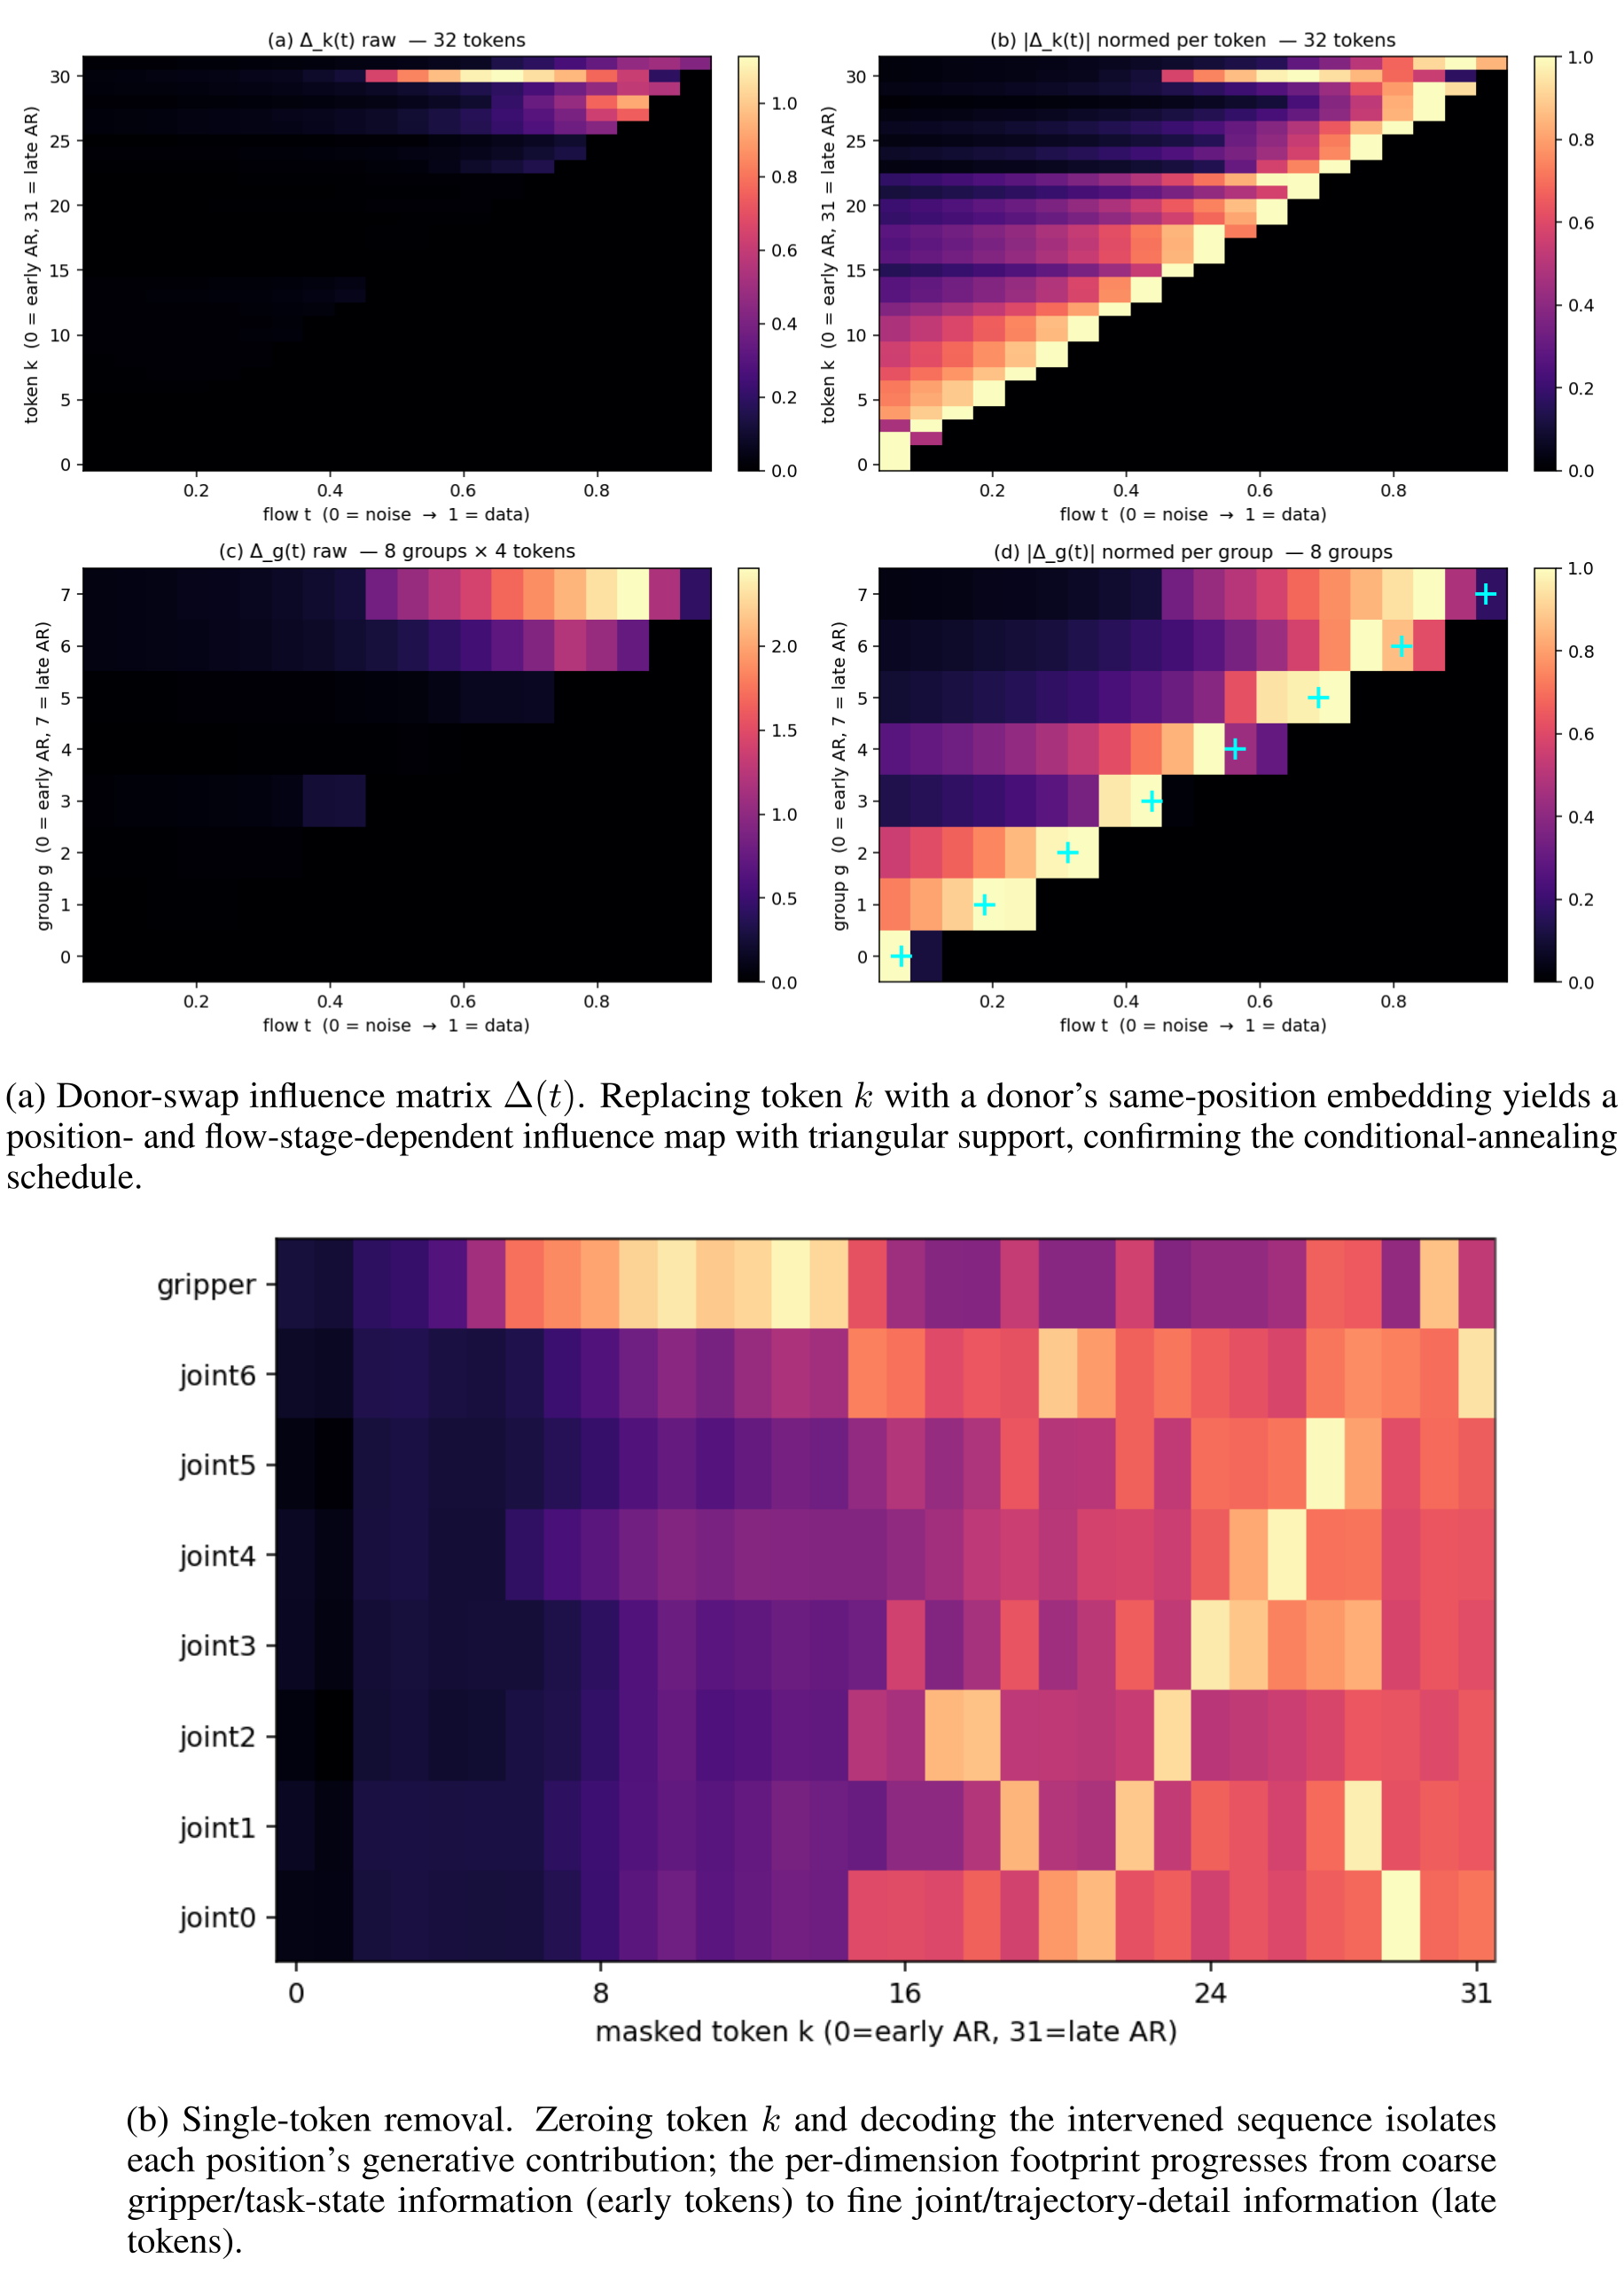
Original panel captions
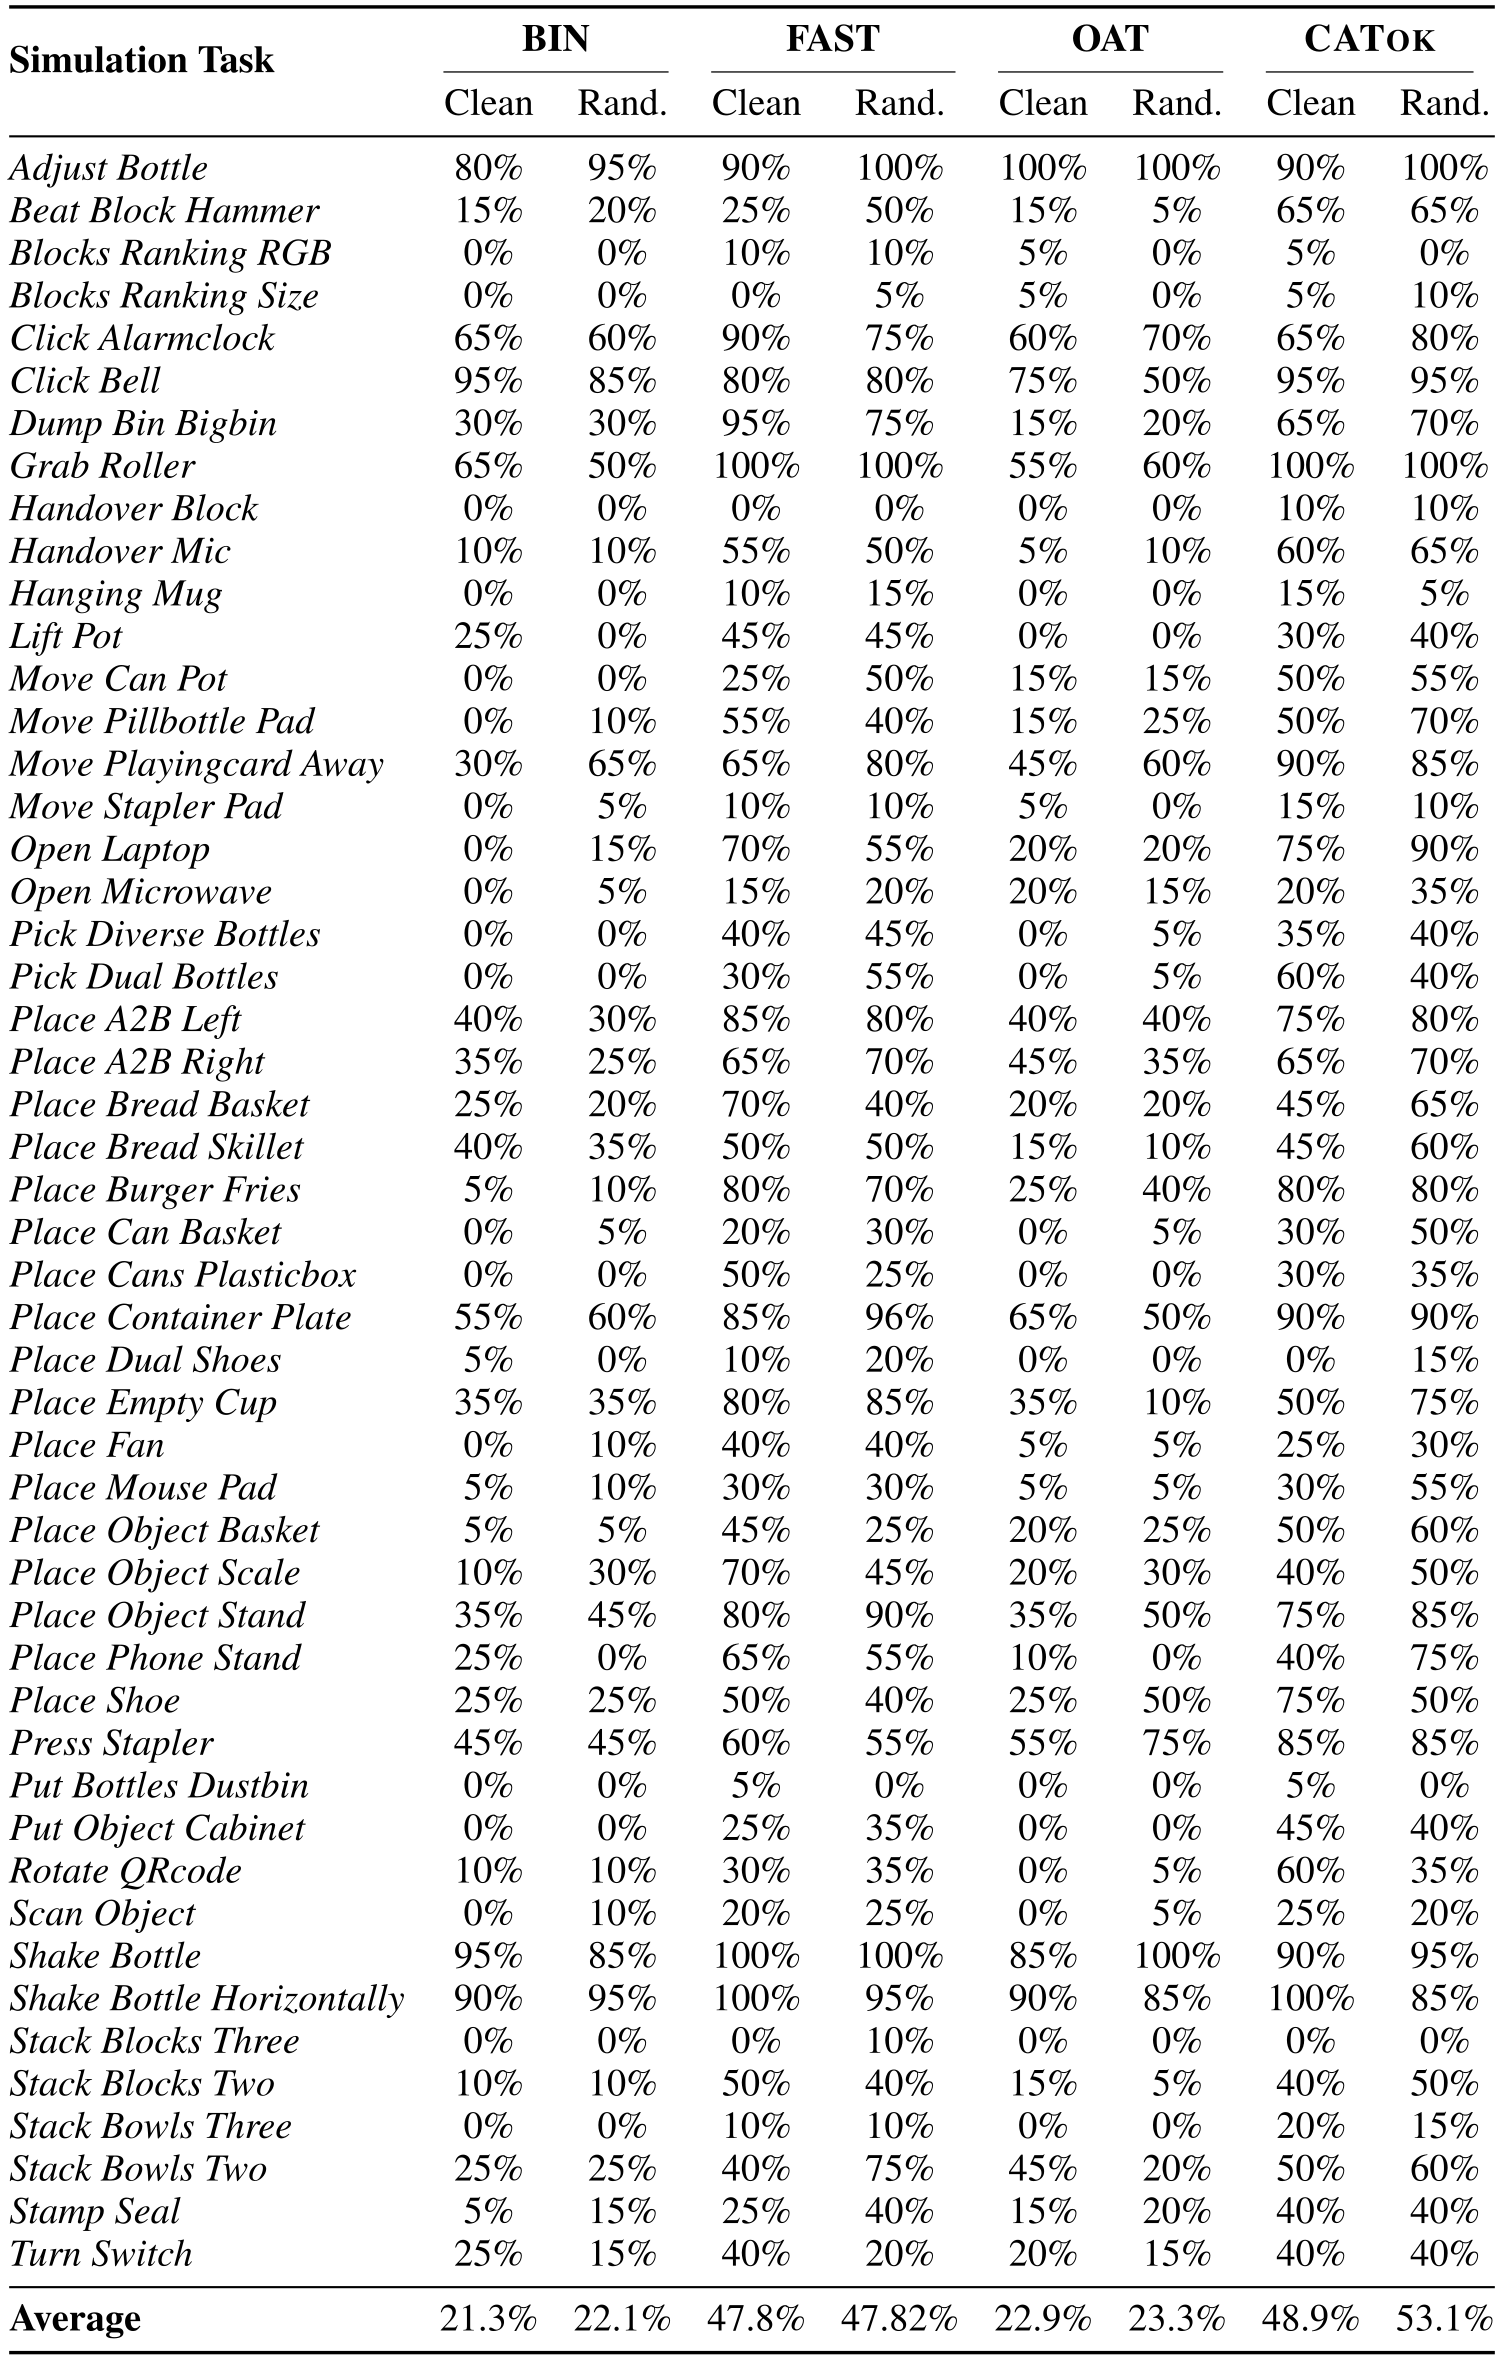
Appendix D Full Robotwin 2.0 Benchmark
The full 50-task table preserves clean/randomized success for all four methods, including many ties, reversals and zero-success tasks. CATok’s aggregate advantage coexists with weaker performance than FAST on several individual tasks.
The source prints FAST randomized Place Container Plate at 96%, although 20 single-run trials would permit only five-percentage-point increments. It also prints the resulting average as 47.82%, rounded to 47.8% in Table 1. Values remain unchanged; no pooling/repetition explanation is supplied.
Accessible table and original citation links
| Simulation Task | BIN | FAST | OAT | CATok | ||||
| Clean | Rand. | Clean | Rand. | Clean | Rand. | Clean | Rand. | |
| Adjust Bottle | 80% | 95% | 90% | 100% | 100% | 100% | 90% | 100% |
| Beat Block Hammer | 15% | 20% | 25% | 50% | 15% | 5% | 65% | 65% |
| Blocks Ranking RGB | 0% | 0% | 10% | 10% | 5% | 0% | 5% | 0% |
| Blocks Ranking Size | 0% | 0% | 0% | 5% | 5% | 0% | 5% | 10% |
| Click Alarmclock | 65% | 60% | 90% | 75% | 60% | 70% | 65% | 80% |
| Click Bell | 95% | 85% | 80% | 80% | 75% | 50% | 95% | 95% |
| Dump Bin Bigbin | 30% | 30% | 95% | 75% | 15% | 20% | 65% | 70% |
| Grab Roller | 65% | 50% | 100% | 100% | 55% | 60% | 100% | 100% |
| Handover Block | 0% | 0% | 0% | 0% | 0% | 0% | 10% | 10% |
| Handover Mic | 10% | 10% | 55% | 50% | 5% | 10% | 60% | 65% |
| Hanging Mug | 0% | 0% | 10% | 15% | 0% | 0% | 15% | 5% |
| Lift Pot | 25% | 0% | 45% | 45% | 0% | 0% | 30% | 40% |
| Move Can Pot | 0% | 0% | 25% | 50% | 15% | 15% | 50% | 55% |
| Move Pillbottle Pad | 0% | 10% | 55% | 40% | 15% | 25% | 50% | 70% |
| Move Playingcard Away | 30% | 65% | 65% | 80% | 45% | 60% | 90% | 85% |
| Move Stapler Pad | 0% | 5% | 10% | 10% | 5% | 0% | 15% | 10% |
| Open Laptop | 0% | 15% | 70% | 55% | 20% | 20% | 75% | 90% |
| Open Microwave | 0% | 5% | 15% | 20% | 20% | 15% | 20% | 35% |
| Pick Diverse Bottles | 0% | 0% | 40% | 45% | 0% | 5% | 35% | 40% |
| Pick Dual Bottles | 0% | 0% | 30% | 55% | 0% | 5% | 60% | 40% |
| Place A2B Left | 40% | 30% | 85% | 80% | 40% | 40% | 75% | 80% |
| Place A2B Right | 35% | 25% | 65% | 70% | 45% | 35% | 65% | 70% |
| Place Bread Basket | 25% | 20% | 70% | 40% | 20% | 20% | 45% | 65% |
| Place Bread Skillet | 40% | 35% | 50% | 50% | 15% | 10% | 45% | 60% |
| Place Burger Fries | 5% | 10% | 80% | 70% | 25% | 40% | 80% | 80% |
| Place Can Basket | 0% | 5% | 20% | 30% | 0% | 5% | 30% | 50% |
| Place Cans Plasticbox | 0% | 0% | 50% | 25% | 0% | 0% | 30% | 35% |
| Place Container Plate | 55% | 60% | 85% | 96% | 65% | 50% | 90% | 90% |
| Place Dual Shoes | 5% | 0% | 10% | 20% | 0% | 0% | 0% | 15% |
| Place Empty Cup | 35% | 35% | 80% | 85% | 35% | 10% | 50% | 75% |
| Place Fan | 0% | 10% | 40% | 40% | 5% | 5% | 25% | 30% |
| Place Mouse Pad | 5% | 10% | 30% | 30% | 5% | 5% | 30% | 55% |
| Place Object Basket | 5% | 5% | 45% | 25% | 20% | 25% | 50% | 60% |
| Place Object Scale | 10% | 30% | 70% | 45% | 20% | 30% | 40% | 50% |
| Place Object Stand | 35% | 45% | 80% | 90% | 35% | 50% | 75% | 85% |
| Place Phone Stand | 25% | 0% | 65% | 55% | 10% | 0% | 40% | 75% |
| Place Shoe | 25% | 25% | 50% | 40% | 25% | 50% | 75% | 50% |
| Press Stapler | 45% | 45% | 60% | 55% | 55% | 75% | 85% | 85% |
| Put Bottles Dustbin | 0% | 0% | 5% | 0% | 0% | 0% | 5% | 0% |
| Put Object Cabinet | 0% | 0% | 25% | 35% | 0% | 0% | 45% | 40% |
| Rotate QRcode | 10% | 10% | 30% | 35% | 0% | 5% | 60% | 35% |
| Scan Object | 0% | 10% | 20% | 25% | 0% | 5% | 25% | 20% |
| Shake Bottle | 95% | 85% | 100% | 100% | 85% | 100% | 90% | 95% |
| Shake Bottle Horizontally | 90% | 95% | 100% | 95% | 90% | 85% | 100% | 85% |
| Stack Blocks Three | 0% | 0% | 0% | 10% | 0% | 0% | 0% | 0% |
| Stack Blocks Two | 10% | 10% | 50% | 40% | 15% | 5% | 40% | 50% |
| Stack Bowls Three | 0% | 0% | 10% | 10% | 0% | 0% | 20% | 15% |
| Stack Bowls Two | 25% | 25% | 40% | 75% | 45% | 20% | 50% | 60% |
| Stamp Seal | 5% | 15% | 25% | 40% | 15% | 20% | 40% | 40% |
| Turn Switch | 25% | 15% | 40% | 20% | 20% | 15% | 40% | 40% |
| Average | 21.3% | 22.1% | 47.8% | 47.82% | 22.9% | 23.3% | 48.9% | 53.1% |