Overview
TactileStep uses deployable pressure-insoles and contact-phase rewards to improve humanoid touchdown and stance quality. Its focus is measured contact behavior, not traversal success alone.
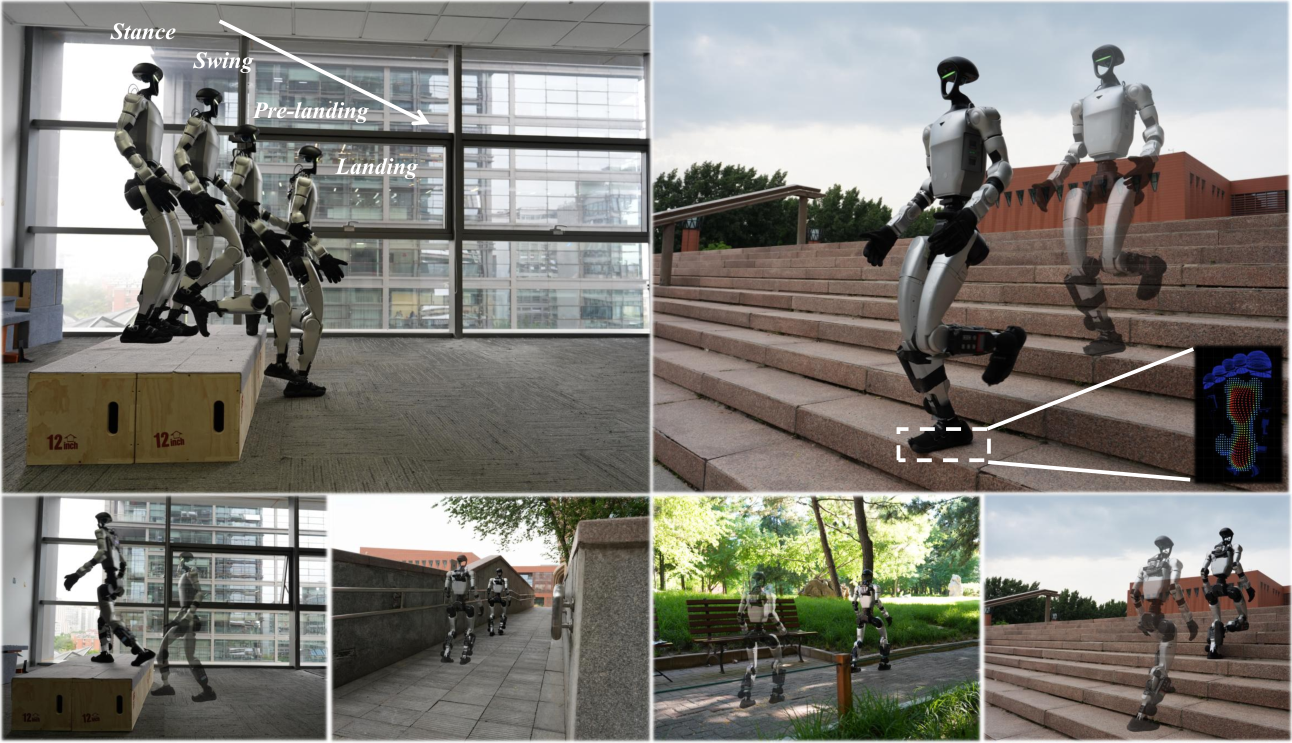
At a glance
A Unitree G1 policy receives compact sole-force, contact-area, and center-of-pressure features in simulation and hardware. Phase-conditioned rewards shape approach, touchdown, and stance, while two critics separate dense and sparse returns. Relative to the tested perceptive baseline, maximum within-terrain improvements are 48.8% lower measured touchdown force, 30.1 dB lower peak A-weighted noise, and 23.8% larger stance contact-area ratio. These maxima occur on different terrain comparisons; they are not average improvements across all conditions.
1 Introduction
Successful obstacle traversal can conceal harsh impacts or small, poorly centered foot support. Vision describes geometry before contact, whereas pressure insoles reveal the support actually formed afterward. TactileStep exposes a compact pressure representation to the deployed policy and shapes contact objectives in four phases. Lower impact and better contact metrics are useful engineering outcomes, but this study does not measure long-term durability or establish general deployment safety.
2 Related Work
Related work addresses geometric foothold placement, pressure sensing/simulation, and soft landing. The distinction here is deployment-time sole feedback combined with contact-phase reward shaping.
Foothold Objectives and Support Regulation in Humanoid Locomotion.
Geometry-based foothold objectives discourage edge placements before touchdown, but do not directly measure subsequent pressure distribution. Contact area and center-of-pressure margin provide complementary information about realized stance support. The method combines these signals with existing perceptive locomotion rather than replacing terrain perception.
Tactile Simulation and Sim2Real Learning.
Rich tactile simulation can model normal/shear response and deformation at considerable cost. This work distributes rigid-body normal force across taxels and aligns a small set of derived features with hardware. It sacrifices detailed tactile mechanics to support parallel reinforcement learning; agreement of compact features is not validation of the full pressure field or deformable-surface physics.
Soft Landing and Contact Regulation in Legged Locomotion.
Mechanical compliance and contact controllers can soften legged impacts. QuietWalk uses a learned force predictor but does not expose sole feedback during deployment. TactileStep instead supplies pressure-derived features online and applies different objectives before touchdown, during landing, and during stance on stairs and platforms.
3 Method
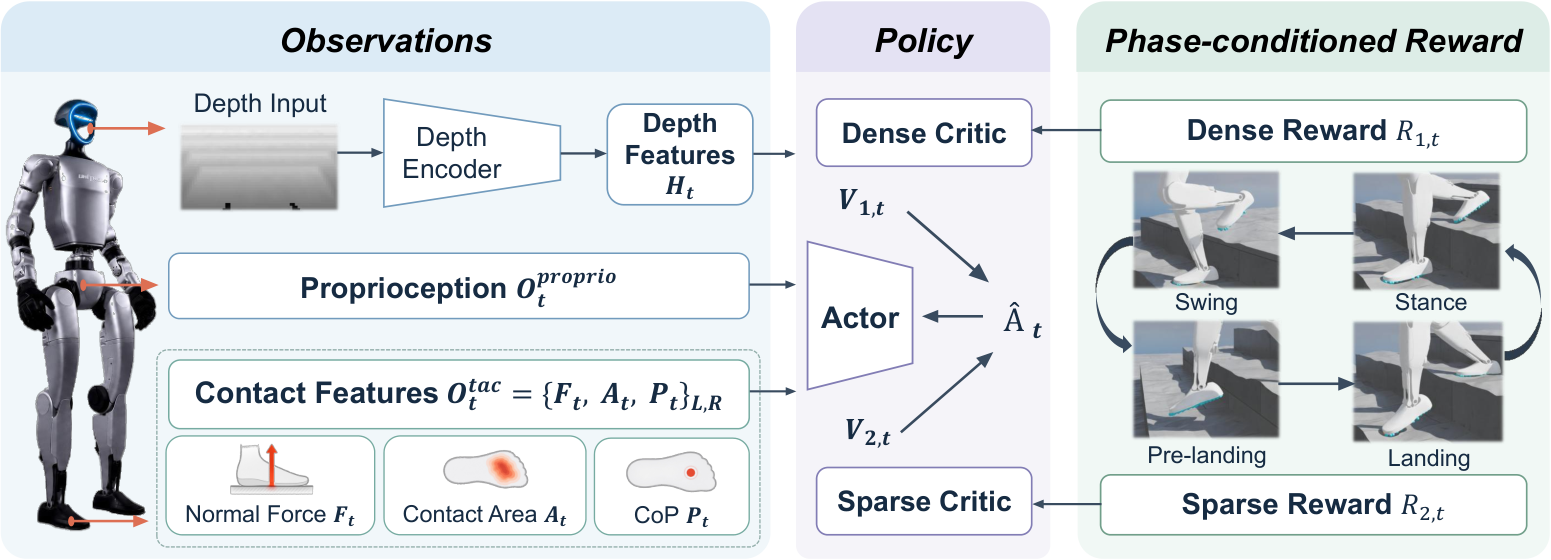
The actor uses signals available on the physical robot. Simulator-specific foot motion and contact-phase information are reserved for training critics and reward computation, while the compact tactile interface is shared across domains.
3.1 Problem Formulation
Locomotion is treated as a partially observable control problem optimized with PPO. The actor and value functions receive different information to make training informative while keeping deployment observations available on hardware.
Observation Space.
Actor observations combine proprioceptive history, depth history, and each foot’s normalized normal force, contact-area ratio, and two-dimensional center of pressure. Two tactile frames add sixteen input dimensions. Both critics additionally receive vertical foot velocity and phase history. Those privileged quantities should not be mistaken for extra deployment sensors or required actor inputs.
Equation 1
| (1) |
Action Space.
The actor outputs twenty-nine target joint positions. Existing proportional-derivative control converts target/current position and joint velocity into torques, using gains adopted from prior work. The learned policy regulates targets rather than directly commanding raw motor torque.
Reward Functions.
Task tracking, regularization, safety constraints, and an adversarial motion prior shape behavior. Two critics estimate dense and sparse environment-return groups; their advantages are mixed for actor updates. Grouping follows when signals are informative, so a phase-gated reward can still be dense during its active interval. The motion-prior objective is auxiliary rather than simply another single-critic reward category.
Equation 2
| (2) |
3.2 Tactile Simulation
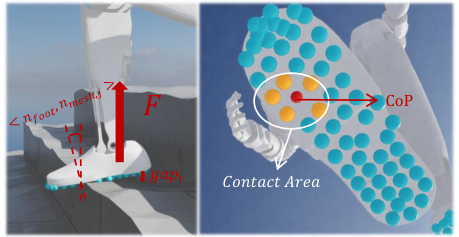
A lightweight Isaac Sim model maps resultant rigid-body foot contact force onto sixty sole taxels, smooths the spatial distribution, and extracts the hardware-facing features. It does not simulate insole or terrain soft-body deformation.
Force Distribution.
Raycasts along the sole normal measure each taxel’s gap and terrain-normal alignment. A clipped angular weight and distance-dependent exponential favor nearby, aligned contacts, and normalized weights allocate the resultant normal force. This is an approximate pressure distribution derived from rigid contact geometry, not a finite-element model of the sensor.
Equations 3–4
| (3) |
| (4) |
Spatial Diffusion.
Each taxel blends its allocated force with the average over neighboring taxels. This spatial diffusion approximates load spreading and suppresses isolated solver contacts. Taxel positions and smoothed forces define the simulated pressure map used downstream.
Equations 5–6
| (5) |
| (6) |
Feature Extraction.
Summed taxel force estimates normal load; the fraction above an activation threshold estimates contact area; force-weighted taxel coordinates estimate center of pressure. Normalization and low-dimensional aggregation reduce dependence on exact sensor layout. These features omit shear, detailed shape, and other contact information not represented by normal pressure.
Equation 7
| (7) |
Sim2Real Alignment.
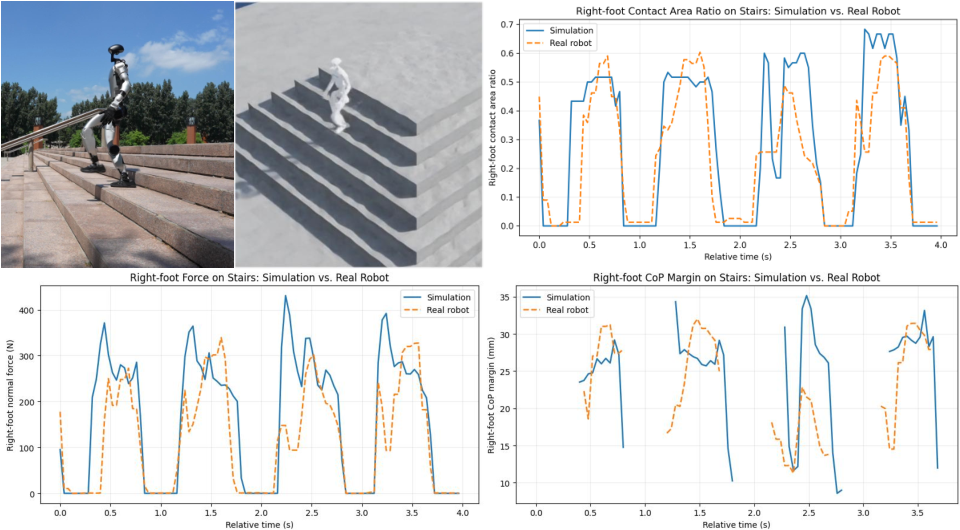
A tactile-independent baseline is run in both domains to compare force, area, and pressure-margin traces without tactile feedback changing the behavior being compared. A short stair-descent segment shows similar ranges and trends with residual differences. Hardware force calibration uses a small network and manufacturer data. This is limited feature-level alignment evidence, not broad calibrated accuracy across all terrains or impacts.
3.3 Phase-Aware Rewards for Soft Landing and Support Stability
Per-foot contact is detected when force or area exceeds a threshold. A descending foot near terrain is PreLanding before contact; a new contact starts a finite Landing window, followed by Stance, while airborne motion otherwise counts as Swing. This hand-designed estimator routes training rewards to physically relevant intervals and supplies privileged phase information to critics. The original ten-step algorithm and all inputs/outputs are retained.
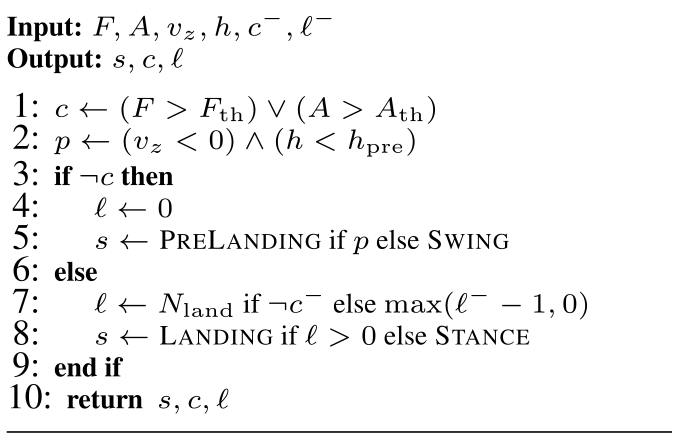
Equation 8
| (8) |
Soft-Landing Reward.
Prelanding penalties discourage fast downward motion and acceleration. Landing penalties regulate load and positive load growth, with additional peak statistics over the landing window. The detailed implementation table includes thresholds, normalization, warmup, and event terms beyond the main conceptual formulas; both are preserved rather than silently treating them as identical expressions.
Equations 9–11
| (9) |
| (10) |
| (11) |
Support-Stability Reward.
Stance shaping rewards larger contact area, greater center-of-pressure margin inside the support boundary, and smoother pressure-center motion. These terms address partial/edge contact after touchdown. They improve measured support proxies but do not constitute a formal balance or recovery guarantee.
Equation 12
| (12) |
4 Experimental Results
Evaluation asks whether pressure feedback and phase rewards improve touchdown force/noise and stance support, and which components produce the gains.
4.1 Experimental Setup
All policies train with 2,048 parallel G1 environments on an RTX 4090. Simulation uses 4,096 evaluation episodes per policy and terrain, while hardware measurements use twenty samples per condition. These large rollout counts should not be read as thousands of independent training seeds; training-seed uncertainty is not separately characterized.
Baseline and Ablations.
The external comparison is Hiking in the Wild. Ablations separately remove tactile actor observations, soft-landing rewards, or stable-support rewards. The no-tactile-observation variant can still benefit from the changed training objectives, so its improvement over Hiking does not establish that deployment feedback is unnecessary.
Metrics.
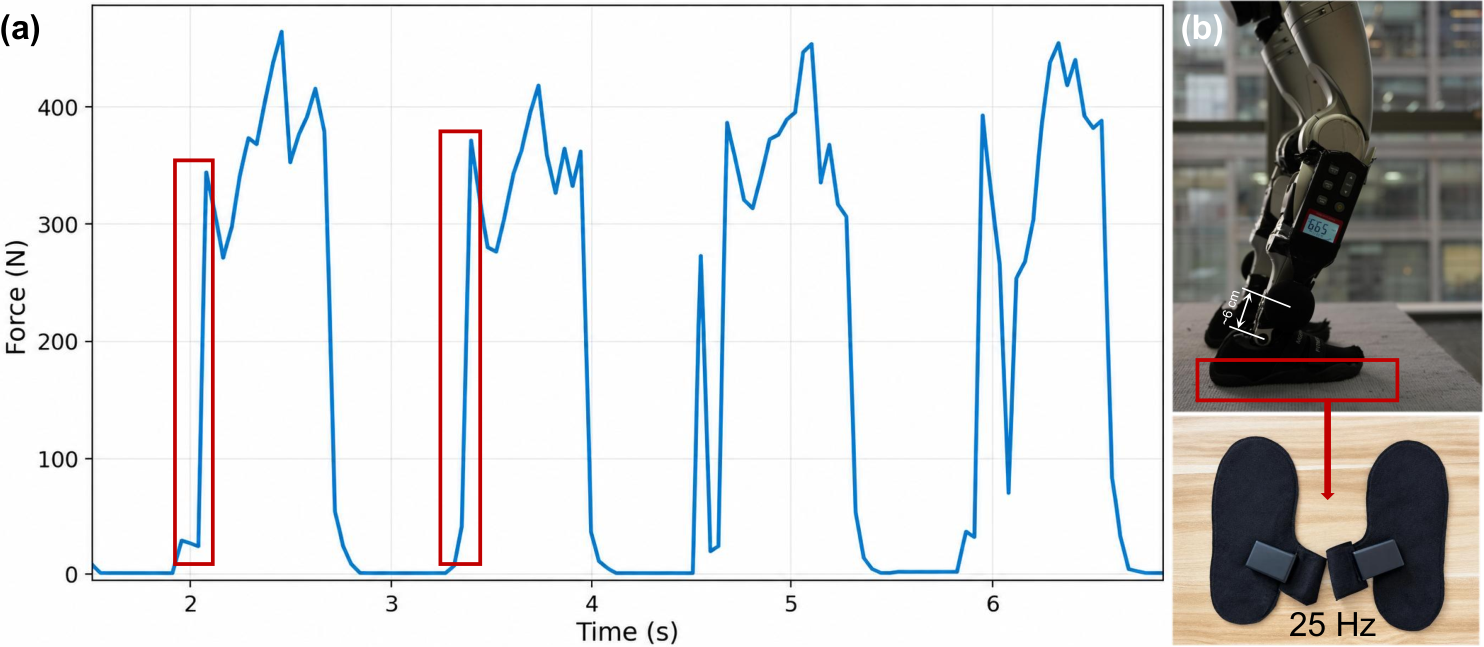
Simulation touchdown force is the maximum within the landing window; hardware uses the first force-curve rising edge after touchdown. Stance area estimates sole support. Peak A-weighted sound is measured by a meter mounted near the lower leg, with a roughly 55–60 dB floor dominated by the robot fan. These are controlled within-terrain comparisons, not room-wide acoustic exposure estimates. Decibels are logarithmic and the reported reductions are not percentages.
4.2 Simulation Results
TactileStep has the lowest simulated landing force across the tested terrain categories; removing soft-landing rewards raises impacts. Stable-support rewards improve area and pressure margin relative to their ablation. Against Hiking, area gains are small on flat/slope terrain but larger on stairs: upstairs 0.480→0.536 and downstairs 0.487→0.545.
Traversal success is at least as high, including platform descent 92.26%→100%. However, tracking error and traversal time are generally slightly worse, and energy rises on every listed terrain: stair ascent 802.2→1,126.3 J and descent 887.4→1,232.9 J. Softer contact therefore comes with a measured energy cost in this evaluation, not a general efficiency improvement.
| Metric | Flat | Slope | Upstairs | Downstairs | ||||||||
|---|---|---|---|---|---|---|---|---|---|---|---|---|
| TactileStep | w/o stable | Baseline | TactileStep | w/o stable | Baseline | TactileStep | w/o stable | Baseline | TactileStep | w/o stable | Baseline | |
| Contact Area Ratio | 0.929 | 0.805 | 0.536 | 0.545 | ||||||||
| CoP Margin [mm] | 35.79 | 34.24 | 29.05 | 29.43 | ||||||||
| Terrain | Success Rate | Velocity RMSE [m/s] | Traversal Time [s] | Energy [J] | ||||
|---|---|---|---|---|---|---|---|---|
| TactileStep | Baseline | TactileStep | Baseline | TactileStep | Baseline | TactileStep | Baseline | |
| Stair up | 100% | 99.98% | ||||||
| Stair down | 100% | 99.98% | ||||||
| Platform up | 100% | 99.93% | ||||||
| Platform down | 100% | 92.26% | ||||||
| Flat | 99.98% | 99.19% | ||||||
| Slope | 99.63% | 99.63% | ||||||
4.3 Real-World Results
Measured hardware force falls from 695.0 to 355.7 N on platform ascent (48.8%) and 608.9 to 404.6 N on descent. Stair-descent force changes more modestly, 359.3→344.1 N, while its acoustic peak drops 97.2→67.1 dB. The different magnitudes caution against treating noise reduction as a linear force measurement.
Stair-descent contact area increases 0.483→0.598, a 23.8% relative gain or 11.5 percentage points; flat area rises 0.453→0.510. Platform trials omit stance-area metrics because they emphasize a single transition. Online tactile feedback improves important force/noise/area measures beyond the no-observation ablation, although some individual gaps are small and variability overlaps. Hardware results cover twenty samples per condition, not long-term autonomous operation.
| Terrain | [N] | [dB] | |||||||
|---|---|---|---|---|---|---|---|---|---|
| Baseline | w/o tac. obs. | TactileStep | Baseline | w/o tac. obs. | TactileStep | Baseline | w/o tac. obs. | TactileStep | |
| Stair up | 349.8 | 72.2 | 0.482 | ||||||
| Stair down | 344.1 | 67.1 | 0.598 | ||||||
| Platform up | 355.7 | 83.0 | – | – | – | ||||
| Platform down | 404.6 | 75.9 | – | – | – | ||||
| Flat | 191.3 | 66.5 | 0.510 | ||||||
| Slope | 202.0 | 69.9 | 0.499 | ||||||
5 Conclusion
Deployable normal-pressure features and phase-aware training improve measured contact quality on the tested G1 terrains. The evidence supports softer touchdown and broader stance while retaining high traversal success, with energy and sensing limitations still relevant to practical use.
6 Limitations and Future Work
Commands are restricted to a narrow training range, leaving faster motions and shorter impacts untested. Phase logic is hand-designed; deformable/granular terrain fidelity, sensor wear, drift, recalibration, and systematic failure/recovery behavior are not evaluated. Reduced impact/noise may help human-centered use and hardware longevity, but those broader benefits need direct longer-term validation.
Acknowledgments
The authors acknowledge reviewer feedback and funding from KEYSTONE ELECTRICAL (ZHEJIANG) CO. The original acknowledgment is retained as provenance.
Appendix A Additional Results and Ablations
The appendix specifies matched terrain evaluation and a separate single-critic comparison.
A.1 Evaluation Protocol in Simulation
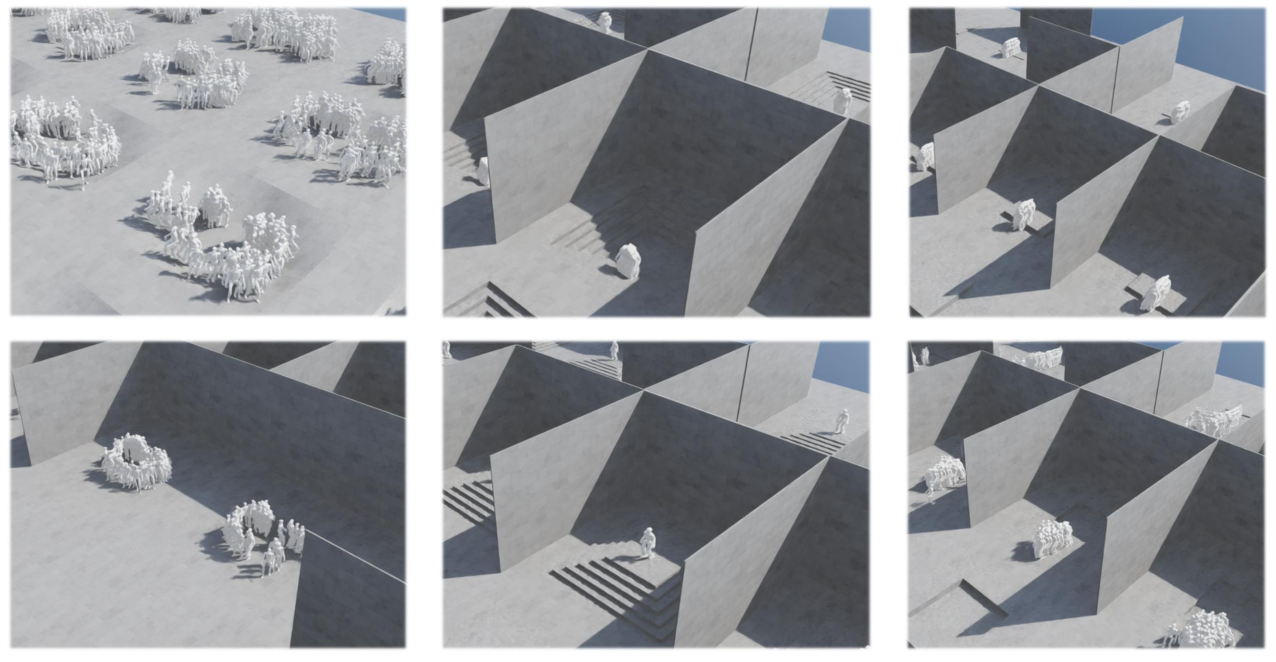
Each simulation run evaluates one terrain category using cached terrain generation and a fixed seed shared across policies. A five-by-ten terrain grid hosts 4,096 episodes, summarized by phase-specific means. Flat, slopes, stair ascent/descent, and platform ascent/descent are evaluated separately. Platform trials intentionally report landing impact rather than sustained stance area/pressure margin, so missing entries are methodological omissions rather than zero scores.
A.2 Single-Critic Ablation
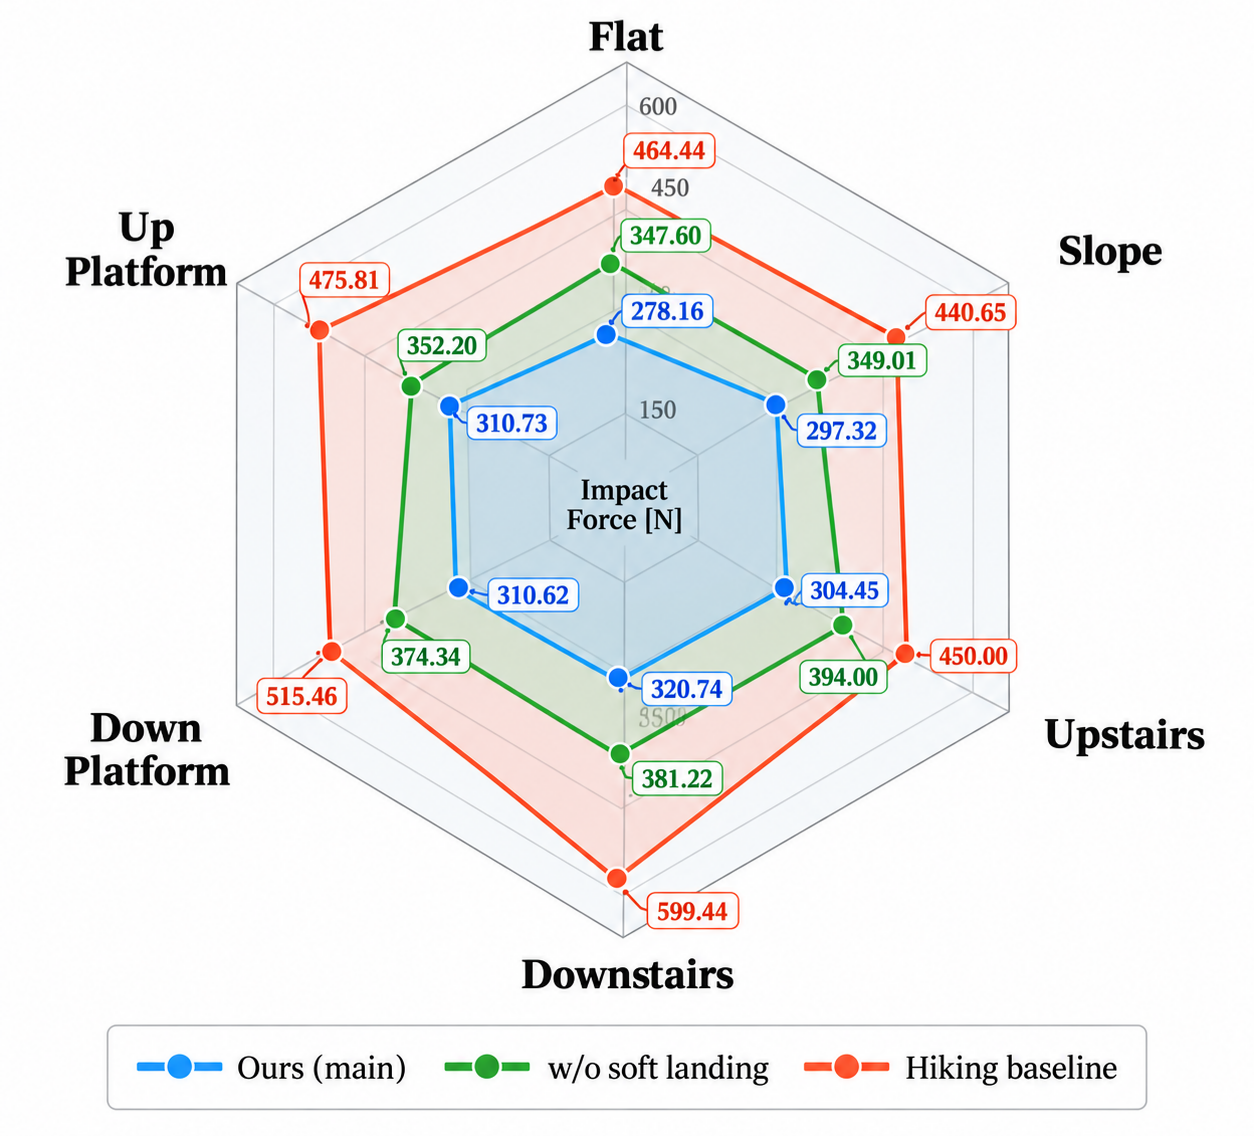
With reward terms and training budget held fixed, dual critics reduce force on all six listed terrains and improve available stance metrics. Stair-descent force is 320.74 N versus 579.83 for one critic; flat area is 0.929 versus 0.824. This supports the decomposition in the tested implementation, without isolating training-seed variability or guaranteeing the same benefit for other reward scales.
| Terrain | [N] | [mm] | ||||
|---|---|---|---|---|---|---|
| Dual critic | Single critic | Dual critic | Single critic | Dual critic | Single critic | |
| Flat | 278.16 | 307.23 | 35.79 | 34.33 | 0.929 | 0.824 |
| Slope | 297.32 | 335.90 | 34.24 | 31.40 | 0.805 | 0.635 |
| Stair descent | 320.74 | 579.83 | 29.43 | 28.08 | 0.545 | 0.516 |
| Stair ascent | 304.45 | 402.71 | 29.05 | 28.63 | 0.536 | 0.488 |
| Platform drop-down | 310.62 | 333.93 | – | – | – | – |
| Platform step-up | 310.73 | 421.35 | – | – | – | – |
Appendix B Training Details
Training details retain the complete dense/sparse reward tables, terrain schedule, optimizer/architecture settings, and all randomization ranges.
B.1 Reward Design
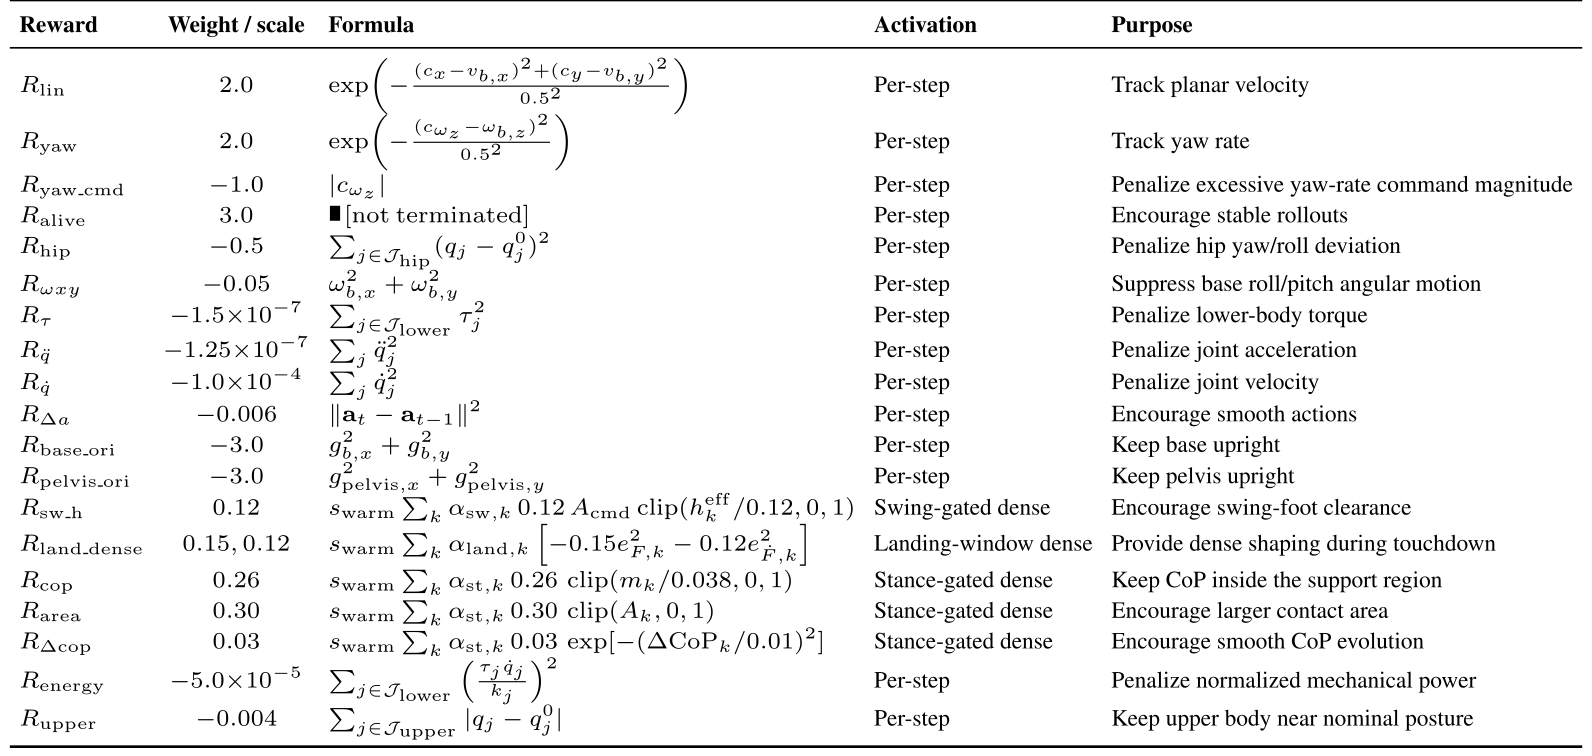
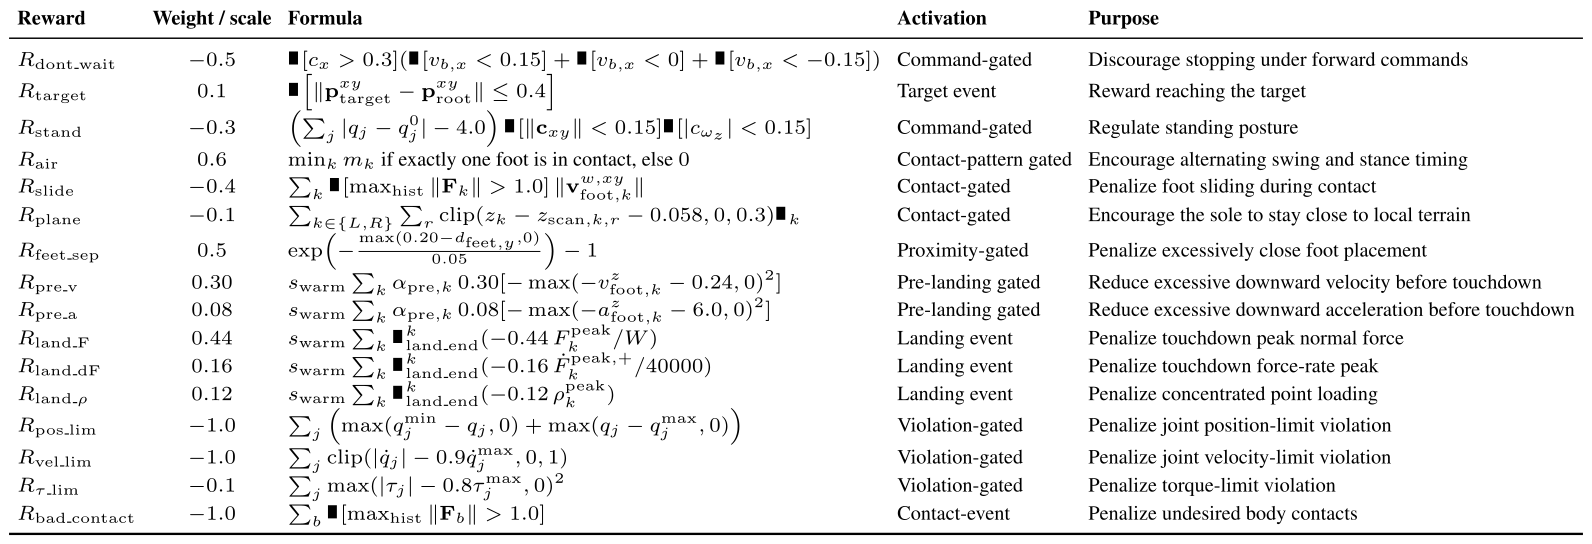
Reward implementation includes per-step dense shaping and intermittent event/gated terms. The grouping is temporal, not simply locomotion versus tactile reward semantics.
Reward list.
Environment rewards are weighted and multiplied by the 0.02-second control interval. Tactile terms warm up over five thousand iterations. Dense terms include command/posture/action regularization, landing-window shaping, area, pressure margin, and pressure-center smoothness. Sparse terms include target/command gates, sliding and body contacts, prelanding thresholds, touchdown peaks, and joint/torque constraints.
The detailed landing terms normalize force by body weight and positive force rate by 40,000, with excess thresholds in the dense penalty and separate peak events at window end. Main conceptual equations and table-specific coefficients/formulas are kept exactly as supplied. In particular, the reward tables’ weight/scale conventions should be checked against implementation before reproducing them.
Equation 13
| (13) |
Equations 14–16
| (14) |

| (16) |
AMP auxiliary reward.
The adversarial motion prior uses a discriminator-derived bounded reward with coefficient 0.25 to favor natural movement. It augments the actor objective alongside both environment-return groups rather than defining either critic’s dense/sparse partition.
Equation 17
| (17) |
B.2 Terrain Curriculum
A fixed ten-row/twenty-column terrain grid spans increasing difficulty; training changes each environment’s assigned origin rather than regenerating terrain. Velocity-tracking performance promotes or demotes environments. Rough walking/standing terrain reaches two/five centimetres of height noise, stairs span 5–23 cm, and platforms 5–40 cm. This staged training bounds the demonstrated terrain range.
Equation 18
| (18) |
| Terrain category | Task setting | Curriculum parameter | Purpose |
|---|---|---|---|
| Rough flat | Forward locomotion on uneven ground | Perlin height scale: – | Robust walking under mild contact-height perturbations |
| Rough standing | Standing on uneven ground | Perlin height scale: – | Static support stability and CoP regulation |
| Stair descent | Walking down stairs | Step height: – | Soft touchdown and impact reduction during downward transitions |
| Stair ascent | Walking up stairs | Step height: – | Swing clearance and foothold establishment during upward transitions |
| Platform drop-down | Stepping down from high platforms | Platform height: – | High-impact landing control and stance recovery |
| Platform step-up | Stepping onto high platforms | Platform height: – | Large-step clearance, foot placement, and push-off coordination |
B.3 Training Hyperparameters
Each of fifty thousand PPO iterations collects twenty-four steps from 2,048 environments, or 49,152 transitions. The four-expert actor/critic uses 256/128/64 hidden layers; dense/sparse advantage mixing weights are 1.1/0.9. PPO uses AdamW, initial learning rate 10⁻³ with adaptive KL, five epochs, four minibatches, discount 0.99, and advantage parameter 0.95. The complete depth encoder, discriminator, regularization, and optimizer settings remain in the original table.
| Category | Configuration |
|---|---|
| Environment | environments; rollout steps per environment; transitions per update; training iterations. |
| Policy | Encoder MoE actor-critic with experts; actor MLP ; critic MLP ; ELU activation; initial action std. . |
| Depth encoder | CNN output dimension ; channels ; kernel/stride/padding ; MLP hidden dimensions . |
| PPO | AdamW optimizer; learning rate with adaptive KL schedule; desired KL ; mini-batches; mini-batch size ; epochs per update; clip range ; ; ; entropy coefficient ; value loss coefficient ; max gradient norm . |
| Dual critic | Two value heads estimate dense and sparse environment returns, respectively; advantage mixing weights . |
| AMP | Discriminator MLP with ReLU; AdamW optimizer with learning rate ; discriminator reward coefficient ; gradient penalty coefficient ; weight decay ; logit decay . |
B.4 Domain Randomization
Randomization covers friction/restitution, mass and center-of-mass offsets, gains and actuator delay, resets, pushes, sensing, depth artifacts, tactile measurements, and commands. Only actor observations are corrupted; critics retain clean privileged inputs. Forward commands are limited to 0.45–0.55 m/s, lateral command is zero, yaw is within ±1 rad/s, and five percent of environments stand. Table 9 lists tactile-delay probability 0.10, whereas Table 10 lists 0.08; this source inconsistency is retained rather than resolved without code evidence.
| Category | Randomized quantity | Range / distribution |
| Contact material | Static friction | |
| Dynamic friction | , with | |
| Restitution | ||
| Robot model | Default joint-position offset | |
| Torso CoM offset, | ||
| Torso CoM offset, | ||
| Torso mass offset | ||
| Actuation | PD stiffness scale | |
| PD damping scale | ||
| Actuator delay | control steps | |
| Reset state | Root position, | |
| Root yaw | ||
| Root linear velocity | ||
| Root angular velocity | ||
| Joint position | ||
| External disturbance | Push interval | |
| Root velocity impulse, | ||
| Root angular-velocity impulse, roll/pitch/yaw | , , | |
| Actor observation | Base angular velocity noise | |
| Projected gravity noise | ||
| Joint position noise | ||
| Joint velocity noise | ||
| Camera | Position offset | , , |
| Orientation offset | roll: , pitch/yaw: | |
| Depth | Range-based Gaussian noise | for depths in |
| Artifact probability | ||
| Gaussian blur | kernel size , | |
| Random image noise | probability , | |
| Tactile | Relative taxel force error | |
| Taxel XY offset | ||
| Measurement delay | probability , maximum delay frame | |
| Command | Forward velocity | |
| Lateral velocity | ||
| Yaw rate | ||
| Standing environments |
Appendix C Tactile Sensing and Feature Processing
The tactile appendix specifies noise before feature extraction, actor normalization, and the measurement sampling-rate check.
C.1 Tactile Noise Modeling in Simulation
Each taxel force receives ±10% scaling and nonnegative clipping. Coordinates receive episode-fixed Gaussian mounting/calibration perturbations with 1.5 mm standard deviation, clipped to ±5 mm. Delay is applied per foot to the complete taxel vector for at most one update. Forces are not renormalized to the clean sum, allowing all derived features to change. Dropout and quantization are disabled; the two tables disagree on the delay probability.
| Noise source | Value | Description |
|---|---|---|
| Relative taxel force error | Per-taxel scaling | |
| Taxel XY offset std. | Episode-level taxel-coordinate perturbation | |
| Taxel XY offset clip | Maximum coordinate perturbation | |
| Delay probability | Probability of using delayed tactile history | |
| Maximum delay | frame | At most one tactile update delay |
| Force clipping | Clamp measured taxel force to be nonnegative | |
| Dropout / quantization | Disabled | Not used in the current configuration |
C.2 Feature Normalization
The four actor features per foot are area clipped to [0,1], summed noisy force divided by body weight and clipped to [0,1.5], and two pressure-center coordinates normalized by the foot outline and clipped to [−1,1]. When normalized force is below 0.05, pressure center is set to zero. Two feet over two frames contribute sixteen dimensions. Vertical foot velocity remains a privileged training signal, not a deployed tactile input.
Equations 19–20
| (19) |
| (20) |
C.3 Insole Sampling Rate and Peak-Force Validation
Wireless insoles sample at 25 Hz; the claimed submillisecond processing/communication delay begins after acquisition and excludes the forty-millisecond sample interval. Wired acquisition supports 100 Hz. Repeated TactileStep tests measure flat/drop-down forces of 199.2/427.7 N at 100 Hz versus 191.3/404.6 at 25 Hz. This supports similar magnitudes for these two cases but also shows higher-rate peaks can be larger; it does not establish exact instantaneous force or verify every policy/terrain at 100 Hz. All main comparisons use the same wireless pipeline.