Literature
Display
← All papers

HypoEvolve: Genetic Algorithms Enable Multi-Agent LLMs to Discover Scientific Hypotheses

Jieyuan Liu · Mengzhou Hu · Jefferson Chen · JungHo Kong · Pratibha Jagannatha · Yiming Gao · Dexter Pratt · Hsin-Yuan Lee · Zhiting Hu · Trey Ideker · Wei Wang · Eric P. Xing · Zhen Wang

6 min · CondensedOriginal paper ↗
Contents

At a glance

HypoEvolve evolves populations of scientific hypotheses through language-model generation, comparison, crossover, and mutation. Across a drug-repurposing study spanning 34 cancers, it obtains the highest mean scores among six baselines on two external biological measures. These are evidence-support metrics, not experimental demonstrations of therapeutic efficacy.

1 Introduction

The research question is whether collaboration rules improve hypothesis quality beyond individual agent capabilities. HypoEvolve makes selection and population replacement explicit while holding scientific roles and prompts fixed. Each candidate retains its mechanistic explanation and lineage; independent biological evidence assesses the selected output after search.

Related references: [42], [49], [13], [2], [11], [12], [10], [31], [28], [41], [48], [16], [17], [8], [44], [1], [30], [53], [39], [40], [25], [29], [50].
Original figure
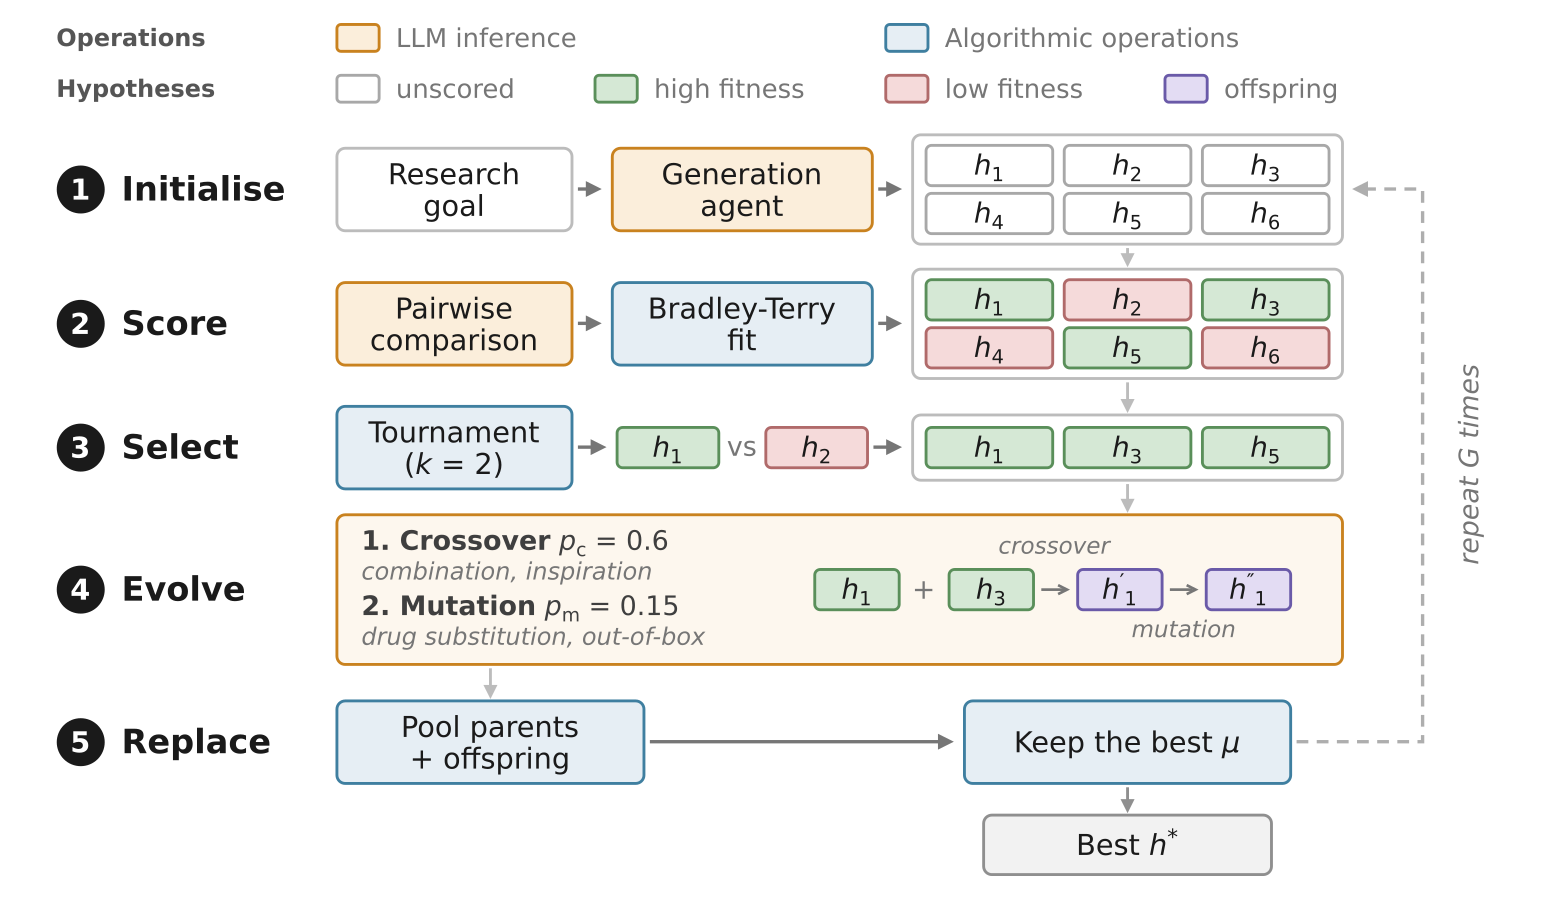
Figure 1: Overview of HypoEvolve. The genetic algorithm connects agents’ scientific judgments to the hypotheses developed in the next generation, coordinating evaluation, semantic variation, and population replacement. Orange and blue nodes denote LLM calls and algorithmic operations.

2 Related Work

Scientific-agent systems generate and critique proposals; evolutionary systems search populations of artifacts. HypoEvolve combines these approaches through a fixed-size generational search. Unlike an expanding tournament pool, it compares parents and offspring jointly, keeps the top population, and records each transformation.

Related references: [36], [35], [37], [55], [42], [2], [33], [24], [47], [32], [11], [45], [19], [49], [46], [12], [13], [38], [14], [9], [22], [31], [4], [26], [52], [6], [41].

3 Method

A candidate contains a title, summary, hypothesis, and rationale. Starting from retrieved literature, agents create a population, generate offspring, score the combined pool, and retain the strongest candidates. The answer is the highest-fitness final hypothesis. External DepMap and Open Targets scores never enter search fitness.

Related references: [18], [8].

Equations 1–2
h=argmaxhPGfG(h).h^{*}=\arg\max_{h\in P_{G}}f_{G}(h). (1)
Qt=Pt1Ot,ft=Score(Qt),Pt=Topμ(Qt;ft).Q_{t}=P_{t-1}\uplus O_{t},\qquad f_{t}=\operatorname{Score}(Q_{t}),\qquad P_{t}=\operatorname{Top}_{\mu}(Q_{t};f_{t}). (2)

3.1 LLM Agents as Semantic Search Operators

The generation agent proposes diverse mechanisms. A comparison agent judges specificity, supporting evidence, and falsifiability, allowing ties. Crossover either combines two explanations or draws inspiration from them. Mutation substitutes a drug or revisits assumptions. Both operate on scientific claims and reasoning rather than textual fragments.

Related references: [54], [23], [51], [26].

3.2 Generational Search with Comparative Fitness

All unordered pairs are compared and fit with a Bradley–Terry model. Anchored scores support within-run trajectories, while selection uses within-pool ranking. Size-two tournaments choose parents. Crossover runs with probability 0.6; mutation runs with probability 0.15 after crossover and always otherwise. The best six of the parent–offspring pool survive. Empty operator outputs create recorded parent copies.

Related references: [5], [27], [3].

Equation 3
P(hihj)=πt,hiπt,hi+πt,hj,ft(h)=alogπt,h+bt,a>0.P(h_{i}\succ h_{j})=\frac{\pi_{t,h_{i}}}{\pi_{t,h_{i}}+\pi_{t,h_{j}}},\qquad f_{t}(h)=a\log\pi_{t,h}+b_{t},\quad a>0. (3)

4 Experiments

The evaluation tests final biological support, search dynamics, and the effect of specific coordination choices.
Original figure
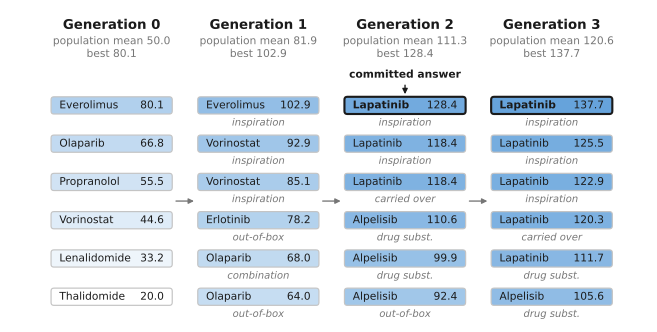
Figure 2: A hypothesis population across generations. A lapatinib hypothesis introduced by inspiration leads the population in generations 2 and 3, illustrating how new proposals redirect the search. Columns show six retained hypotheses in a uterine corpus endometrial carcinoma run; numbers are fitness scores and labels identify generating operators or unchanged carryovers.

4.1 Experimental Setup

Agents use gpt-5.4-mini, shared literature retrieval, and a vocabulary of 61 drugs. Each run keeps six candidates, generates six offspring per generation, and runs three generations. There are 94 HypoEvolve runs over 34 cancers. Paired baseline comparisons cover 26 cancers for DepMap and 29 for Open Targets. Seven development or inspected cancers are excluded from the held-out set. DepMap measures cancer-specific target dependency relative to a pan-cancer median; Open Targets measures target–disease association.

Related references: [1], [30], [39], [40], [25], [29], [43], [34], [7], [13], [50].

4.2 Main Results

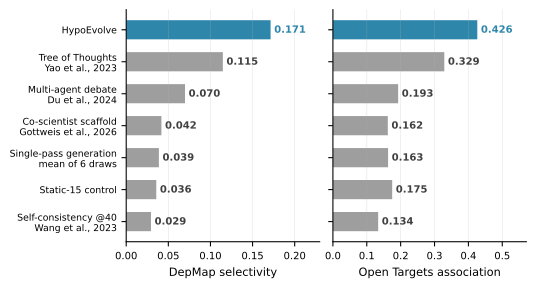
Mean DepMap selectivity is 0.171 versus 0.115 for Tree of Thoughts and 0.039 for single-pass generation. Open Targets scores are 0.426, 0.329, and 0.163, respectively. The Open Targets advantage over Tree of Thoughts is statistically unresolved. Against single-pass generation, held-out margins are +0.111 on 24 DepMap-covered cancers and +0.280 on 27 Open Targets cancers. Prior model exposure to biomedical evidence may contribute.
Original figure
Figure 3: Comparison with six hypothesis-discovery baselines. HypoEvolve achieves the highest mean on both biological metrics, with Tree of Thoughts the strongest baseline. Means cover 26 cancer types for DepMap selectivity and 29 for Open Targets. Each run contributes one hypothesis selected by the method before external scoring.

4.3 Hypothesis Evolution

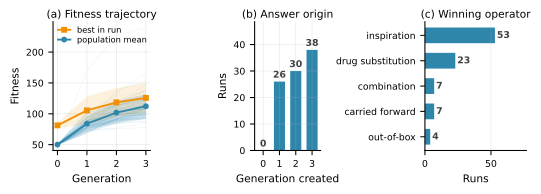
Crossover or mutation produces 87 of 94 final hypotheses; seven are unchanged fallback copies. Search sometimes changes the proposed drug and sometimes sharpens an existing mechanism or patient-selection rationale. Agent fitness improves in every run, but that internal score alone does not verify biological correctness.

Table 1: Drug-cancer matching across generations. Mean residuals compare a proposed drug’s score in the matched cancer with its average across other cancer types. Both metrics increase from the initial to the final generation, indicating better drug-cancer matching after accounting for drugs that score highly across many cancers.
Generation DepMap selectivity (n=31n=31) Open Targets (n=34n=34)
0 +0.0034+0.0034 +0.0133+0.0133
1 +0.0413+0.0413 +0.0542+0.0542
2 +0.0497+0.0497 +0.0719+0.0719
3 +0.0612+0.0612 +0.0658+0.0658
Original figure
Figure 4: Fitness trajectories and origins of final hypotheses. Most final hypotheses are produced during search (87 of 94 through crossover or mutation), and fitness increases in every run. Panels show (a) mean and best fitness with shading for one standard deviation, (b) the generation of each final record, and (c) its generating operator; carried forward denotes seven unchanged parent copies.

4.4 Ablations and Computational Cost

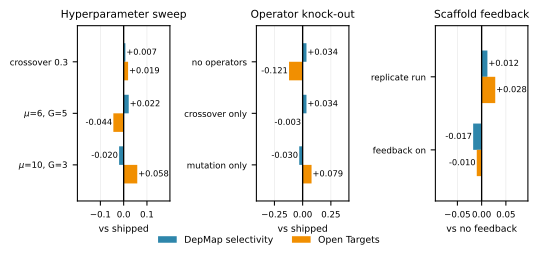
With scientific operators and hypothesis count fixed, fitness-guided parent selection improves mean and minimum external population scores; maxima show no detectable change. Population-size, horizon, and operator ablations cover only eight cancers, and none survives the stated multiple-testing correction. HypoEvolve averages 206 model calls, including 167 comparisons, versus 31 for Tree of Thoughts. Token budgets are not matched.
Original figure
Figure 5: Search settings, variation operators, and scaffold feedback. Configuration changes (left) and operator removal (center) produce mixed shifts across the two metrics on eight cancer types; no comparison survives multiple-testing correction. For the co-scientist scaffold, feedback changes scores by amounts comparable to repeating the run (right). These scaffold comparisons cover 31 cancer types on DepMap and 34 on Open Targets.
Table 2: Computational cost of hypothesis discovery. HypoEvolve uses fewer model calls than static reranking and the co-scientist scaffold, with pairwise scoring accounting for 167 of 206 calls. Model calls/run and Cost/run exclude retrieval; costs use run logs for HypoEvolve and single-pass generation and estimates from model-call counts for other methods.
Method Candidates/run Model calls/run Cost/run
Co-scientist scaffold 15.0 288 $0.71
Static reranking (15 candidates) 15.0 227 $0.55
HypoEvolve 24.0 206 $0.56
Self-consistency (40 samples) 39.1 42 $0.21
Tree of Thoughts 9.0 31 $0.09
Multi-agent debate N/A 17 $0.08
Single-pass generation 1.0 1 $0.004

5 Conclusion

Explicit coordination can improve the biological support of generated hypotheses. The strongest controlled evidence concerns fitness-guided parent selection. The results motivate studying team organization alongside model capability, while prospective experiments remain necessary to establish mechanisms and treatment benefit.

Appendix A Discussion

The framework is reusable, but the evidence is specific to this biological hypothesis task.

A.1 Implications and Scope

Population updates can coordinate other scientific representations and evaluation criteria. Transfer to different domains, model families, and experimental workflows has not been established by this study.

Related references: [10], [45], [19].

A.2 Limitations and Future Directions

Pairwise judging dominates cost and grows quadratically with pool size. Model judgments can favor persuasive but unsupported explanations. Sparse comparisons, expert feedback, broader replicated operator studies, and diversity-aware replacement are proposed extensions.

Related references: [23], [51], [20], [21], [4].

A.3 Impact Statement

Lineage records help researchers inspect how claims develop. Unsupported assumptions can nevertheless propagate through generations; expert review and independent experiments are needed before therapeutic use.

Appendix B Algorithm

Algorithm 1 specifies initialization, pairwise scoring, tournament selection, semantic variation, joint replacement, and lineage recording. It also makes the unchanged-parent fallback explicit.

Algorithm 1 HypoEvolve
0:  Research goal gg; population size μ\mu; offspring count λ\lambda; horizon GG
0:  Crossover rate pcp_{c}; mutation rate pmp_{m}
0:  Highest-fitness hypothesis hh^{*} from the final population
1:P0Generate(g,μ)P_{0}\leftarrow\textsc{Generate}(g,\mu)
2:f0Score(P0)f_{0}\leftarrow\textsc{Score}(P_{0}) {Initialize the fitness scale}
3:for t=1t=1 to GG do
4:   OtO_{t}\leftarrow\emptyset
5:   while |Ot|<λ|O_{t}|<\lambda do
6:    p1Tournament(Pt1,ft1,2)p_{1}\leftarrow\textsc{Tournament}(P_{t-1},f_{t-1},2)
7:    hnewp1h_{\mathrm{new}}\leftarrow p_{1}; cfalsec\leftarrow\textsc{false}
8:    if rand()<pc\operatorname{rand}()<p_{c} then
9:     repeat
10:      p2Tournament(Pt1,ft1,2)p_{2}\leftarrow\textsc{Tournament}(P_{t-1},f_{t-1},2)
11:     until p2p1p_{2}\neq p_{1}
12:     hnewCrossover(p1,p2)h_{\mathrm{new}}\leftarrow\textsc{Crossover}(p_{1},p_{2}); ctruec\leftarrow\textsc{true}
13:    end if
14:    if c=falsec=\textsc{false} or rand()<pm\operatorname{rand}()<p_{m} then
15:     hnewMutation(hnew)h_{\mathrm{new}}\leftarrow\textsc{Mutation}(h_{\mathrm{new}})
16:    end if
17:    OtOt{hnew}O_{t}\leftarrow O_{t}\uplus\{h_{\mathrm{new}}\} {Record offspring identity, parents, and operators}
18:   end while
19:   QtPt1OtQ_{t}\leftarrow P_{t-1}\uplus O_{t}
20:   ftScore(Qt)f_{t}\leftarrow\textsc{Score}(Q_{t}) {Compare parents and offspring together}
21:   PtTopμ(Qt;ft)P_{t}\leftarrow\operatorname{Top}_{\mu}(Q_{t};f_{t})
22:end for
23:return argmaxhPGfG(h)\arg\max_{h\in P_{G}}f_{G}(h)

Appendix C Additional Results

The appendix provides paired statistics, sensitivity tests, per-cancer results, and qualitative mechanisms.

C.1 Statistical Details for Main Results

Tables 3–5 give comparison margins, wins/losses, paired tests, and search settings. The Open Targets comparison with Tree of Thoughts remains unresolved. Configuration tests use one seed for each of eight cancers, limiting power to distinguish operator or budget effects.

Table 3: Statistical details for main and held-out comparisons. DepMap comparisons favor HypoEvolve; the Open Targets difference from Tree of Thoughts remains statistically unresolved. Margin reports mean score differences in favor of HypoEvolve, W/L counts cancer-type wins and losses excluding ties, and pp denotes paired Wilcoxon tests.
DepMap selectivity (n=26n=26) Open Targets (n=29n=29)
Baseline Margin W/L pp Margin W/L pp
Single-pass +0.1325+0.1325 19/7 3.2×1043.2\times 10^{-4} +0.2633+0.2633 26/3 1.1×1061.1\times 10^{-6}
Self-consistency +0.1420+0.1420 18/7 0.00270.0027 +0.2926+0.2926 23/5 4.6×1054.6\times 10^{-5}
Static reranking +0.1356+0.1356 17/8 0.00300.0030 +0.2513+0.2513 23/4 9.9×1059.9\times 10^{-5}
Multi-agent debate +0.1015+0.1015 16/8 0.00560.0056 +0.2337+0.2337 24/3 8.1×1058.1\times 10^{-5}
Tree of Thoughts +0.0567+0.0567 15/7 0.01130.0113 +0.0974+0.0974 14/10 0.1260.126
Held-out DepMap (n=24n=24) Held-out Open Targets (n=27n=27)
Single-pass +0.1114+0.1114 18/6 2.8×1042.8\times 10^{-4} +0.2798+0.2798 25/2 8.2×1078.2\times 10^{-7}
Table 4: Fitness-guided versus uniform parent selection. Fitness-guided selection raises mean and minimum population scores on both external measures; population maxima show no statistically detectable change. Positive Margin values favor fitness-guided selection with all other search components and hypothesis count fixed; Final hypothesis reports the answer selected by the method.
DepMap selectivity (n=31n=31) Open Targets (n=34n=34)
Statistic Margin pp Margin pp
Population minimum +0.0879+0.0879 6.6×1046.6\times 10^{-4} +0.2181+0.2181 1.2×1061.2\times 10^{-6}
Population mean +0.0753+0.0753 8.3×1048.3\times 10^{-4} +0.1283+0.1283 1.0×1061.0\times 10^{-6}
Population maximum +0.0154+0.0154 0.9870.987 +0.0017+0.0017 0.9270.927
Final hypothesis +0.0904+0.0904 0.0640.064 +0.1555+0.1555 0.00170.0017
Table 5: Search configuration sensitivity on eight cancer types. No setting differs significantly from the default on either metric. Unspecified parameters retain μ=6\mu=6, G=3G=3, pc=0.6p_{c}=0.6, and pm=0.15p_{m}=0.15; pp values compare each setting with the default.
DepMap selectivity Open Targets
Configuration Mean pp Mean pp
Default 0.09390.0939 N/A 0.44950.4495 N/A
Population μ=10\mu=10 0.07430.0743 0.1440.144 0.50790.5079 0.0680.068
Horizon G=5G=5 0.11570.1157 0.7150.715 0.40520.4052 0.2730.273
pc=0.3p_{c}=0.3, pm=0.4p_{m}=0.4 0.10130.1013 0.5930.593 0.46850.4685 0.2850.285

C.2 Fitness Improves Across All Cancer Types

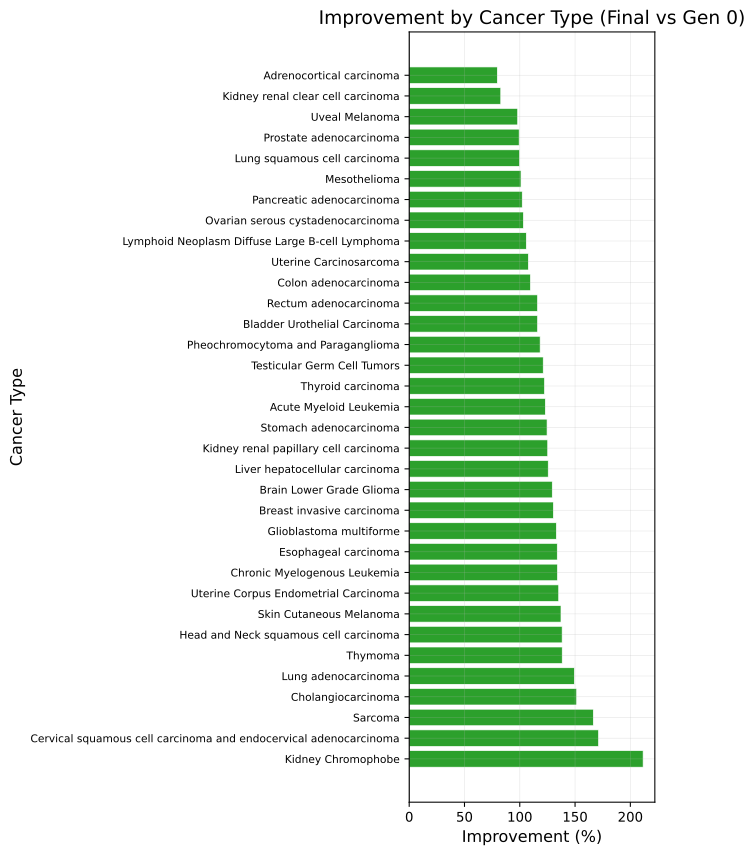
Mean and best internal fitness increase in all 94 runs, averaging 124.2% and 54.9% from their anchored initial scales. These trajectories measure agreement with the agents’ criteria rather than independent discovery success.
Original figure
Figure 6: Fitness improvement by cancer type. Mean fitness increases in all 34 cancer types, showing consistent progress under the agents’ comparative assessments. Bars show percentage changes from generation 0 to generation 3 relative to the common initial fitness scale.

C.3 DepMap Selectivity Improves in Most Cancer Types

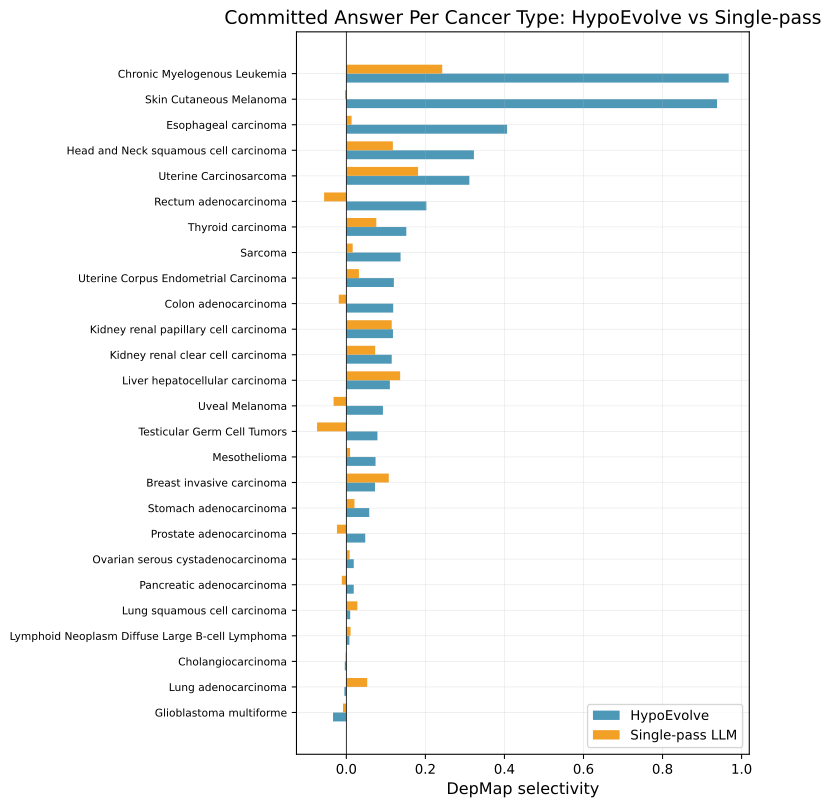
On the shared 26-cancer DepMap panel, HypoEvolve exceeds single-pass generation in nineteen cancers and trails in seven. Figure 7 shows the variation hidden by the aggregate mean.
Original figure
Figure 7: DepMap selectivity by cancer type. HypoEvolve exceeds single-pass generation in 19 of 26 cancer types, showing that the aggregate advantage extends to most evaluated contexts. Bars compare per-cancer scores for HypoEvolve (blue) and single-pass generation (orange). Positive selectivity indicates greater target dependency in the matched cancer than in the pan-cancer reference.

C.4 Evolution Improves Drug-Cancer Matching

Subtracting each drug’s mean score across other cancers tests context specificity. Residuals improve from generation zero to three in 21/31 DepMap and 25/34 Open Targets cancers. However, residual advantages over four multi-candidate baselines do not survive correction. A drug fixed using development cancers actually exceeds HypoEvolve on held-out Open Targets (0.4827 versus 0.4290), illustrating a metric limitation.

Equation 4
rs(d,c)=s(d,c)1|𝒞s|1c𝒞sccs(d,c).r_{s}(d,c)=s(d,c)-\frac{1}{|\mathcal{C}_{s}|-1}\sum_{\begin{subarray}{c}c^{\prime}\in\mathcal{C}_{s}\\ c^{\prime}\neq c\end{subarray}}s(d,c^{\prime}). (4)

C.5 Comparison and Scoring Details

Every method commits to one answer before external scoring. A Tree of Thoughts variant without retrieval remains competitive; its Open Targets gap is unresolved. An oracle choosing the externally best of six single-pass candidates also leaves the DepMap gap unresolved. Some cancer labels map to identical cell-line sets, so nominal cancer counts do not imply independent biological contexts.

C.6 Qualitative Examples of Hypothesis Development

Examples illustrate combining complementary mechanisms and changing assumptions. The cited osteosarcoma experiments support one proposed mechanism in that context; extending it to other sarcoma subtypes is a hypothesis requiring direct tests.

Related references: [15].

(a) vorinostat in uveal melanoma Parent 1: Epigenetic reprogramming HDAC inhibition may promote differentiation in BAP1-deficient tumors. Parent 2: Survival signaling HDAC inhibition may disrupt YAP-driven survival programs sustained by GNAQ/GNA11 signaling. \downarrow Combination crossover Final hypothesis (excerpt). Vorinostat will be particularly effective in uveal melanoma cells that are BAP1-deficient because HDAC inhibition can reverse pathogenic chromatin states that support tumor growth while also dampening YAP-driven survival and adaptive resistance pathways. Testable prediction (excerpt). It predicts that vorinostat should preferentially suppress viability, clonogenic growth, and YAP target gene expression in BAP1-deficient uveal melanoma compared with BAP1-intact cells, and that restoring BAP1 or blocking YAP should reduce the incremental benefit of vorinostat.
(b) everolimus in bladder urothelial carcinoma Parent 1: Pathway dependence Everolimus may suppress mTORC1-dependent growth in tumors with altered pathway signaling. Parent 2: Molecular subgroup Tumors with FGFR3 activation or TSC1 loss may be particularly sensitive to mTORC1 inhibition. \downarrow Combination crossover Final hypothesis (excerpt). Bladder urothelial carcinoma contains a therapeutically relevant subgroup characterized by FGFR3 pathway activation and/or TSC1 inactivation that creates heightened reliance on mTORC1 signaling for growth and survival. In this setting, everolimus will preferentially suppress tumor proliferation and downstream anabolic signaling, with the strongest responses occurring in tumors harboring these alterations and the weakest responses in mTOR-independent disease. Testable prediction (excerpt). In tumor models and patient-derived samples, FGFR3/TSC1-altered cases should show elevated phospho-S6 and phospho-4EBP1, and these readouts should be suppressed by everolimus alongside reduced proliferation and increased growth arrest.
(c) sulfasalazine in sarcoma Parent hypothesis (summary). The parent proposes inhibiting mTORC1 with sirolimus in sarcomas with activated growth signaling, predicting reduced protein synthesis and proliferation. \downarrow Out-of-box mutation Final hypothesis (verbatim). I hypothesize that a biologically defined subset of sarcomas is “redox addicted” rather than growth-factor addicted, relying on the cystine transporter system xCT (SLC7A11/SLC3A2) to prevent lethal lipid peroxidation under oxidative and metabolic stress. In these tumors, repurposing SULFASALAZINE will inhibit cystine uptake, collapse glutathione defenses, and selectively induce ferroptosis, with the strongest responses in sarcomas showing high SLC7A11 expression, mesenchymal plasticity, or resistance to conventional therapy. Testable prediction (excerpt). This hypothesis is testable and feasible in sarcoma cell lines, patient-derived organoids, or ex vivo tumor slices by measuring viability, lipid peroxidation, glutathione depletion, and rescue with ferroptosis inhibitors such as ferrostatin-1 or liproxstatin-1.
Figure 8: Qualitative examples of hypothesis development. Crossover connects epigenetic and survival-signaling arguments in (a) and links pathway dependence to molecular conditions for drug response in (b). Mutation shifts the proposed vulnerability from growth signaling to antioxidant defense in (c), with a mechanistic rescue test. Parent arguments are summarized; final hypotheses and testable predictions are reproduced as verbatim excerpts.

Appendix D Prompt Templates

The original prompt templates are retained below.

D.1 Generation Agent Prompt

The generation prompt supplies the research goal, retrieved context, and structured response format.

Generation Prompt You are an expert tasked with formulating a novel and robust hypothesis to address the following objective. You have conducted a thorough review of relevant literature and developed a logical framework for addressing the objective. Goal: {goal} Criteria for a strong hypothesis: {preferences} Literature review and analytical rationale: {articles_with_reasoning} Required Output Format: TITLE: [A concise, descriptive title] SUMMARY: [Single-sentence summary] HYPOTHESIS: [Clear statement in 2-3 sentences] RATIONALE: [Detailed explanation including key mechanisms, evidence from literature, and testability] FINAL DRUG: [Drug name] CANCER TYPE: [TCGA cancer type]

D.2 Pairwise Comparison Prompt

The comparison prompt judges two hypotheses for the same cancer and permits a tie. These judgments determine search fitness.

Pairwise Comparison Prompt Compare two drug repurposing hypotheses for the SAME cancer type and pick the stronger one. A stronger hypothesis is one whose proposed drug acts on a dependency that is SPECIFIC to this cancer type, a lineage-defining oncogene, a mutated or amplified driver, or a pathway this tumour type is selectively addicted to. Judge on: 1. Specificity. Would this drug plausibly work better in THIS cancer than in an arbitrary other cancer? A mechanism that applies equally to every tumour type is WEAKER, not stronger, because it does not explain why this cancer was chosen. 2. Target evidence. Is the named target actually implicated in this cancer type? 3. Testability. Does the hypothesis make a concrete, falsifiable prediction? Explicitly DO NOT reward: generic cytotoxicity, broadly pleiotropic agents, or mechanisms that reduce to “this pathway matters in cancer generally”. Respond in exactly this format: REASONING: <one to three sentences explaining your choice> CONFIDENCE: <HIGH | MEDIUM | LOW> WINNER=<A | B | TIE>

D.3 Evolution Agent Prompts

The prompts specify combination crossover and an alternative-mechanism mutation operator.

Combination Crossover Prompt You are synthesizing a unified hypothesis from multiple parent hypotheses. Goal: {goal} Parent hypotheses: {hypotheses} Review feedback: {reviews} Instructions: Integrate the strongest aspects from each parent into a coherent unified hypothesis. Preserve beneficial mechanisms while addressing identified weaknesses. The offspring should be superior to any individual parent. Out-of-Box Mutation Prompt You are generating a novel hypothesis inspired by but distinct from provided concepts. Goal: {goal} Inspiration (use analogy, not replication): {hypotheses} Instructions: 1. Identify promising avenues for exploration 2. Develop a detailed, original hypothesis leveraging analogous principles 3. This should not be a mere aggregation of existing methods; think out-of-the-box

D.4 Drug Constraint

The shared drug vocabulary restricts proposals to 61 approved compounds with annotated targets covered by the external data. Inclusion in this list does not establish efficacy for a proposed cancer.

Drug Constraint You MUST select your drug repurposing candidate ONLY from this approved list: simvastatin, atorvastatin, metformin, hydroxychloroquine, propranolol, sertraline, omeprazole, aspirin, celecoxib, doxycycline, disulfiram, thalidomide, sirolimus, everolimus, imatinib, dasatinib, sorafenib, erlotinib, vemurafenib, olaparib, venetoclax, ibrutinib, palbociclib, ruxolitinib, … [61 drugs total] These drugs have been verified to have: (1) FDA approval, (2) known target genes in Open Targets Platform, (3) target genes present in DepMap CRISPR data.