Overview
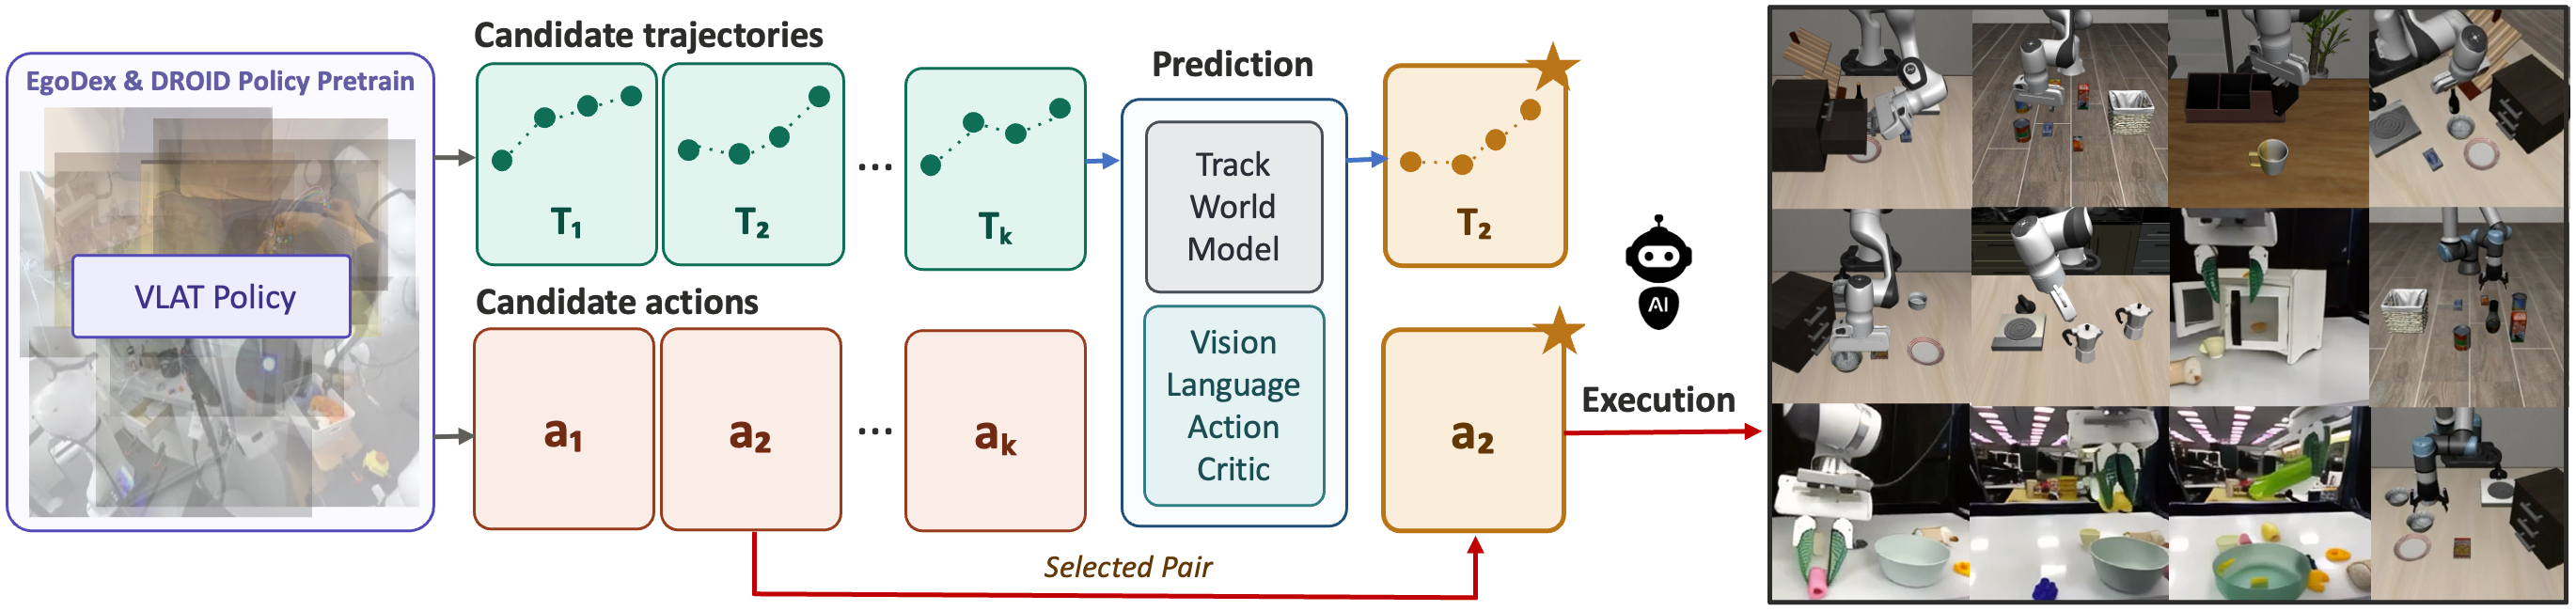
TrAct links candidate robot actions to imagined visual outcomes through jointly predicted point tracks.
At a glance
TrAct generates paired action chunks and image-space tracks, predicts videos conditioned on those tracks, and uses a learned visual-language critic to select an action. On the proposed shifted-task simulation benchmark, success rises from 27% for the π0.5 baseline to 55%; the action-conditioned world-model variant reaches 49%. Physical task/background trials reach 76% versus 49% and 66% respectively. The method adds substantial pretraining and inference work, with a reported 2.431 seconds of computation per sixteen-step action chunk.
1 Introduction
Robot commands do not directly specify how pixels move: their visual consequences depend on embodiment, geometry, and contact. TrAct predicts image-space motion as an intermediate representation to make future-video generation easier, then executes the robot action paired with the selected track. Tracks are a shared visual interface, but they do not themselves guarantee that the paired action will realize the imagined future.
2 Related Work
Related work uses video models for prediction, tracks or flow for transferable motion representations, and visual-language critics for action selection. TrAct combines these components in a propose–predict–score loop. Its contribution is the action–track coupling and track-conditioned visual prediction within that loop, rather than a new physical simulator or a verified action-to-video correspondence.
3 Methods
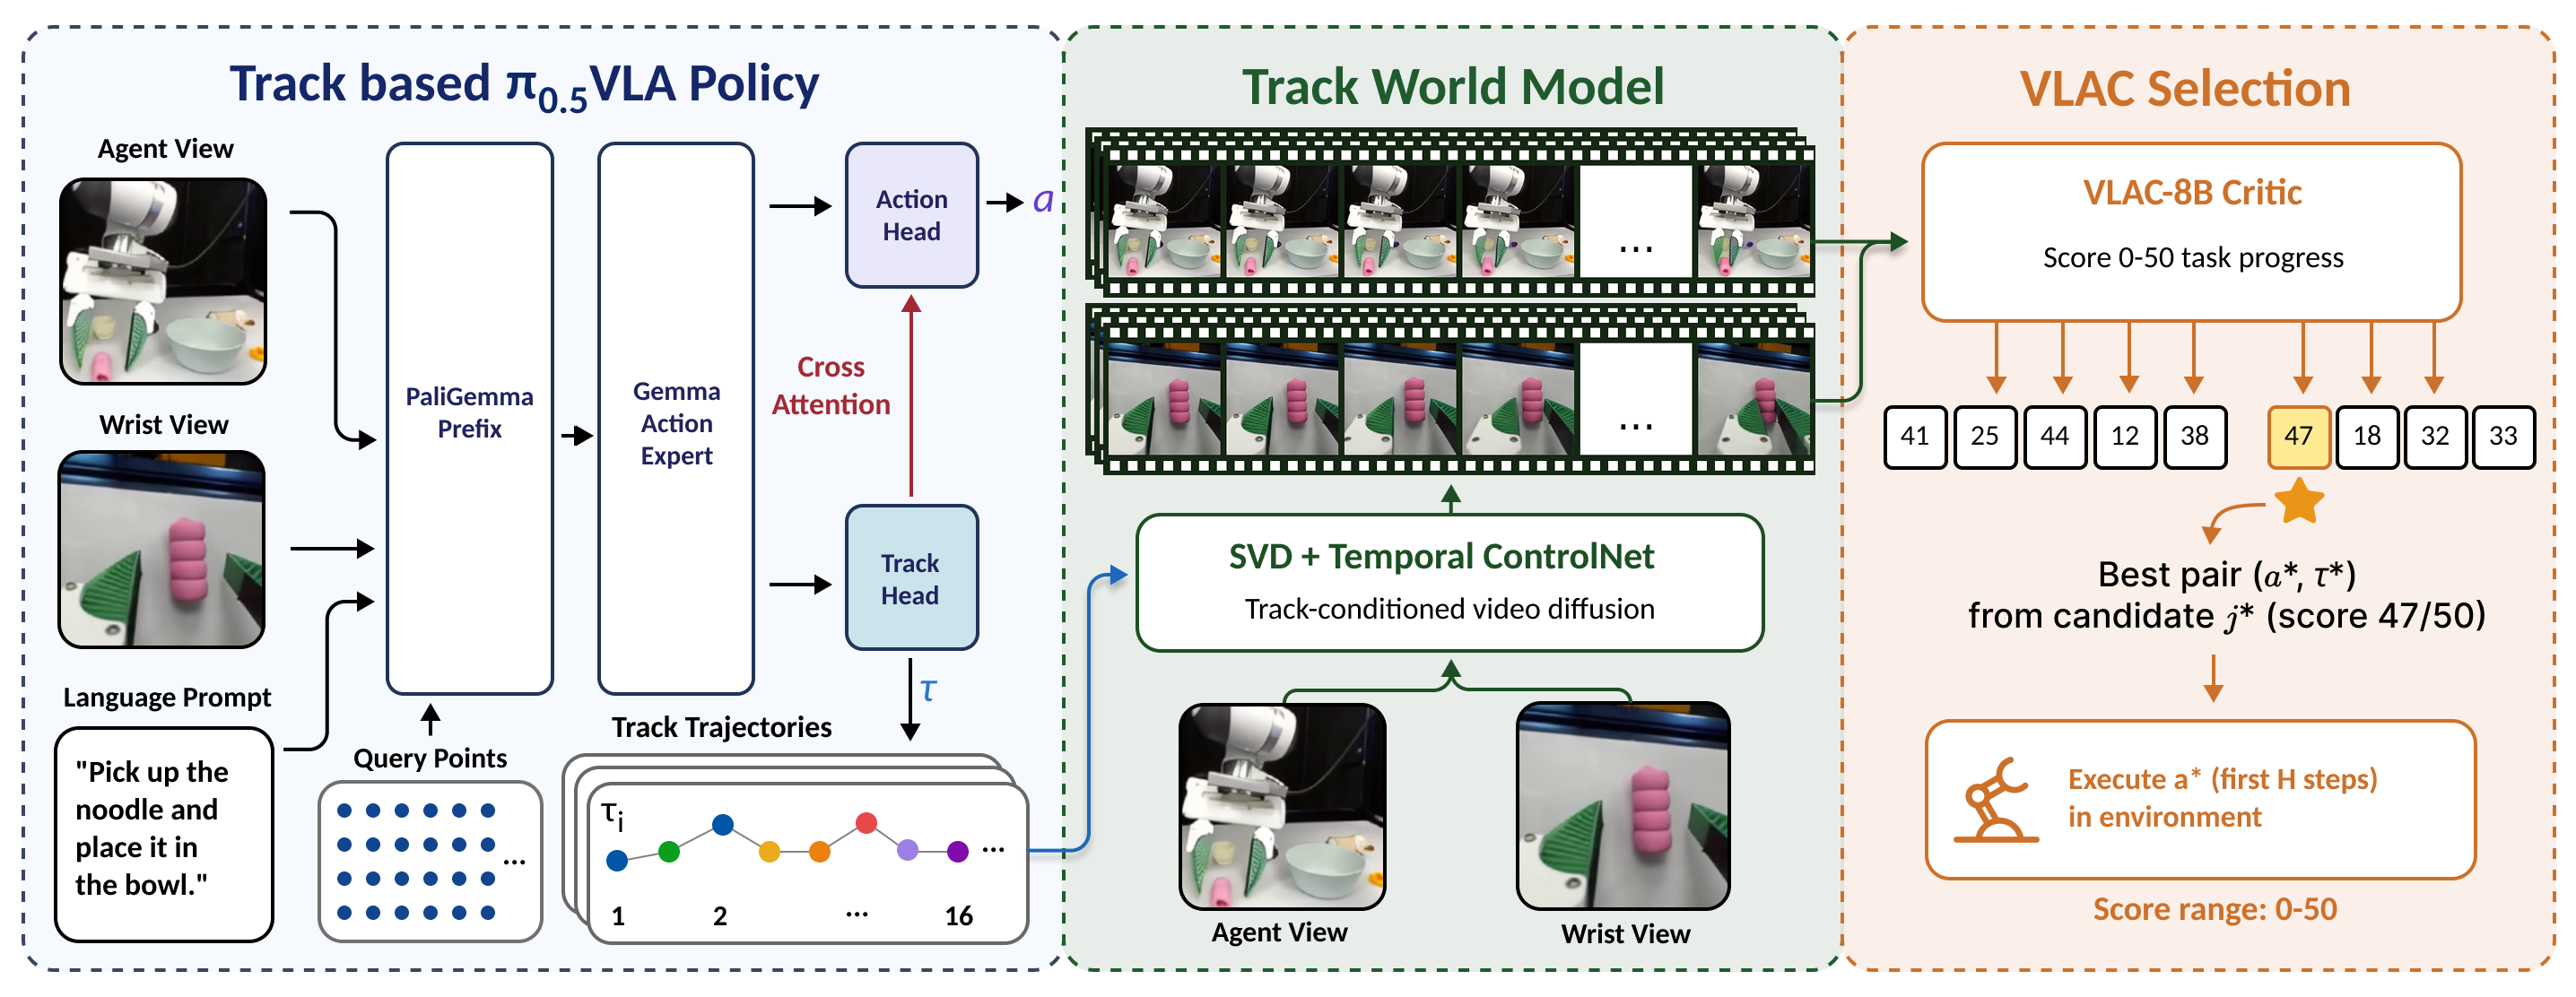
The framework contains a joint action/track policy, a conditional video generator, and a critic that scores task progress from predicted videos.
3.1 Policy Architecture
The policy extends π0.5 [5] with separate track and action projections sharing a flow-matching action expert. Track tokens precede actions, so actions can attend to tracks while the reverse is masked. The agent view predicts seven gripper points; the wrist view predicts those seven points plus a 5 × 5 scene grid to represent camera-relative scene motion.
The video model uses Stable Video Diffusion [36] with a temporal ControlNet receiving rasterized track heat maps. The action-conditioned comparison instead injects encoded action vectors and view embeddings through attention. Both train on ground-truth conditioning but receive predicted candidates at evaluation. A task-finetuned visual-language action critic [33] scores imagined outcomes from zero to fifty. This is a learned progress score, not a calibrated success probability.
Equations 1–3
| (1) |
| (2) |
| (3) |
3.2 Pretraining
Pretraining transfers visual motion structure from robot and human data, with different supervision available for each source.
VLAT.
The main policy uses 76,000 DROID trajectories [39] and a 150,000-clip EgoDex subset [40], mixed 1:2, for thirty thousand steps at batch size sixty-four on four H100 accelerators. Robot poses and calibration project gripper keypoints, while CoTracker [16] supplies image-point trajectories. Human video supervises visual tracks only; it does not supply executable robot action labels.
World Model.
Both video-model variants pretrain on 76,000 DROID trajectories for thirty thousand steps at batch size sixty-four, then use the same simulation or physical fine-tuning data. This keeps the world-model comparison more controlled than the direct comparison against an official pretrained policy checkpoint.
3.3 Inference
The policy samples twenty candidates in simulation or sixteen on hardware, using increased initial noise and temperature-scaled resampling for diversity. Each candidate’s tracks condition a video rollout; the critic selects the highest-scoring rollout and the corresponding action chunk is executed. The process reobserves after the full sixteen-step chunk, not after each individual predicted action.
Equation 4
| (4) |
4 Simulation Experiments
Four variants compare the official policy, joint action/track prediction alone, action-conditioned video selection, and track-conditioned selection. The largest headline improvement includes policy architecture, additional pretraining, and selection changes. Comparing the two video-selection variants holds the candidate generator and critic fixed and more directly tests the conditioning interface.
4.1 LIBERO-INTEGRAL Benchmark
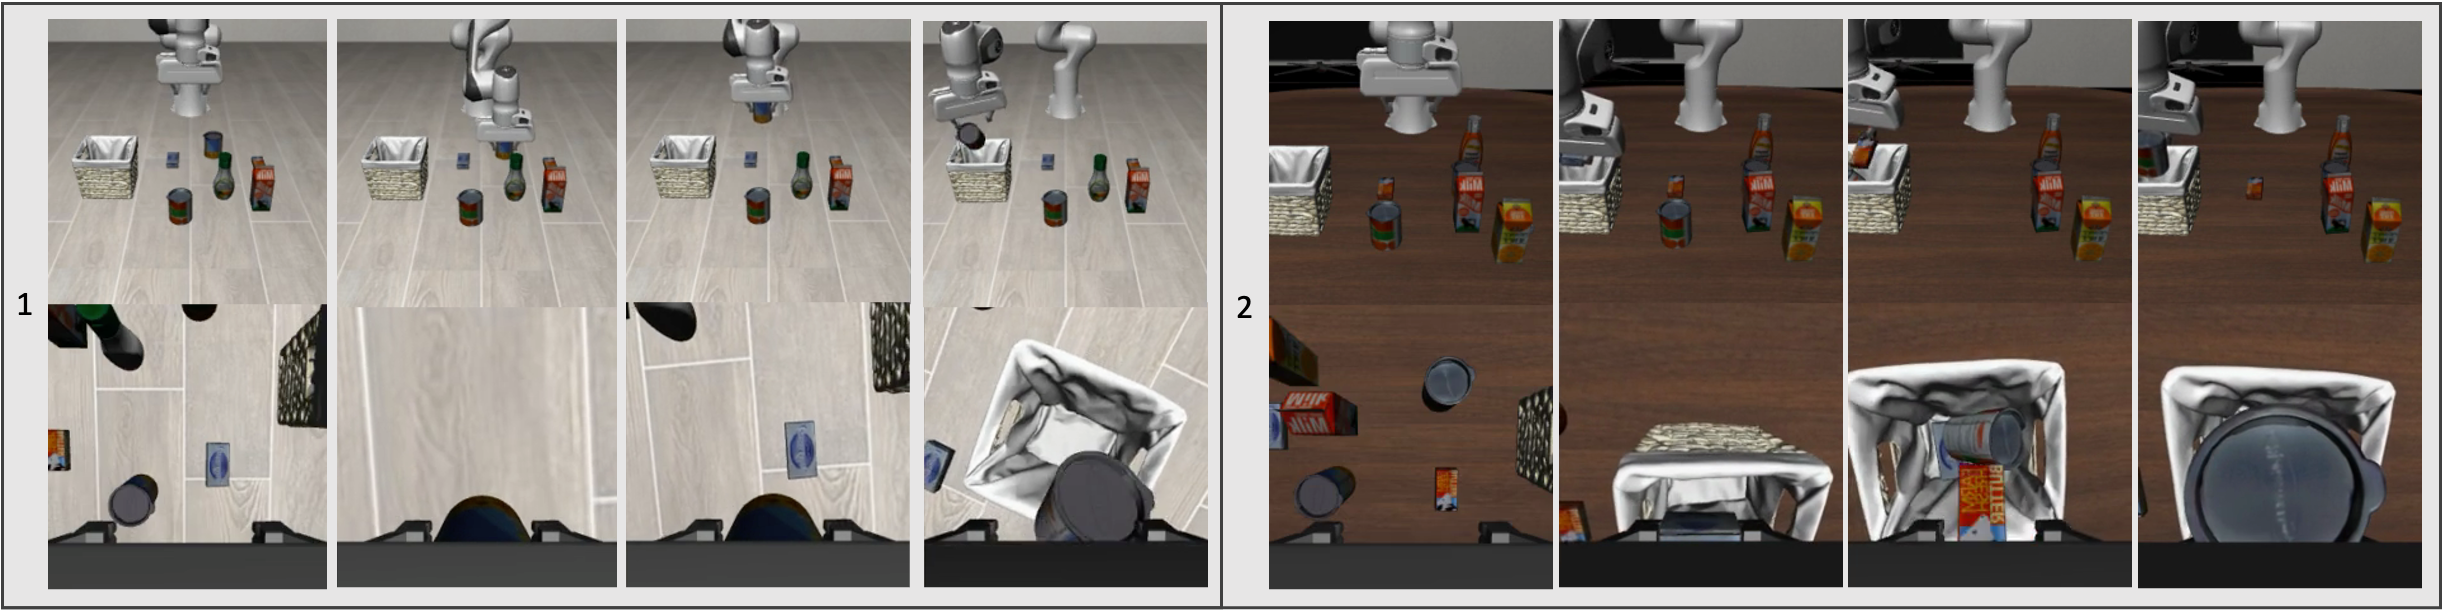
LIBERO-INTEGRAL is a twenty-task suite constructed from ten robustness cases and ten UR5 replacements of LIBERO-10 tasks. Robustness cases cover object swaps, object/task changes, difficult camera views, and altered initial robot states. It is a selected benchmark assembled by the authors, not the complete union of all source robustness tasks.
Model Finetuning.
The π0.5 baseline uses its official LIBERO checkpoint. Other variants fine-tune on two thousand LIBERO episodes; the joint policy trains for five thousand steps and each video model for twenty-five thousand. The critic is fine-tuned on predicted rollouts and completion rewards. Projected gripper points and tracked wrist-view grid points supervise the sixteen-step predictions.
4.2 Video Generation Results
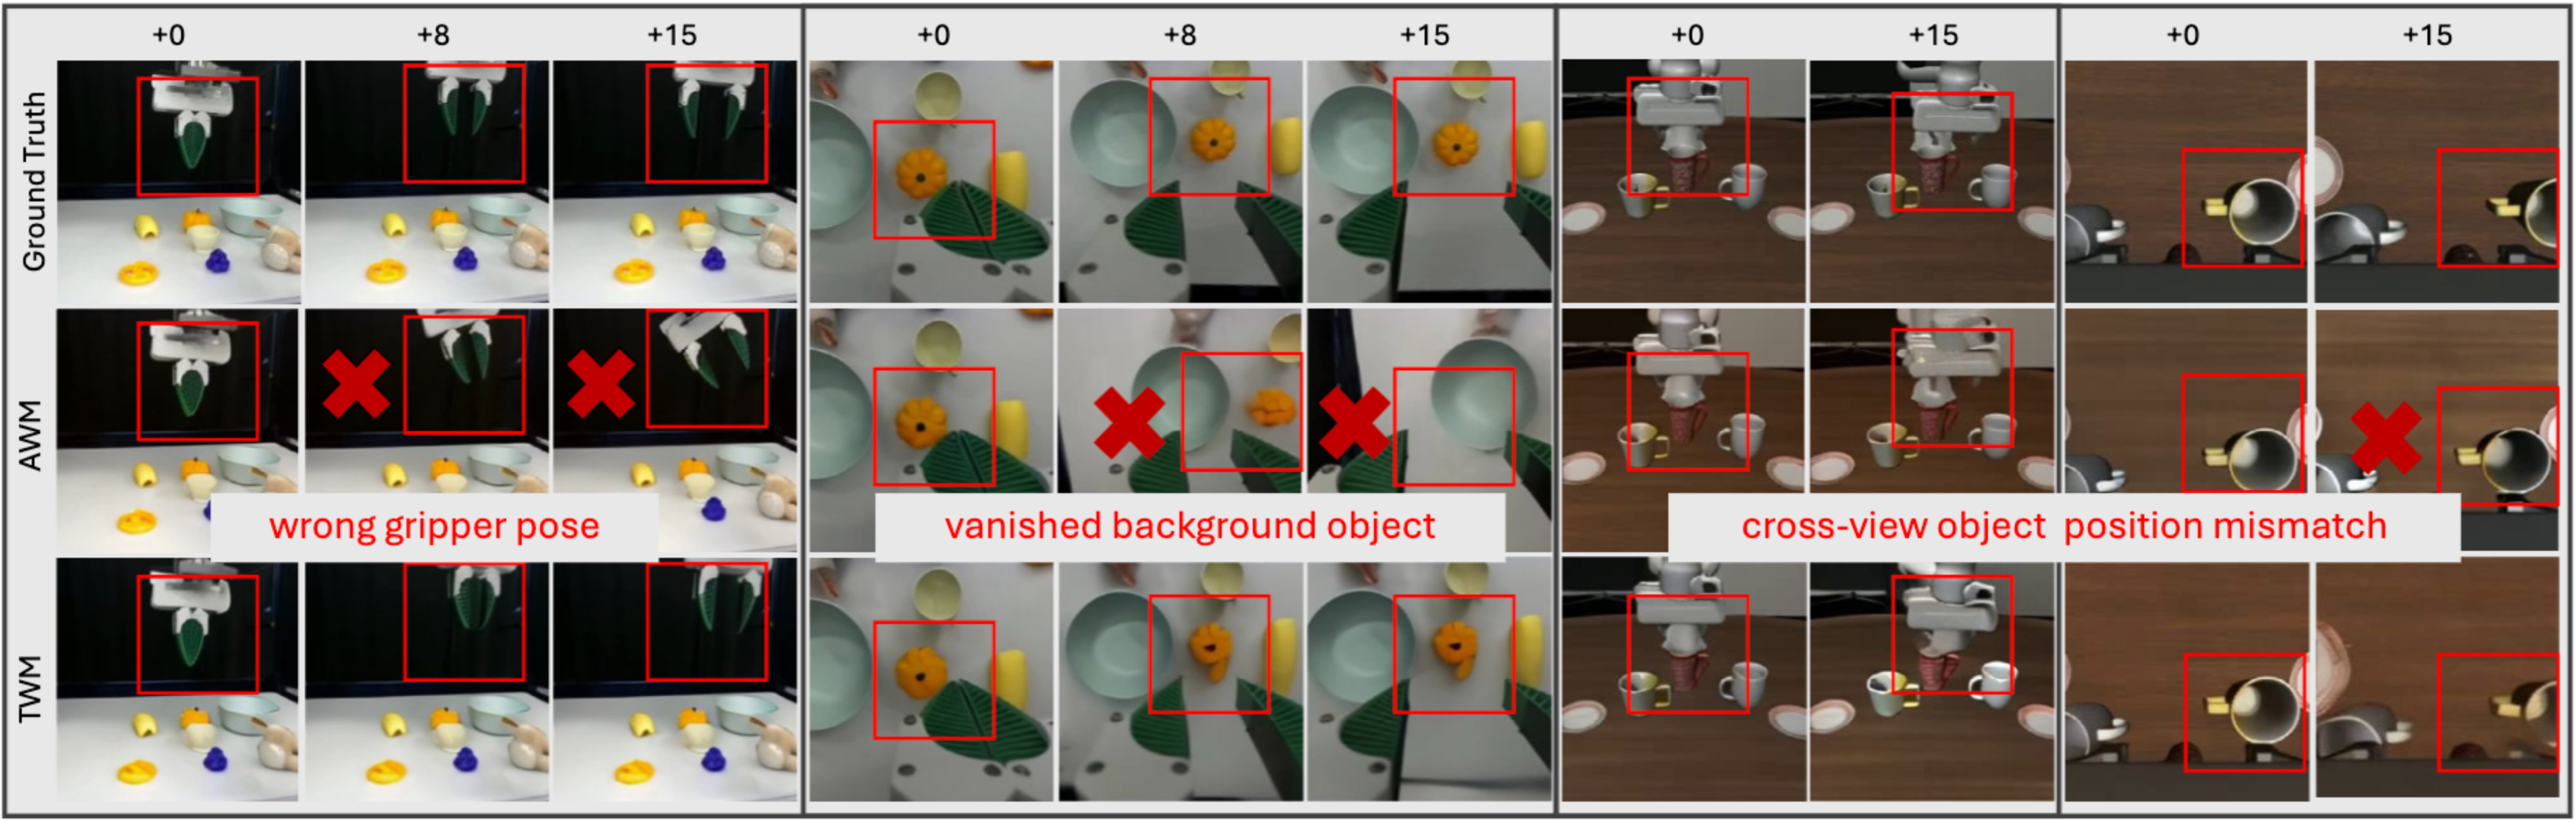
On one hundred generated evaluation videos, track conditioning improves all five listed video-quality metrics in both views. Agent-view peak signal-to-noise ratio rises from 15.12 to 24.51 and perceptual distance falls from 0.438 to 0.106. These measure image/video resemblance; better perceptual scores alone do not verify contact dynamics or that selected actions achieve the predicted motion.
| Metric | Real / Agent | Real / Wrist | Sim / Agent | Sim / Wrist | ||||
|---|---|---|---|---|---|---|---|---|
| Act. | Track | Act. | Track | Act. | Track | Act. | Track | |
| PSNR | 20.70 | 21.27 | 16.89 | 20.62 | 15.12 | 24.51 | 16.25 | 22.71 |
| SSIM | 0.767 | 0.802 | 0.621 | 0.738 | 0.482 | 0.843 | 0.668 | 0.822 |
| LPIPS | 0.126 | 0.111 | 0.372 | 0.225 | 0.438 | 0.106 | 0.452 | 0.182 |
| FID | 105 | 95 | 176 | 130 | 248 | 156 | 222 | 92 |
| FVD | 148 | 105 | 246 | 140 | 129 | 38 | 207 | 162 |
4.3 Robot Experiment Results
Each simulation task uses ten rollout episodes. All variants predict and execute sixteen-step action chunks. Standard-suite results and the harder shifted-task results address different performance regimes.
Standard LIBERO Suites.
Across the four standard suites, average success is 96.8% for π0.5, 98.0% for the joint policy and action-conditioned selection, and 98.3% for TrAct. Gains are small near saturation. TrAct is not best in every individual suite: the joint policy reaches 100% on the object suite versus TrAct’s 99%.
LIBERO-INTEGRAL.
On LIBERO-INTEGRAL, average success is 0.27 for π0.5, 0.44 for the joint policy, 0.49 with action-conditioned selection, and 0.55 with track-conditioned selection. UR5-task success rises from 0.17 to 0.50. TrAct improves or ties the action-conditioned variant in most cases, but not all individual tasks; the full per-task table is retained. Additional evaluation-seed runs support the approximately six-point selection gain without measuring independent training-seed variability.
5 Physical Robot Experiments
Physical experiments add a π0.5-plus-critic/action-world-model baseline, allowing the effect of the candidate generator to be examined separately from visual selection.
5.1 Physical Setup
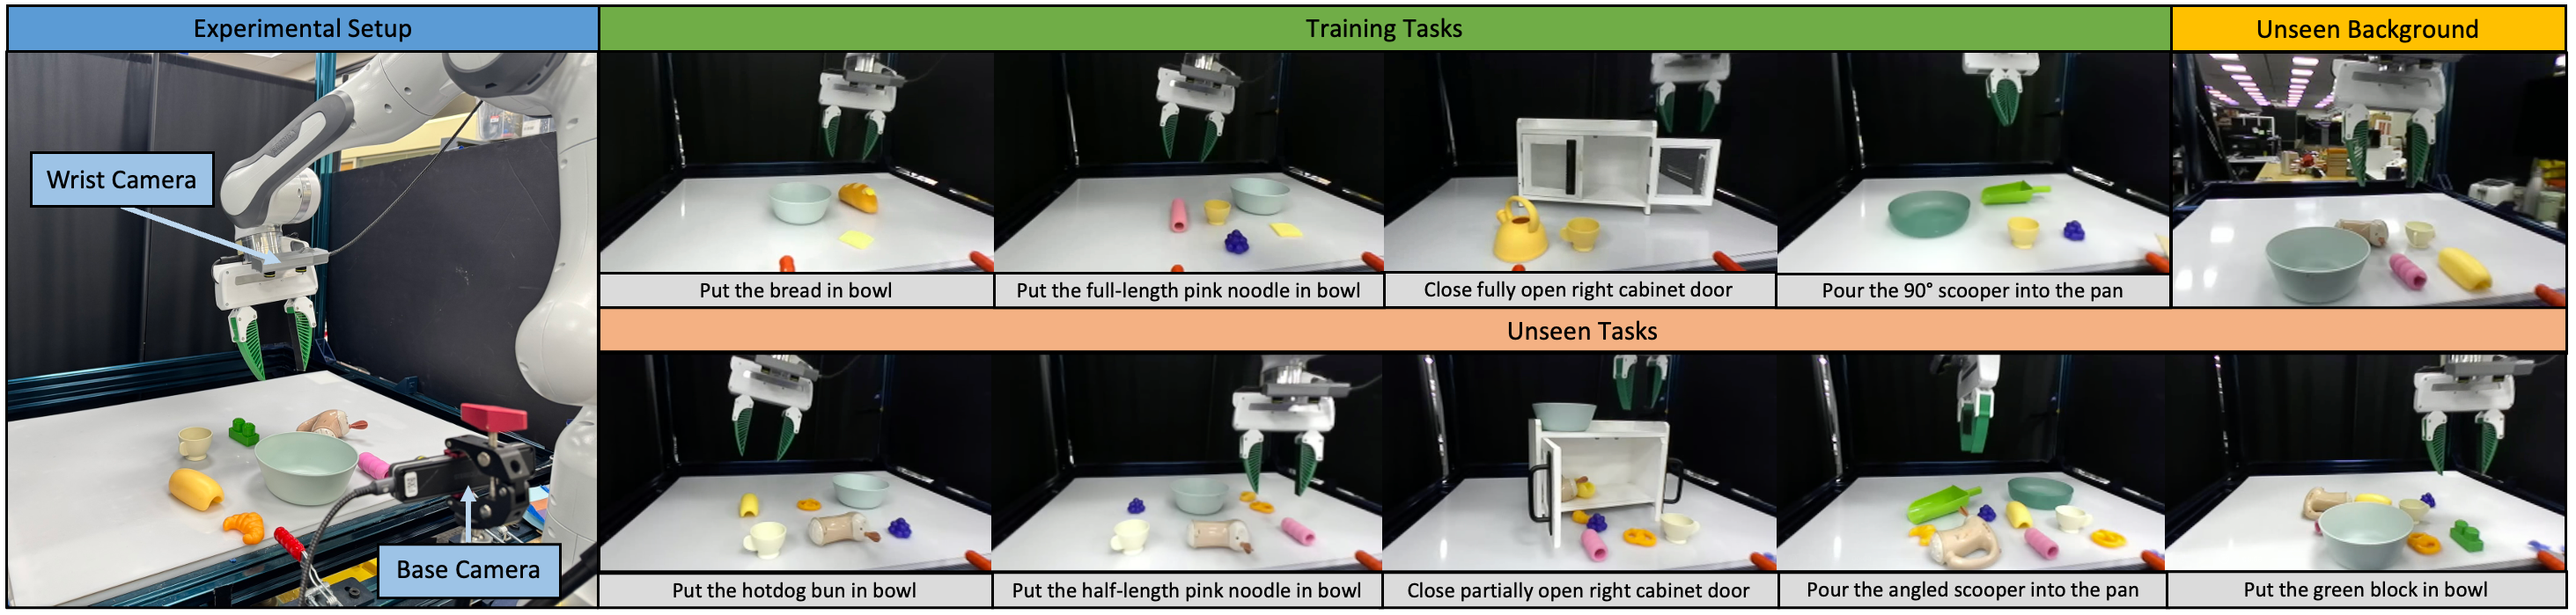
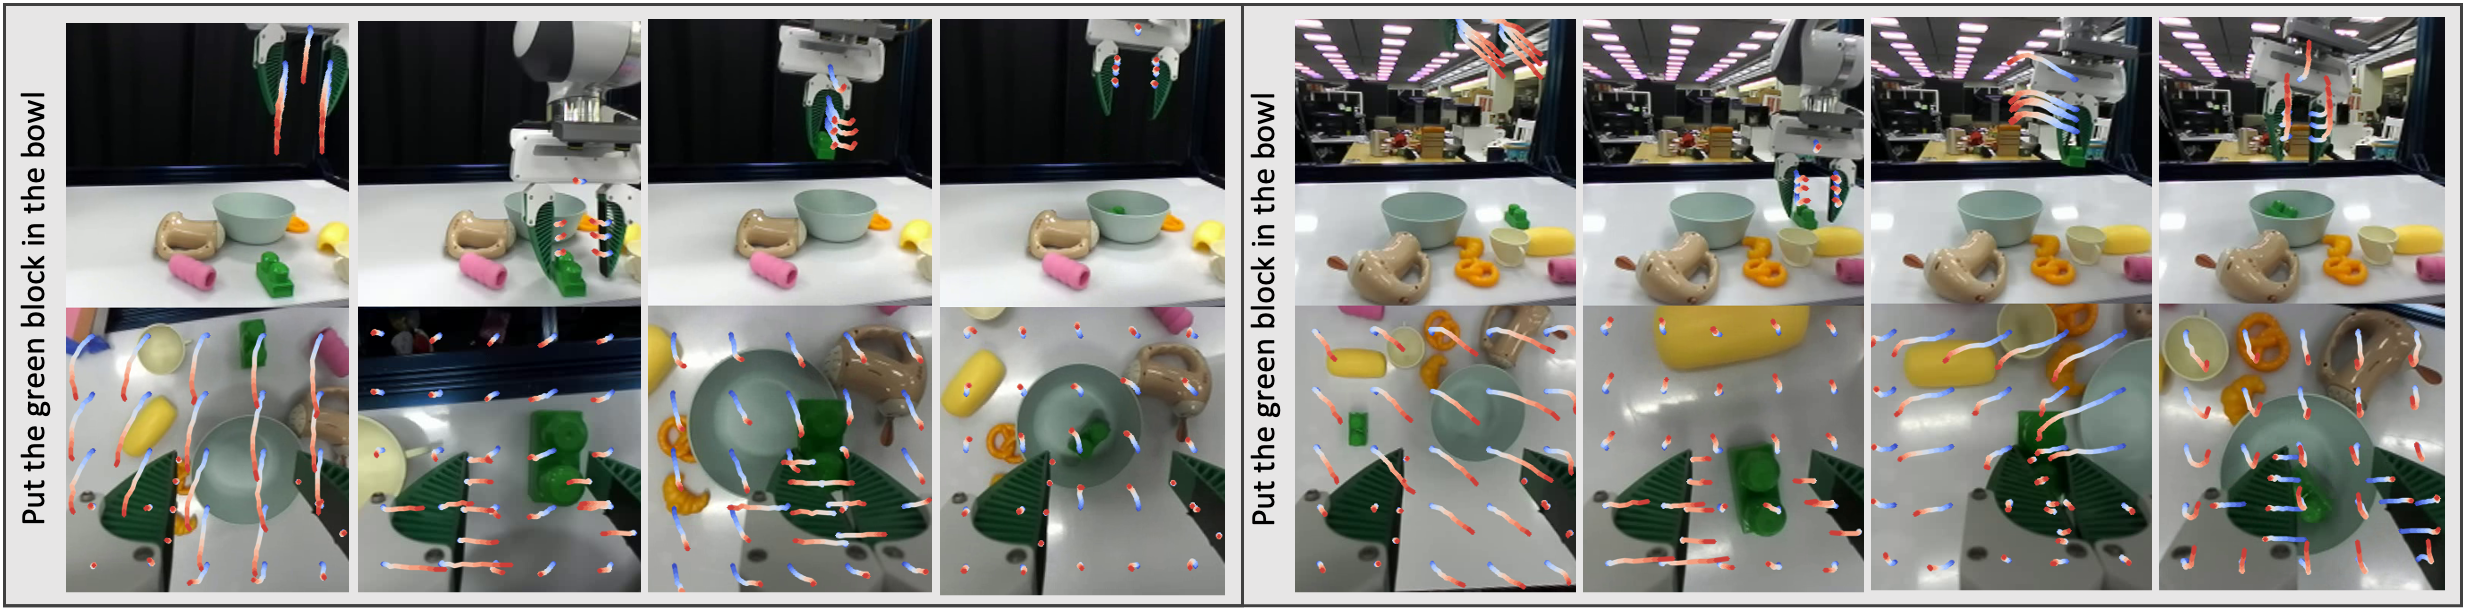
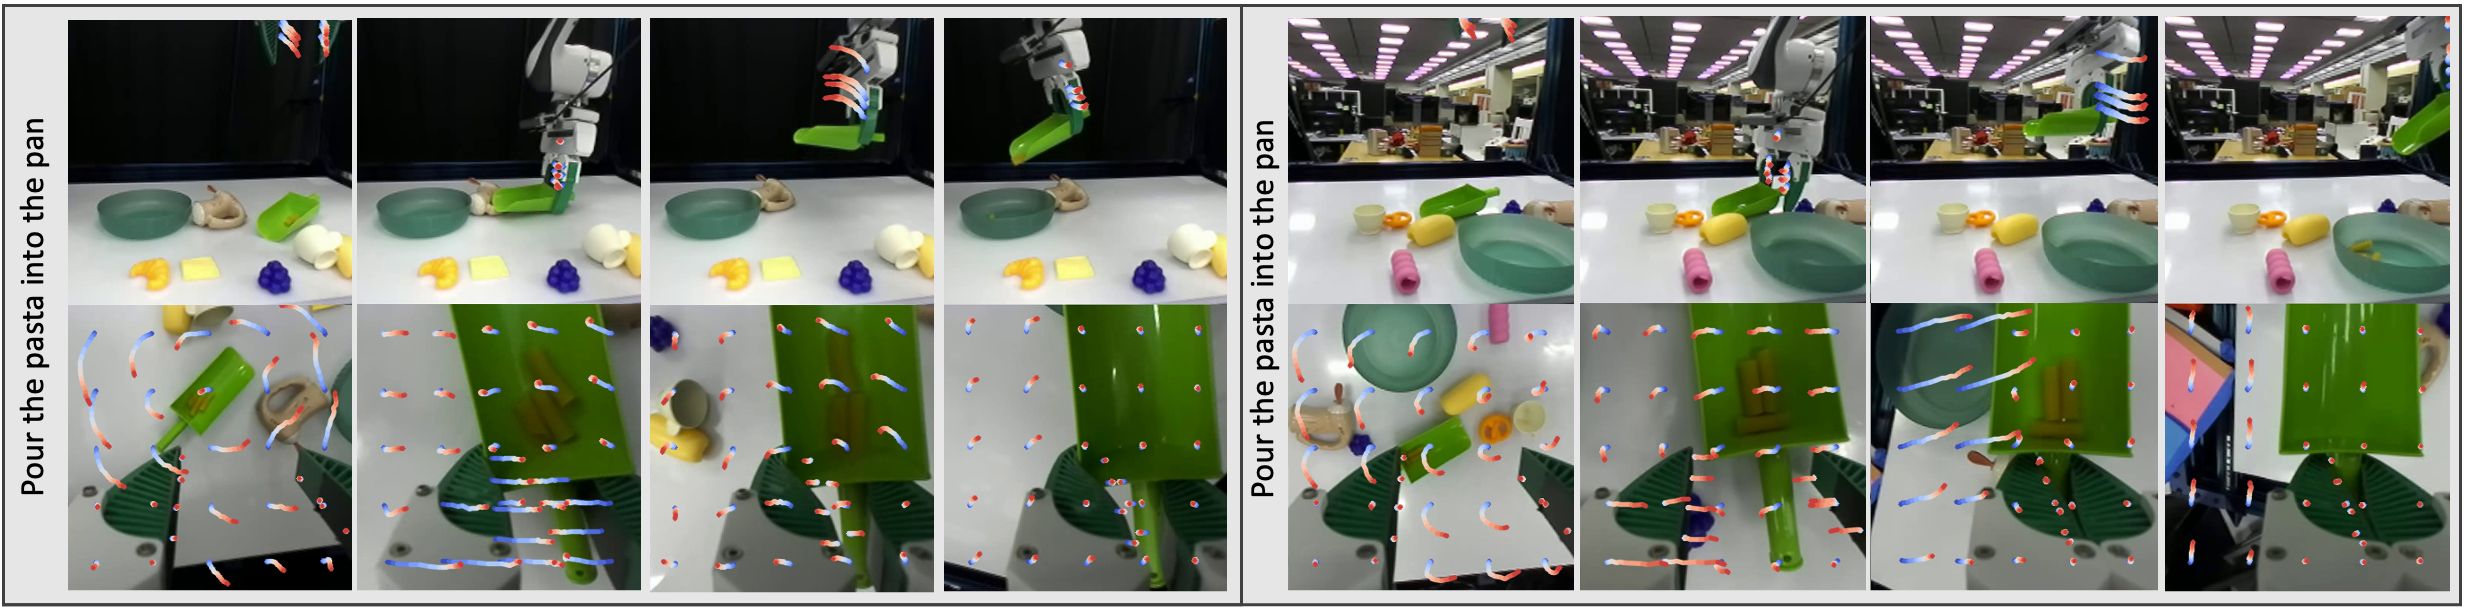
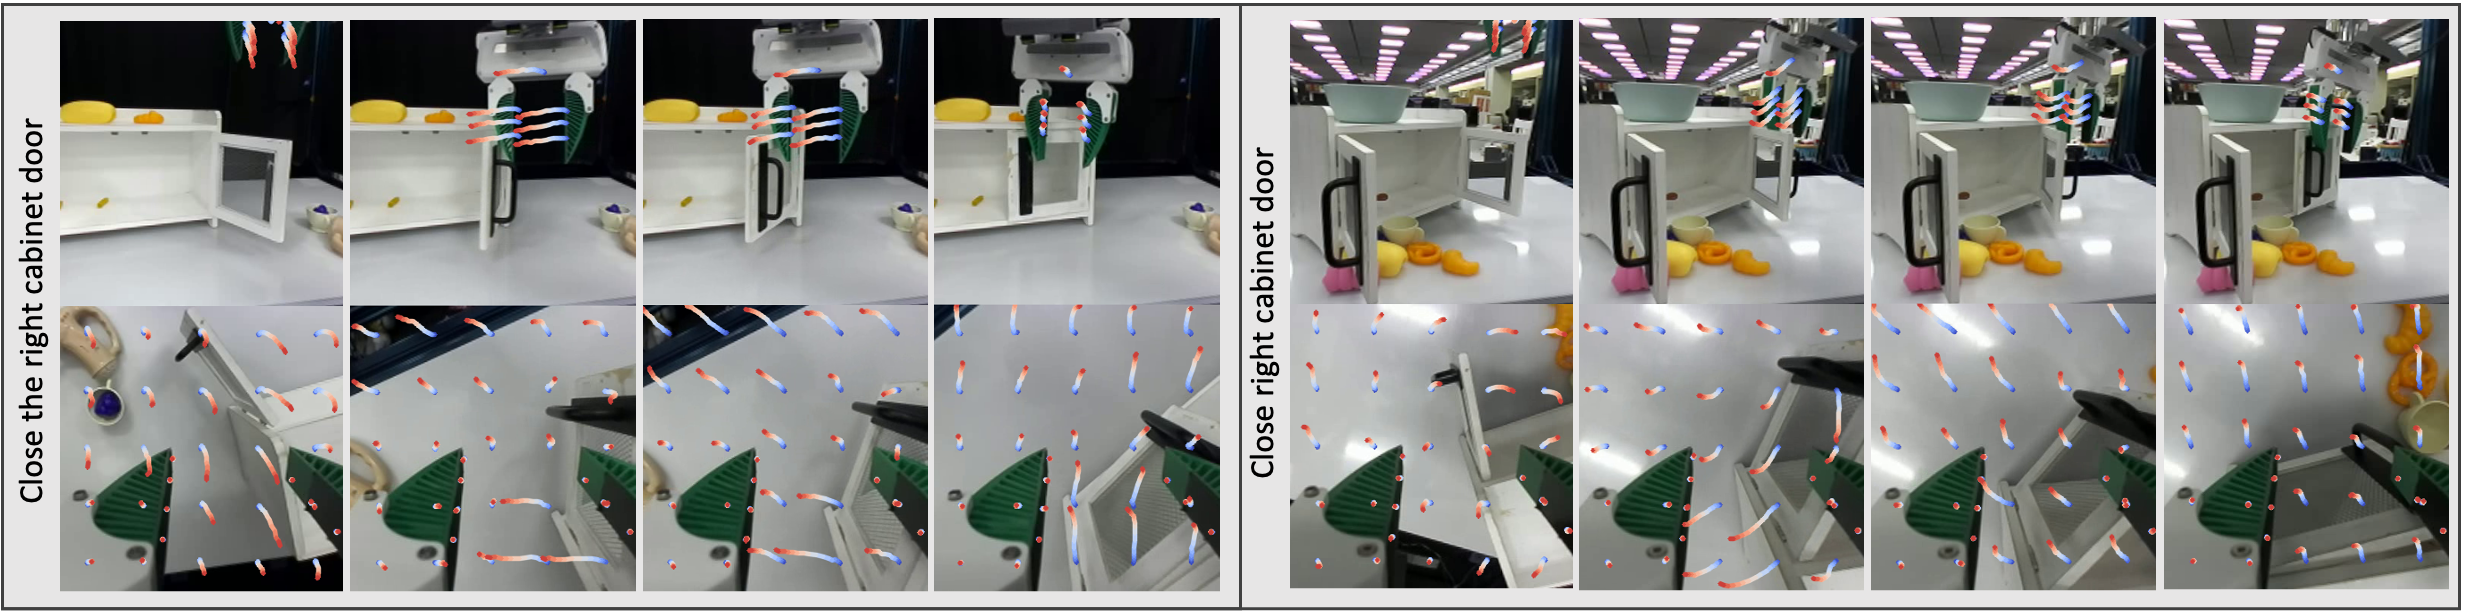
A Franka Panda uses a fixed external camera and a wrist camera. Four hundred demonstrations at fifteen frames per second cover four training tasks. Evaluation changes the manipulated object, noodle length, cabinet opening, or pouring orientation across five tasks, each on the original and a visually different background. These are controlled manipulation variations, not entirely unrelated skill families.
5.2 Model Finetuning
Both policies fine-tune on the same four hundred demonstrations for five thousand steps. Both video models use twenty-five thousand fine-tuning steps, and the critic uses four thousand. Their differing pretraining histories remain part of the overall system comparison.
5.3 Video Generation Results
The physical-video comparison also uses one hundred evaluation rollouts and favors track conditioning on all reported metrics. Wrist-view perceptual distance falls from 0.372 to 0.225 and video distribution distance from 246 to 140. These aggregate video metrics complement rather than replace physical task completion.
5.4 Robot Experiment Results
Each task/background combination has ten trials, giving one hundred attempts per model across the ten conditions. Average success is 49% for π0.5, 65% for π0.5 with action-world-model selection, 55% for the joint policy, 66% for the joint policy with action-conditioned selection, and 76% for TrAct. Against the latter action-conditioned variant, track selection improves 76% to 82% on the original background and 56% to 70% on the changed background. Some individual conditions tie, and repeated physical training/evaluation confidence intervals are not reported.
| Task | Bg. | +VLAC | VLAT | VLAT+AWM | TrAct | |
|---|---|---|---|---|---|---|
| Put the green block in the bowl | R | 0.5 | 0.7 | 0.6 | 0.7 | 0.7 |
| D | 0.4 | 0.5 | 0.4 | 0.5 | 0.7 | |
| Put the half pink noodle in the bowl | R | 0.6 | 0.9 | 0.8 | 1.0 | 1.0 |
| D | 0.6 | 0.8 | 0.6 | 0.8 | 0.8 | |
| Put the hotdog bun in the bowl | R | 0.6 | 0.8 | 0.6 | 0.8 | 0.8 |
| D | 0.4 | 0.6 | 0.5 | 0.6 | 0.6 | |
| Close the cabinet door | R | 0.5 | 0.6 | 0.5 | 0.6 | 0.8 |
| D | 0.3 | 0.4 | 0.4 | 0.4 | 0.7 | |
| Pour the pasta into the pan | R | 0.5 | 0.7 | 0.6 | 0.7 | 0.8 |
| D | 0.5 | 0.5 | 0.5 | 0.5 | 0.7 | |
| Average | 0.49 | 0.65 | 0.55 | 0.66 | 0.76 |
6 Conclusion
The main practical limitation is computation: with sixteen candidates in parallel on L40S hardware, one planning call takes 2.431 seconds, dominated by 1.810 seconds of video generation. That call produces a sixteen-step action chunk; it is not a 2.431-millisecond low-level controller. Candidate count trades computation for choice quality. Other open issues include adaptive tracking points, longer horizons, broader manipulation, and the reliability of imagined outcomes and learned critic scores.
Appendix A Pseudo-code for TrAct Inference Procedure
The retained algorithm gives the full inference loop: propose action–track pairs, generate and score videos, execute the selected chunk, then observe again. The original nested-loop indentation is preserved.
Appendix B Pretraining Data and Unified Track Representation
The track representation uses fixed view-specific slots and masks so different robot and human datasets can share visual supervision.
Unified Track Slot Layout.
Slots are fixed token positions, not learned object identities. DROID uses seven gripper points in the external view and seven plus twenty-five background points in the wrist view. EgoDex supplies fourteen hand points plus twenty-five background points in its single egocentric view. Missing streams or keypoints are masked. The larger-mixture appendix adds BridgeData V2 tracks obtained from images because camera extrinsics are unavailable.
Track Tokenization and Masked Objective
Learned view embeddings distinguish camera streams without adding embodiment labels. Masks suppress unavailable track slots and action dimensions in attention and losses. Human clips train only the track branch; robot datasets additionally train actions in their valid control format. This shares visual supervision while keeping action labels embodiment-dependent.
Equations
Appendix C Inference Hyperparameters
The main settings use twenty simulation candidates with resampling parameter three and sixteen physical candidates with parameter four; both use noise scale two. The latency table reports 52 ms for the joint policy, 1,810 ms for the video model, and 569 ms for the critic at sixteen candidates. It does not report a complete candidate-count latency curve or controller-level real-time throughput.
Appendix D Additional Qualitative Video Comparison
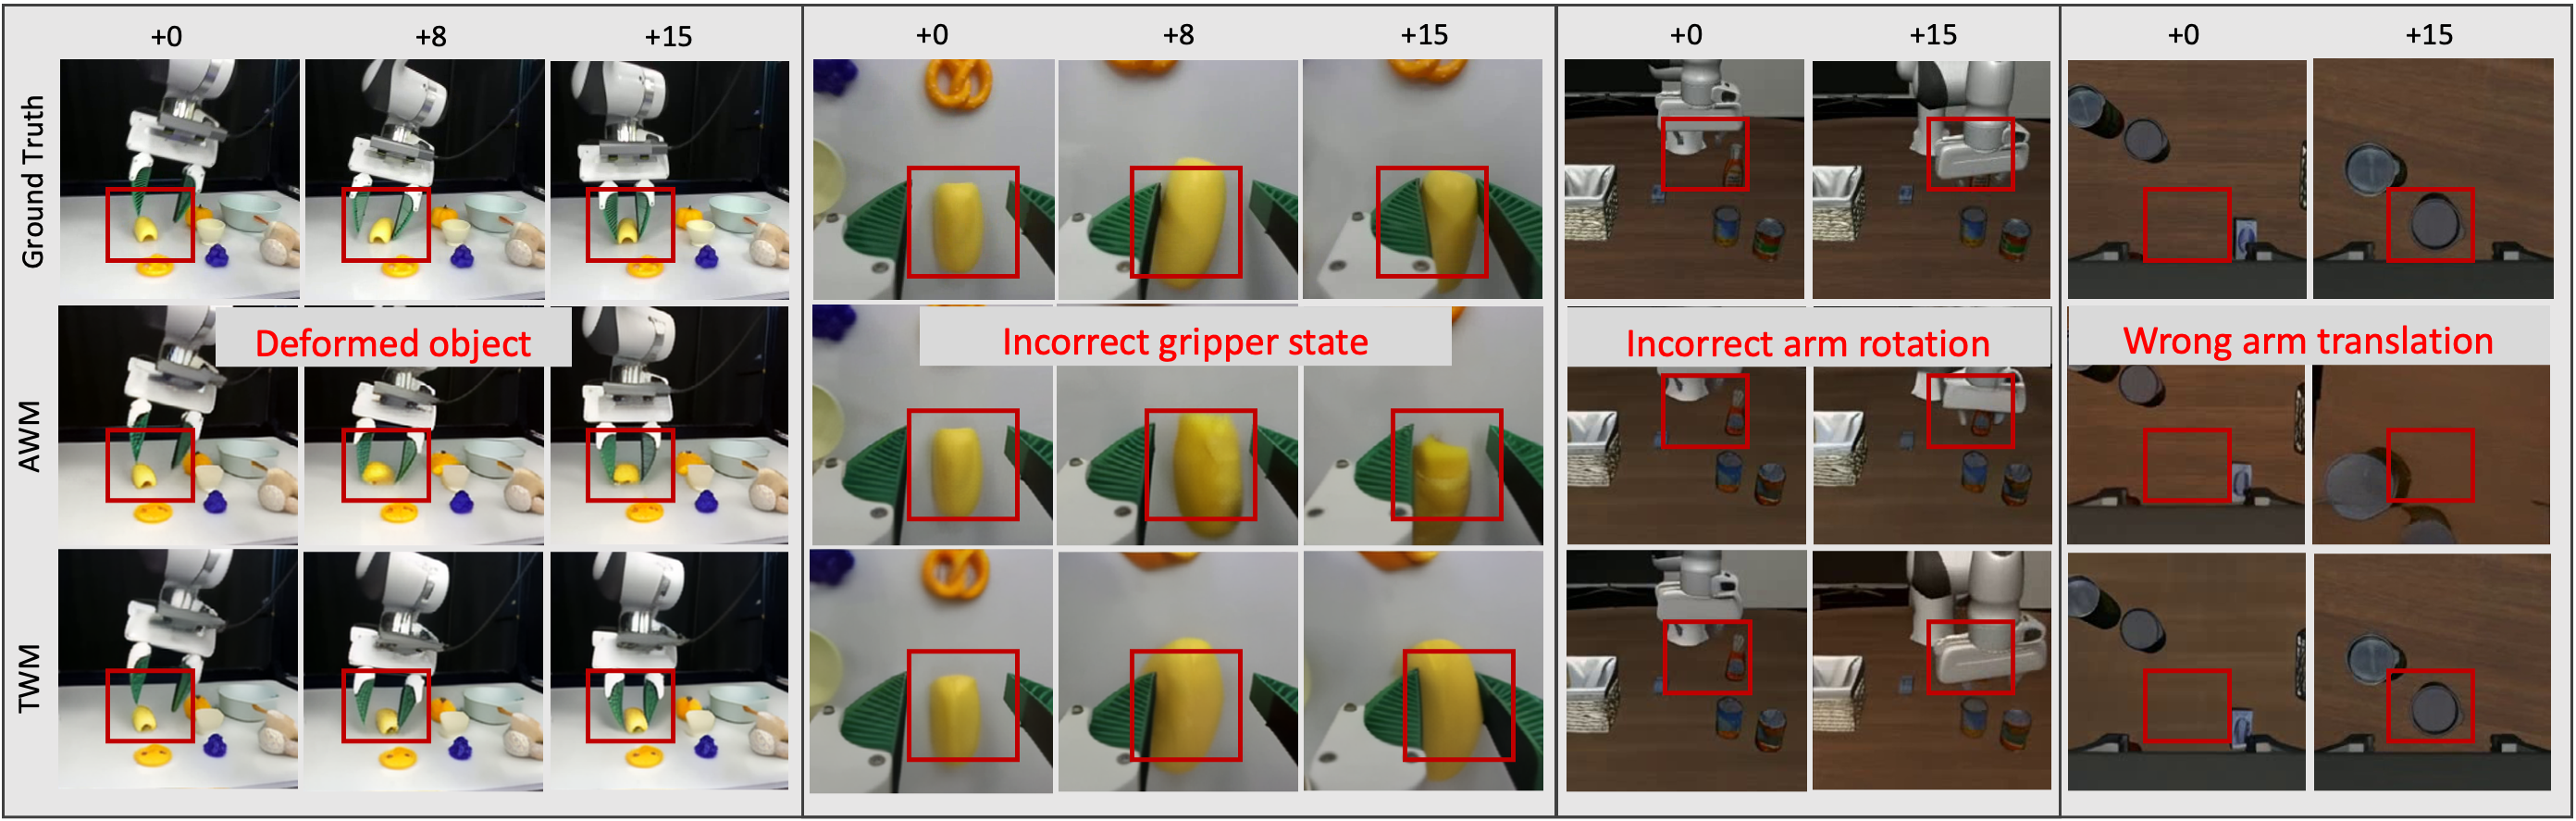
Additional complete video-frame montages compare both views and show examples of spatial drift, shape distortion, and motion inconsistency in action-conditioned predictions. These are qualitative examples, with the aggregate video metrics reported separately.
Appendix E Physical Experiment Setup
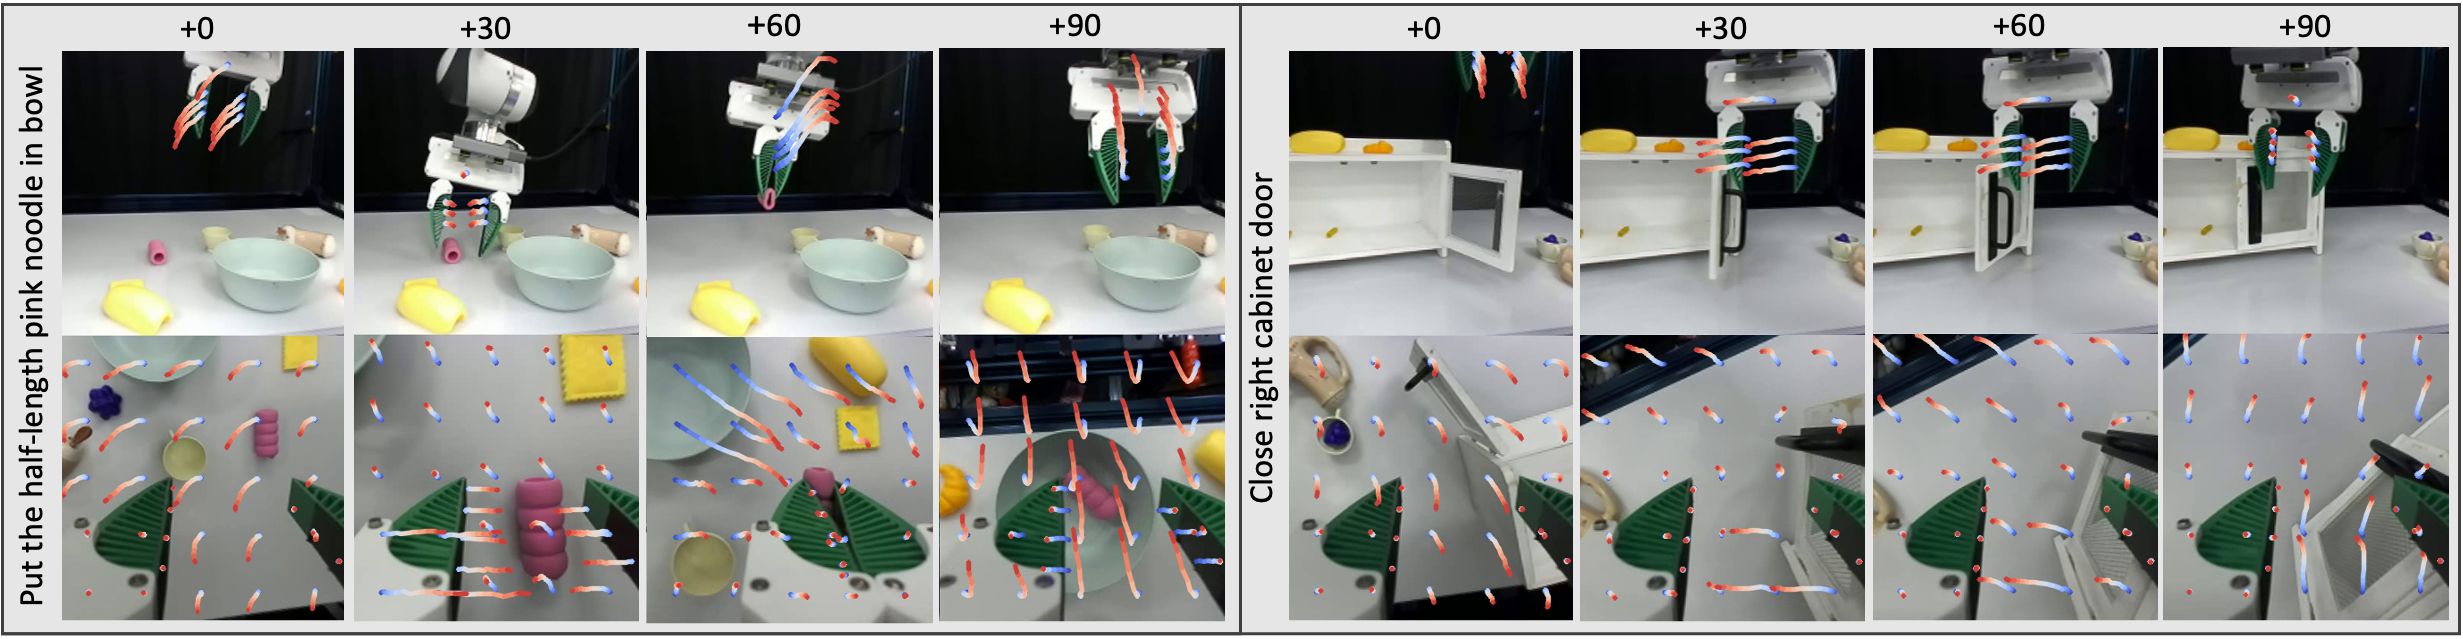
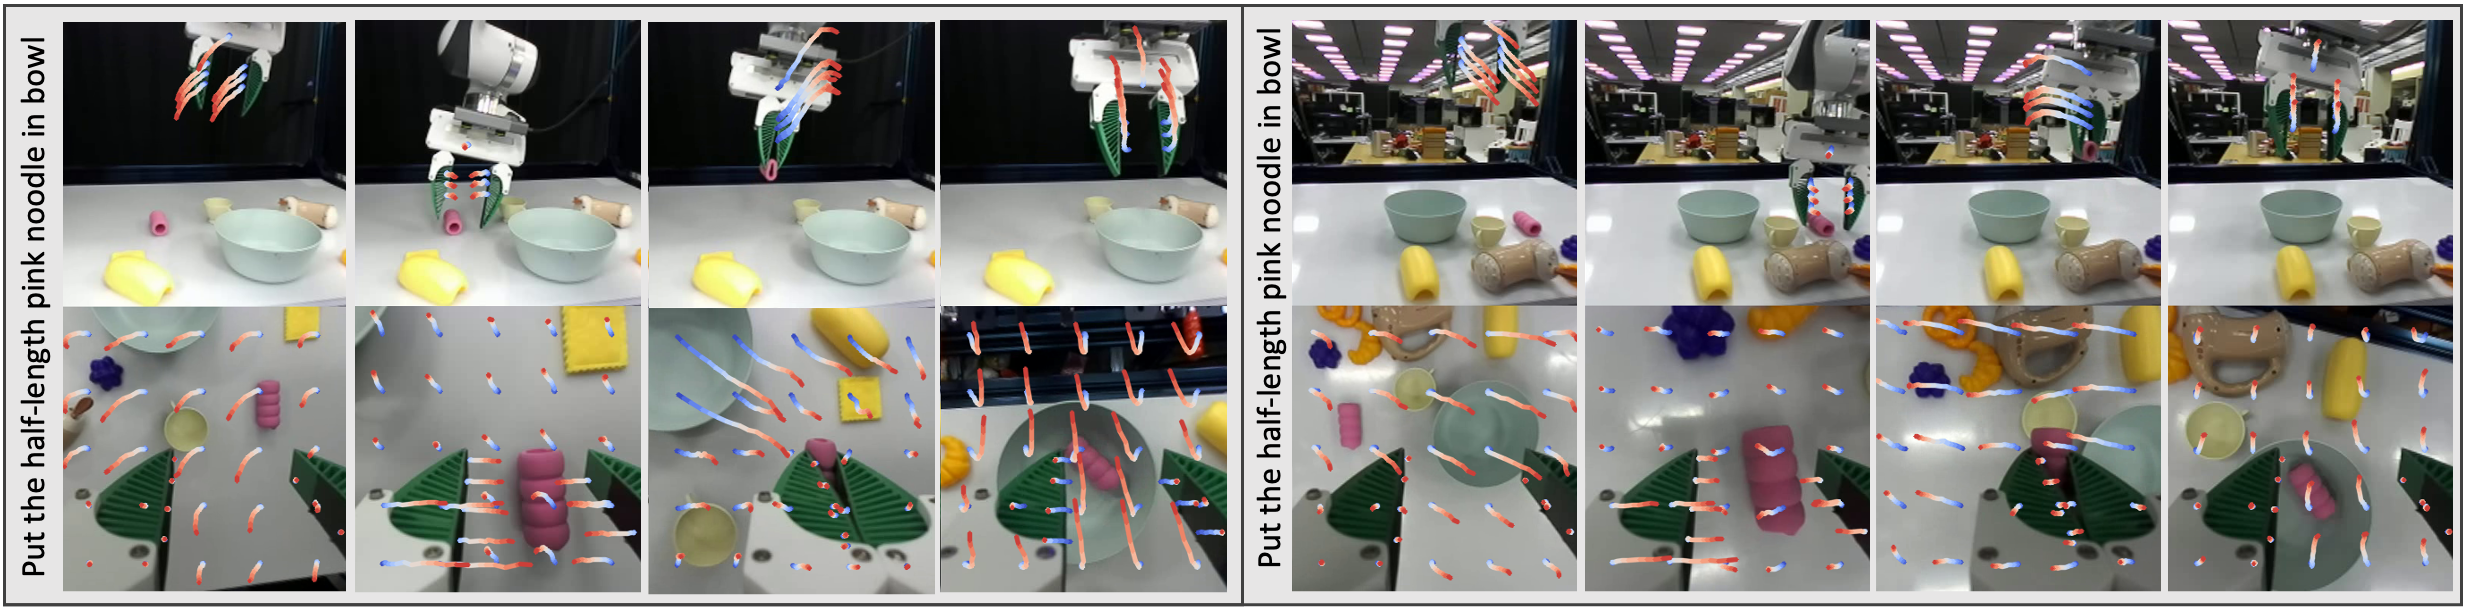
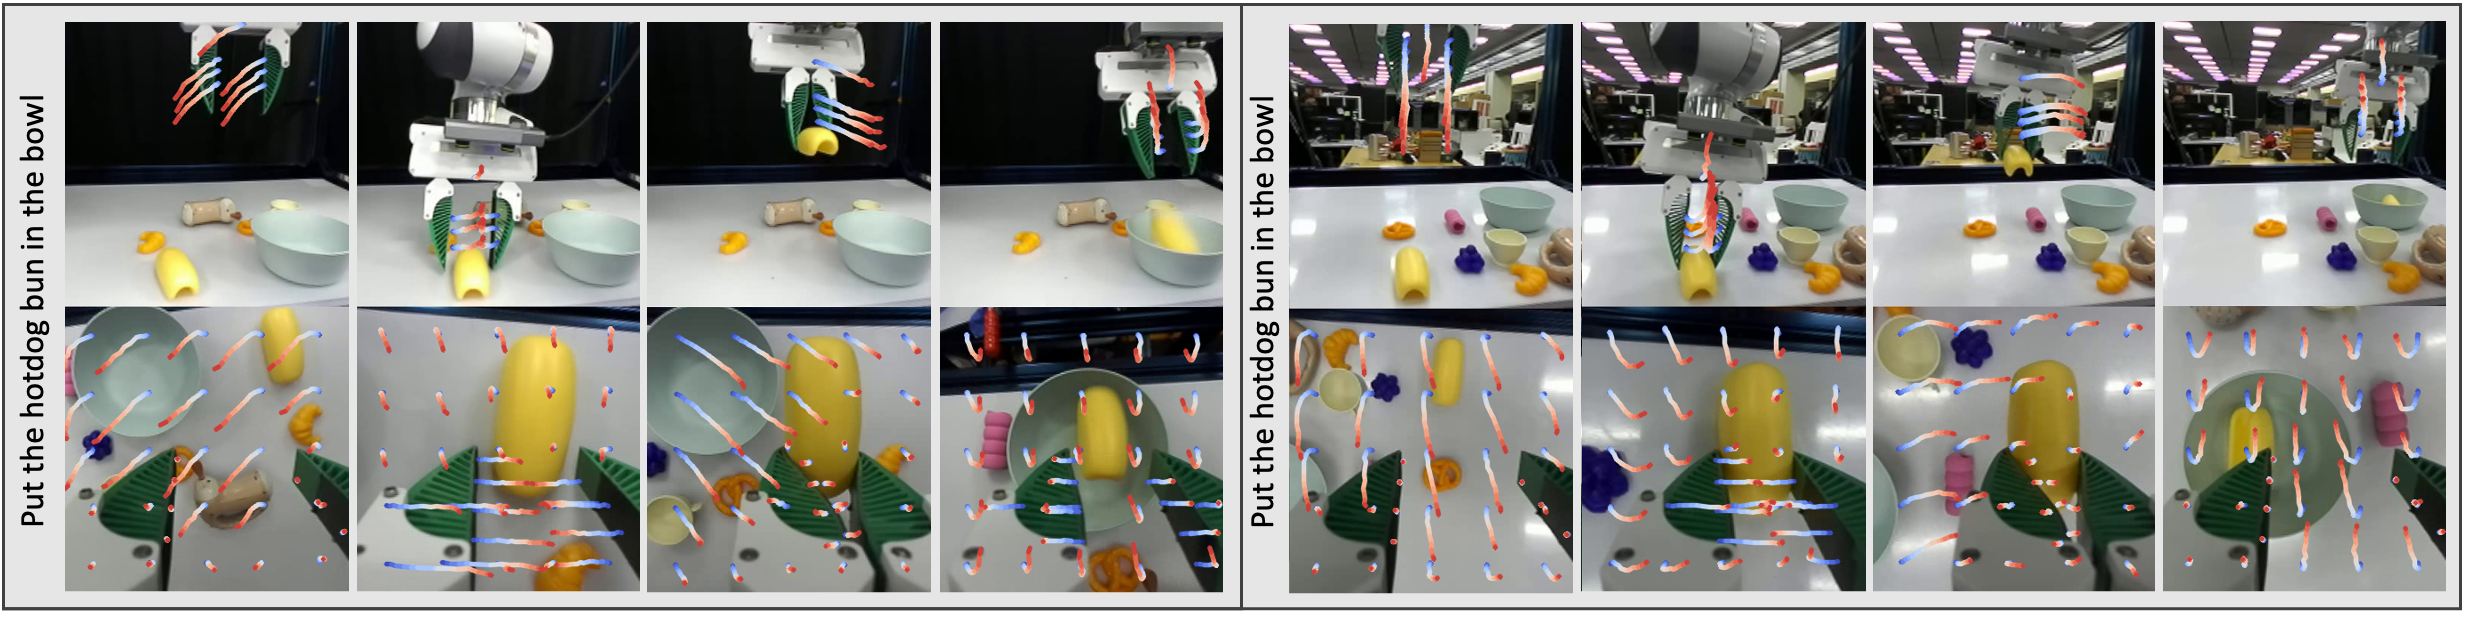
The complete setup and rollout figures retain all five evaluation variations under both backgrounds. They show the scope of the physical generalization claim and the sixteen-step predicted tracks, alongside the four training-task examples.
Appendix F Simulation Results
Simulation supplements list the selected tasks, full per-task outcomes, evaluation-seed repeats, and candidate-count ablation.
F.1 Simulation Experiment Setup
The ten robustness cases contain two examples from each selected variation category. Ten additional tasks substitute a UR5 for the Franka embodiment. The retained rollout montages and task table identify every case, making the benchmark’s selection and coverage explicit.
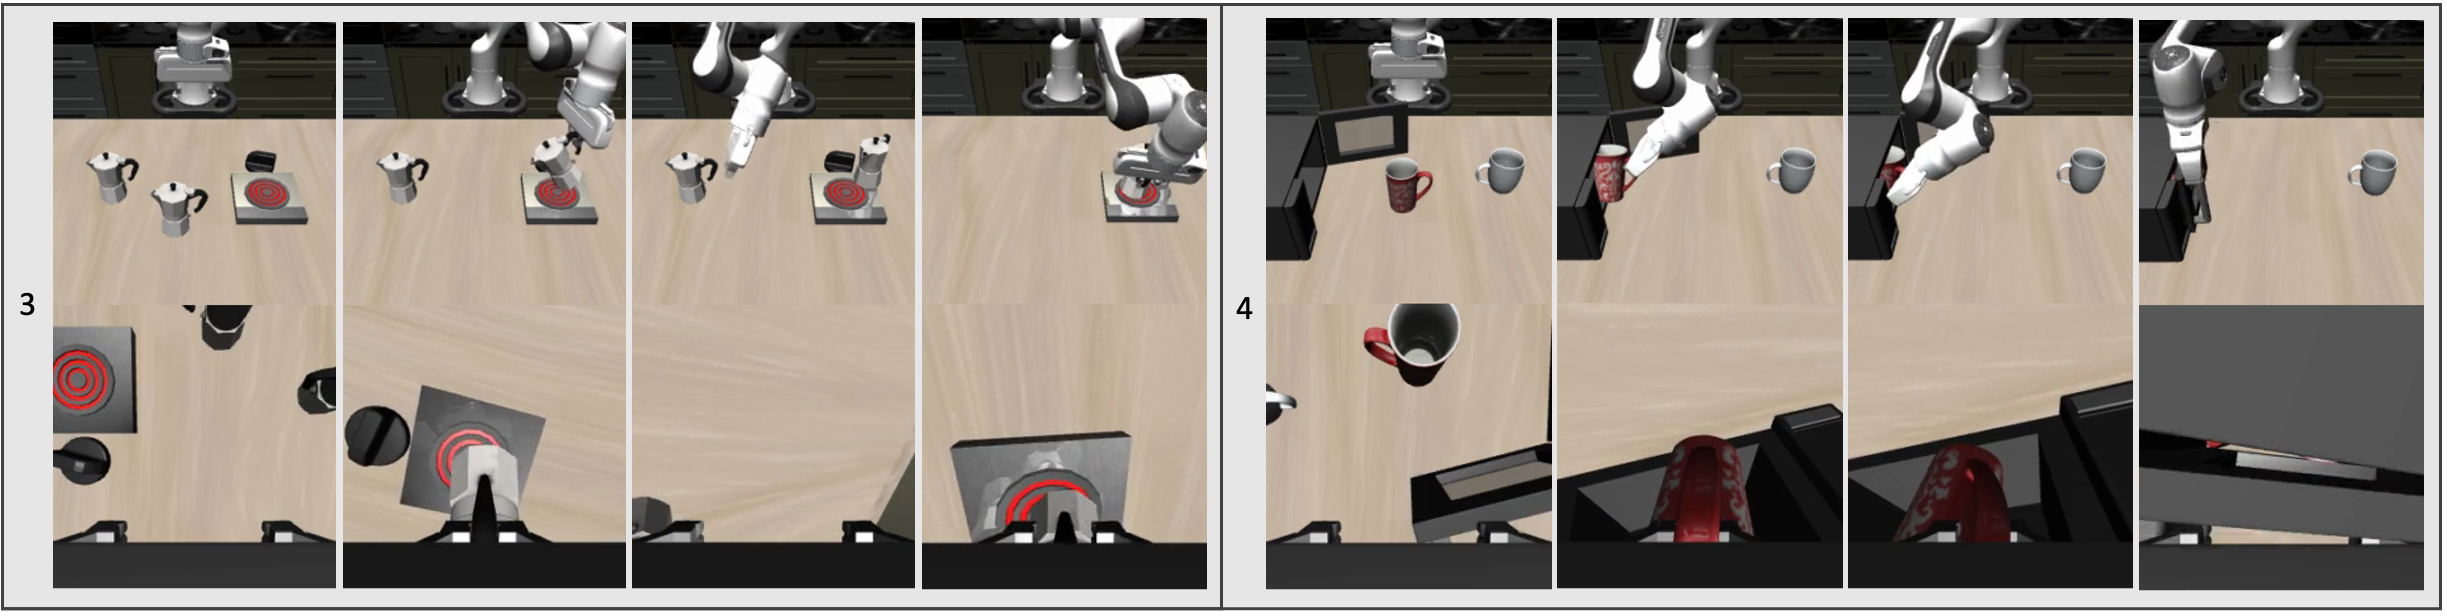
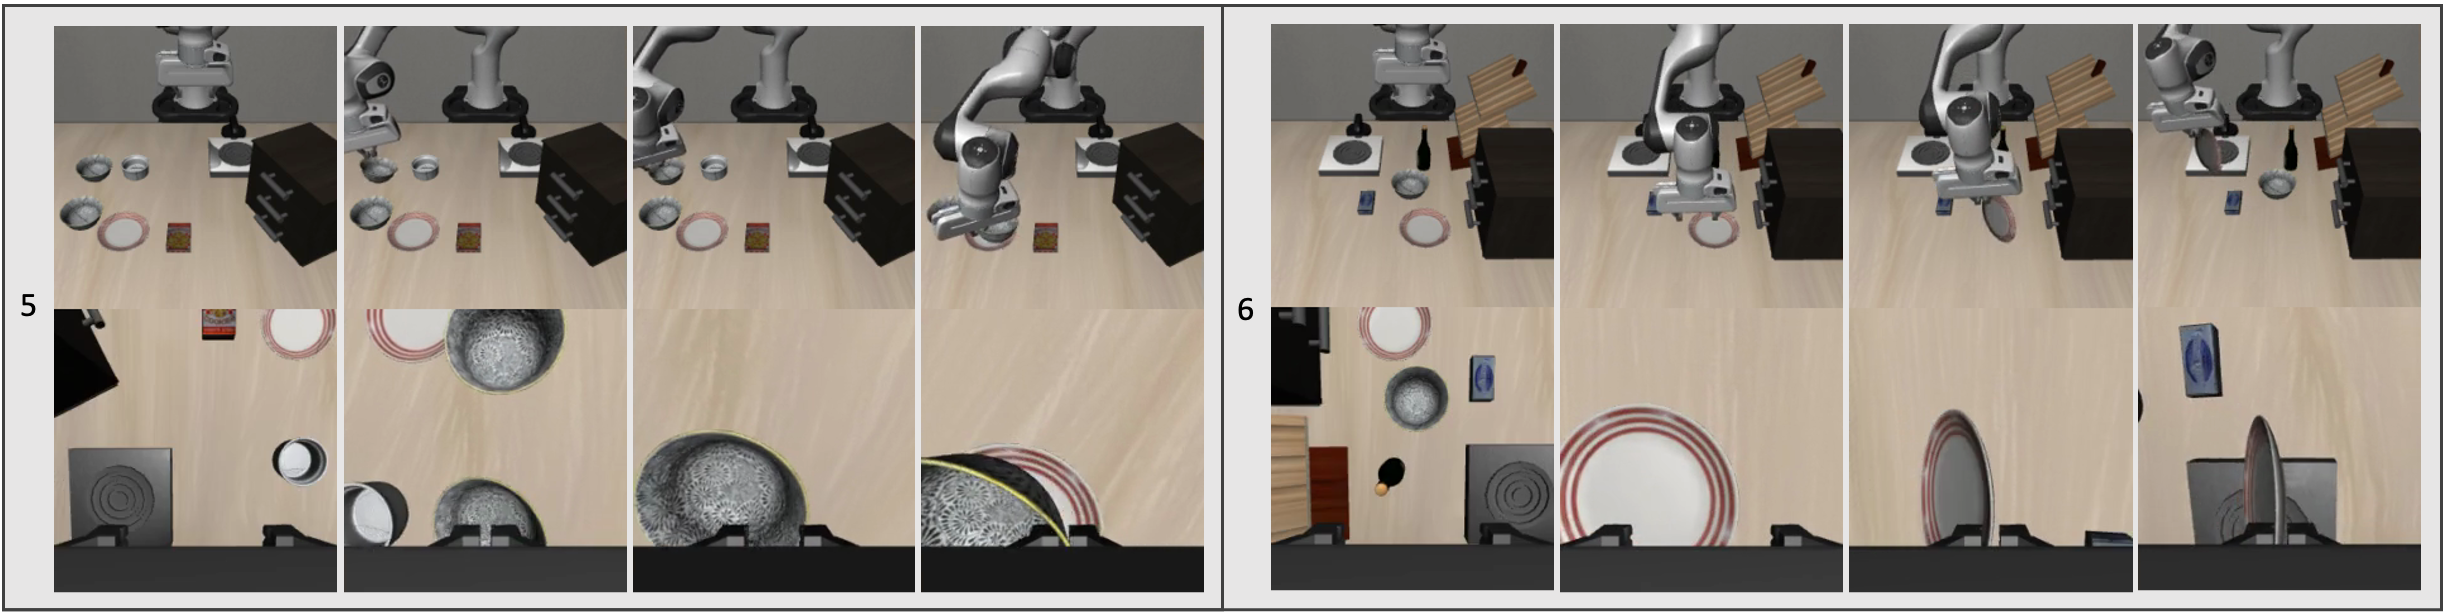
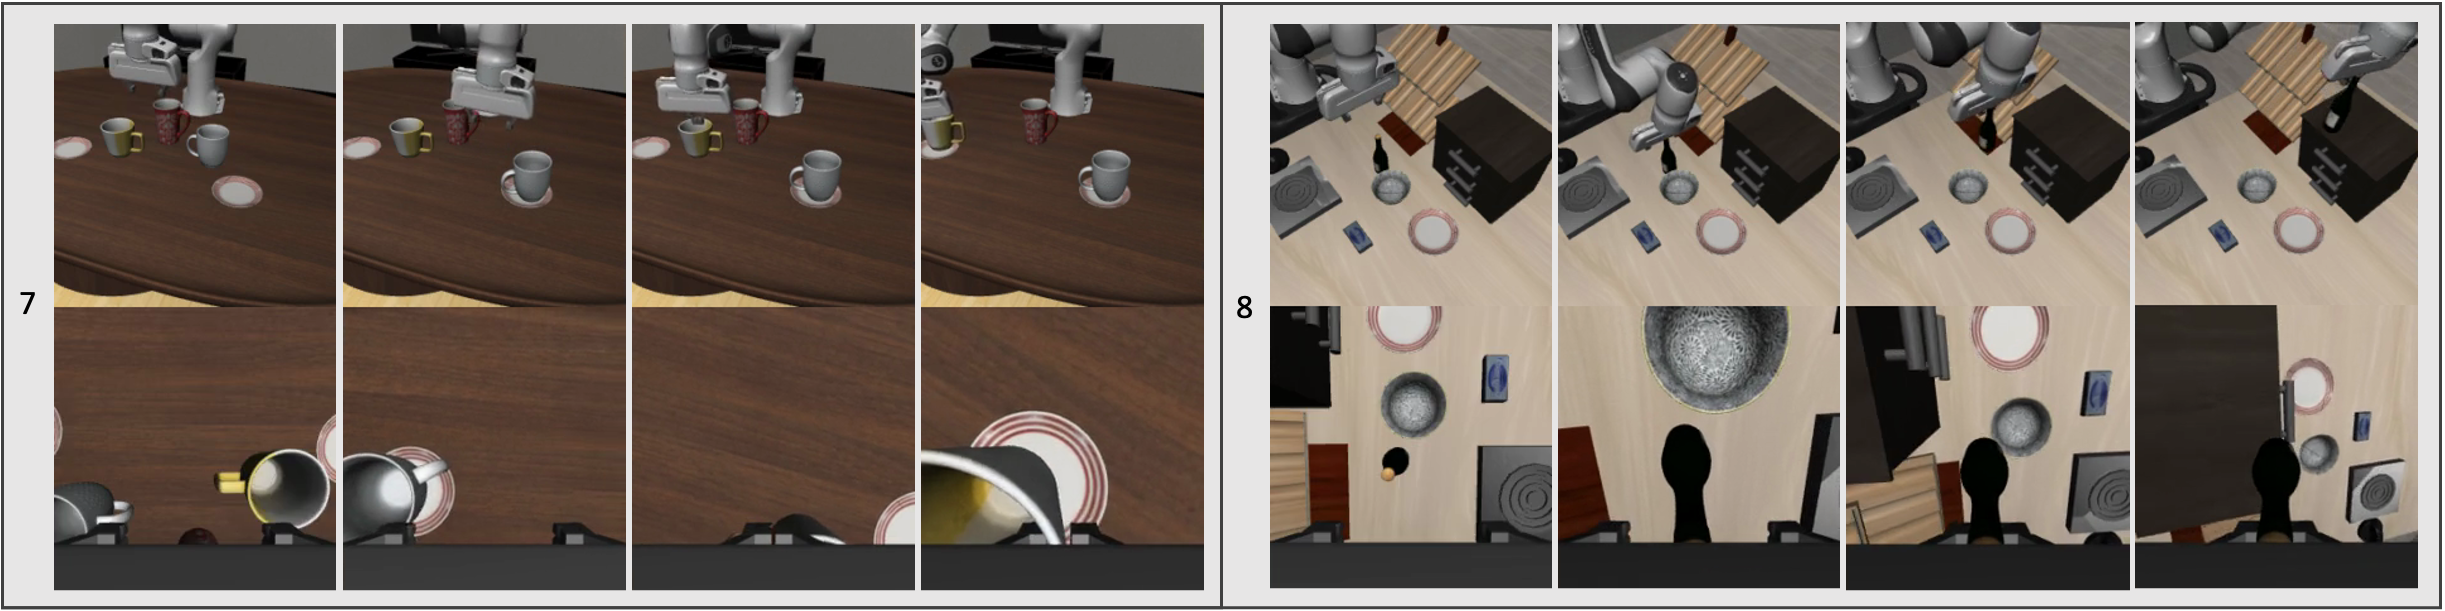
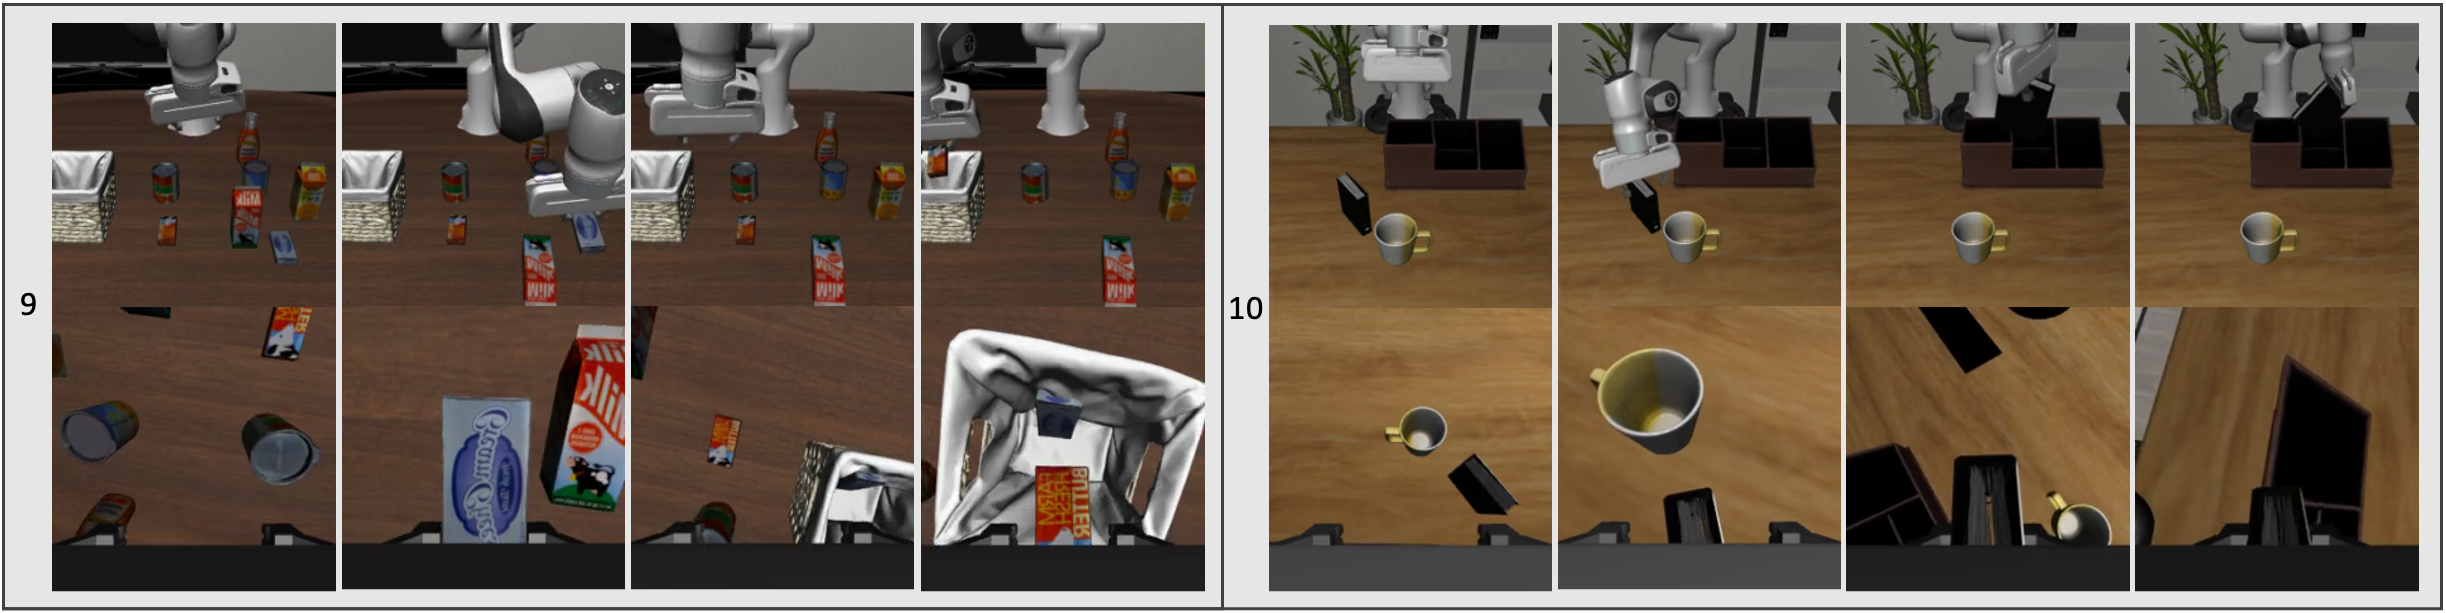
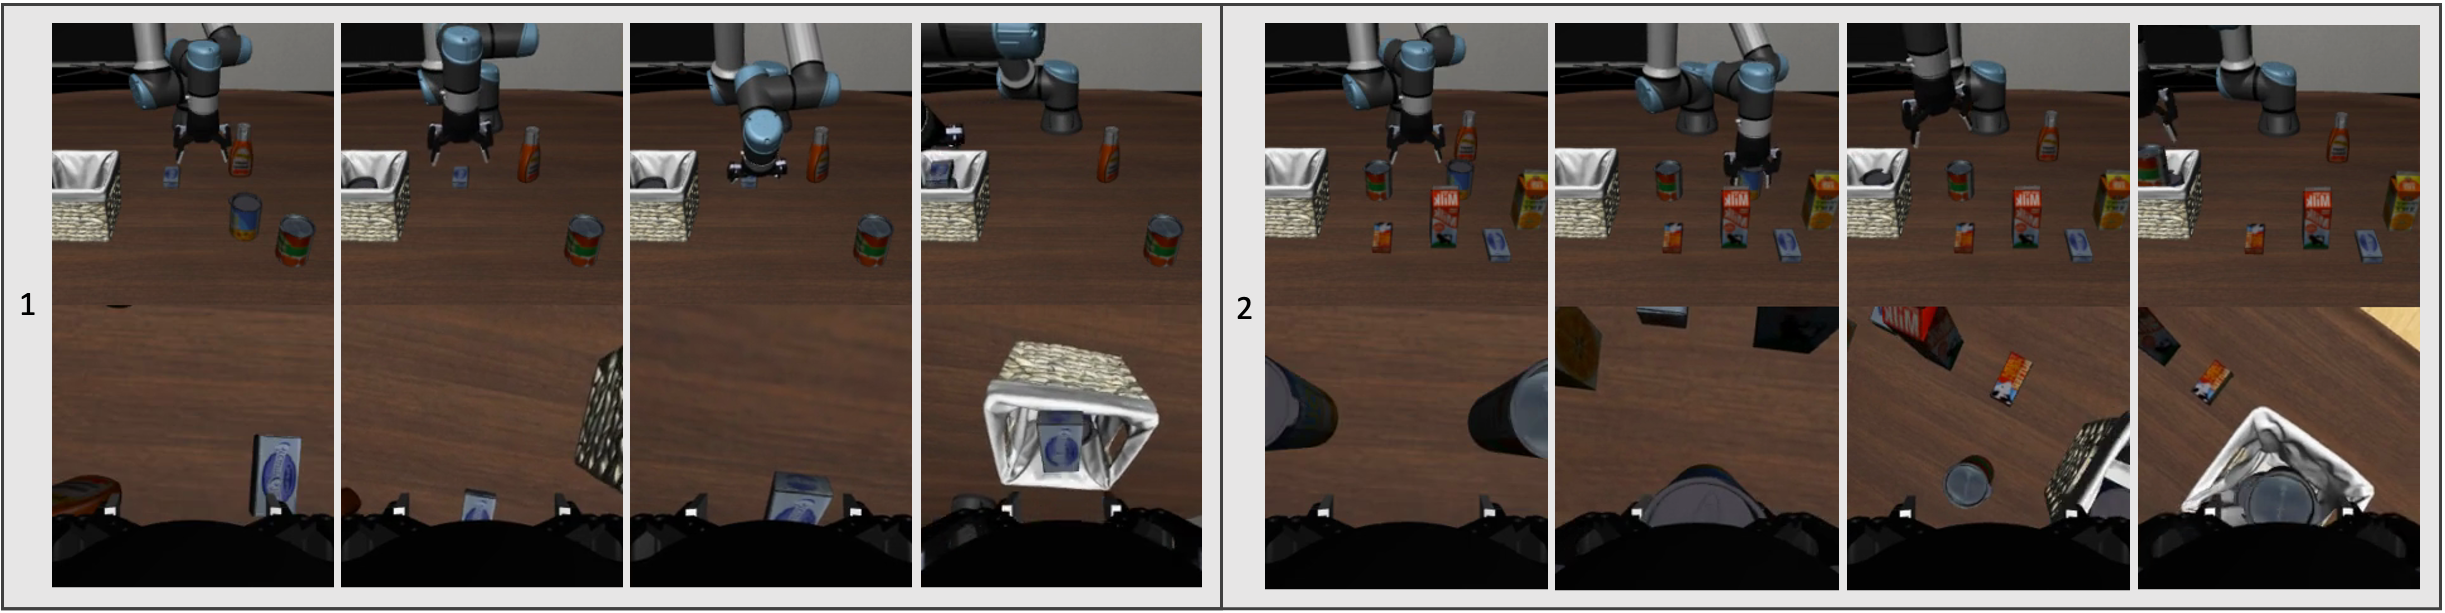
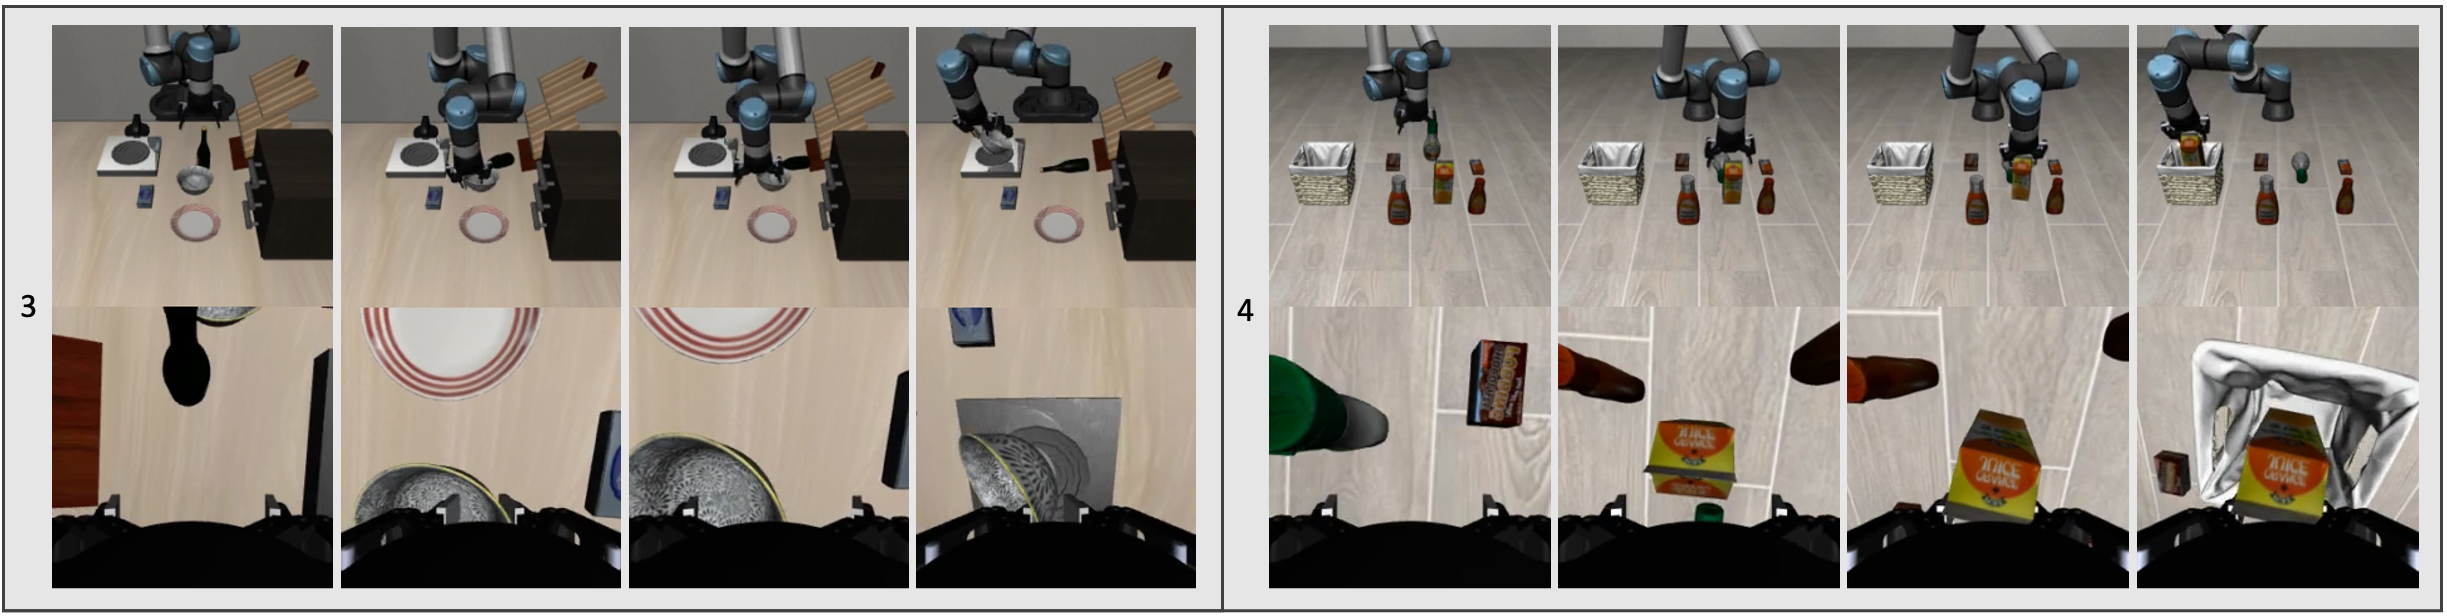
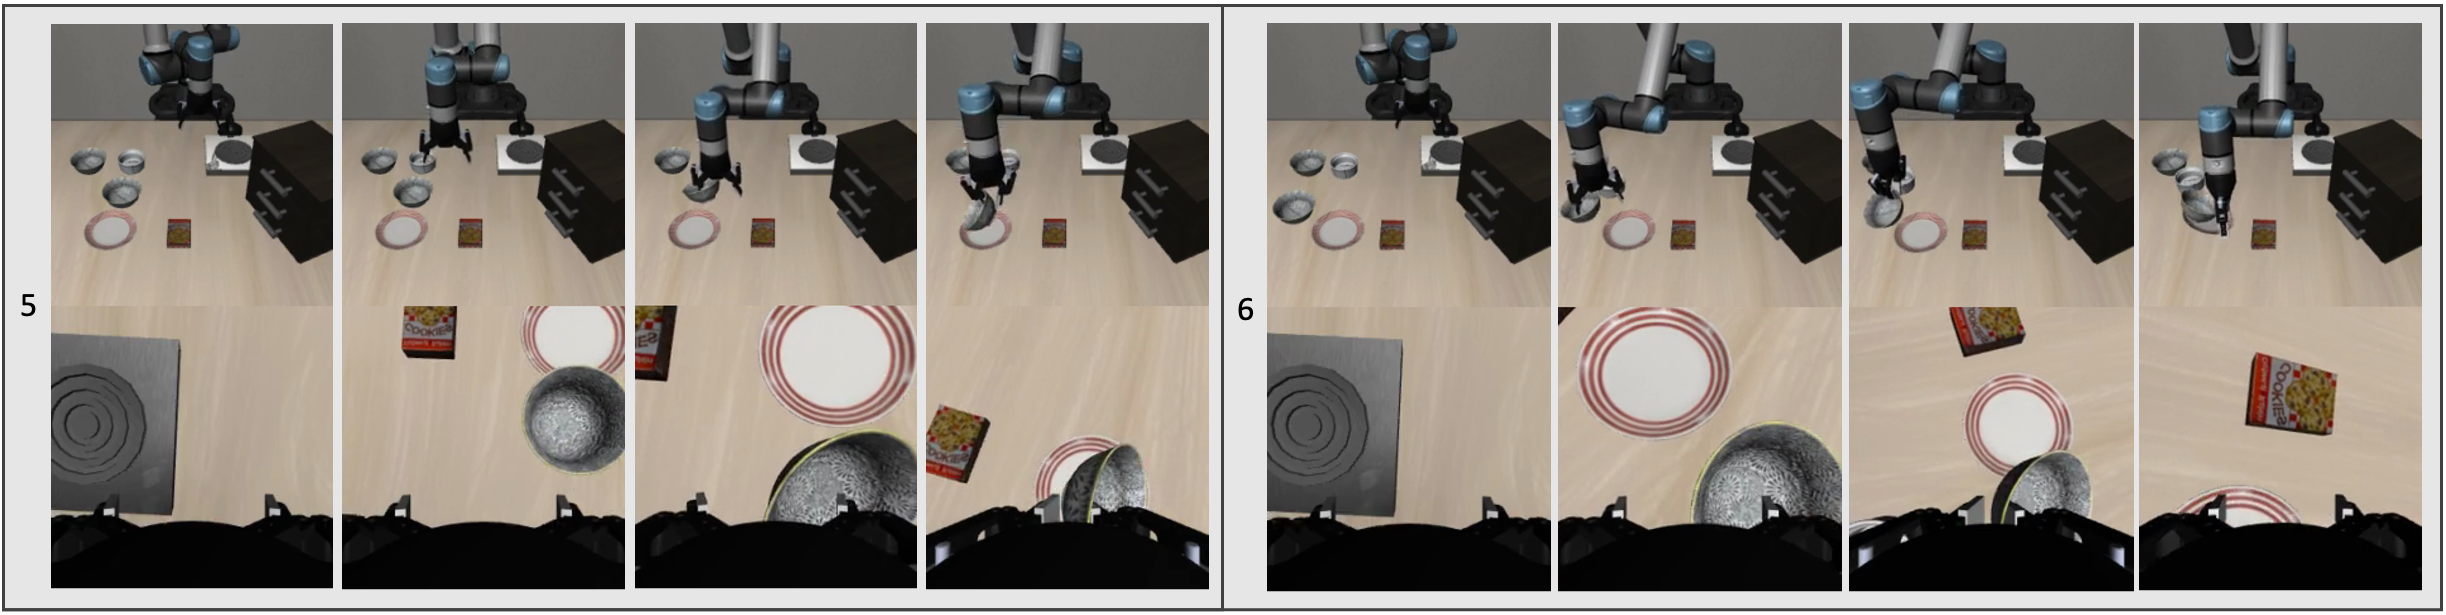
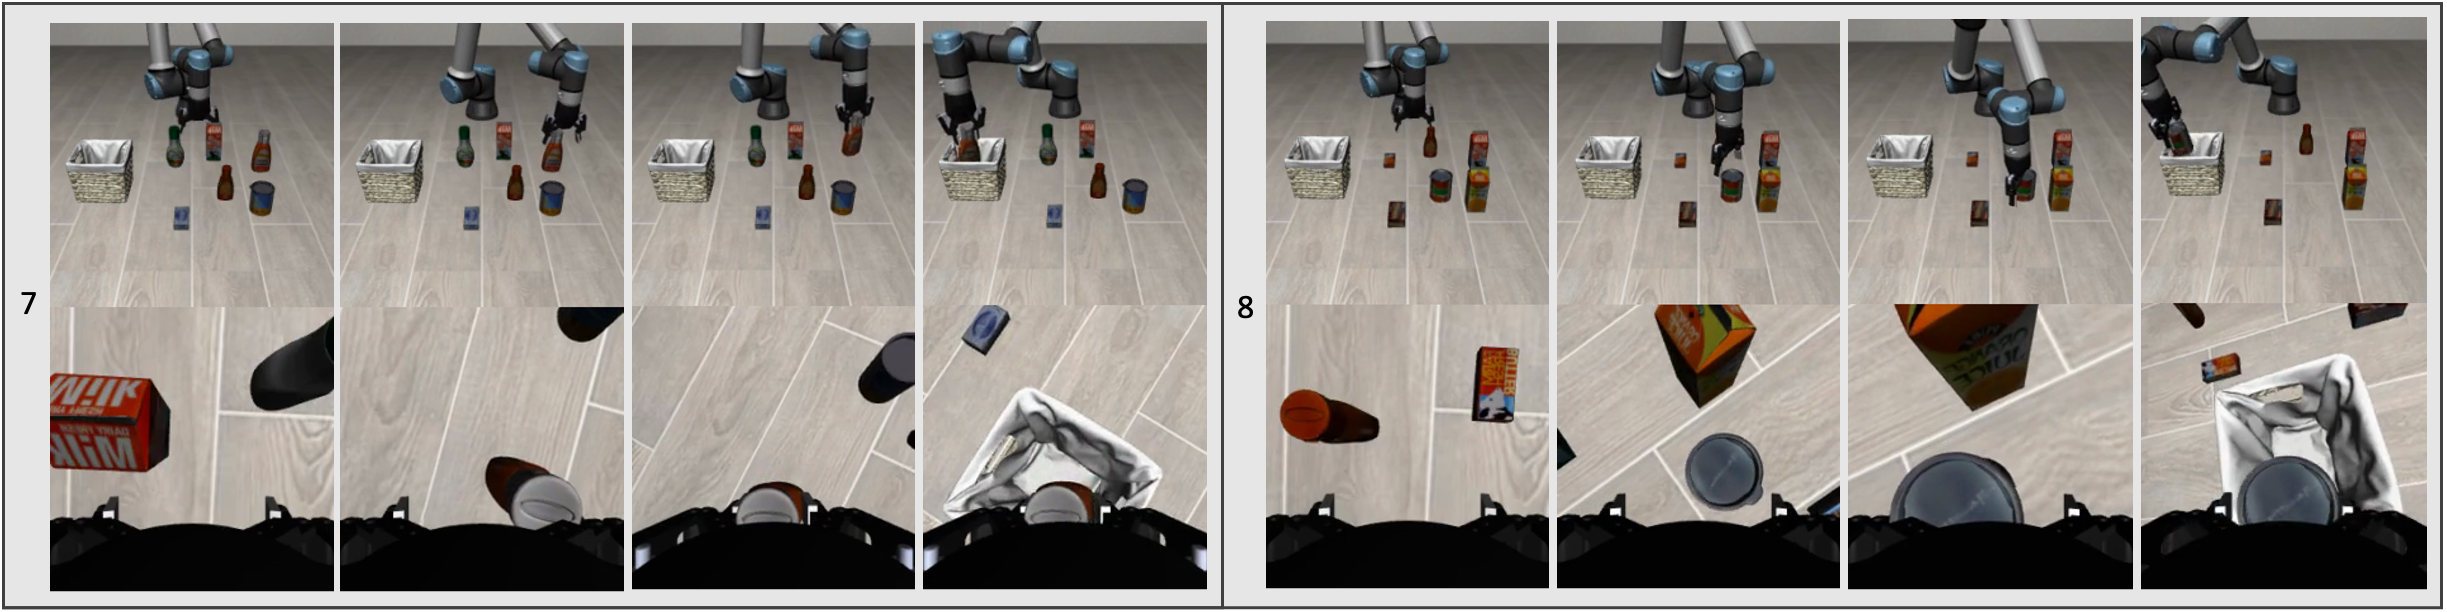
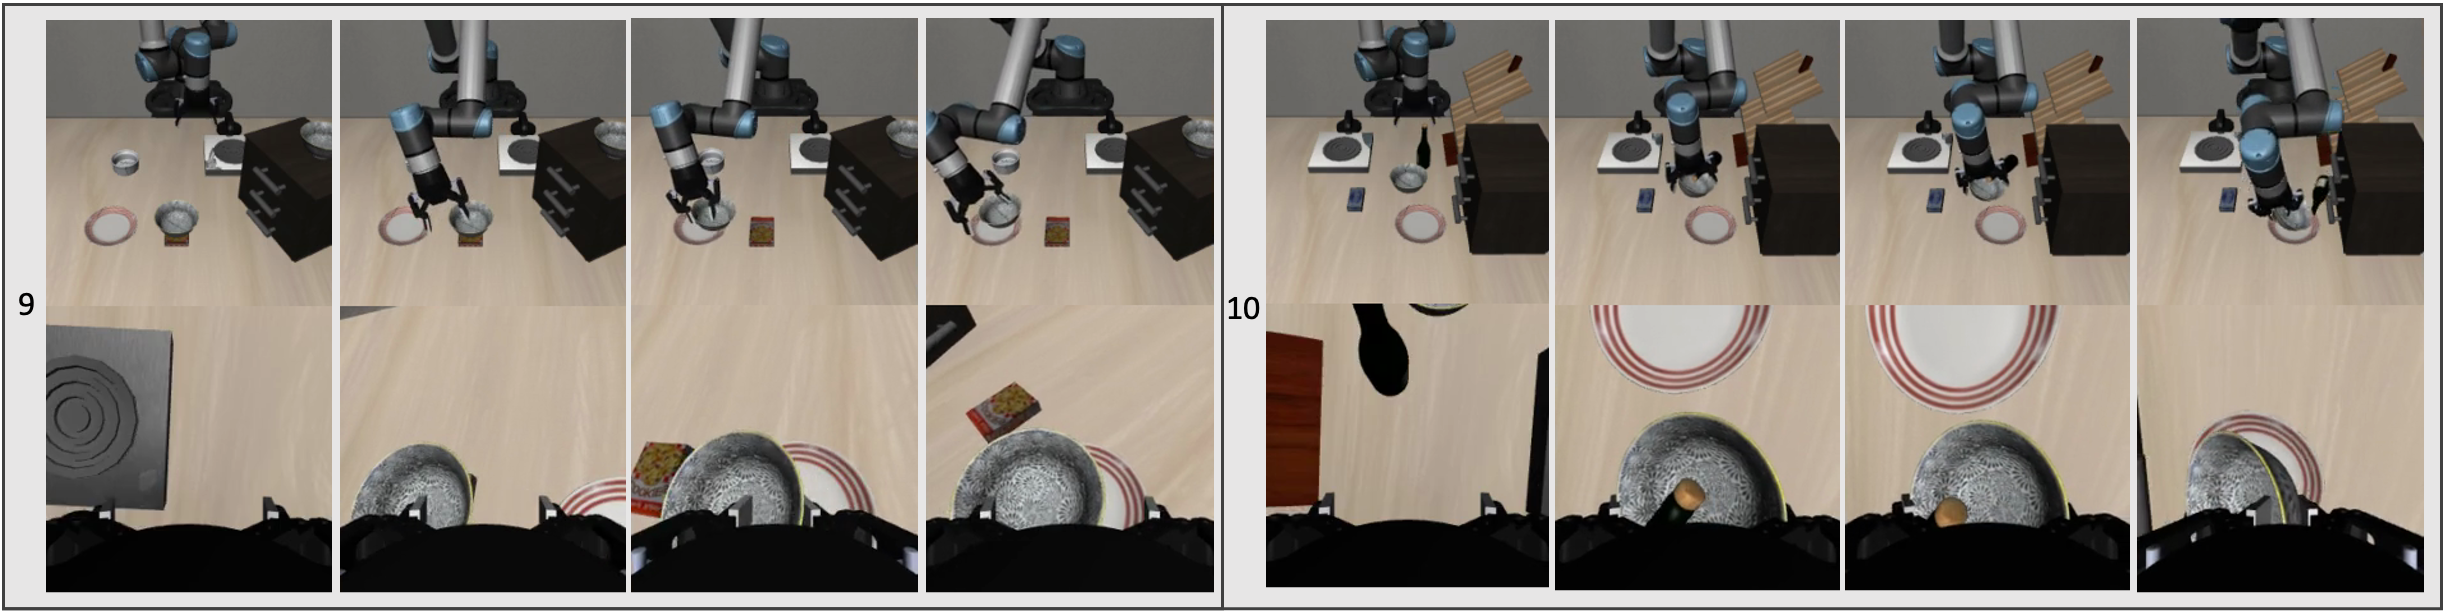
F.2 Per-Task LIBERO-INTEGRAL Results
TrAct is best or tied best on eighteen of twenty tasks. It is worse than action-conditioned selection for ketchup pickup and for the bowl-on-cookies-box case. These exceptions qualify the aggregate generalization benefit and show that improved world modeling does not guarantee improvement on every action-selection problem.
| Task | Var. | VLAT | VLAT+AWM | TrAct | |
|---|---|---|---|---|---|
| Pick the alphabet soup and place it in the basket | Swap | 0.4 | 0.5 | 0.7 | 0.7 |
| Put both the cream cheese box and the butter in the basket | Swap | 0.4 | 0.5 | 0.6 | 0.6 |
| Put both moka pots on the stove | Object | 0.5 | 0.5 | 0.6 | 0.7 |
| Put the yellow and white mug in the microwave and close it | Object | 0.2 | 0.3 | 0.4 | 0.5 |
| Pick the akita black bowl next to the ramekin and place it on the plate | Task | 0.1 | 0.3 | 0.5 | 0.5 |
| Put the plate on the stove | Task | 0.2 | 0.4 | 0.5 | 0.5 |
| Put the white mug on the left plate and put the yellow and white mug on the right plate | Camera | 0.4 | 0.3 | 0.3 | 0.5 |
| Put the wine bottle on the top of the drawer | Camera | 0.5 | 0.6 | 0.6 | 0.7 |
| Put both the cream cheese box and the butter in the basket | RobotInit | 0.4 | 0.5 | 0.5 | 0.6 |
| Pick up the book and place it in the back compartment of the caddy | RobotInit | 0.5 | 0.6 | 0.6 | 0.7 |
| Put both the alphabet soup and the cream cheese box in the basket | UR5 | 0.1 | 0.2 | 0.2 | 0.3 |
| Put both the alphabet soup and the tomato sauce in the basket | UR5 | 0.3 | 0.6 | 0.6 | 0.7 |
| Put the bowl on the stove | UR5 | 0.2 | 0.3 | 0.3 | 0.5 |
| Pick the orange juice and place it in the basket | UR5 | 0.0 | 0.3 | 0.4 | 0.5 |
| Pick the akita black bowl between the plate and the ramekin and place it on the plate | UR5 | 0.1 | 0.5 | 0.5 | 0.6 |
| Pick the akita black bowl next to the plate and place it on the plate | UR5 | 0.1 | 0.3 | 0.3 | 0.5 |
| Pick the ketchup and place it in the basket | UR5 | 0.0 | 0.1 | 0.2 | 0.1 |
| Pick the tomato sauce and place it in the basket | UR5 | 0.0 | 0.2 | 0.2 | 0.2 |
| Pick the akita black bowl on the cookies box and place it on the plate | UR5 | 0.5 | 0.9 | 0.9 | 0.8 |
| Put the bowl on the plate | UR5 | 0.4 | 0.8 | 0.8 | 0.8 |
| Average | – | 0.27 | 0.44 | 0.49 | 0.55 |
F.3 Statistical Robustness and Candidate Scaling
The additional analyses keep trained models fixed while varying evaluation randomness or the number of candidate proposals.
Multiple Seeds.
Across three evaluation seeds, action-conditioned selection averages 0.490 with standard error 0.006, and TrAct averages 0.547 with standard error 0.003. The source reports nonoverlapping 95% intervals of [0.47, 0.51] and [0.53, 0.56]. These are intervals over a small number of evaluation seeds with fixed checkpoints; they do not include training randomness or validate the physical result statistically.
Number of Sampled Candidates.
Five, ten, and twenty candidates yield 0.52, 0.54, and 0.55 average success. The smaller candidate set retains most of the measured benefit, but no matching latency measurements are provided for those three settings. The main simulation score uses twenty candidates.
Appendix G Larger Pretraining Mixture Experiments
The final appendix tests a larger pretraining configuration on a selected difficult subset rather than the entire benchmark.
| Task | TrAct | TrAct+ | |
|---|---|---|---|
| Put both the alphabet soup and the cream cheese box in the basket (UR5) | 0.1 | 0.3 | 0.3 |
| Pick the ketchup and place it in the basket (UR5) | 0.0 | 0.1 | 0.2 |
| Put the bowl on the stove (UR5) | 0.2 | 0.5 | 0.6 |
| Pick the orange juice and place it in the basket (UR5) | 0.0 | 0.5 | 0.5 |
| Pick the tomato sauce and place it in the basket (UR5) | 0.0 | 0.2 | 0.3 |
| Average | 0.06 | 0.32 | 0.38 |
Larger Pretraining Mixture.
TrAct+ adds sixty thousand BridgeData V2 trajectories and expands EgoDex from 150,000 to about 300,000 clips. It also doubles steps to sixty thousand and batch size to 128 on eight H100s, so data diversity and optimization budget change together. On five UR5 tasks selected because the original model performs poorly, average success rises from 0.32 to 0.38. This is subset evidence for the larger configuration, not an isolated data-scaling effect or a full-benchmark 38% score.