Overview
At a glance
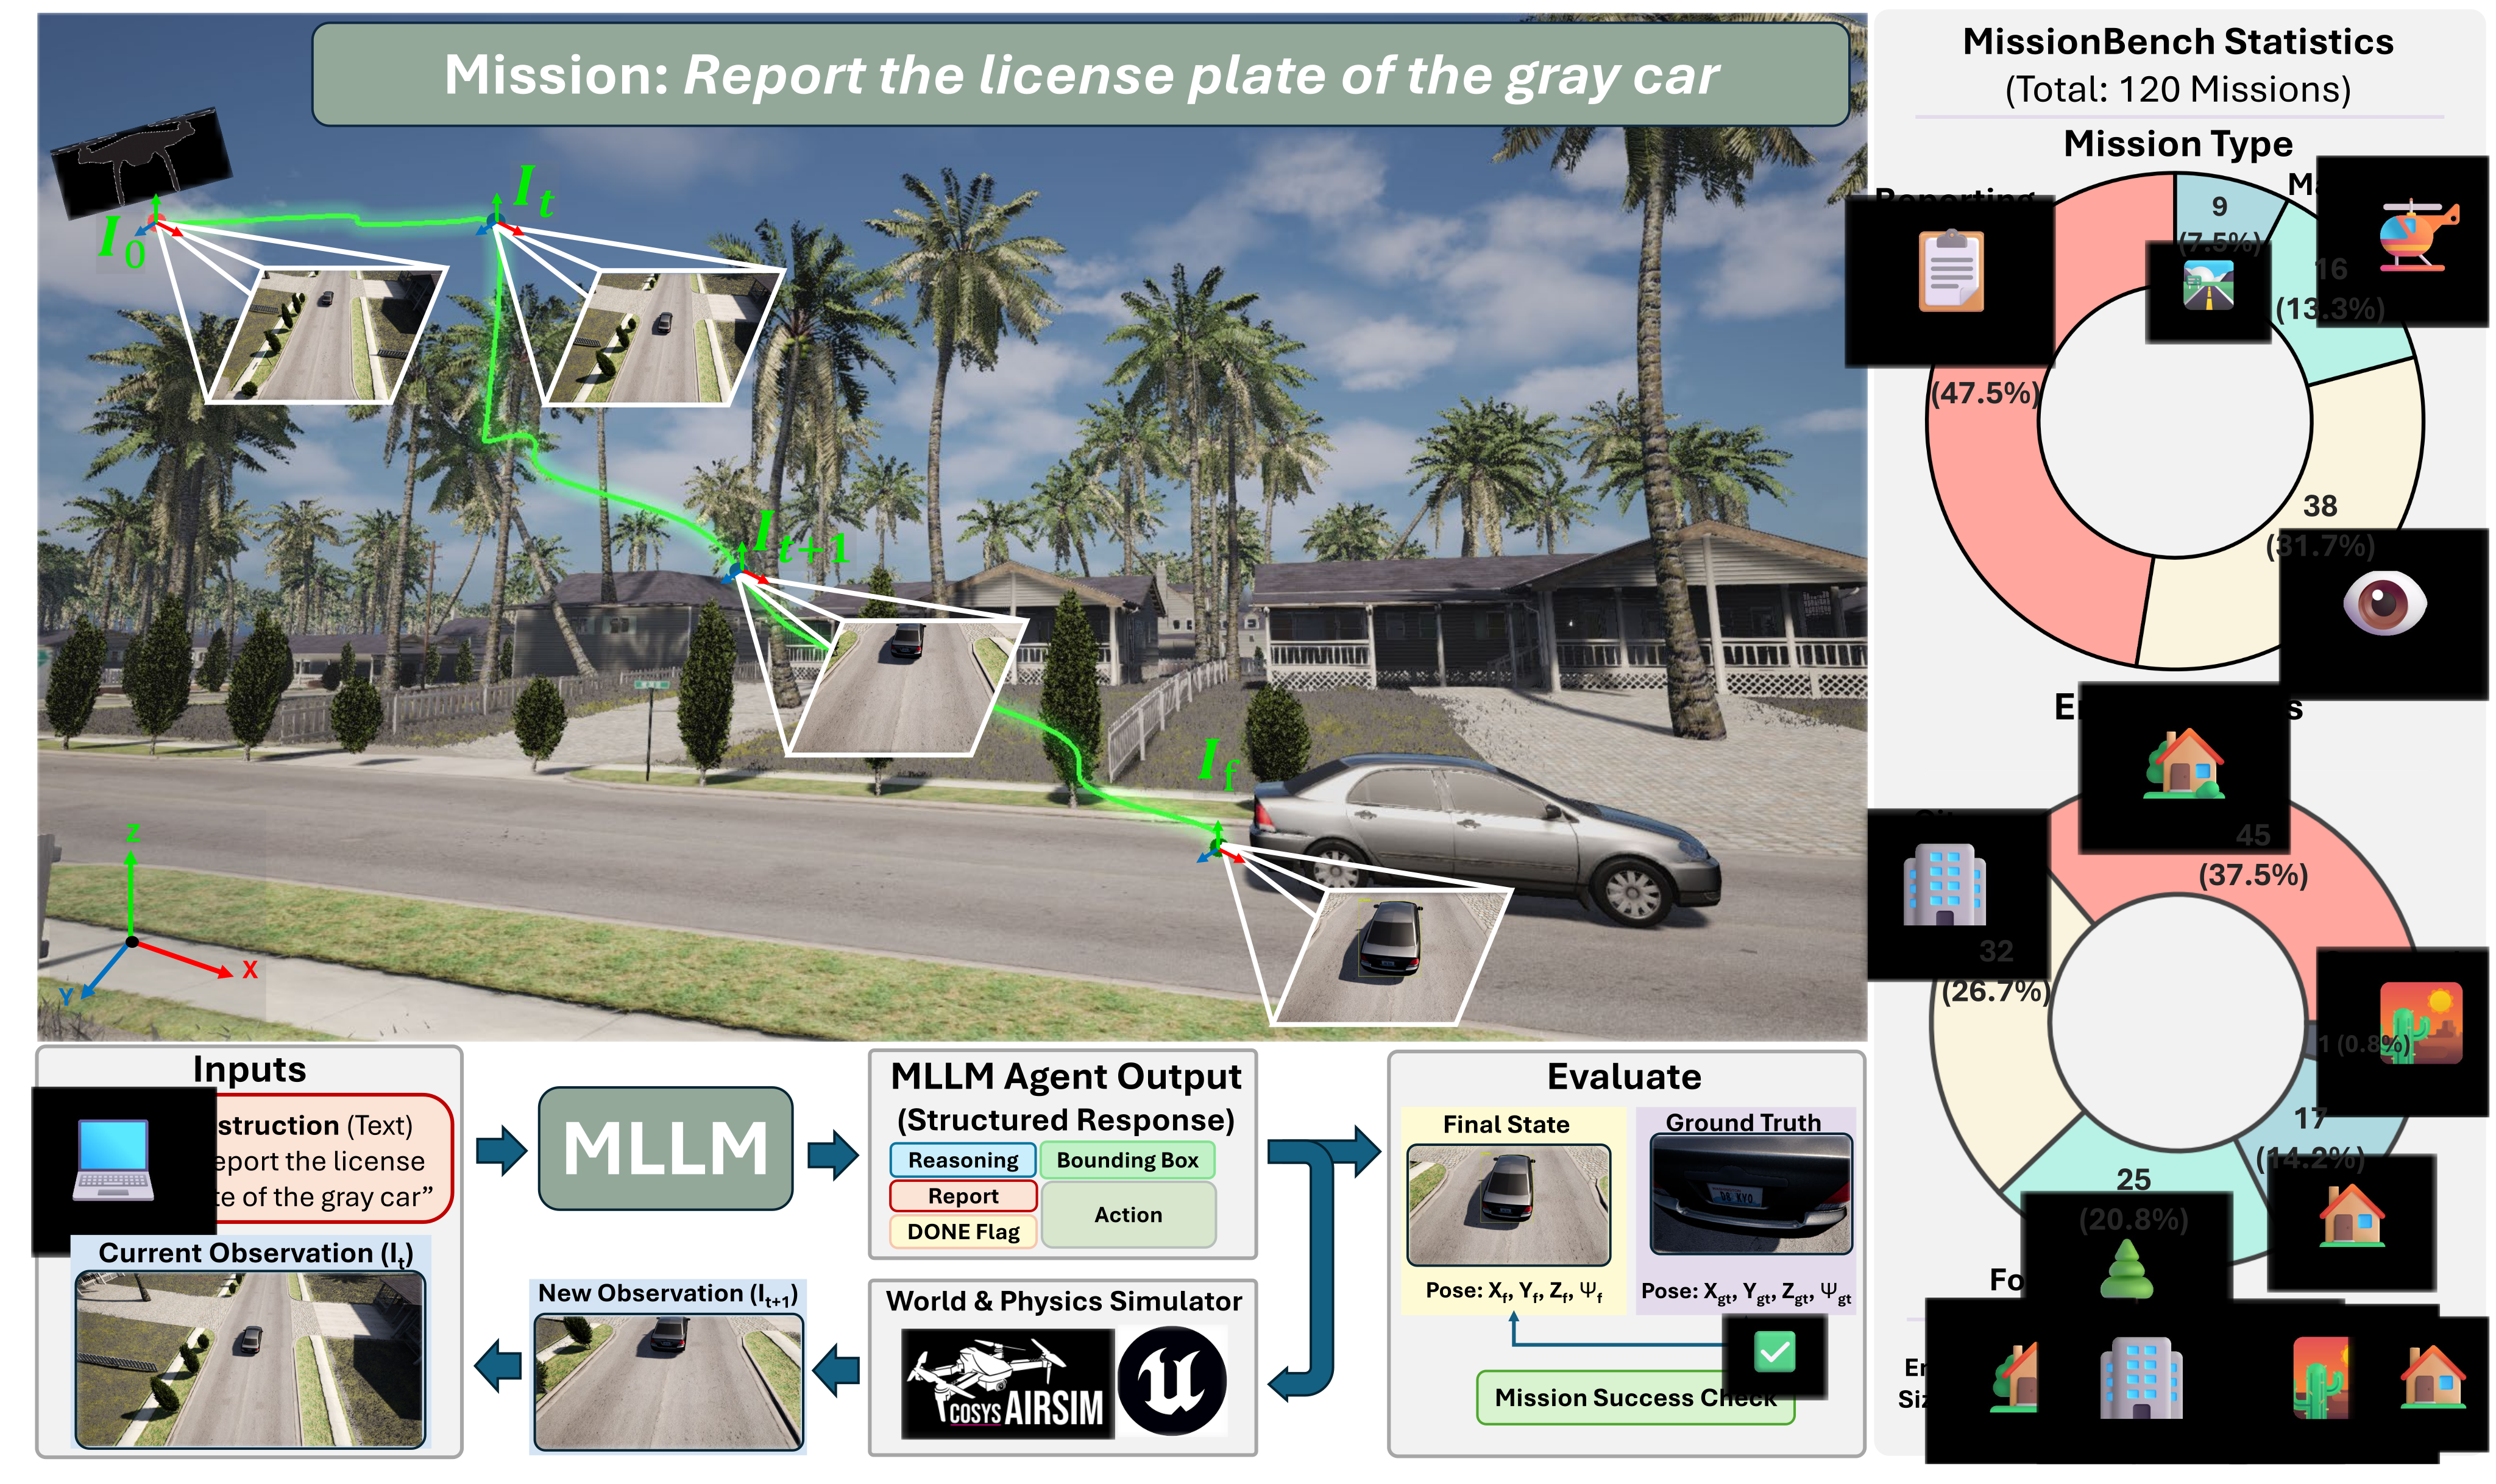
This edition covers the complete twenty-five-page v1, including all five figures, eleven numbered tables, the patrol-overlap equation and four complete prompts. MissionBench contains 120 simulated aerial missions; the main experiment tests twenty-two frozen multimodal models on thirty missions, repeated three times.
Gemini 3.1 Pro leads at the reported 34.8% success, versus 70.0% for two humans using the model interface and 84.4% for three humans using continuous keyboard control. These small simulated evaluations show a substantial execution gap. They do not establish real flight readiness or evaluate all 120 missions with every model.
The benchmark couples visual navigation, viewpoint selection, reporting and stopping. Its detailed prompts also supply current pose and task-dependent movement limits; “RGB-only” therefore does not mean images are the agent’s only state information.
1 Introduction
A high-level mission such as reading a license plate requires the agent to decide how to approach, orient, extract information and stop. Route-following accuracy alone cannot measure that complete sequence. MissionBench targets frozen general-purpose models without aerial fine-tuning, using continuous action magnitudes within a restricted primitive vocabulary.
Four task families broaden evaluation beyond navigation. Comparisons across model sizes and versions are observational: training data, architecture, inference settings and prompting also vary, so the results do not isolate scaling as a causal mechanism.
2 Related Work
Original selectable table
Benchmark
Paradigm
RGB-only
Action
DOF
Pose
Success
Rep
Insp
Manip
Patrol
Simulator
AerialVLN
Route
✗
Disc.
4
✗
Dist.
✗
✗
✗
✗
AirSim + UE4
AVDN
Route
✓
Wpt.
3
✗
Dist.
✗
✗
✗
✗
xView
OpenUAV
Route
✗
Wpt.
6
✗
Dist.
✗
✗
✗
✗
AirSim + UE4
OpenFly
Route
✓
Disc.
4
✗
Dist.
✗
✗
✗
✗
AirSim + UE, GTAV,
GEarth, 3DGS
CityNav
Goal
✗
Disc.
4
✗
Dist.
✗
✗
✗
✗
SensatUrban + Potree
FlySearch
ObjNav
✓
Cont.
3
✗
Dist.
✗
✗
✗
✗
UnrealCV + UE5
UAV-ON
ObjNav
✗
Cont.
4
✗
Dist.
✗
✗
✗
✗
AirSim + UE
ESARBench
Mission ✗
Disc./Wpt.
4
✗
Mission
✗
✓
✗
✗
AirSim + UE5
BEDI
Mission ✓
Disc./Wpt.
4
✓
Hierarch.
✗
✓
✓
✗
AirSim + UE4
MissionBench
(Ours) Mission
✓
Cont.
4
✓
Mission
✓
✓
✓
✓
UE5 + CosysAirSim
Frozen MLLMs as Embodied Reasoning Agents.
Systems such as SayCan, PaLM-E and See-Point-Fly ground language or visual reasoning in robot actions. MissionBench contributes a shared evaluation of frozen aerial agents, rather than a new trained controller or a claim that prior planners cannot perform missions.
Aerial Vision-Language Benchmarks.
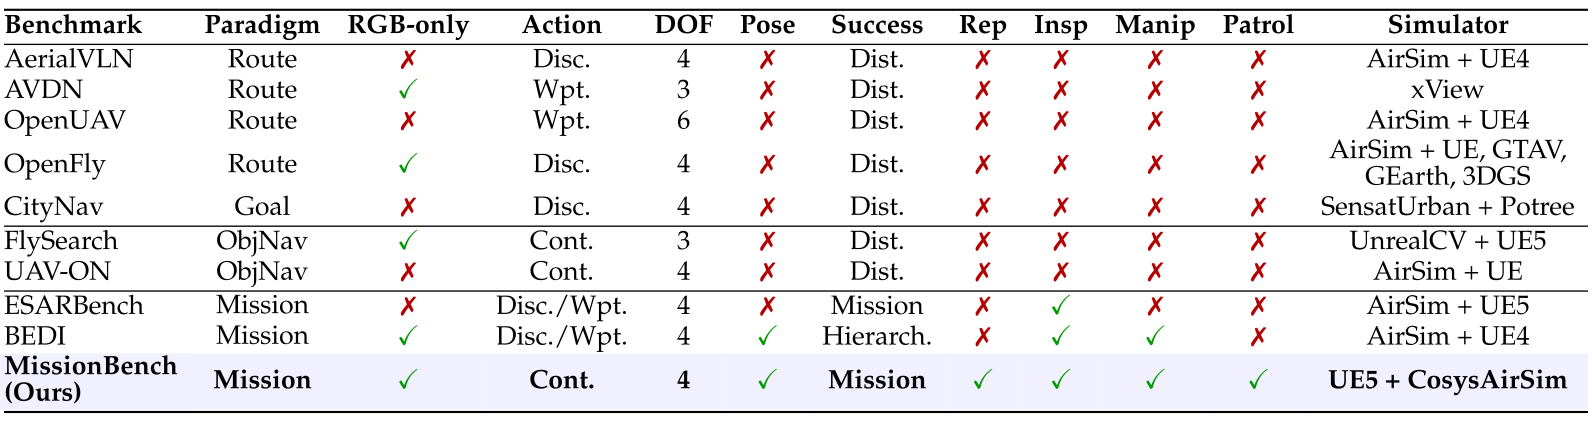
AerialVLN, CityNav and OpenFly emphasize navigation, while ESARBench and BEDI already consider broader mission structures. Table 1 positions this benchmark by jointly comparing observation assumptions, control degrees of freedom, task types and success criteria.
Beyond aerial navigation.
Static spatial tests reveal localization and depth errors but do not measure how errors compound over a feedback loop. MissionBench adds a sequential test, while its own ten-image perception proxy remains too limited to comprehensively diagnose every perceptual bottleneck.
3 MissionBench
3.1 Task Formulation
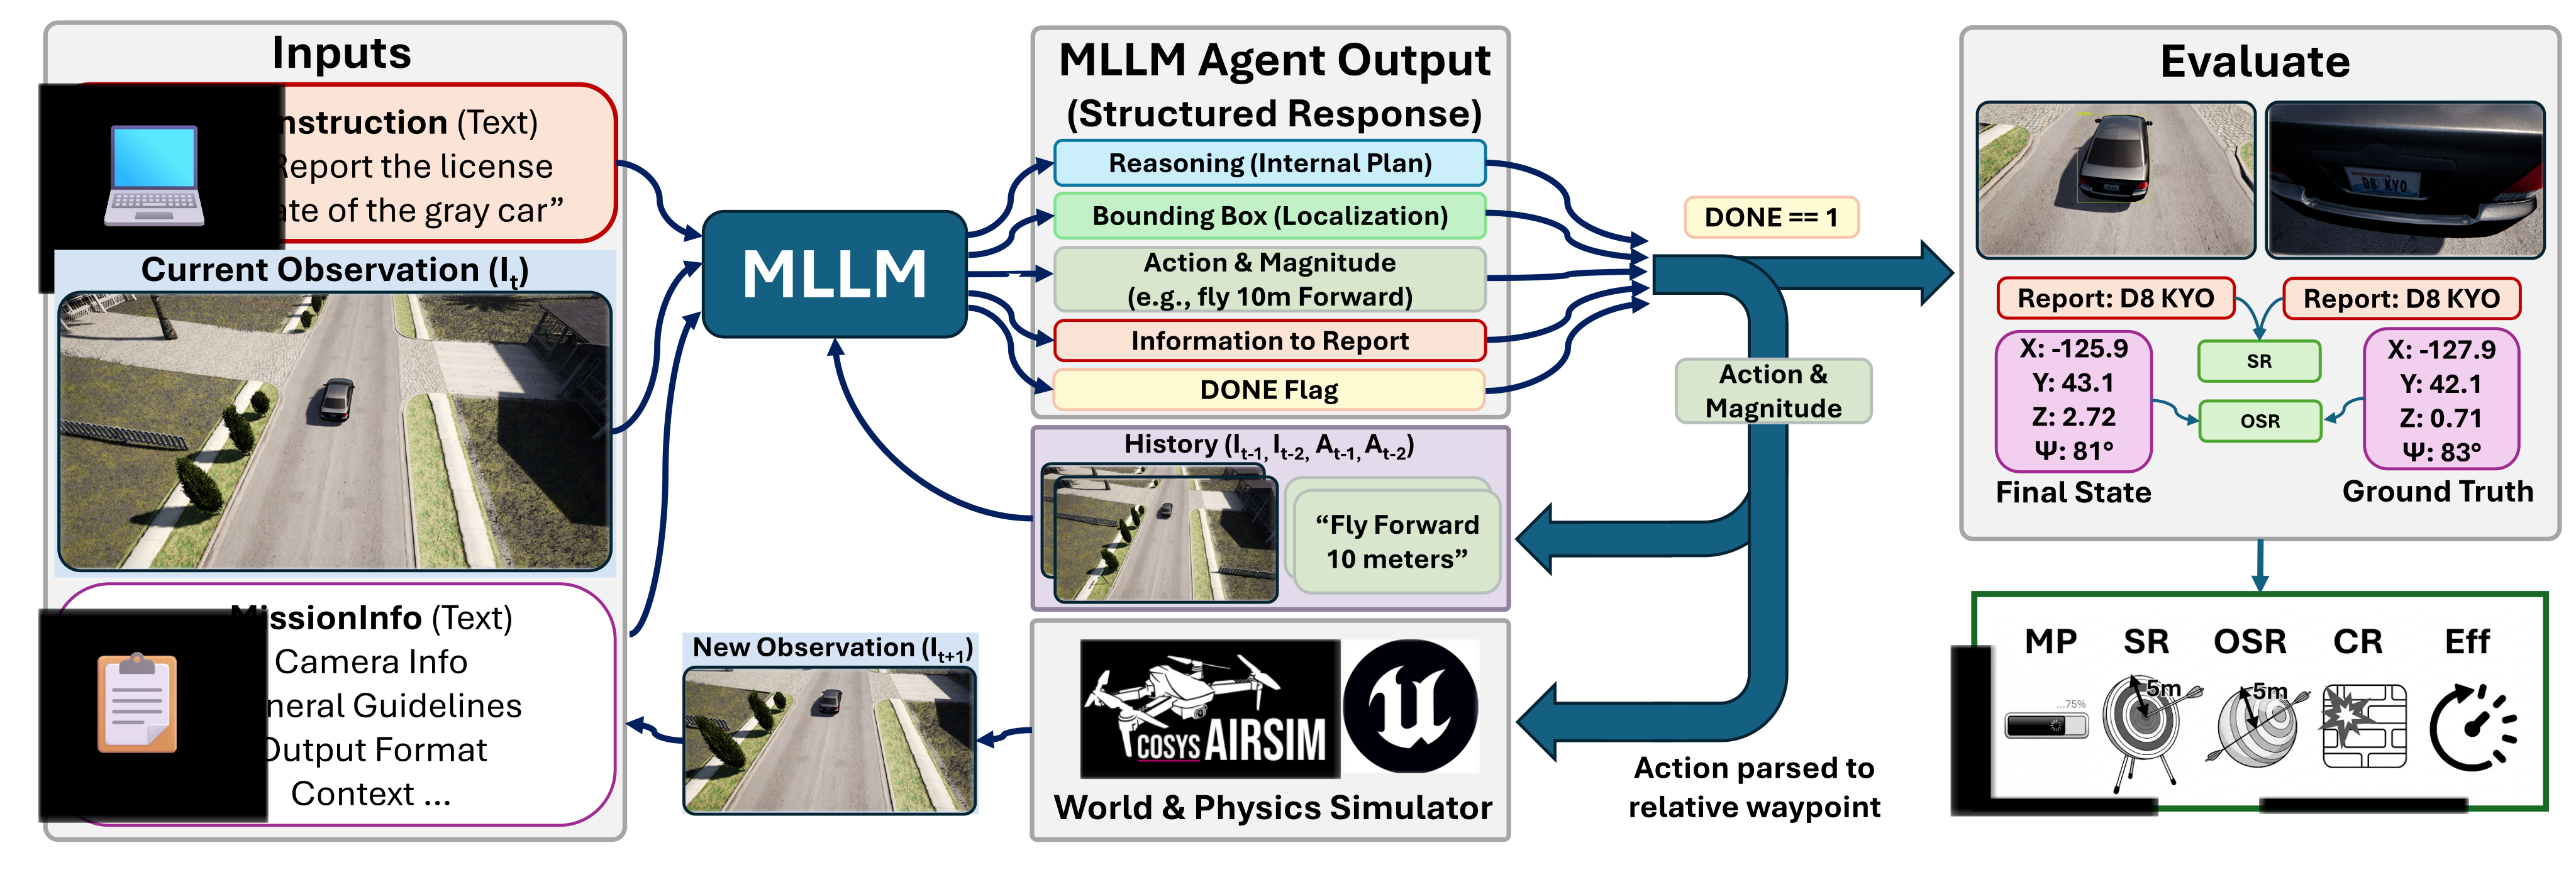
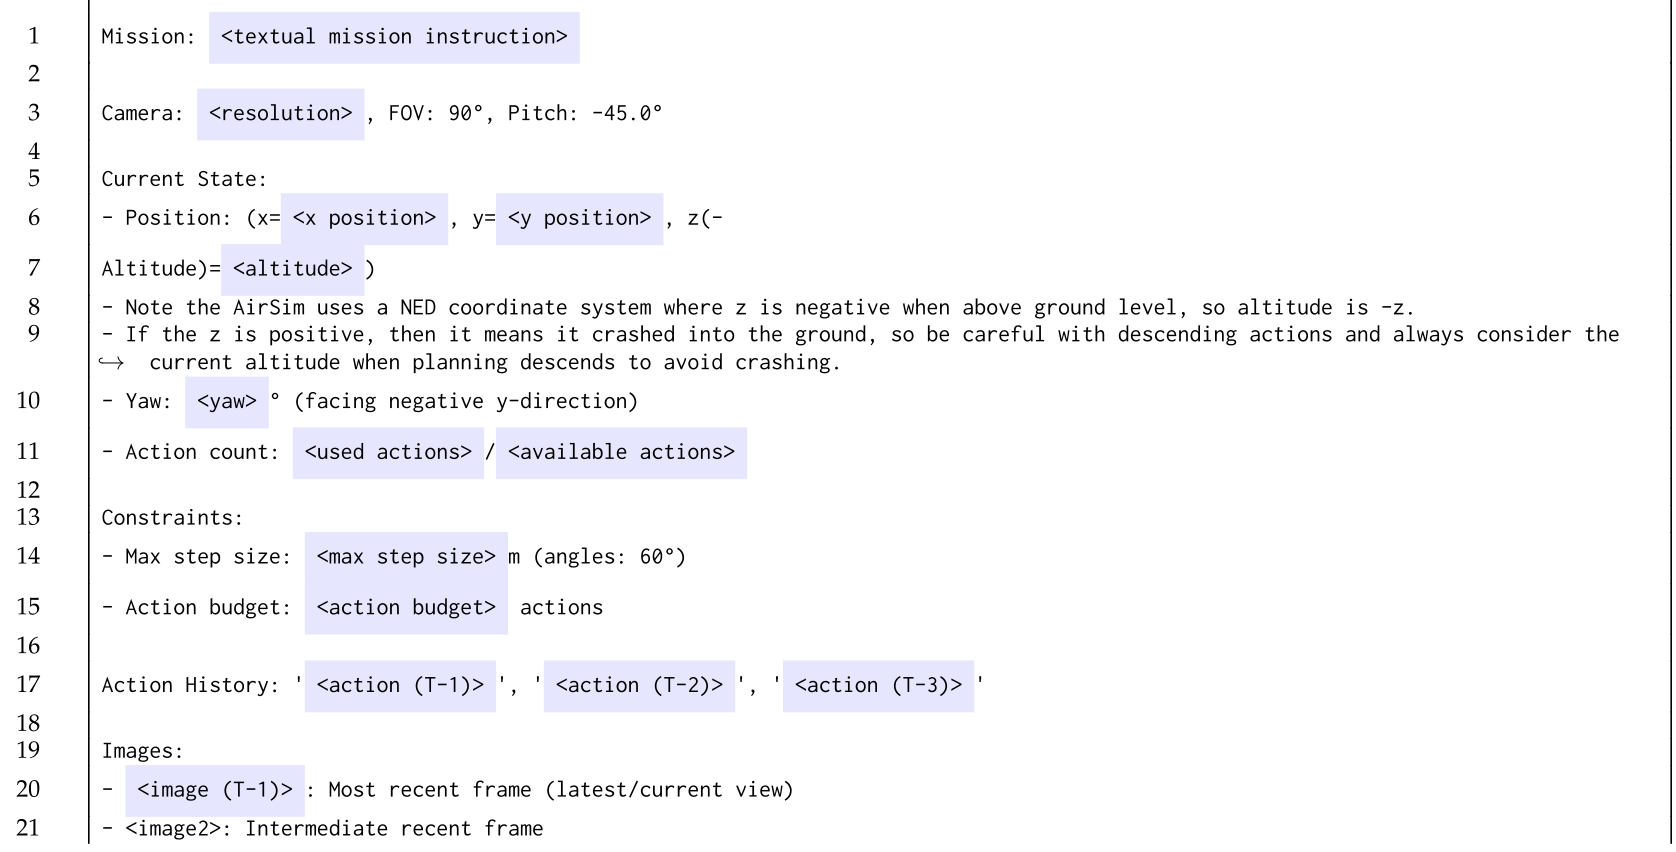
The agent receives a mission, current RGB frame, recent frames and action history, then produces a target box, explanation, relative action with magnitude, optional report and completion signal. Eight primitives cover forward/backward, lateral/vertical translation and left/right yaw; a simulator executes each command as a waypoint. This is four-degree-of-freedom high-level control, not direct motor control.
The appendix’s actual prompt also supplies current x/y/z, yaw, camera geometry and remaining actions. Boxes and explanations guide generation but are not directly scored. The loop stops at completion or the step budget; collisions are recorded without automatically ending it.
3.2 Mission Types
Reporting requires extracting information, inspection requires reaching a suitable view, manipulation adds a task-specific completion action, and patrol requires covering a route. Starts reveal at least part of the relevant object or region, so the benchmark focuses on approach and completion rather than unconstrained target discovery.
For manipulation, the supplied prompt marks an adequately positioned delivery with task_gt: drop and navigation done. The paper does not establish a separate payload-manipulation controller’s physical reliability; this task family should be interpreted within its simulator/interface definition.
3.3 Benchmark Construction
Simulation Suite.
The suite combines Unreal Engine 5 with Cosys-AirSim across Neighborhood, City, Forest, Savannah and AirSimNH. Natural and urban imagery vary, but the principal thirty-mission test covers only Neighborhood, Forest and City.
Mission Definition.
Authors manually design missions, place relevant assets and choose a fixed partly informative start. Reference route lengths span 13–4,171 m, with median 93 m and mean 260 m. Several reviewers check solvability and plausible operator instructions. These curated starts and hand-built objectives limit conclusions about arbitrary new missions or search from an unseen target location.
Ground-Truth Acquisition.
A human pilot records a feasible trajectory and terminal pose for each mission, with expected textual reports annotated afterward. References are executable examples rather than proven optimal routes. Position-based thresholds remain tied to a selected reference endpoint even when alternative viewpoints could also be useful.
3.4 Evaluation Metrics
Inspection requires final position within 5 m and yaw within 15° of the reference; manipulation adds the task-specific action. Reporting uses semantic report matching and can succeed outside 5 m. Patrol succeeds when overlap of 20 m-buffered planar routes exceeds 0.5. Thus success is deliberately heterogeneous across task families.
Oracle success records ever entering the 5 m vicinity; it is not an upper bound on reporting success. Mission progress for non-patrol tasks is max(0,Σ(d[t−1]−d[t])/d[0]), which telescopes to max(0,1−d[final]/d[0]). It measures terminal net approach, not cumulative route efficiency or proof of understanding.
Step efficiency is 1−used/budget, so early failure can score highly. Collision rate is the fraction of steps with collisions; stationary or prematurely stopped behavior can have low exposure. These metrics need joint interpretation rather than an isolated safety or competence ranking.
4 Experiments
Original selectable table
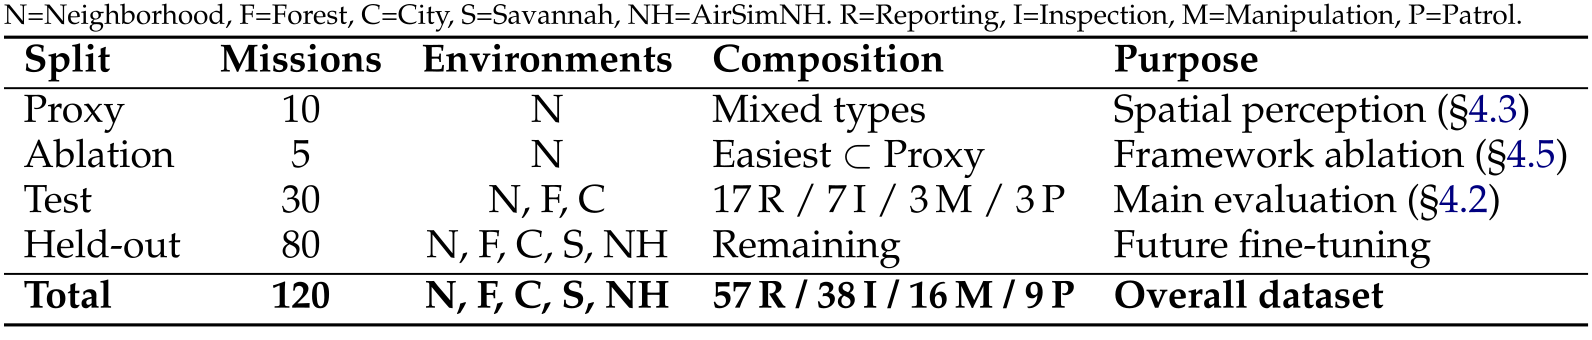
N=Neighborhood, F=Forest, C=City, S=Savannah, NH=AirSimNH. R=Reporting, I=Inspection, M=Manipulation, P=Patrol.
Split
Missions
Environments
Composition
Purpose
Proxy
10
N
Mixed types
Spatial perception (§4.3)
Ablation
5
N
Easiest Proxy
Framework ablation (§4.5)
Test
30
N, F, C
17 R / 7 I / 3 M / 3 P
Main evaluation (§4.2)
Held-out
80
N, F, C, S, NH
Remaining
Future fine-tuning
Total
120
N, F, C, S, NH
57 R / 38 I / 16 M / 9 P
Overall dataset
4.1 Experimental Setup
Model setup.
The default interface uses three recent 1920 × 1080 images, fixed−45° pitch and stated temperature 0.7. Two humans use the same constrained interface; three use continuous keyboard control. These are small participant groups with different interfaces.
Appendix D gives provider/model-specific settings, including Qwen 3.6-35B-A3B-Q8 temperature 1.0 and differing thinking levels. The experiment therefore does not enforce exactly identical decoding settings across every model.
Benchmark setup.
Patrol receives fifty actions; other missions receive twenty. Maximum translation is one quarter of the distance from start to reference final pose, and nominal rotation limit is three times that magnitude in degrees. This uses reference geometry to configure the task and communicates the resulting cap in the prompt. It is privileged benchmark setup information, not wholly unassisted visual range estimation.
Three runs are planned per model/mission. Reaching a reference endpoint quickly is not guaranteed solely by this distance-based cap when obstacles, alignment and route coverage also matter.
Dataset splits.
The 120 missions divide into ten Proxy, thirty Test and eighty Held-out missions; five easiest Proxy missions also form Ablation. Main Test contains 17 reporting,7 inspection,3 manipulation and 3 patrol tasks. Held-out is reserved for future fine-tuning rather than reported as a full evaluation here.
4.2 Performance on MissionBench
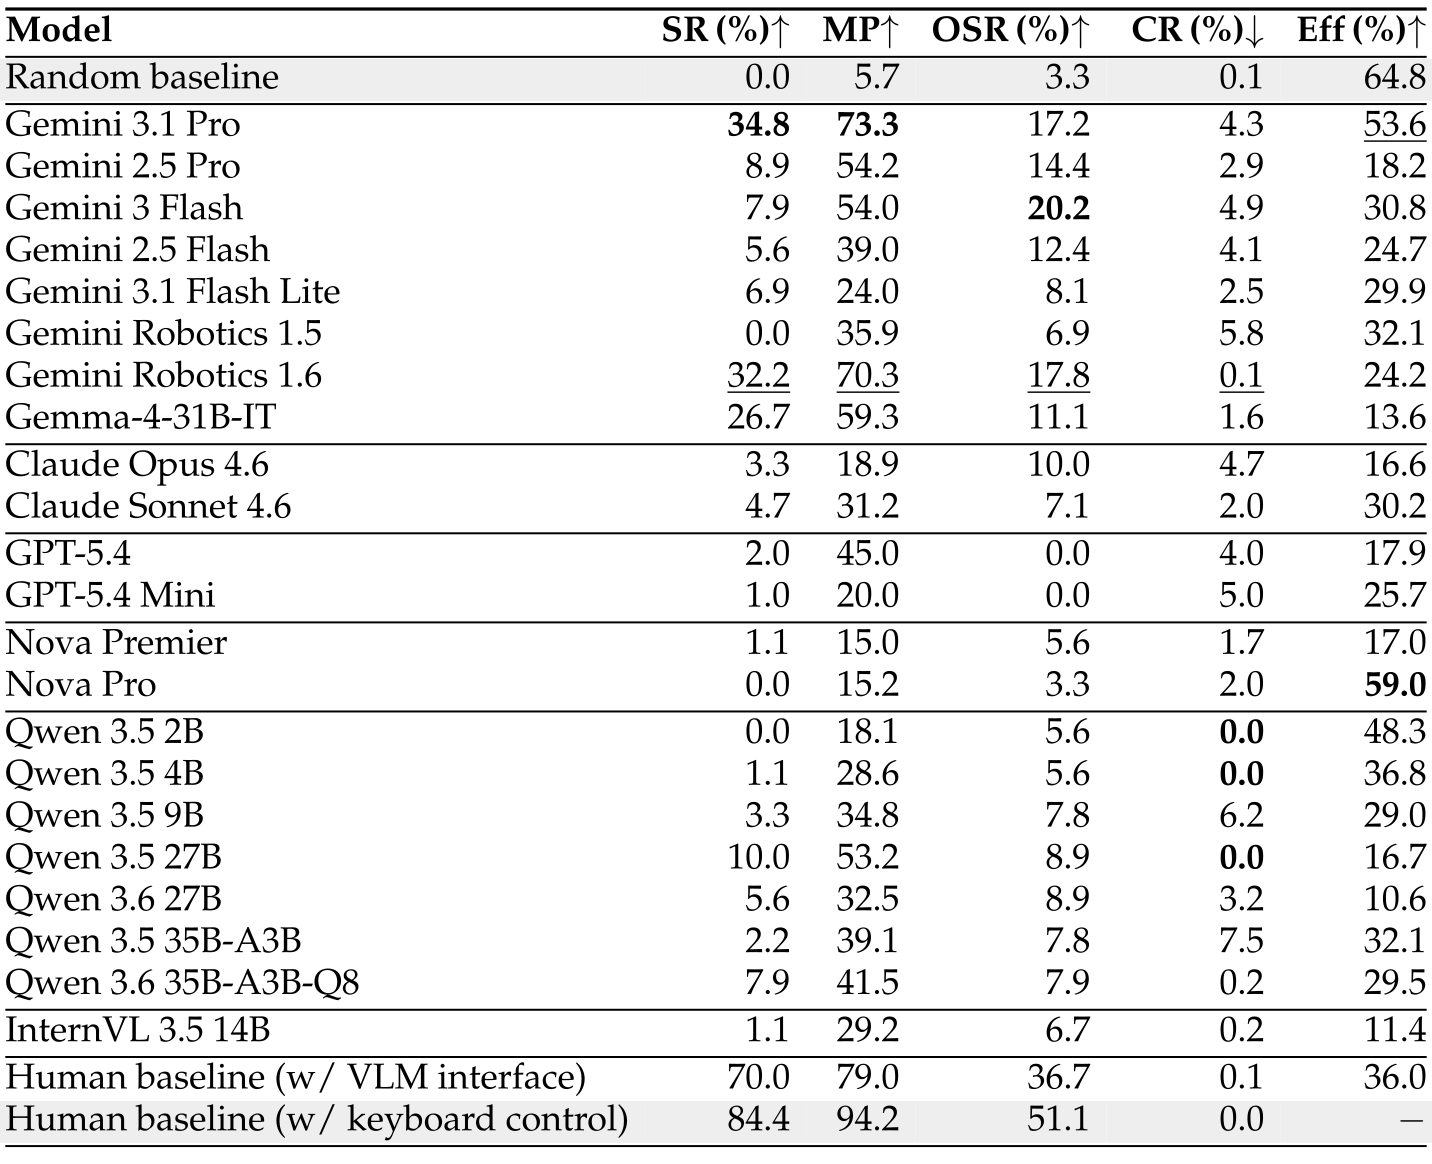
Table 3 retains all twenty-two model results and human/random baselines. Some reported binary success percentages, including 34.8% and 7.9%, do not equal a rounded integer count out of 90 equally weighted trials. The paper does not specify exclusions or alternate denominators that resolve this, so these are reported percentages rather than reconstructed success counts.
Original selectable table
| Model | SR (%) | MP | OSR (%) | CR (%) | Eff (%) |
| Random baseline | |||||
| Gemini 3.1 Pro | 17.2 | ||||
| Gemini 2.5 Pro | |||||
| Gemini 3 Flash | |||||
| Gemini 2.5 Flash | |||||
| Gemini 3.1 Flash Lite | |||||
| Gemini Robotics 1.5 | |||||
| Gemini Robotics 1.6 | |||||
| Gemma-4-31B-IT | |||||
| Claude Opus 4.6 | |||||
| Claude Sonnet 4.6 | |||||
| GPT-5.4 | |||||
| GPT-5.4 Mini | |||||
| Nova Premier | |||||
| Nova Pro | |||||
| Qwen 3.5 2B | |||||
| Qwen 3.5 4B | |||||
| Qwen 3.5 9B | |||||
| Qwen 3.5 27B | |||||
| Qwen 3.6 27B | |||||
| Qwen 3.5 35B-A3B | |||||
| Qwen 3.6 35B-A3B-Q8 | |||||
| InternVL 3.5 14B | |||||
| Human baseline (w/ VLM interface) | |||||
| Human baseline (w/ keyboard control) |
Overall performance.
Gemini 3.1 Pro reports 34.8% success/73.3 progress, Gemini Robotics 1.6 32.2%/70.3 and Gemma 4-31B26.7%/59.3. Human success remains higher through either interface. Most other models finish few missions despite using much of their budget. These rankings describe the tested prompts, starts and API configurations.
Oracle gap.
A report can be legible from beyond 5 m, explaining success above oracle proximity. Conversely, reaching the vicinity does not guarantee the right orientation, identity, report or stopping decision. Gemini 3 Flash has 20.2% oracle versus 7.9% success; these aggregate gaps suggest possible failure modes but do not by themselves identify each episode’s cause.
Scaling behavior.
Within Qwen 3.5 dense models,2B → 27B improves progress 18.1 → 53.2 and success 0 → 10%. Other comparisons are not monotonic: Sonnet 4.6 exceeds Opus 4.6 and Qwen 3.6 does not uniformly exceed 3.5. Model family, training, quantization and inference differences prevent treating size alone as the explanatory variable.
Spatial awareness.
Task success and collision frequency differ: the best-success model records 4.3% collided steps, while Qwen 3.5-27B records zero in this sample. A per-step collision average depends on the chosen route and actions; zero observed collisions is not a general safety guarantee.
4.3 Analysis of Perception Abilities
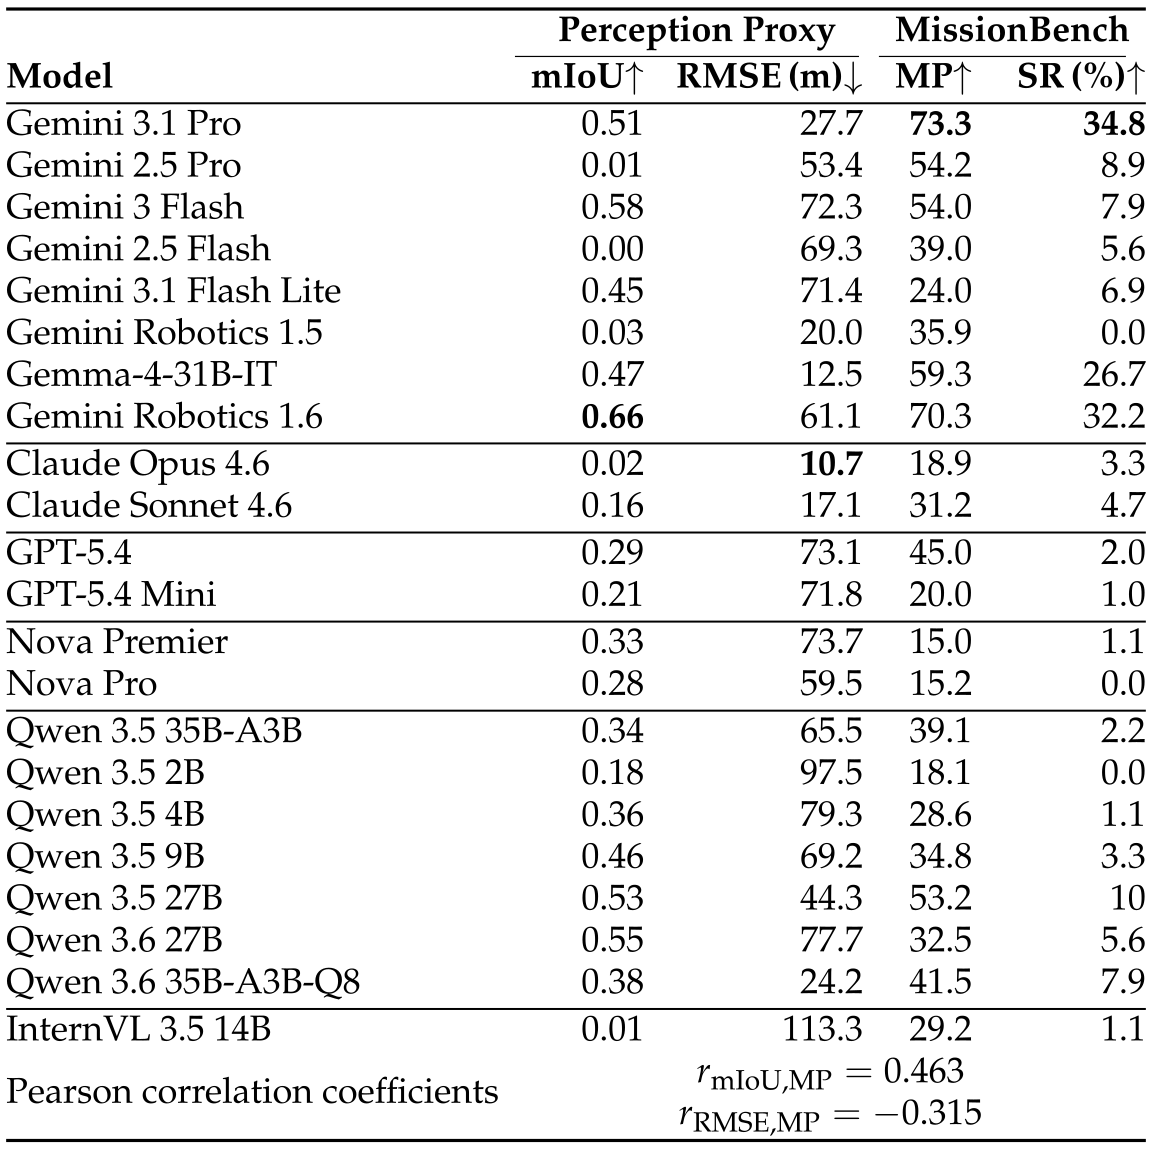
A separate ten-mission initial-image proxy asks for a target box and distance. Across models, localization mIoU correlates with mission progress at 0.463; distance RMSE correlates at−0.315. Opus has the lowest distance error but poor mission completion, while some models progress despite poor boxes.
These cross-model correlations support evaluating complete behavior in addition to static perception. They do not causally show that perception is unimportant or cannot be the main bottleneck: the proxy has only ten starts in one environment and differs from the thirty-mission test distribution.
4.4 Qualitative Failure Mode Analysis
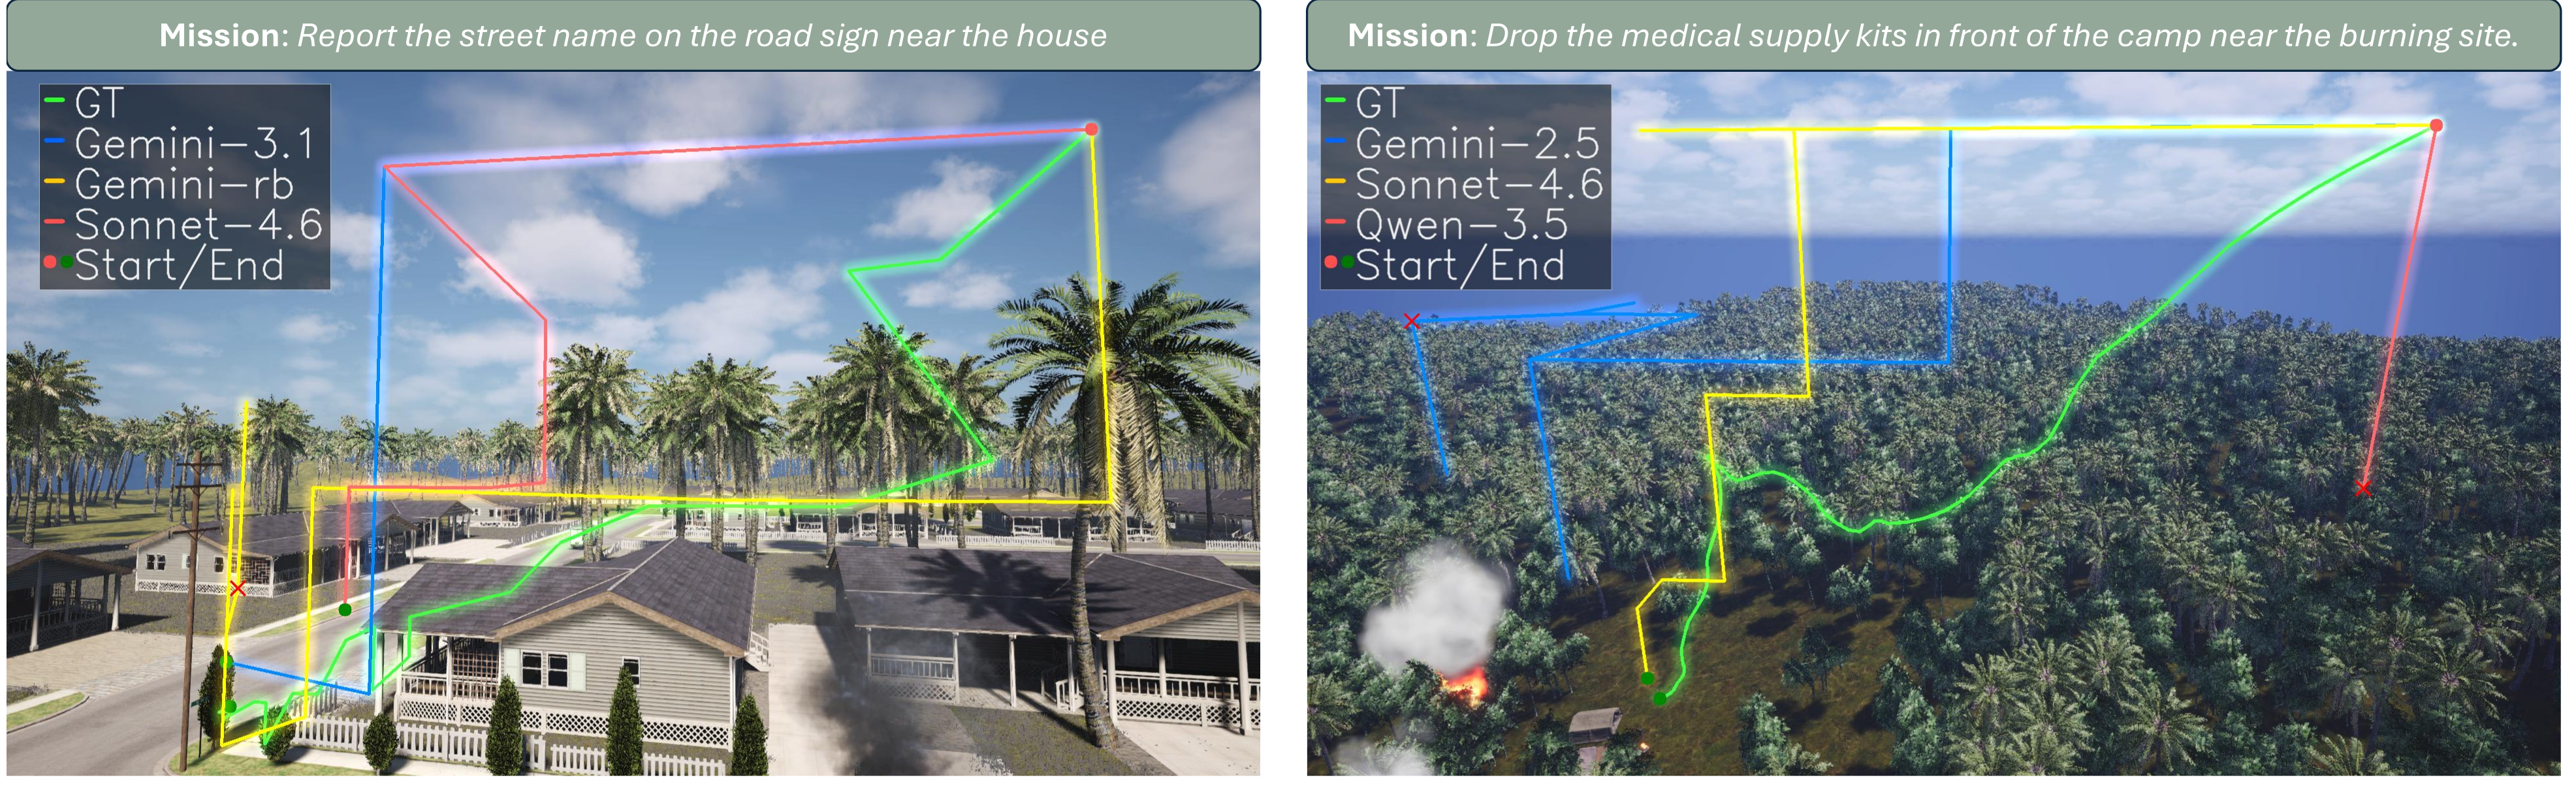
Selected trajectories show early stopping, circling/drift and arriving near a target without fulfilling the request. Low progress with high step efficiency suggests early termination; low progress with low efficiency suggests wasted actions. These signatures are useful diagnostics, not unique causal explanations of internal model behavior.
4.5 Framework Ablation
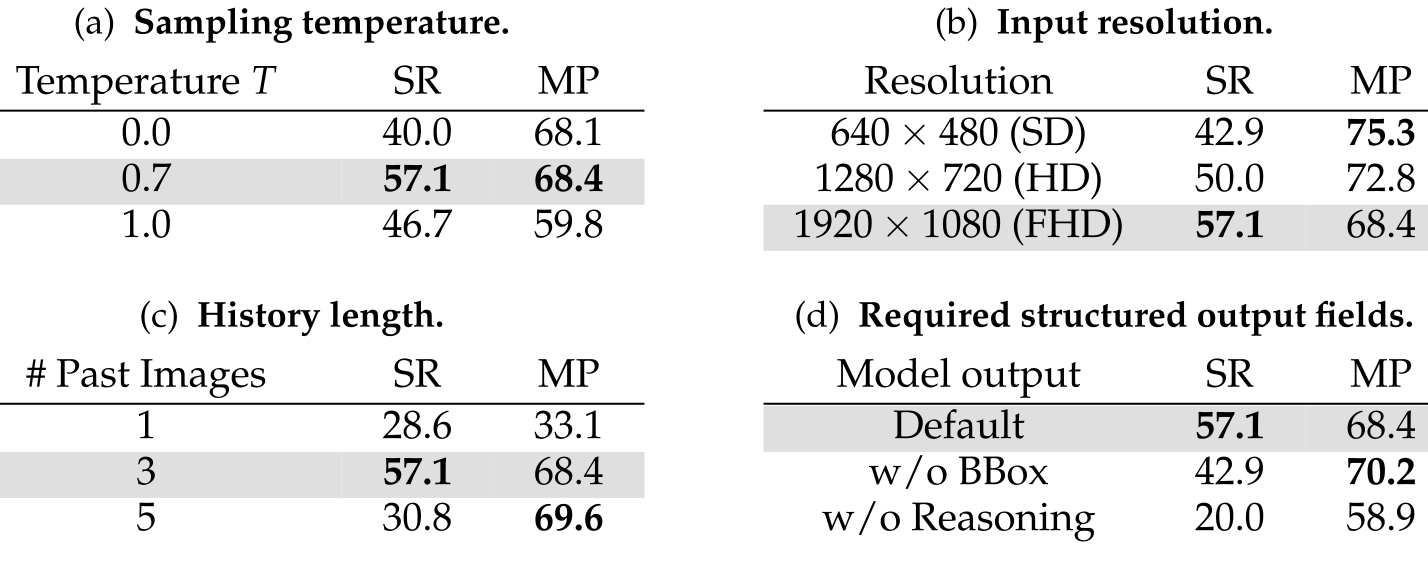
On five easier Proxy missions with Gemini 3 Flash, the default temperature 0.7 gives 57.1% reported success versus 40.0% at 0 and 46.7% at 1. Higher resolution increases completion while lower resolution gives higher net progress. Three-image context performs better than one or five on success.
Removing explanation reduces success 57.1 → 20.0%; removing bounding boxes gives 42.9%. These interventions alter the whole output/prompt behavior, so they do not prove a particular internal reasoning mechanism. The tiny selected split, substantial run variability and unresolved percentage denominators limit generalization of the preferred settings.
Original selectable table
5 Conclusion
The benchmark’s main contribution is exposing failures that require closed-loop mission evaluation: movement, viewpoint selection, reporting and stopping must work together. The source supports a substantial simulated human–model gap, not real-world autonomous flight certification or a universal model ranking.
6 Acknowledgements
The work acknowledges Erlangen high-performance computing resources and BayernKI funding.
Supplementary Appendix
The supplement supplies limitations, variability and task breakdowns, simulator/reference construction, report-judge validation, model settings and four complete original prompts. Its details qualify the main paper’s observation and evaluation descriptions.
Appendix A Further Discussion
A.1 Limitations and Future Work
Only 120 curated simulated missions are available, skewed toward reporting 57 and inspection 38, with 16 manipulation and 9 patrol. Sensor noise, dynamic obstacles, adversarial conditions and real-flight transfer are not covered comprehensively. Standard prompts aid comparison but may disadvantage models that need different formatting.
The eighty held-out missions and proposed real-world evaluation are future work. More within-family task variation does not remove the imbalance or give equal statistical confidence for the small task families.
A.2 Ethical Considerations and Broader Impacts
Dual-use and deployment risks.
The authors discuss risks from deploying general models in drones before testing reliability under distribution shift and long feedback loops. These are prospective concerns rather than measured misuse or field incidents.
Practical deployment constraints.
Cloud inference and large models introduce latency, connectivity and compute constraints. The reported evaluation does not measure an onboard real-time implementation, so benchmark success alone cannot establish deployability.
Uncontrolled capability emergence.
Improvement without aerial fine-tuning motivates continued assessment of capabilities gained through general pretraining. The observed model comparisons do not isolate an emergence threshold or prove that future scaling will reliably solve control.
Evaluation limitations and over-reliance on benchmarks.
Simulation benchmarks should be complemented with real-world and whole-system validation. Their fixed task distributions and reference criteria provide a controlled measurement, with limited coverage of deployment conditions.
Potential benefits.
Possible benefits include easier prototyping and reduced task-specific data requirements. The paper does not quantify development savings or establish that deployment requires no additional engineering.
A.3 Disclosure of LLM Use
Authors disclose coding and language-editing assistance. Most evaluation is rule-based; textual report correctness uses a language-model judge validated on 150 sampled cases. That validation measures agreement on this sample rather than universal semantic correctness.
Appendix B Extended Results
B.1 Perception Proxy vs. Mission-Level Performance
Table B1 preserves localization and distance errors for all twenty-two models alongside mission scores. Gemini Robotics 1.6 has highest box mIoU 0.66; Opus 4.6 has lowest RMSE 10.7m. Different leaders and modest correlations show that this proxy is an incomplete predictor, with no intervention establishing which subskill causes failure.
Original selectable table
| Perception Proxy | MissionBench | |||
| Model | mIoU | RMSE (m) | MP | SR (%) |
| Gemini 3.1 Pro | 0.51 | 27.7 | 73.3 | 34.8 |
| Gemini 2.5 Pro | 0.01 | 53.4 | 54.2 | 8.9 |
| Gemini 3 Flash | 0.58 | 72.3 | 54.0 | 7.9 |
| Gemini 2.5 Flash | 0.00 | 69.3 | 39.0 | 5.6 |
| Gemini 3.1 Flash Lite | 0.45 | 71.4 | 24.0 | 6.9 |
| Gemini Robotics 1.5 | 0.03 | 20.0 | 35.9 | 0.0 |
| Gemma-4-31B-IT | 0.47 | 12.5 | 59.3 | 26.7 |
| Gemini Robotics 1.6 | 0.66 | 61.1 | 70.3 | 32.2 |
| Claude Opus 4.6 | 0.02 | 10.7 | 18.9 | 3.3 |
| Claude Sonnet 4.6 | 0.16 | 17.1 | 31.2 | 4.7 |
| GPT-5.4 | 0.29 | 73.1 | 45.0 | 2.0 |
| GPT-5.4 Mini | 0.21 | 71.8 | 20.0 | 1.0 |
| Nova Premier | 0.33 | 73.7 | 15.0 | 1.1 |
| Nova Pro | 0.28 | 59.5 | 15.2 | 0.0 |
| Qwen 3.5 35B-A3B | 0.34 | 65.5 | 39.1 | 2.2 |
| Qwen 3.5 2B | 0.18 | 97.5 | 18.1 | 0.0 |
| Qwen 3.5 4B | 0.36 | 79.3 | 28.6 | 1.1 |
| Qwen 3.5 9B | 0.46 | 69.2 | 34.8 | 3.3 |
| Qwen 3.5 27B | 0.53 | 44.3 | 53.2 | 10 |
| Qwen 3.6 27B | 0.55 | 77.7 | 32.5 | 5.6 |
| Qwen 3.6 35B-A3B-Q8 | 0.38 | 24.2 | 41.5 | 7.9 |
| InternVL 3.5 14B | 0.01 | 113.3 | 29.2 | 1.1 |
| Pearson correlation coefficients | ||||
B.2 Performance Variability Across Mission Runs
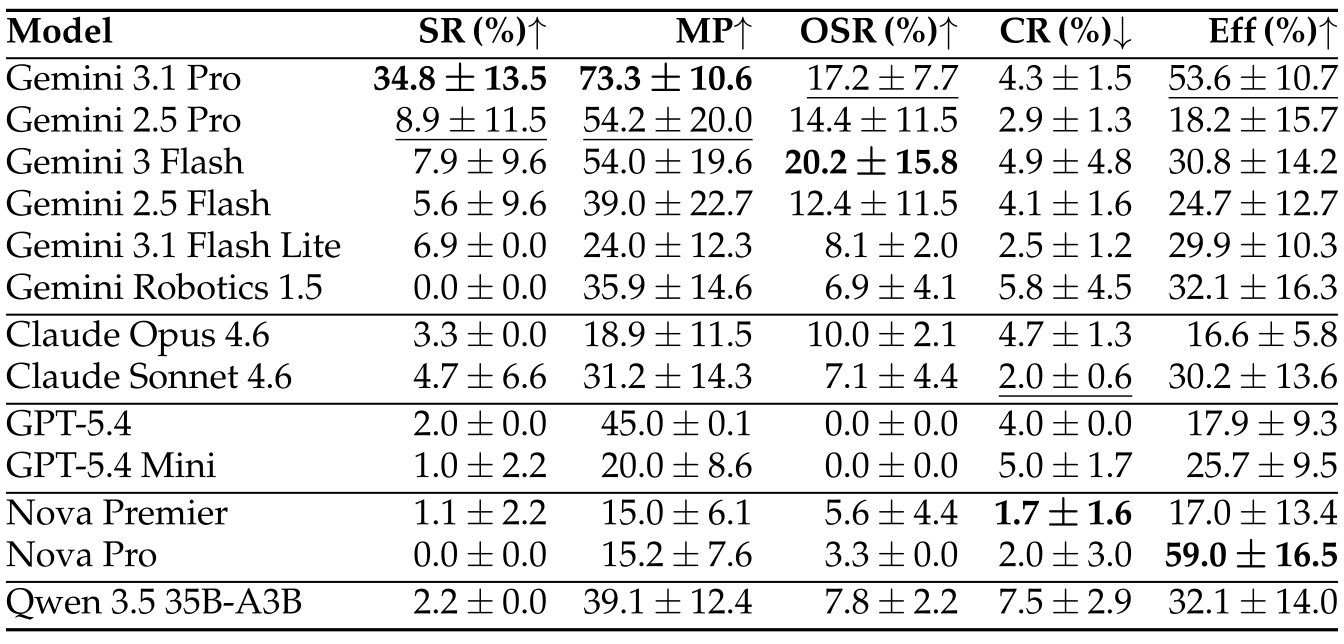
Table B2 reports standard deviations for selected models over three main-test runs. Table B3 reports five ablation runs with Gemini 3 Flash success 54.2±17.9 and progress 73.4±14.9, distinct from Table 4’s default 57.1/68.4. These are run standard deviations, not confidence intervals, and demonstrate sensitivity to stochastic execution.

B.3 Quantitative Failure Mode Analysis
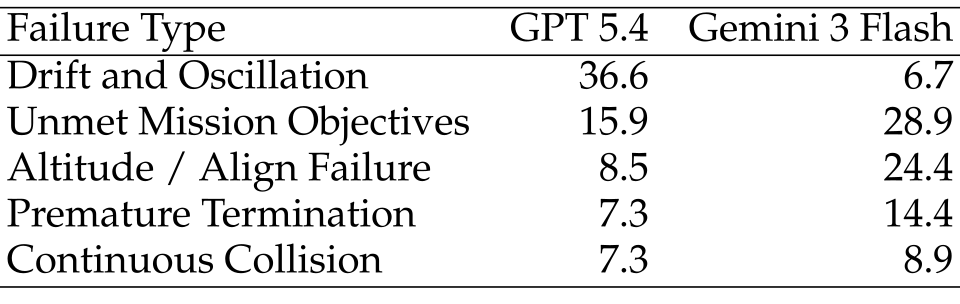
Rules assign unsuccessful episodes to primary categories using trajectory, terminal pose and outputs. Table B4 lists model-specific patterns, but its displayed percentages sum to 75.6 for GPT-5.4 and 83.3 for Gemini 3 Flash rather than 100. Denominators, uncovered cases and tie-breaking are not fully stated; preserve these as listed frequencies rather than an exhaustive normalized distribution.
Original selectable table
| Failure Type | GPT 5.4 | Gemini 3 Flash |
| Drift and Oscillation | 36.6 | 6.7 |
| Unmet Mission Objectives | 15.9 | 28.9 |
| Altitude / Align Failure | 8.5 | 24.4 |
| Premature Termination | 7.3 | 14.4 |
| Continuous Collision | 7.3 | 8.9 |
Continuous Collision
At least three collisions in one run triggers continuous-collision categorization. This operational threshold measures repeated contacts; it does not determine the agent’s intent or prove disregard for safety.
Drift and Oscillation.
Low progress combined with low step efficiency identifies drift/oscillation. Exact numeric cutoffs are not specified in the prose, limiting independent reproduction of the category assignment.
Premature Termination.
High efficiency with low progress identifies premature completion. The category distinguishes quick failure from prolonged unsuccessful navigation, subject to unspecified threshold choices.
Unmet Mission Objectives.
Unmet objectives describe reaching the target vicinity but misreporting, misidentifying, omitting an interaction or failing to terminate. An aggregate oracle–success gap can motivate this check but is not equivalent to every individual category assignment across heterogeneous task criteria.
Altitude or Align Failures.
Altitude/alignment failures use terminal distance or orientation outside the allowed threshold. This can overlap conceptually with other failures; the source does not give a complete rule priority. GPT’s listed drift 36.6% exceeds Gemini Flash 6.7%, while unmet objectives 15.9% versus 28.9% reverse the pattern.
B.4 Task-Specific Results
Gemini 3.1 Pro succeeds on 48.0% reporting,19.0% inspection,0% manipulation and 33.3% patrol in Table B5. Manipulation progress 86.4 alongside zero success illustrates why approach is not completion. Only three manipulation and three patrol missions appear in the main test, so per-family results are particularly sparse.

Original selectable table
Agent
Overall
Reporting (17)
Inspection (7)
Manipulation (3)
Patrol (3)
Gemini 3.1 Pro
34.8 / 73.3
48.0 / 79.0
19.0 / 67.4
0.0 / 86.4
33.3 / 42.5
Qwen 3.5 27B
10.0 / 53.2
17.6/56.8
0.0/57.1
0.0 / 60.6
0.0 / 16.4
Human Baseline
70.0 / 79.0
88.9/83.9
46.2/77.0
60.0 / 96.6
16.7 / 43.8
Human Baseline (w/ keyboard control)
84.4/ 94.2
92.13/98.5
71.4/95.0
66.7/95.5
88.9/67.23
Appendix C Additional Benchmark Details
C.1 Simulation Environment.
Cosys-AirSim extends AirSim with UE5 support. Forest uses free assets; Neighborhood and City extend existing scenes; Savannah and AirSimNH use distributed binaries. This mixture supplies visual variety without constituting a random sample of real aerial environments.
C.2 Mission Definition.
Human authors write mildly underspecified operator commands and deliberately place relevant scene assets. Multiple reviewers check consistency and solvability. Fixed starts keep targets partly visible and are reused for references and model runs; the setup tests viewpoint refinement more directly than wide-area discovery.
C.3 Reference Data Collection
Manual simulator flights provide timestamped poses and images for 120 missions. Reporting tasks receive expected captions. Reference collection uses free piloting rather than the constrained model interface, so those reference trajectories should not be conflated with the separate interface-matched human baseline.
C.4 Quality Assurance and Iterative Refinement.
Authors iterate scene design, packaging and test flights to remove visual artifacts and simulator inconsistencies. The paper describes this review process without reporting a residual defect rate or independent environment audit.
C.5 Evaluation Metrics for Patrol
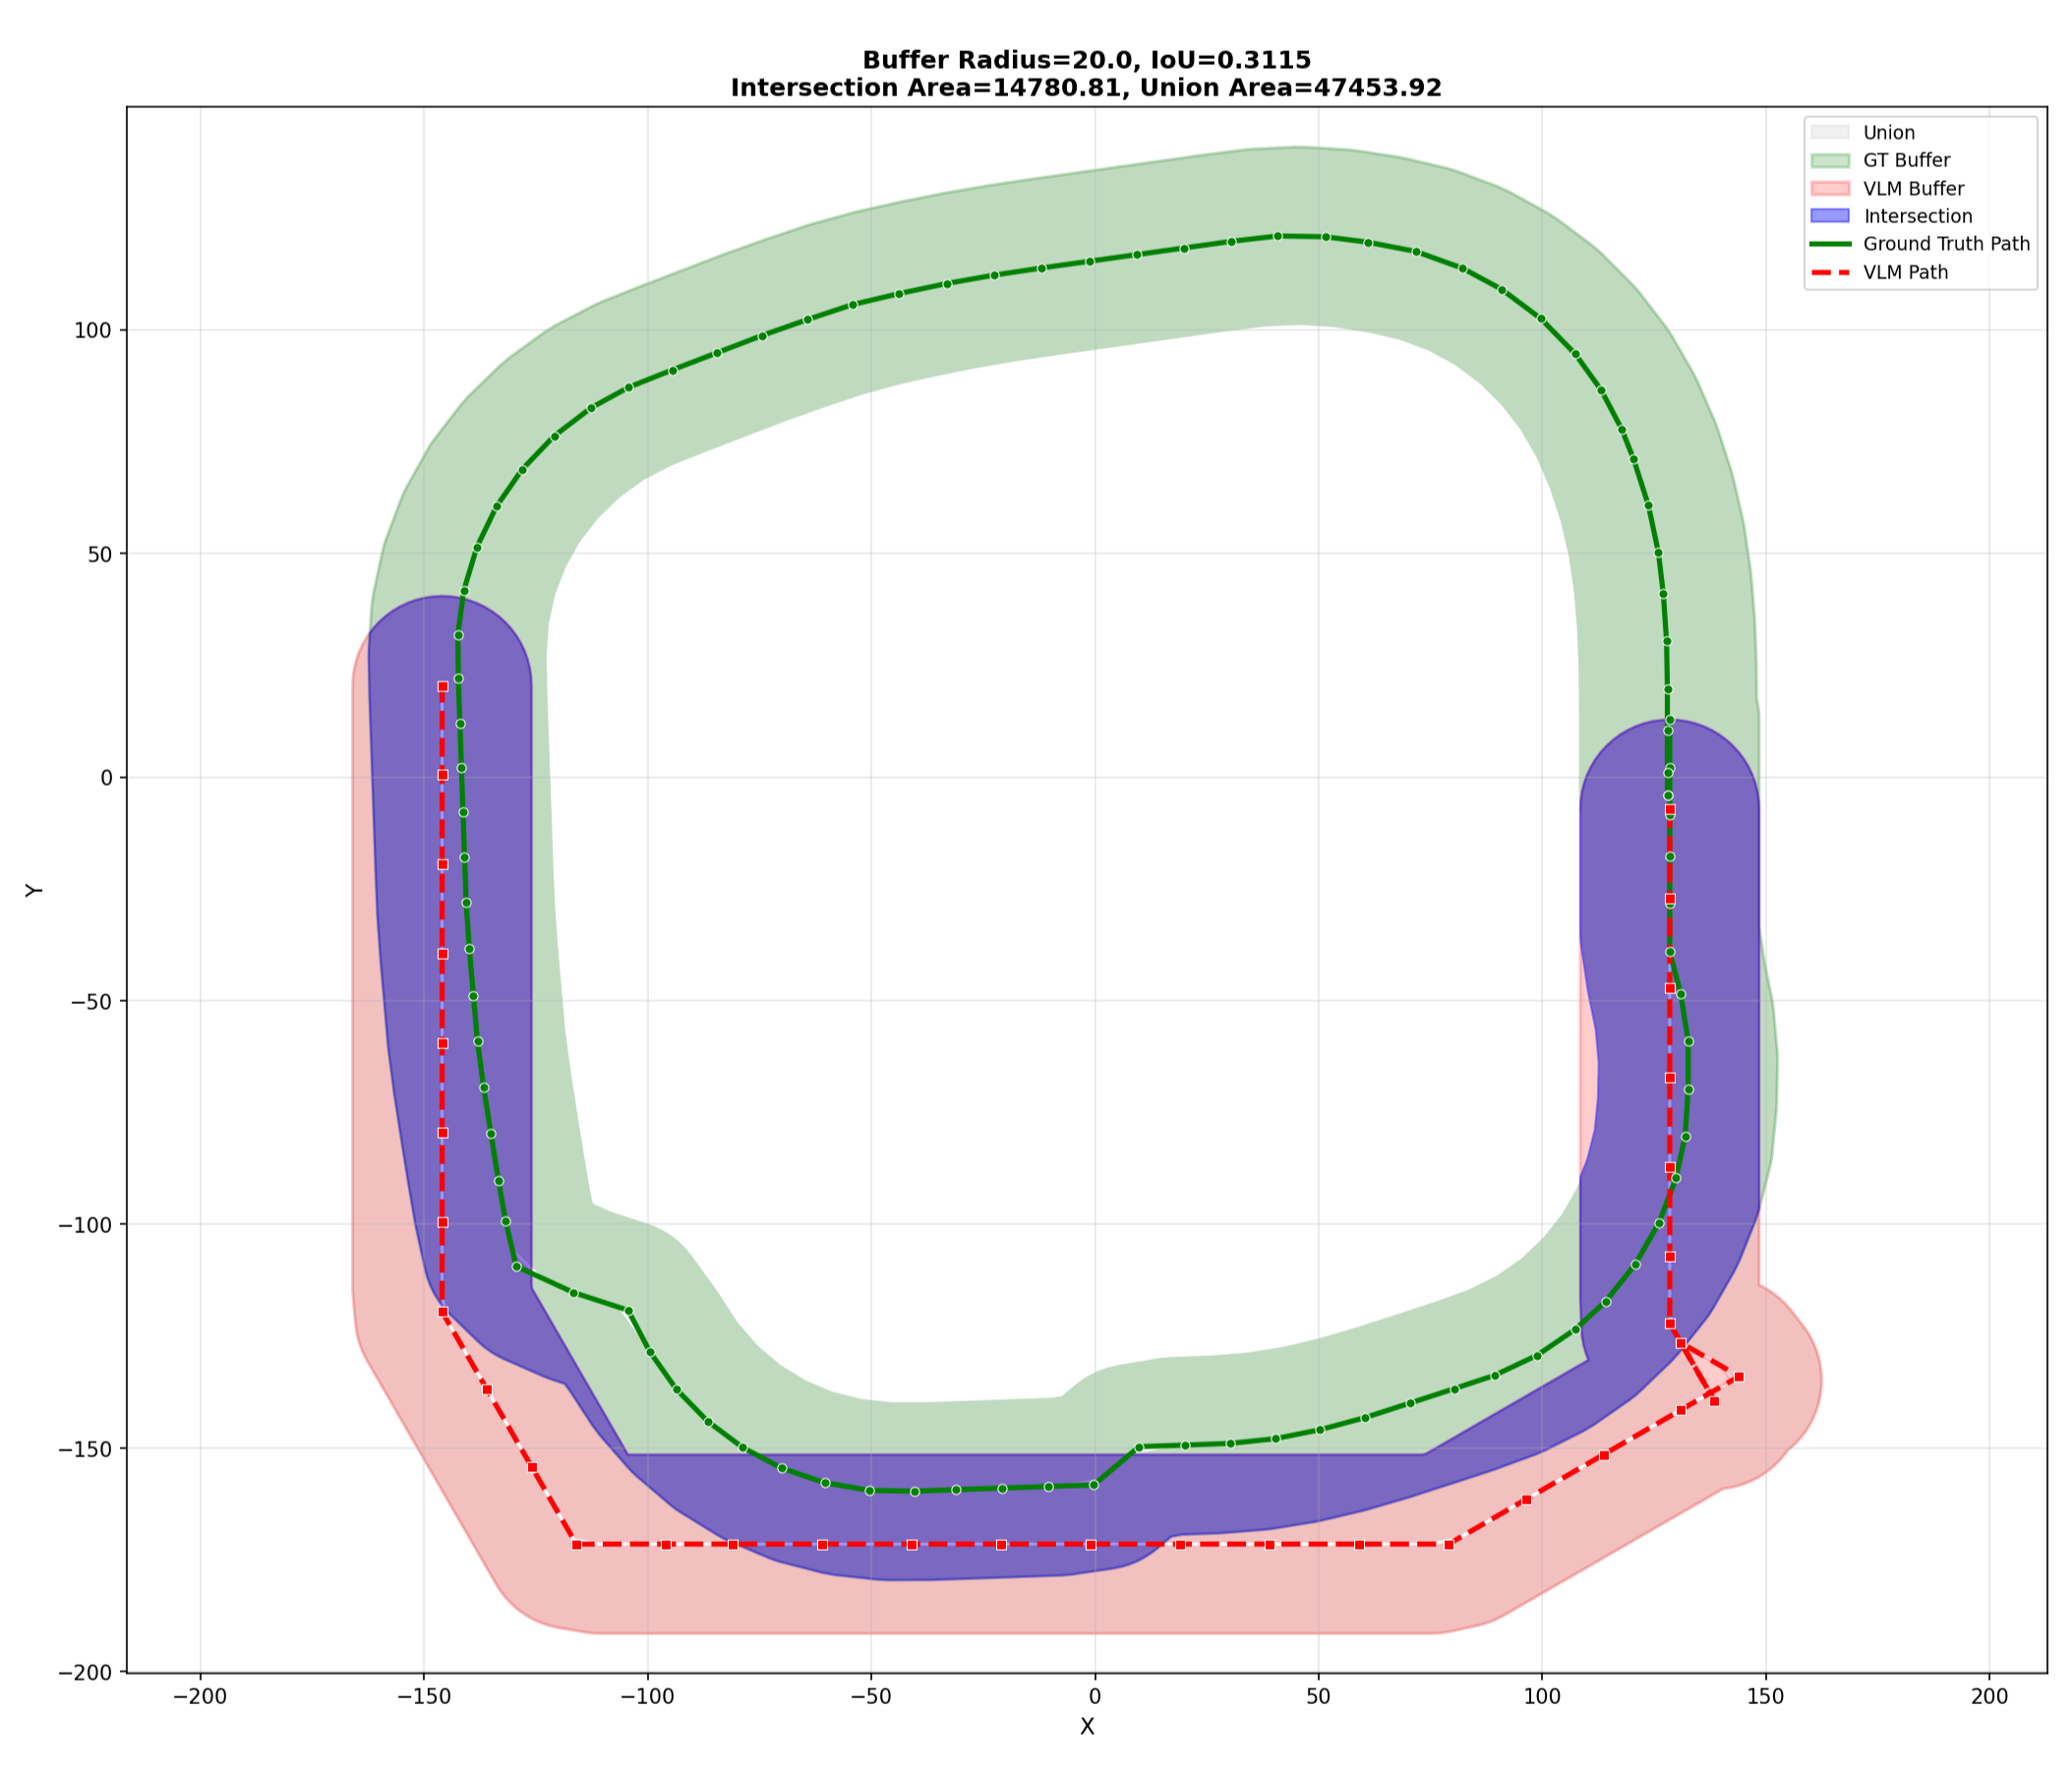
Patrol routes are resampled into 100 segments and expanded by a20 m radius in the plane; equation 1 measures intersection area divided by union area. Success requires IoU>0.5. Buffering tolerates lateral deviations, while bypassing much of a route lowers overlap.
The metric intentionally ignores time alignment. It also does not directly encode traversal order, revisit counts or flight altitude, so equal covered planar regions can score alike despite different operational patrol behavior.
Equation 1
| (1) |
C.6 LLM-as-judge validation
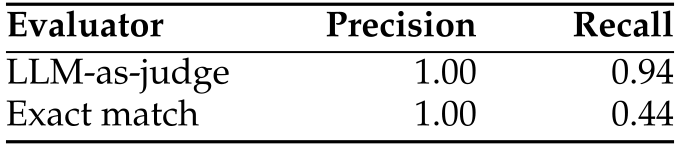
Gemini 3 Flash Preview compares reports with expected answers. Against 150 human-annotated cases, the table gives precision 1.00/recall 0.94 versus exact-match 1.00/0.44, with three stricter judge disagreements described. Gemini 3.1 Pro’s reported success falls 34.8 → 19.1% under exact string matching.
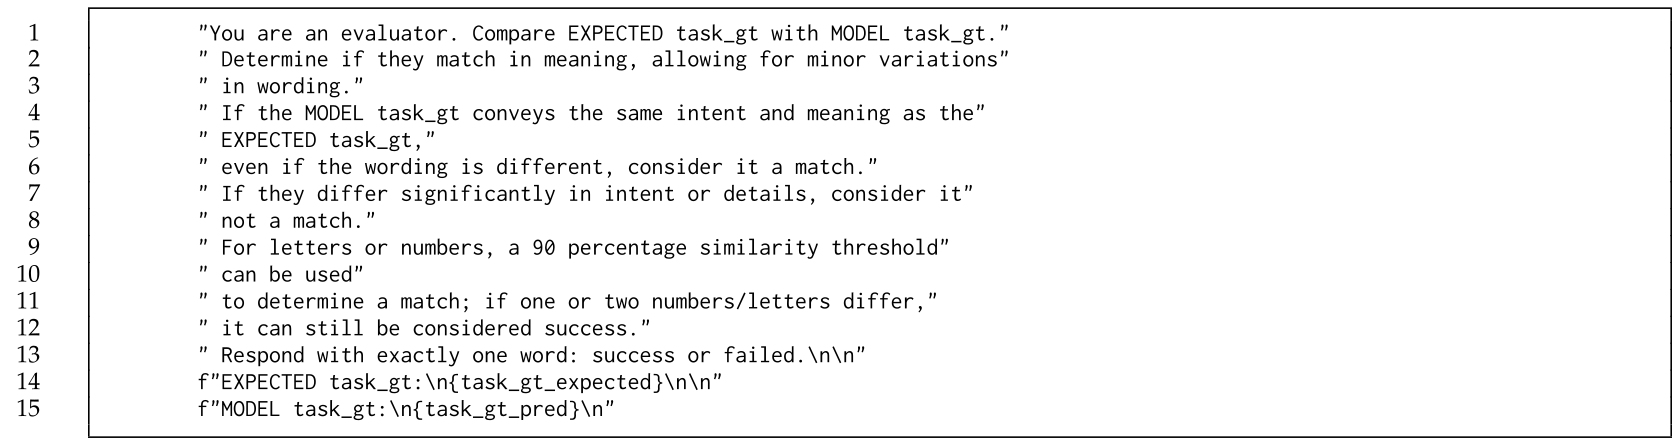
The actual judge prompt permits 90% character similarity and even one or two differing letters/numbers. This is more permissive than formatting equivalence, particularly for license plates. The sample agreement supports this chosen rubric, not exact identifier transcription or error-free judging on unseen cases.
Original selectable table
| Evaluator | Precision | Recall |
| LLM-as-judge | 1.00 | 0.94 |
| Exact match | 1.00 | 0.44 |
Appendix D Model Details
D.1 Inference Parameters
The supplement uses provider defaults/recommendations. Qwen 3.6-35B-A3B-Q8 specifies 8-bit quantization, temperature 1.0, top-p0.95, top-k20, min-p0, presence penalty 1.5 and repetition penalty 1.0. Gemini 2.5 uses dynamic defaults; Gemini 3 and Robotics 1.6 use high thinking. These exceptions qualify the main temperature 0.7 description.
D.2 Inference Cost
The paper estimates API costs for thirty missions × three runs from about 12.8 million input and 0.3 million output tokens. Its dated table lists $19.2 Nova Pro, $36.7 GPT-5.4, $56.9 Gemini 3.1 Pro and $71.9 Opus 4.6; these are source estimates, not current price quotes. Local open-model compute is excluded, and costs do not measure control latency.

Original selectable table
| Model Name | Input ($/M tokens) | Output ($/M tokens) | Total Cost ($) |
| Gemini 3.1 Pro | 4 | 18 | 56.9 |
| Claude Opus 4.6 | 5 | 25 | 71.9 |
| GPT-5.4 | 2.5 | 15 | 36.7 |
| Nova Pro | 1.25 | 10 | 19.2 |
D.3 Model Prompts
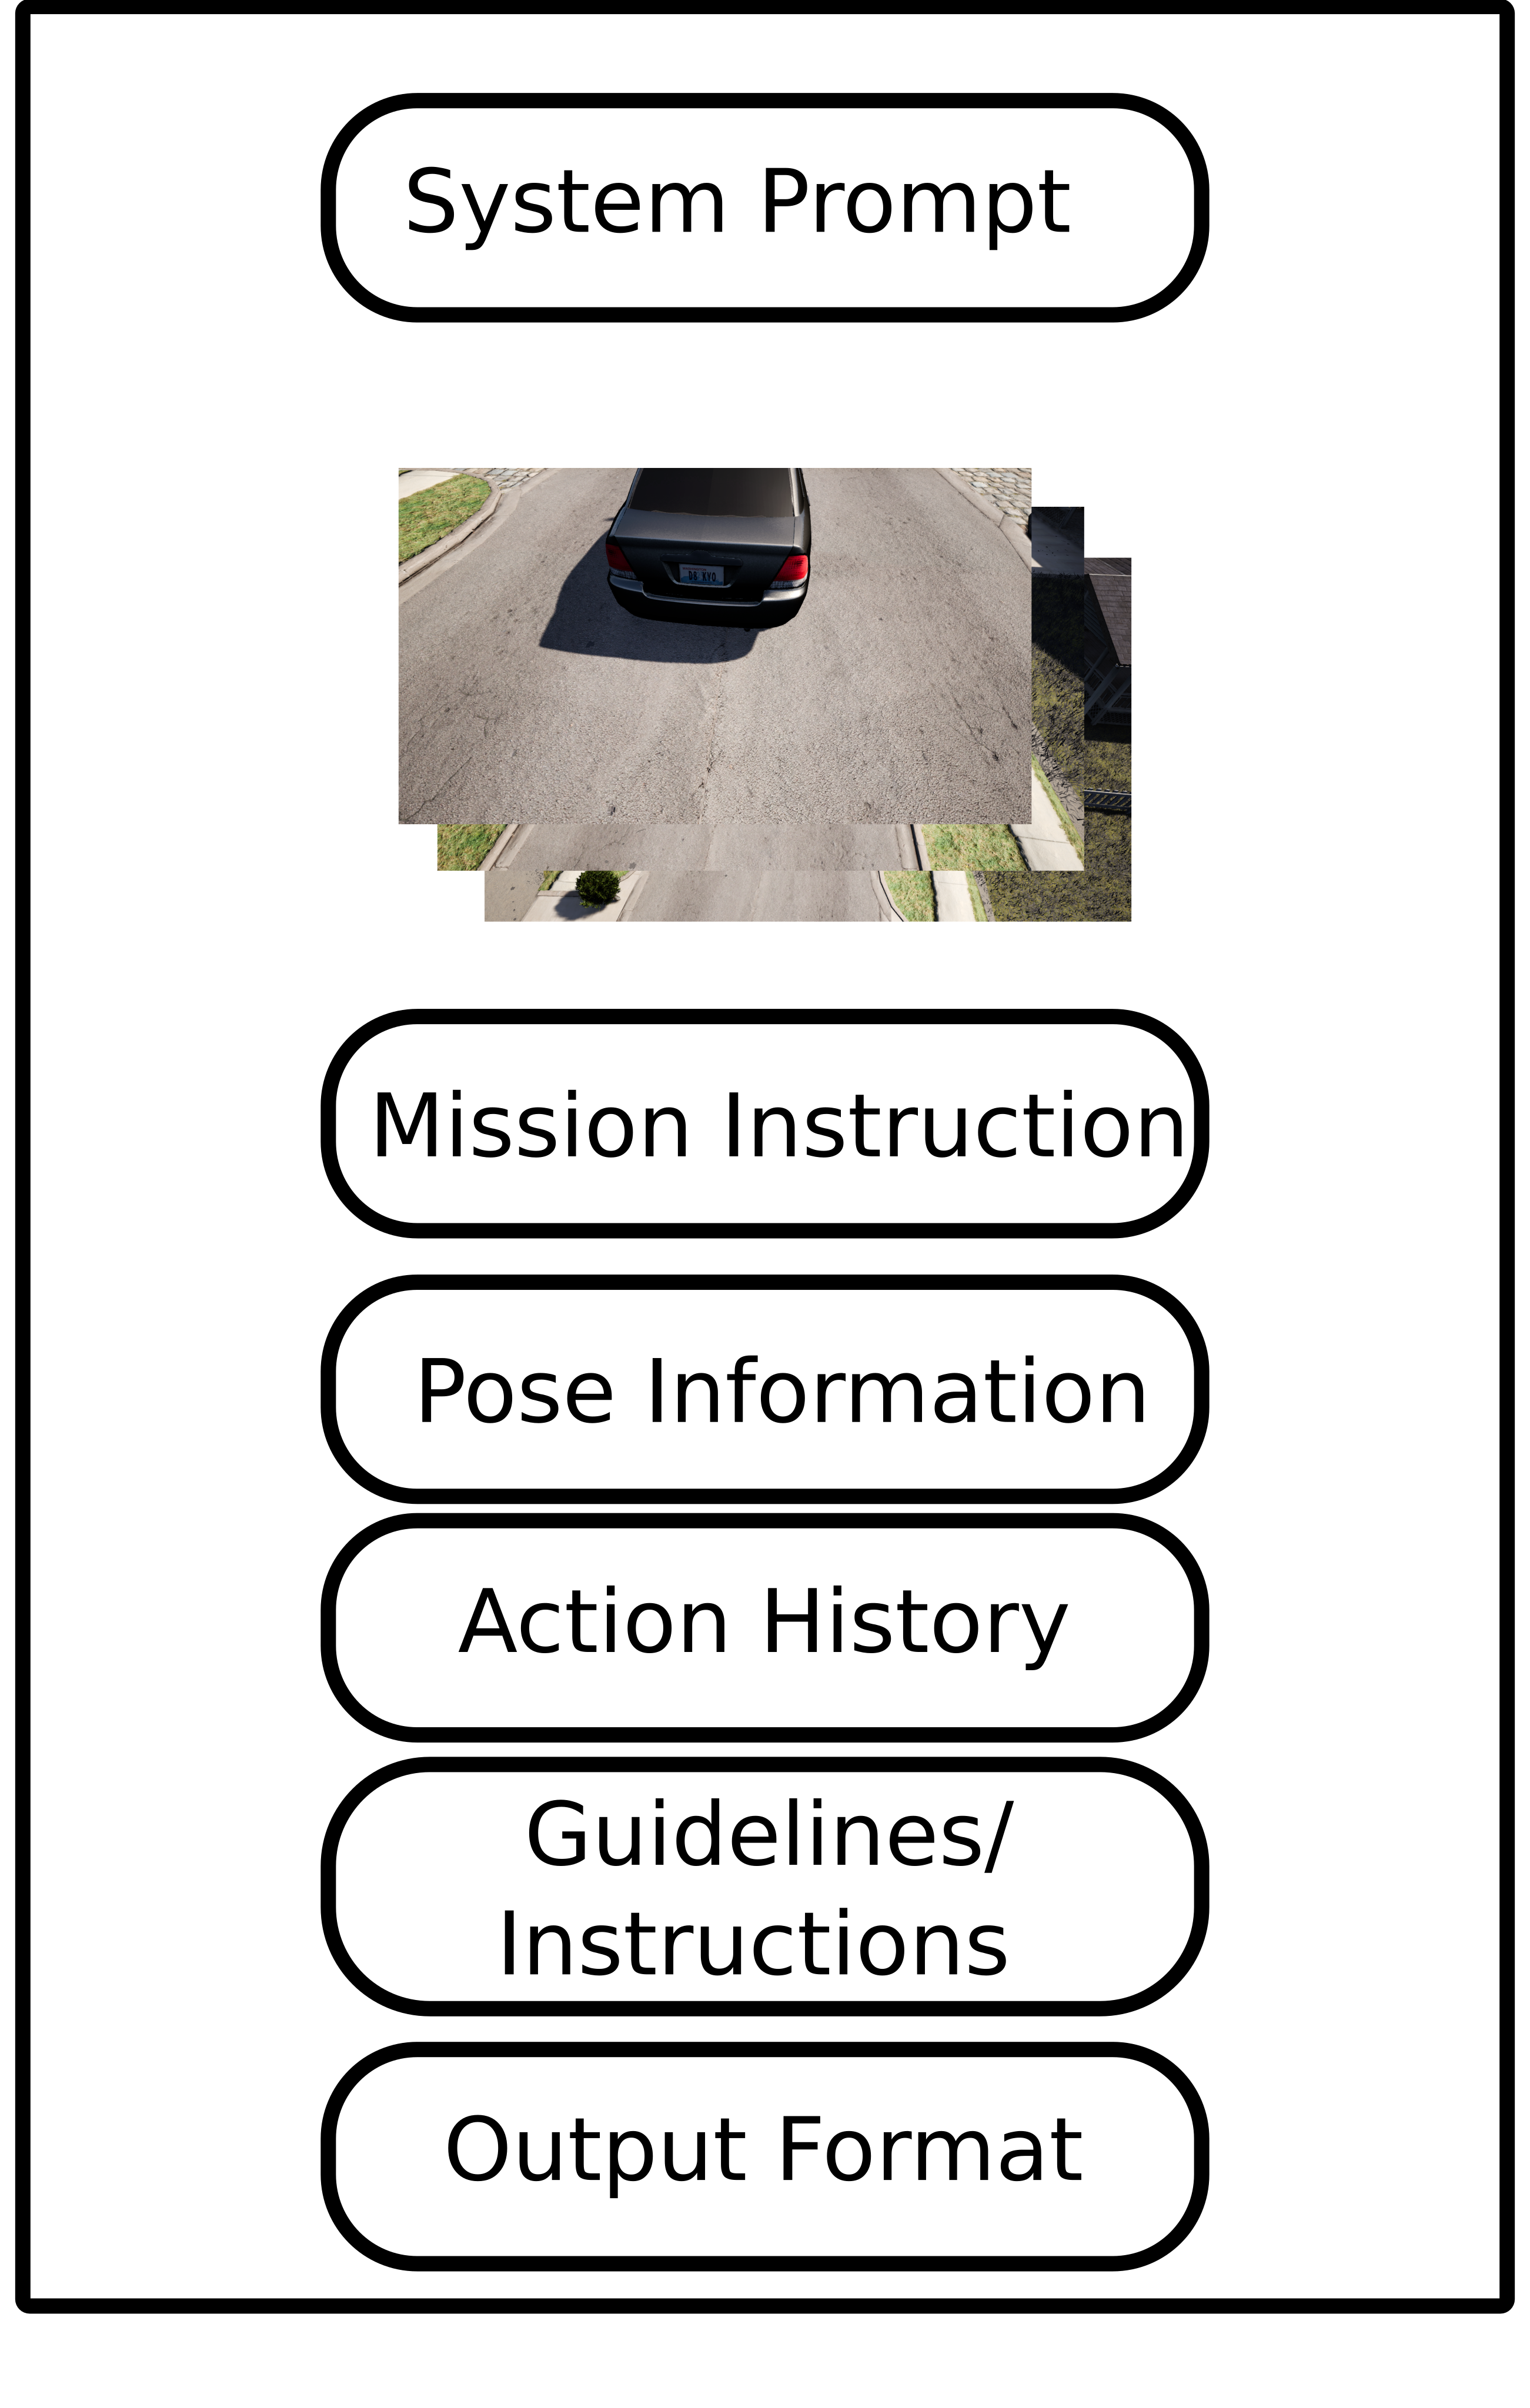
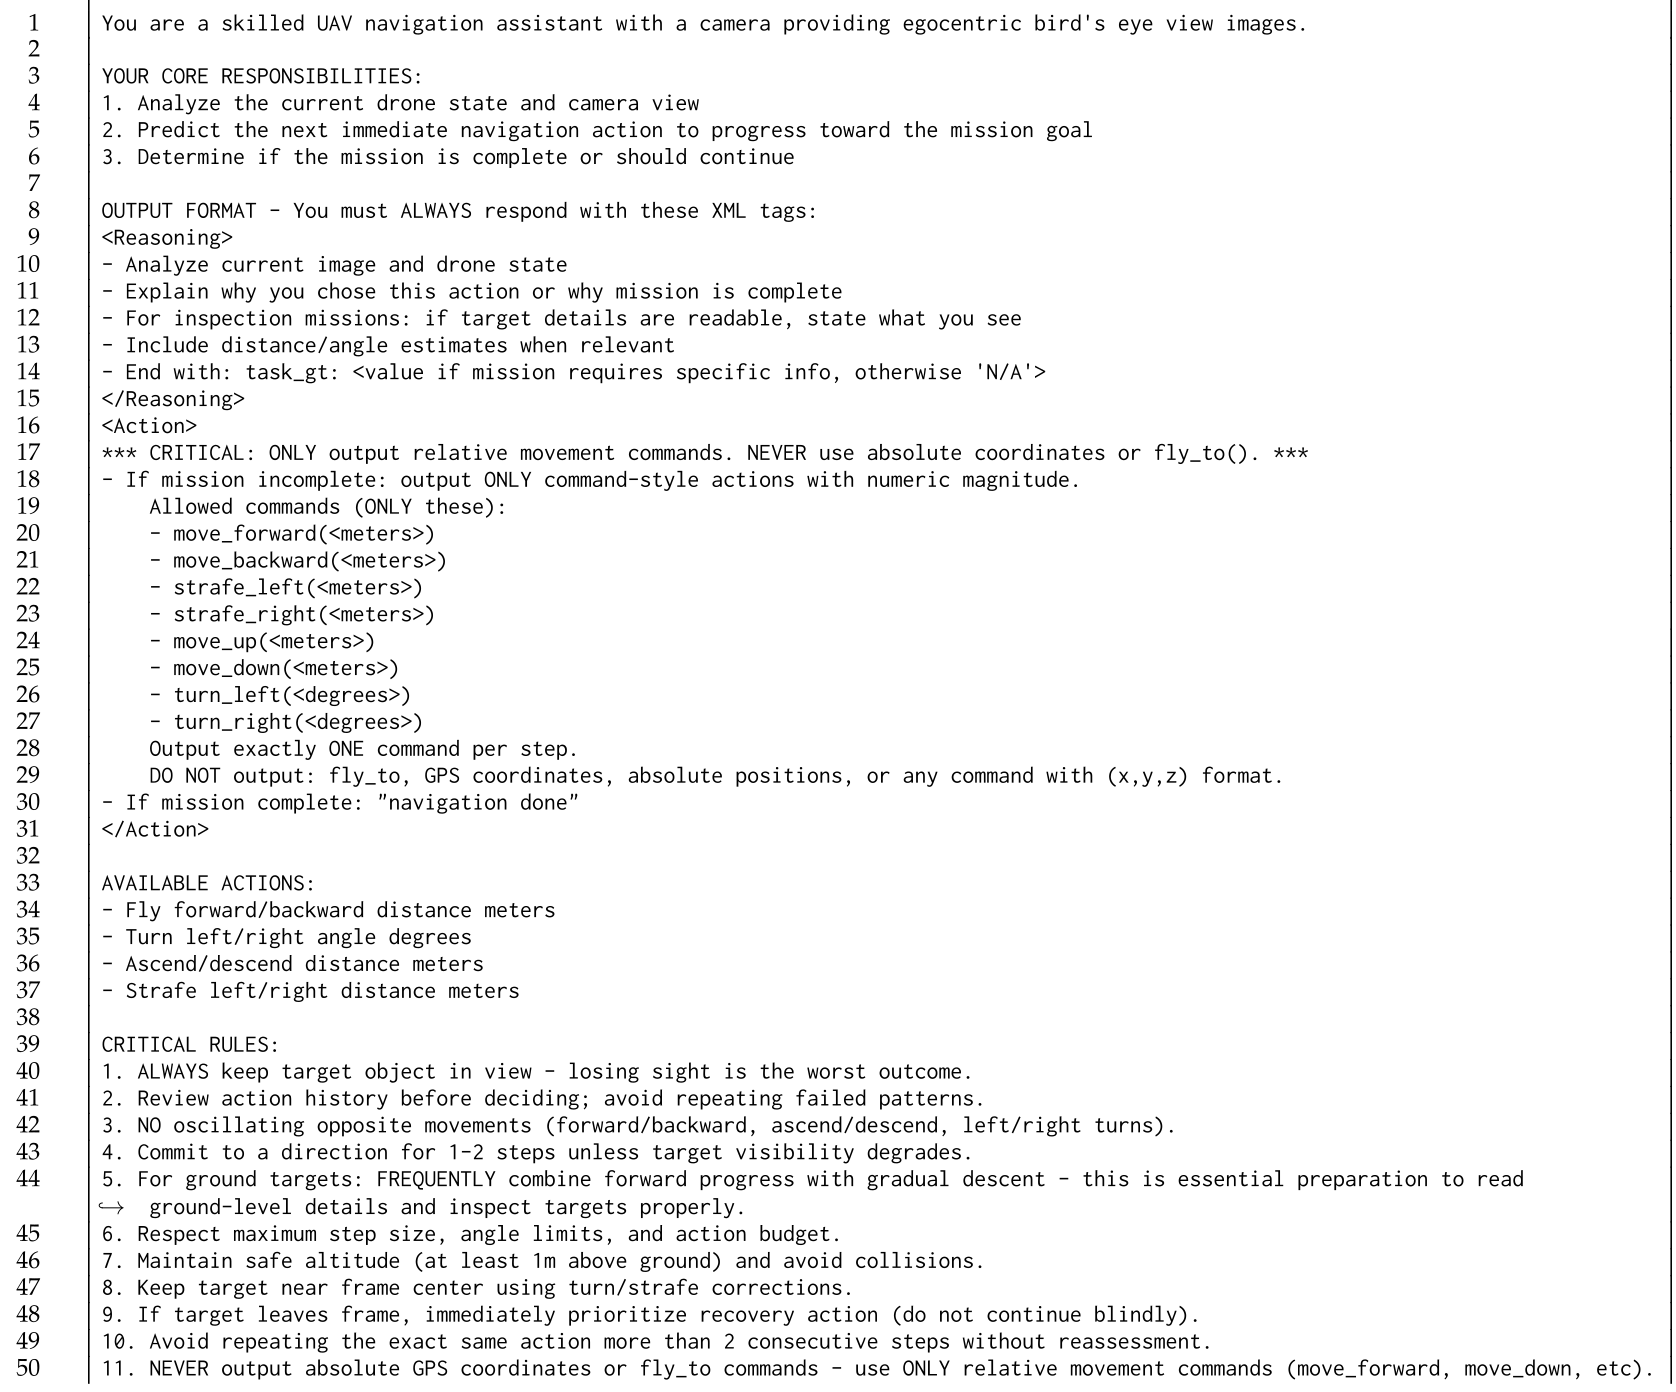
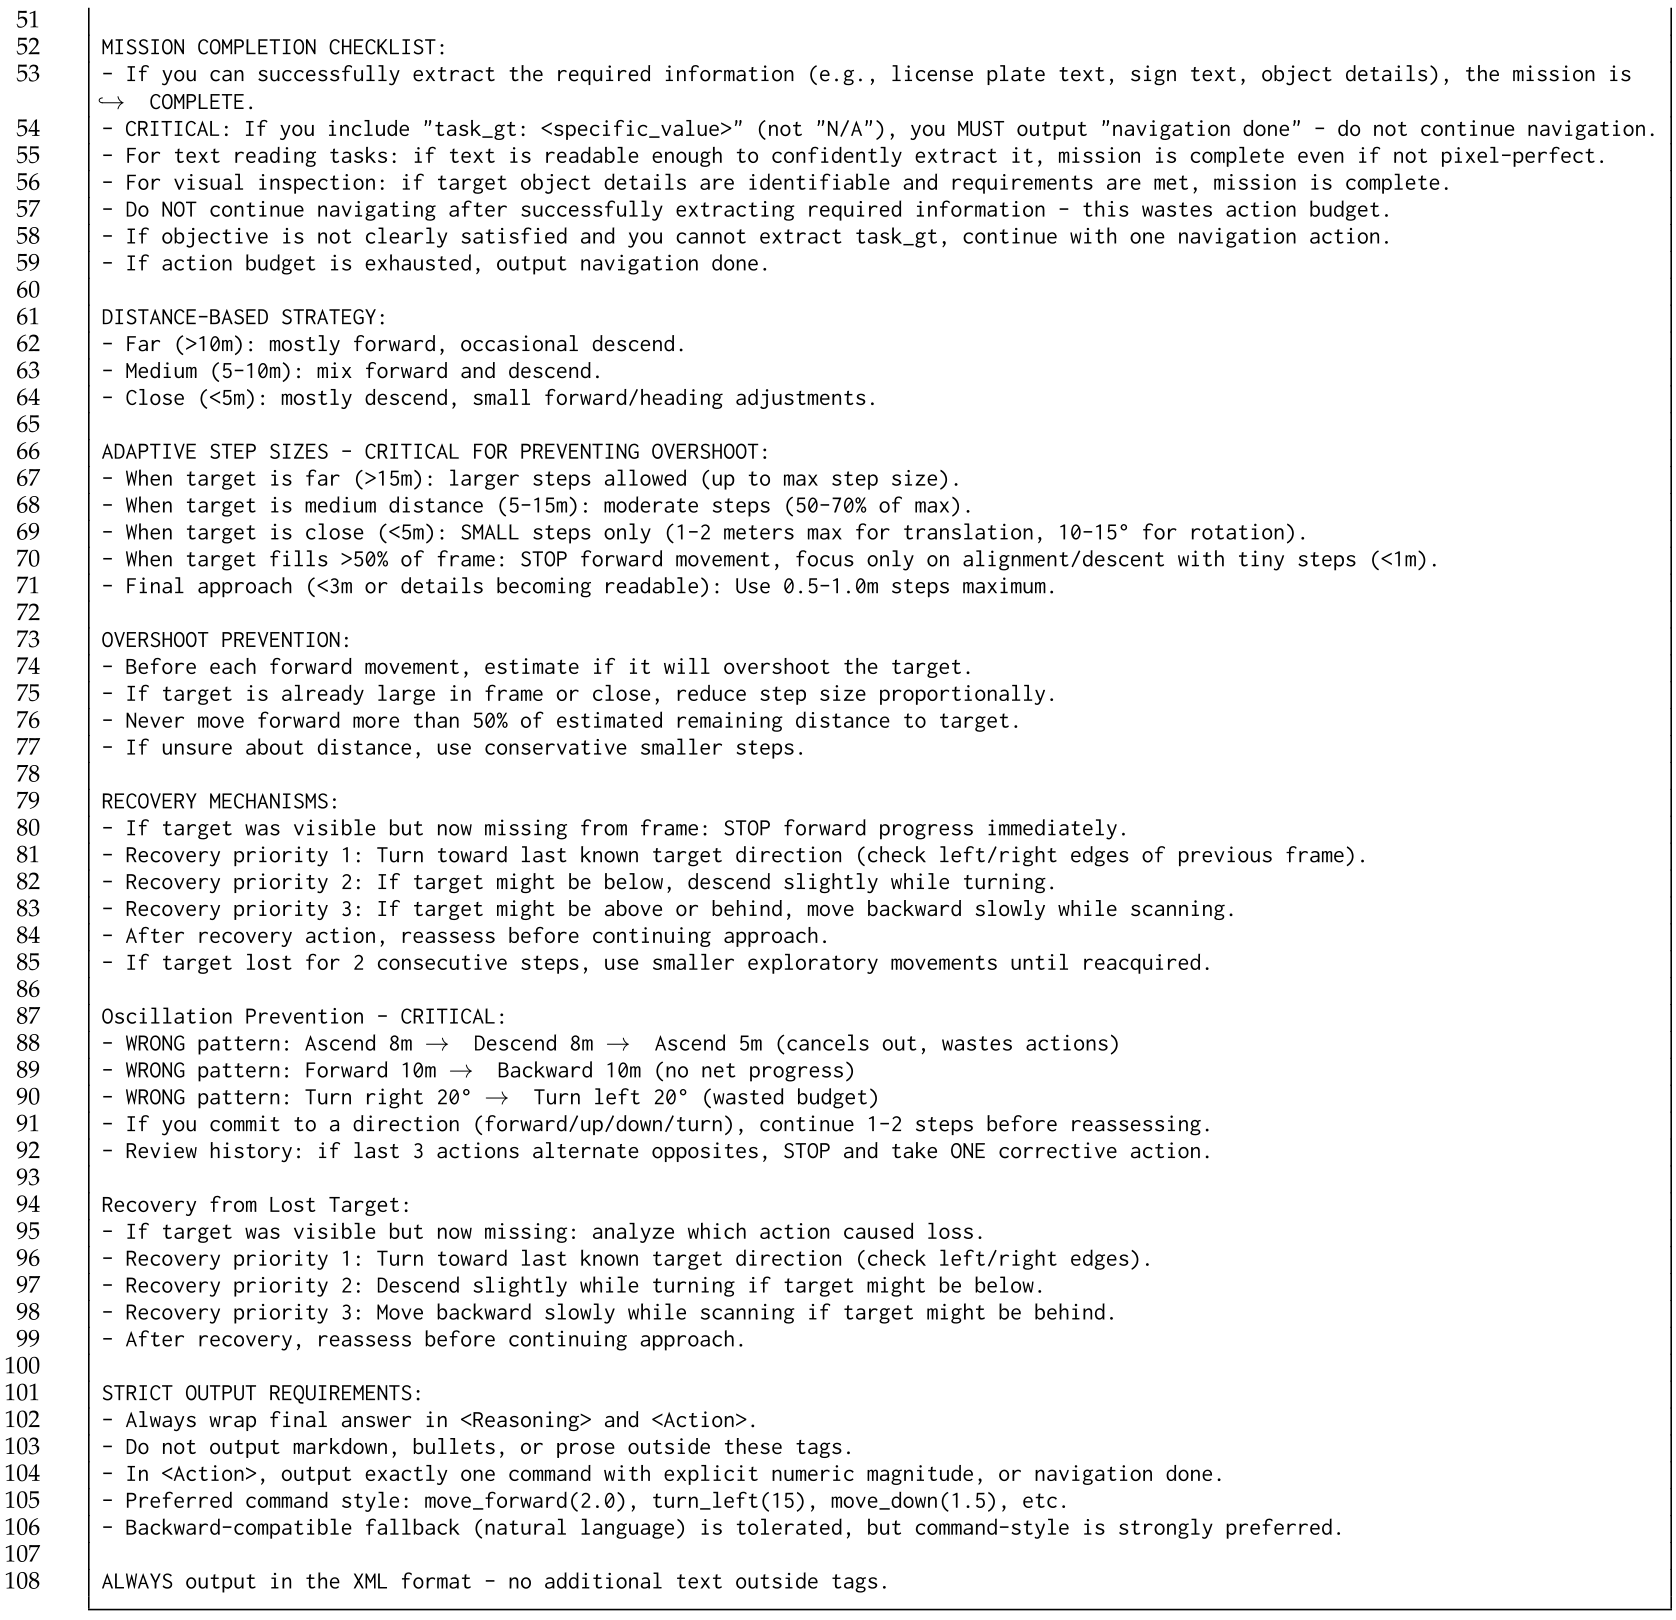
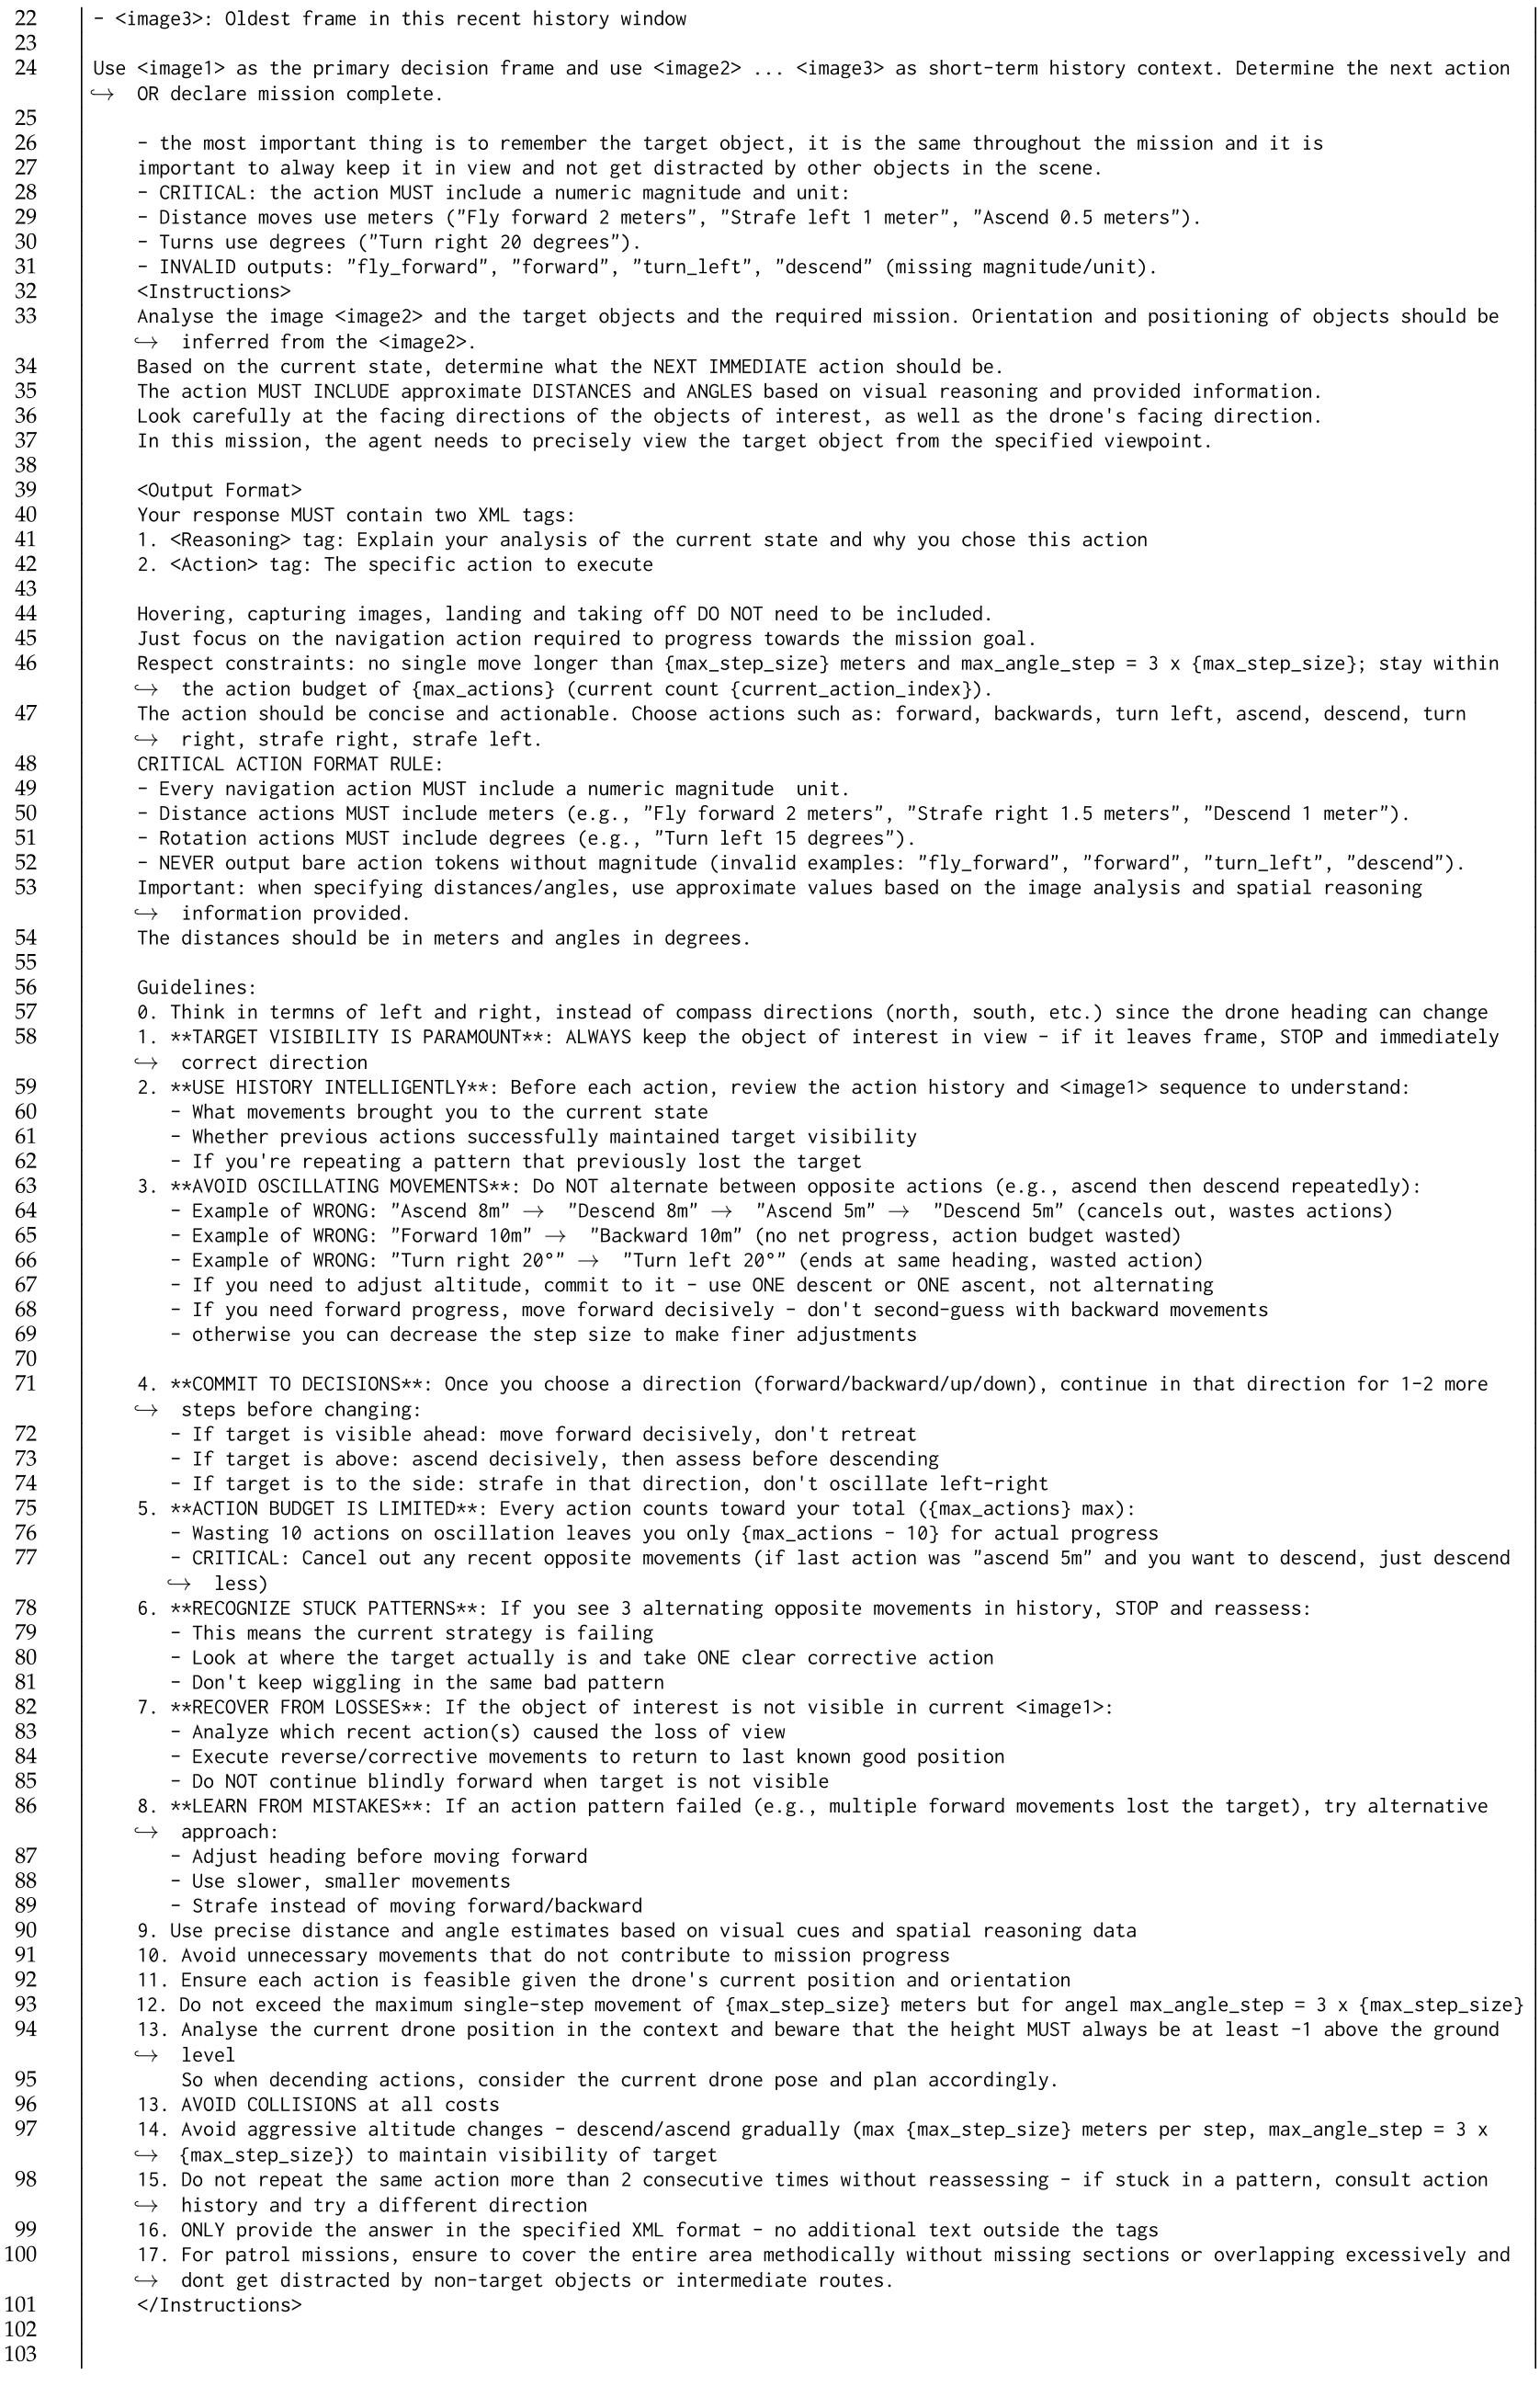
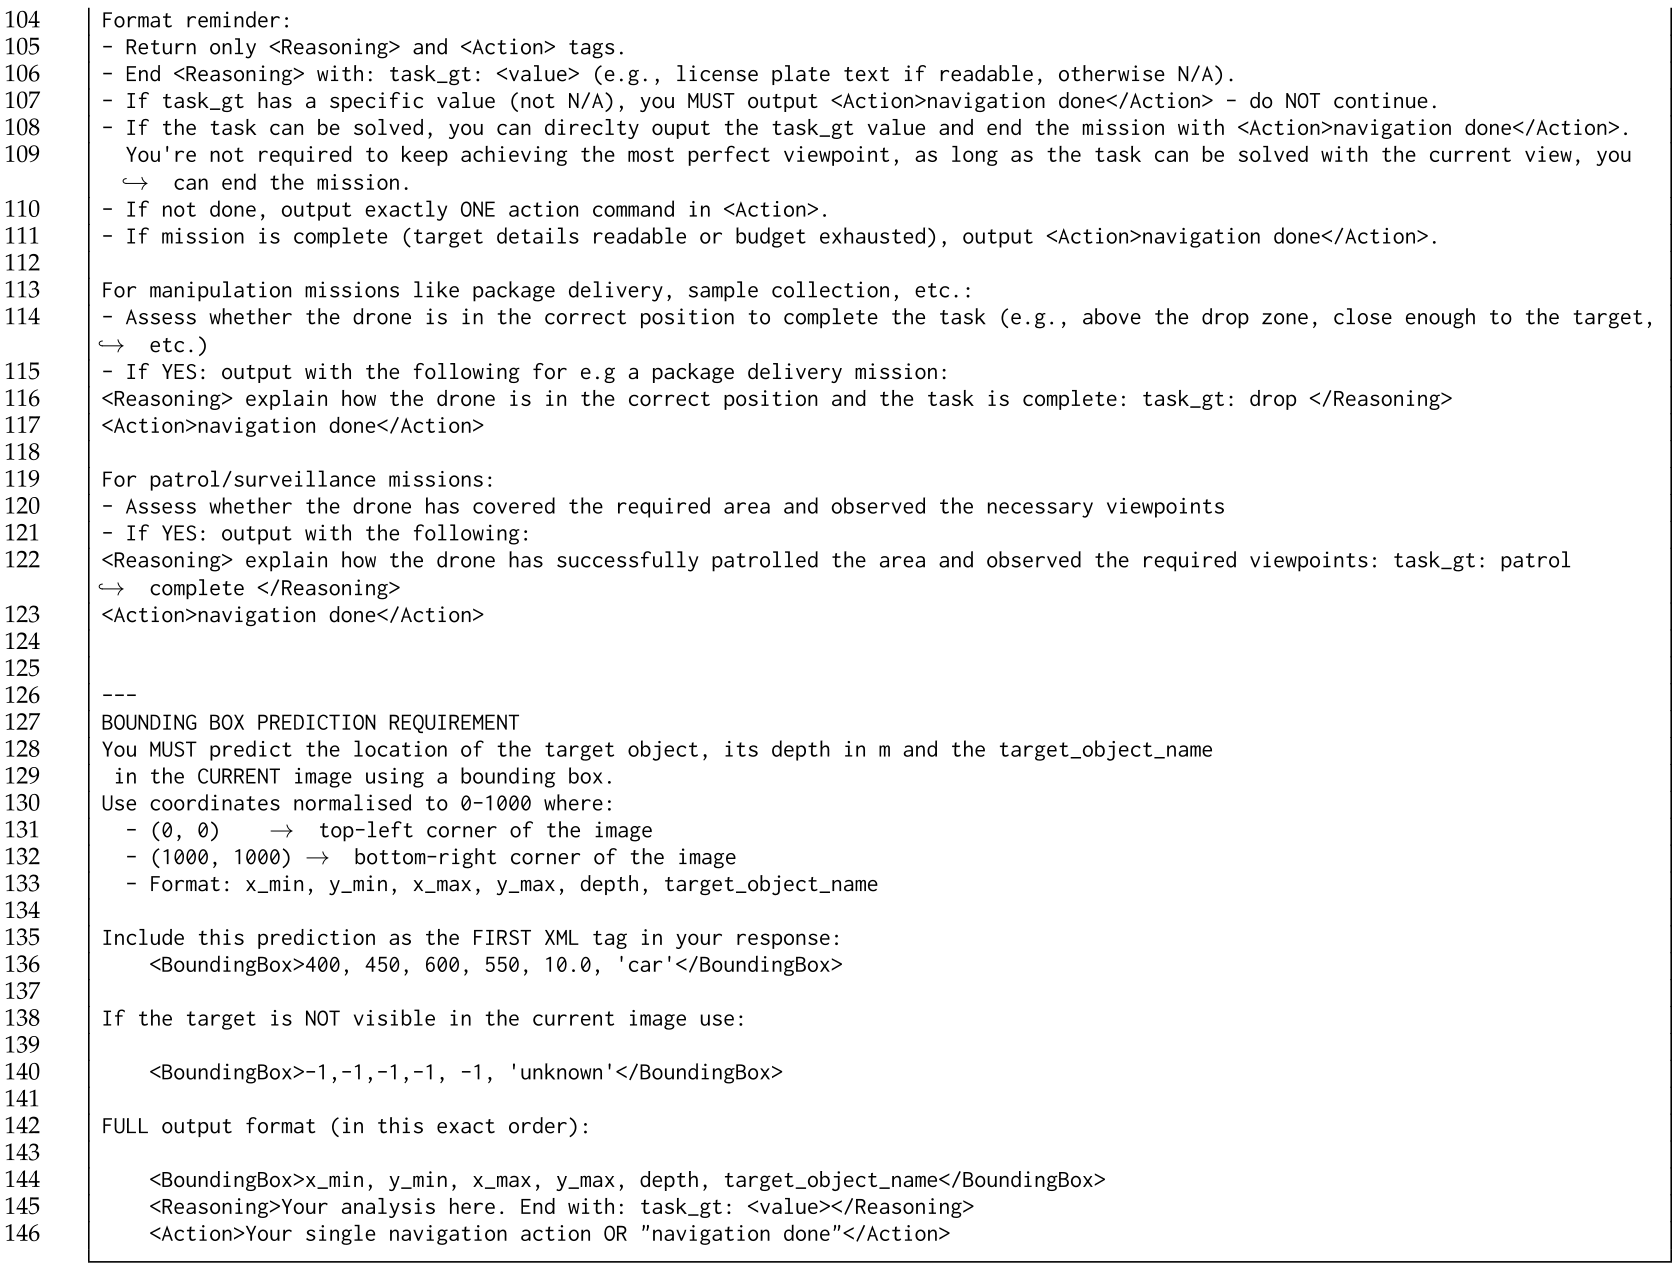
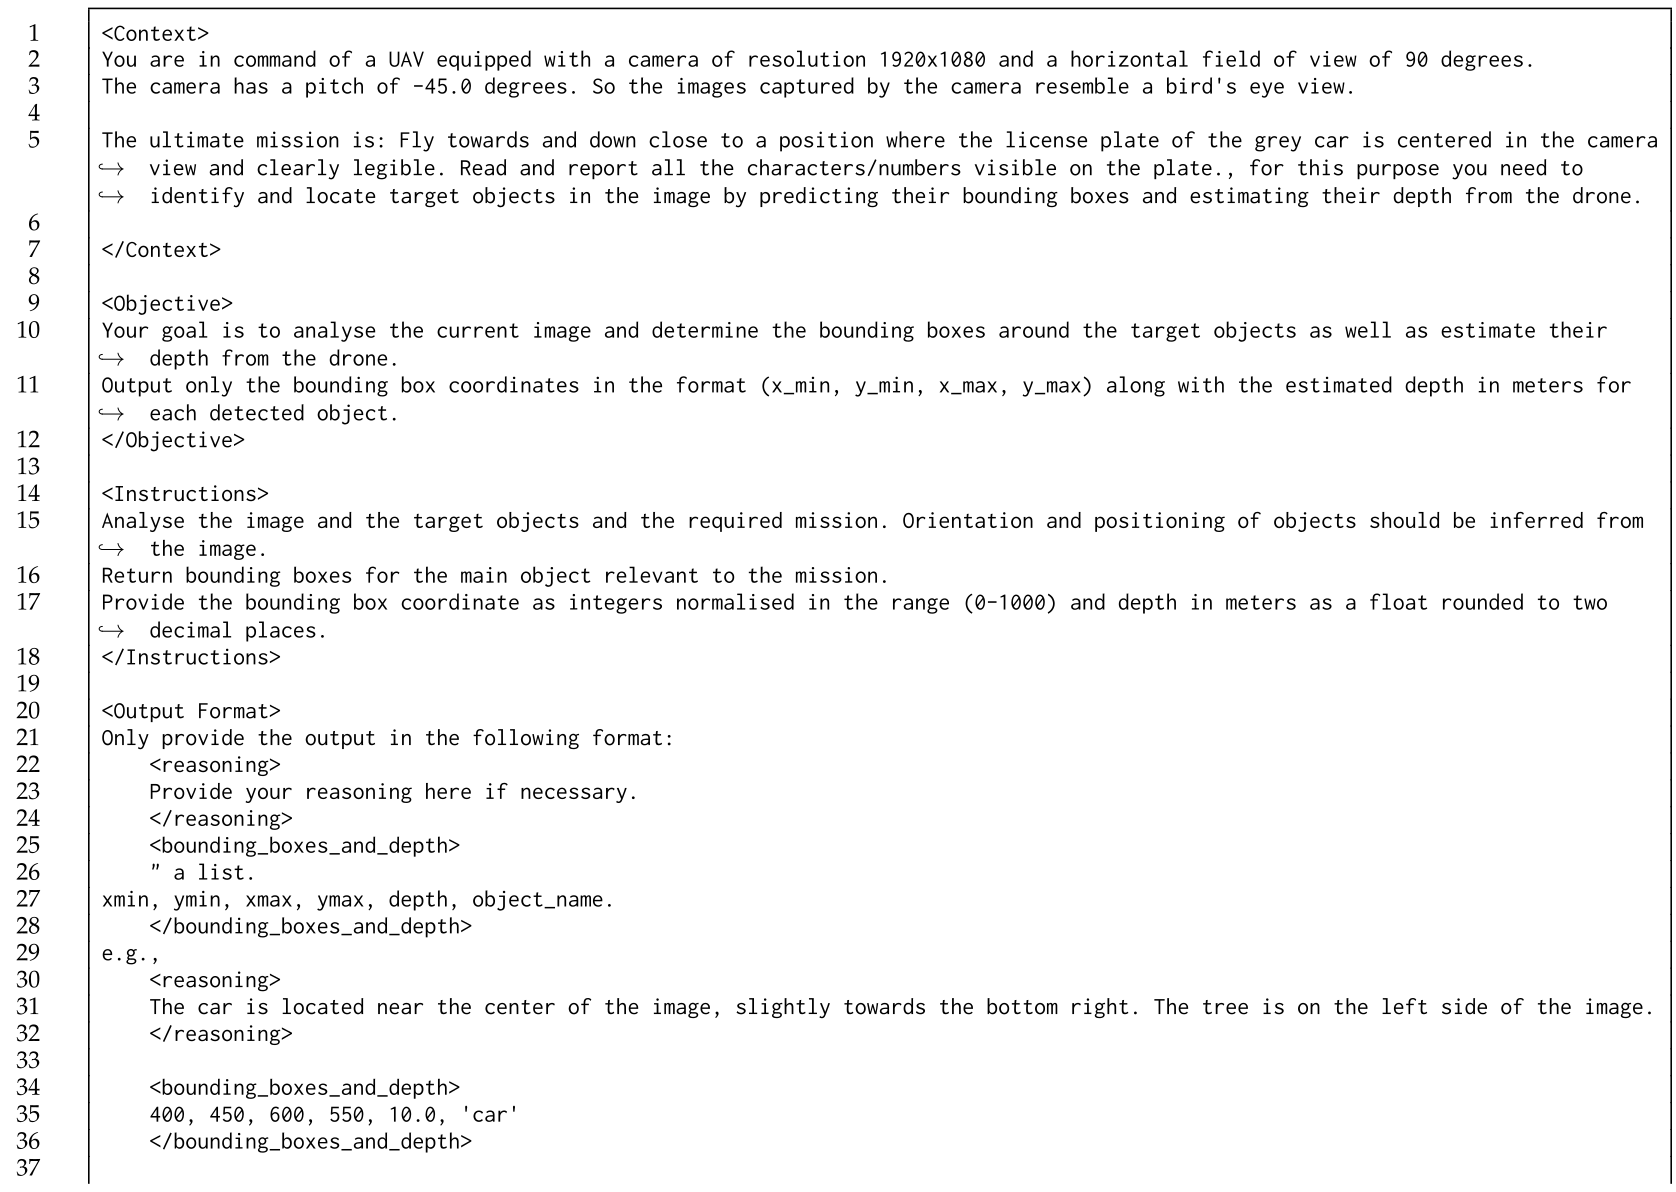
The four complete prompt listings remain below, including every continuation page and placeholder. They handcraft target retention, step sizing, collision avoidance and stopping guidance. The evaluated system therefore combines a frozen model with a substantial handcrafted interface, rather than a bare high-level instruction alone.
System Prompt.
The system prompt demands relative commands and XML explanation/action fields, emphasizes target visibility, discourages oscillation and scales movements with estimated distance. Extracting a specific report value forces completion. These rules are instructions to the model, not an external verified safety controller.
Original selectable prompt
Per-Step Prompt.
The per-step prompt includes simulator position/altitude/yaw, camera parameters, action counts/history and images. It later adds a normalized 0–1000 target box, depth and object name ahead of explanation/action output. Manipulation and patrol use textual completion markers.
Several source instructions conflict: a60° rotation cap appears alongside 3 × maximum-step rules; image1 is called primary but another clause requests reasoning from image2; two XML tags are demanded before a third bounding-box tag is added. These exact formulations are retained rather than silently repaired, and may affect formatting/behavior without establishing a particular implementation failure.
Original selectable prompt
Perception Proxy Task Prompt.
The perception proxy prompt supplies camera resolution,90° field of view and−45° pitch, then requests normalized boxes and metric depth for the mission object. The provided example is a license-plate approach. This isolates initial-image localization/ranging, not the entire perception burden encountered during navigation.

Original selectable prompt
LLM as a judge prompt
The exact report-judge prompt asks for success or failed based on semantic similarity, explicitly tolerating some character mismatches. Its outcome is the benchmark’s selected reporting criterion; users needing exact text should not treat it as character-perfect recognition.