Overview
Project website. This edition follows the complete forty-page v3, retaining all twenty-two numbered figures, twelve tables, five displayed equations and the exact PRICE evaluation prompt. The paper’s “conscious” and “unconscious” terminology names language-conditioned and observation-only training objectives; it is not a claim about subjective experience.
At a glance
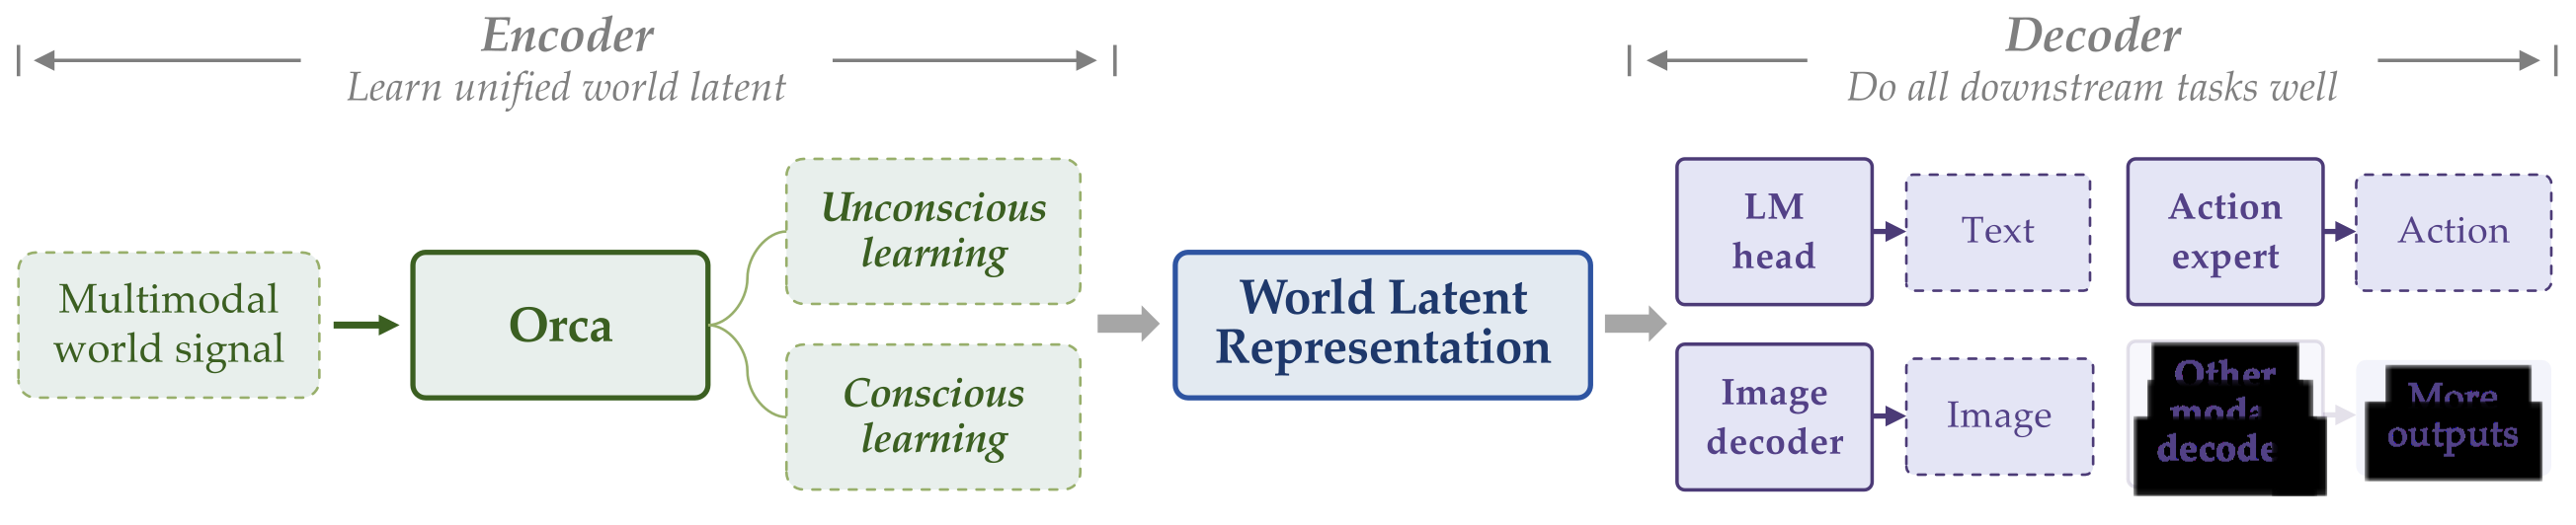
Orca adapts a pretrained vision-language model to predict visual state embeddings from observations and event descriptions, while retaining visual question answering. The learned backbone is then frozen for text, image and robot-action readouts. This tests whether a shared predictive representation helps several tasks without training its backbone separately for each downstream decoder.
The 4B model averages 51.8 on four text benchmarks, 59.8 across four image judges and 32.4 on a robot partial-progress rubric. These numbers measure different things: complete robot-task success is only 6%. Improvements over selected baselines coexist with weak smaller-model image results, uneven robot transfer and reliance on substantial supervised readout training.
1 Introduction
The paper proposes state-transition prediction as a common representation-learning objective across understanding, visual prediction and control. Its implemented inputs are vision and language; audio, force, touch and scientific-domain signals are future ambitions. Training uses video-derived latent targets, language descriptions of events and question–answer pairs.
The collected inventory contains 125,000 video hours, 160 million event annotations and 11.5 million VQA examples, but the reported version uses approximately 12,500 video hours. Frozen-backbone readouts probe the value of the representation; they do not establish autonomous self-evolution, a complete physical state or unrestricted general intelligence.
2 Orca
2.1 Modeling
Macro.
The conceptual model maps multimodal observations to a latent state and describes its transition under implicit dynamics and explicit conditions. Positive time offsets predict future states; negative offsets refer to earlier states. The latent dynamics variable represents unobserved influences in this formulation, rather than a separately identified physical law or explicit mechanistic simulator.
Equation 1
| (1) |
Details.
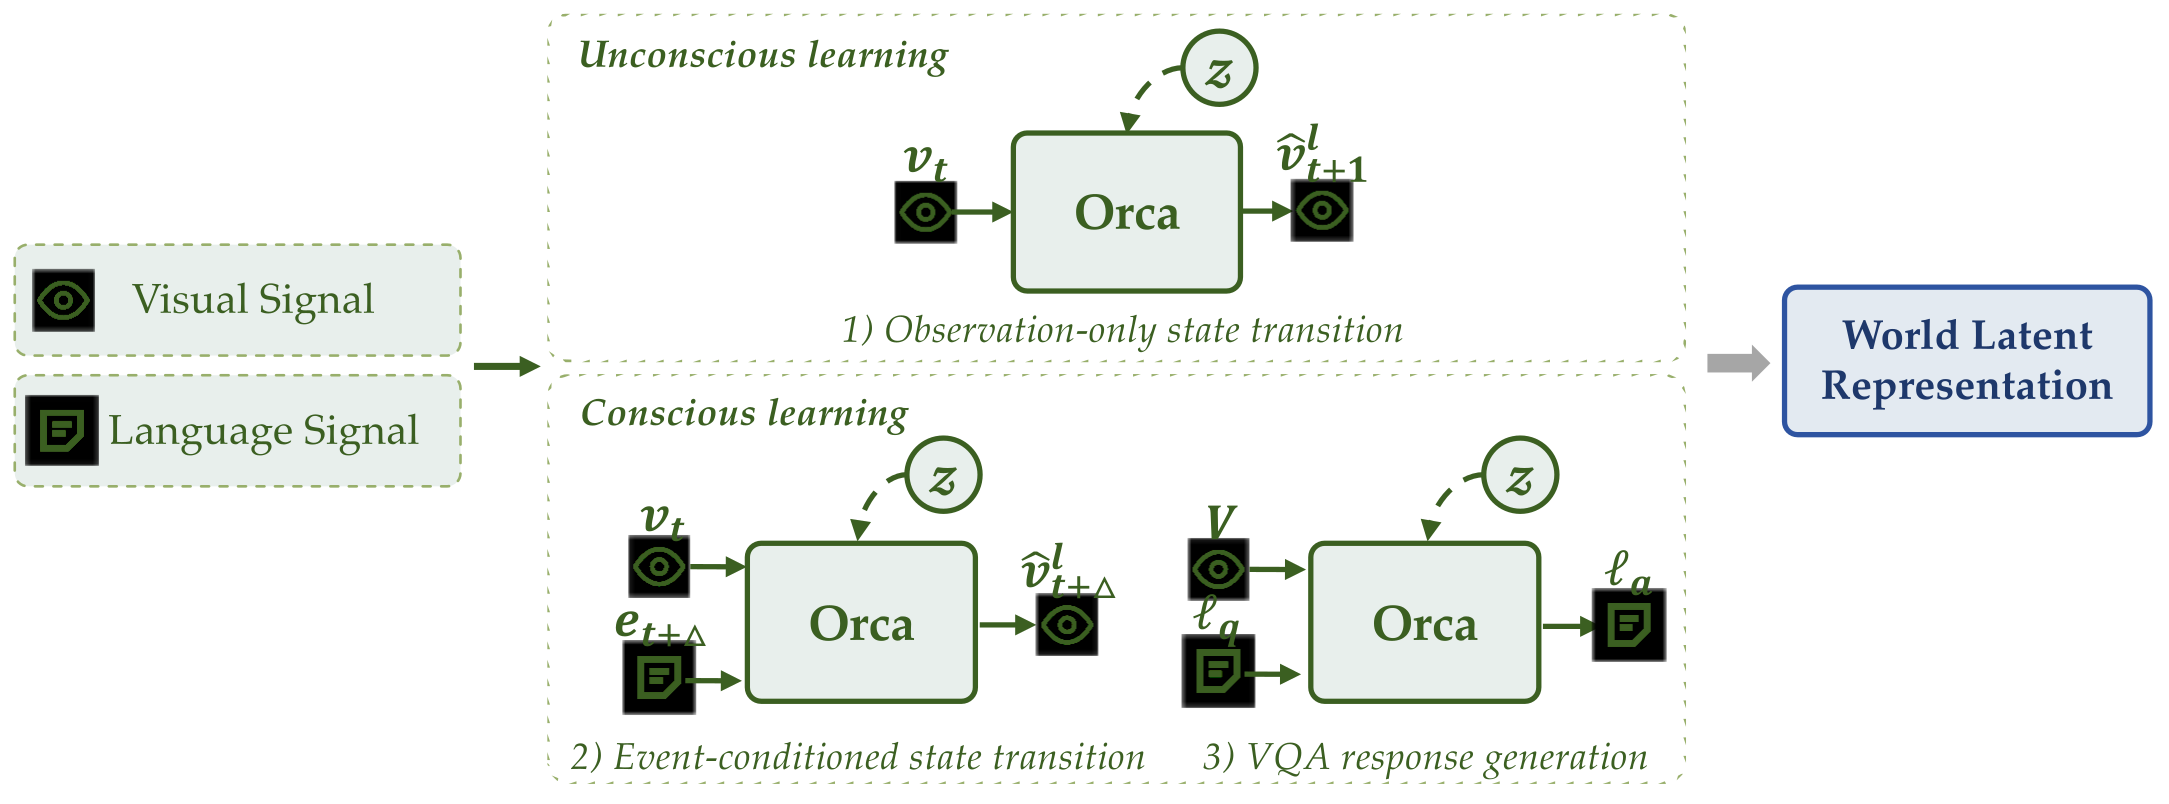
Observation-only learning predicts a nearby future frame’s embedding from the current frame. Event-conditioned learning instead uses a description of a previous or next event to predict a frame sampled within that event. Language supplies direction and semantic context; VQA additionally preserves an explanatory interface.
These are learned observational and conditional prediction tasks. Successful conditioned answers or images do not by themselves identify causal effects under arbitrary interventions or prove that hidden physical state is uniquely reconstructed.
2.2 Architecture
Encoder.
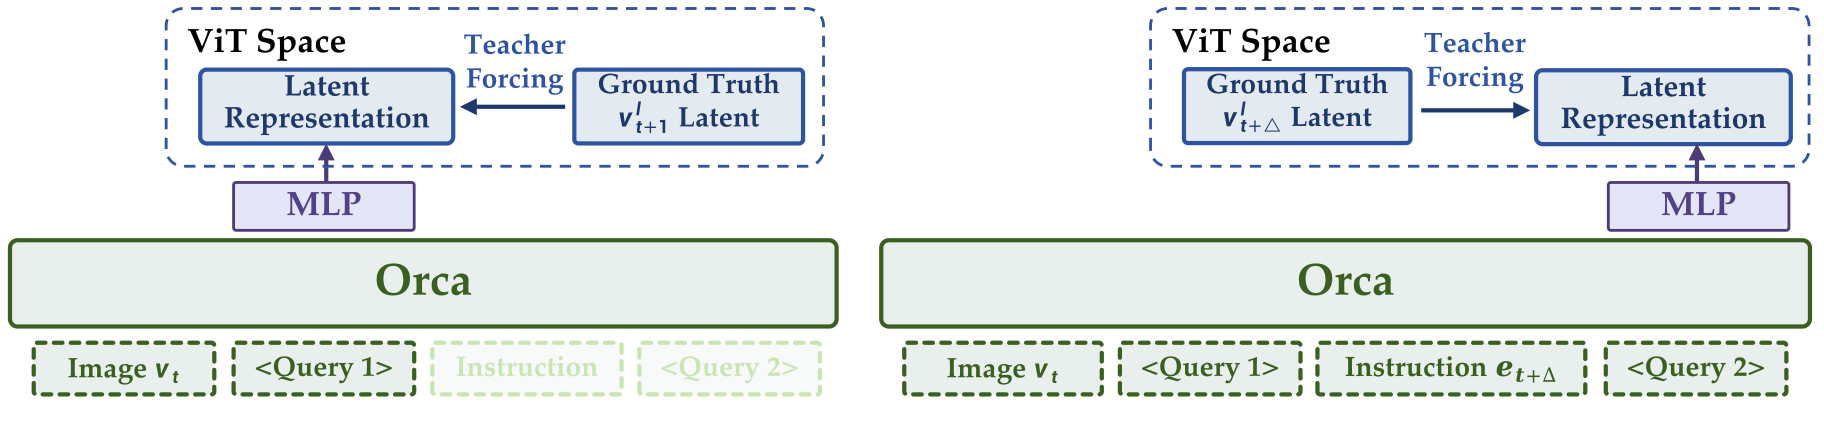
The encoder starts from Qwen3.5. Learnable query states pass through its language backbone and a two-layer MLP to predict target embeddings from its frozen vision encoder. The language backbone, query parameters and prediction heads are trained; the visual target space remains fixed.
One query group predicts an adjacent frame without a language event. A second follows the event instruction and predicts its target frame. A separate video-question input produces a language answer. Calling targets ground truth means ground-truth frame embeddings, not measured complete physical states.
Decoder.
The learned representation supports separate text, vision and action interfaces. Text reuses the existing language head; images and actions require their own trained readouts, detailed below.
3 Training
Pretraining changes the predictive backbone using visual/language supervision. Downstream image/action training freezes that backbone and learns modality-specific modules. Thus action-label-free pretraining should not be confused with action-label-free robot policy learning.
3.1 Pre-Training
3.1.1 Pre-Training Recipe
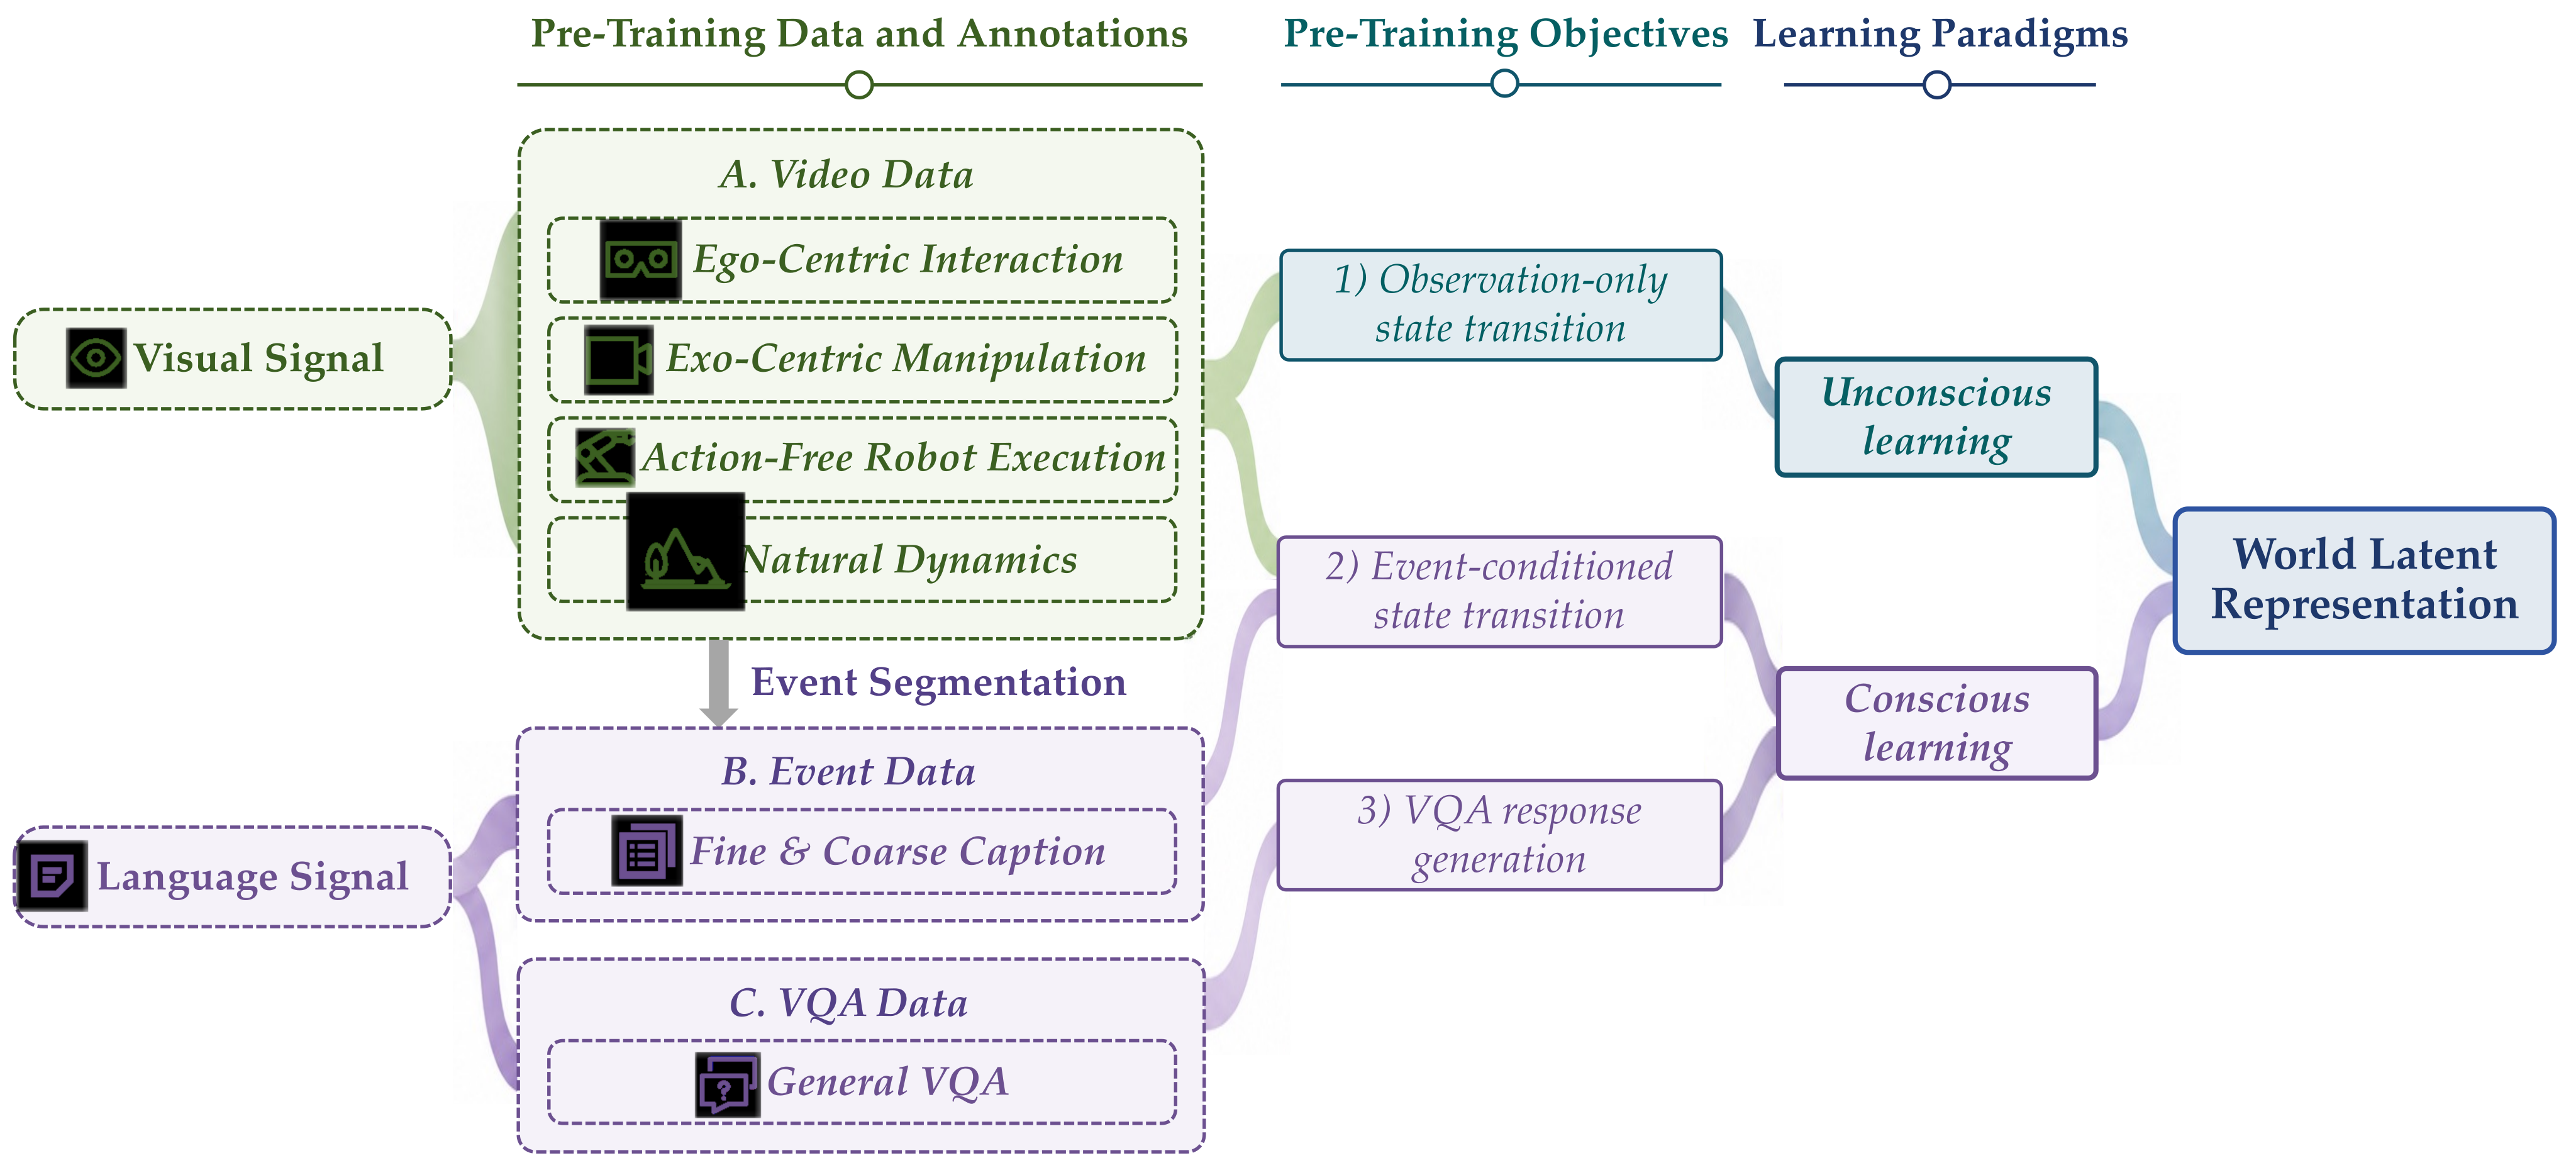
Three losses train next-frame latent prediction, event-conditioned latent prediction and VQA. Learnable query groups provide the visual prediction interface; the language-model head supplies answer tokens.
Learning Objectives.
The input order is visual tokens, Query 1, the instruction and Query 2. Query 1’s final hidden states predict the next frame through an MLP. Query 2 reads the instruction-conditioned state and predicts a random frame from the indicated neighboring event. Both targets come from the frozen vision encoder.
VQA uses ordinary autoregressive cross-entropy on target answers. The paper calls latent matching teacher forcing, but the specified objective compares a prediction with a frozen target embedding rather than reconstructing target pixels during pretraining.
Training Components.
The final objective weights observation prediction by 0.1, event prediction by 0.5 and VQA by 0.4. Within each latent loss, squared error has weight 0.1 and cosine distance weight 0.9. Event loss averages previous- and next-event directions. State-transition and VQA samples are mixed approximately 5:1; sampling frequency and loss coefficients are distinct choices.
Equation 2
| (2) |
3.1.2 Pre-Training Data
Data Organization.
Video sources include first-person interaction, third-person manipulation, robot execution without action labels and natural dynamics. Coarse/fine event segmentation supplies language descriptions, while VQA adds questions about observed relations, intentions and consequences.
The inventory is larger than the reported training subset: Table C1 specifies approximately 12.5K video hours. The 160M event and 11.5M VQA inventory totals should not be read as explicit counts of examples consumed by this run. Video-based robot observations are present even though robot action labels are absent during pretraining.
3.2 Downstream Post-Training
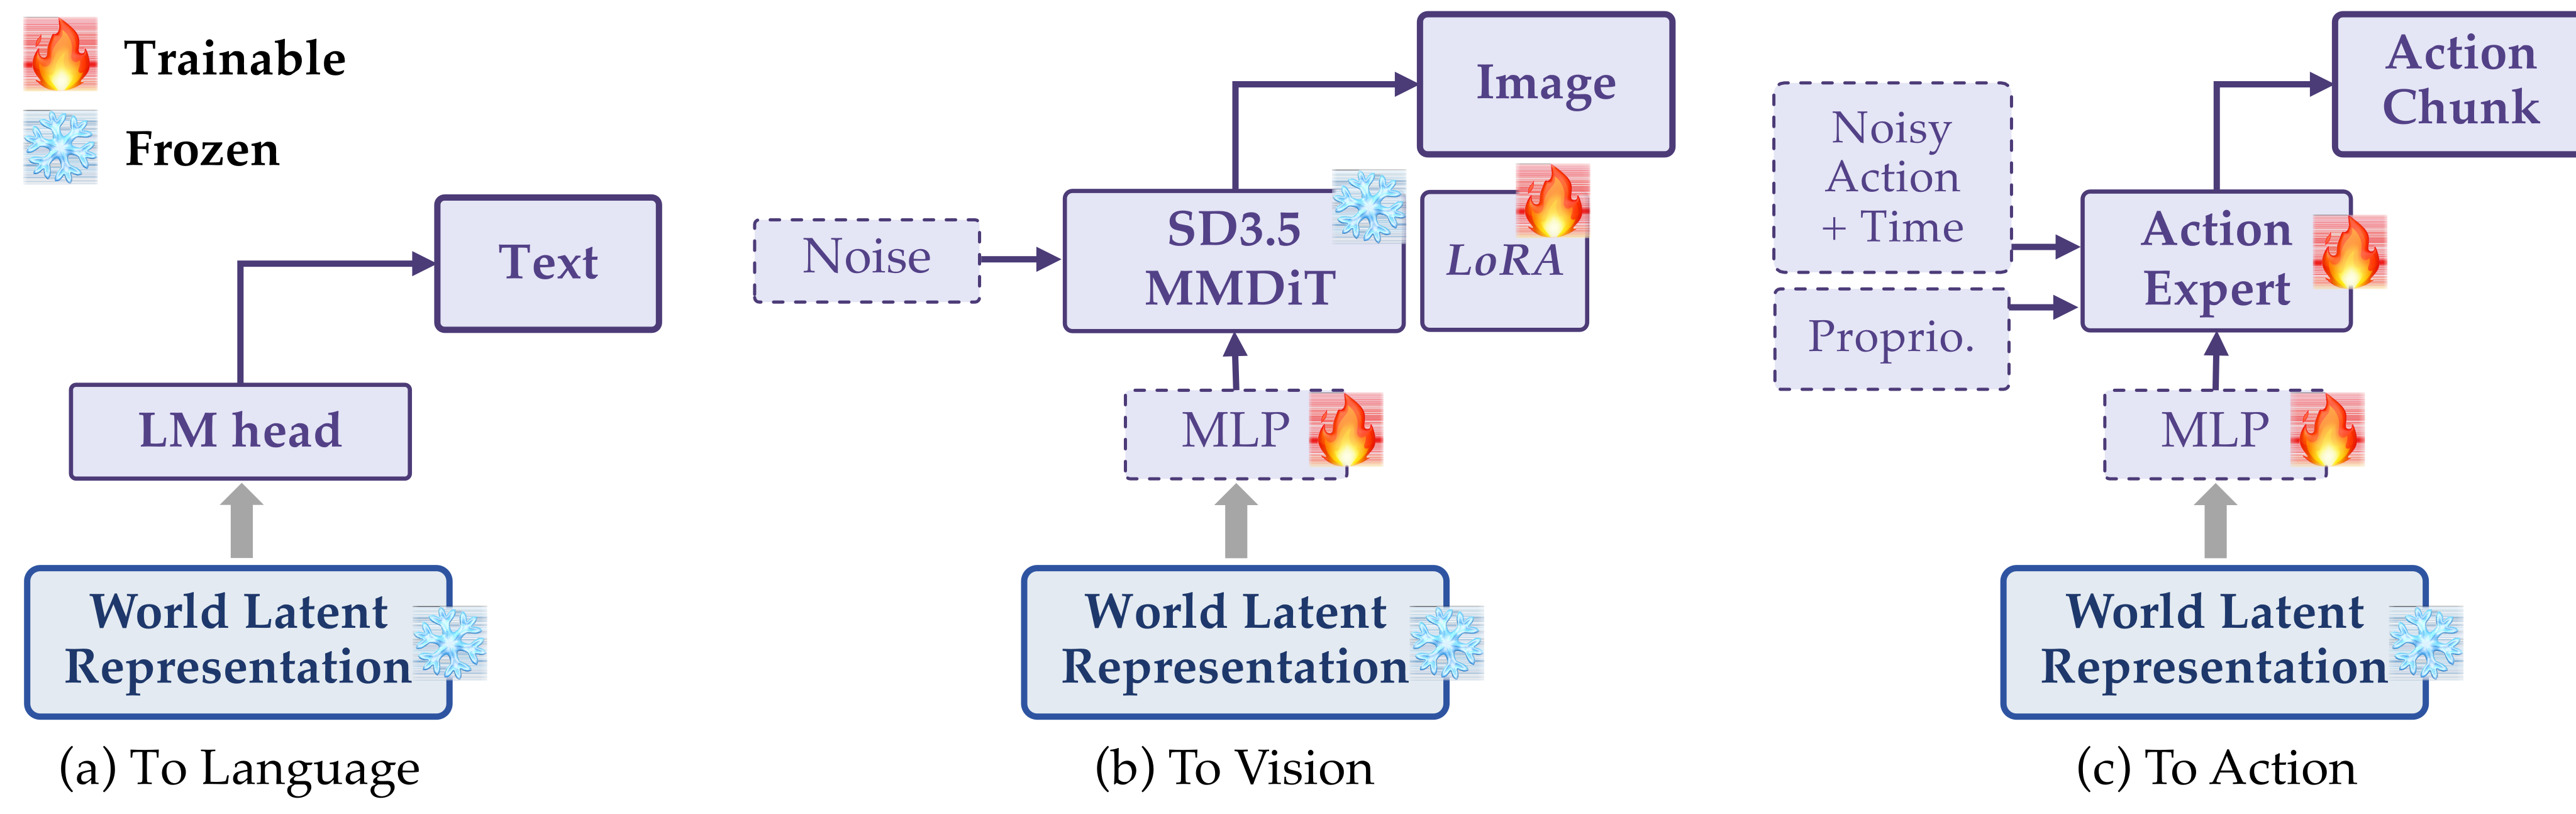
With the backbone frozen, downstream modules test how its representation supports different outputs. The text interface requires no new module, the image interface uses a pretrained generative decoder, and the action interface is trained on labeled robot demonstrations. These are different forms and amounts of adaptation.
3.2.1 To Language: Text Generation
Text is generated autoregressively with the existing language-model head. No additional decoder is attached or separately trained for the reported language readout; its language ability was already supervised by pretraining VQA.
3.2.2 To Vision: Image Prediction
Vision Readout Recipe.
An adaptor maps Orca’s predictive latent into the conditioning space of Stable Diffusion 3.5 Medium. The decoder uses its frozen VAE and pretrained diffusion-transformer weights, with a trainable MLP adaptor and attention-projection LoRA. Denoising produces the target image.
This is a strong generative readout around a learned representation. Its output quality reflects both Orca’s conditioning and the pretrained decoder, rather than a direct visualization of a uniquely correct latent physical state.
Image Prediction Data.
Paired current/target video frames and instructions train the image readout. Orca supplies the target-state latent while remaining frozen. “Zero-shot” downstream benchmark evaluation means no benchmark-specific tuning, not that this image decoder received no task-relevant training.
3.2.3 To Action: Action Generation
Action Readout Recipe.
A diffusion-transformer Action Expert receives an adaptor-transformed Query 1 latent, noisy actions with time embeddings and robot proprioception. Flow matching trains it to predict the velocity used for denoising action chunks. Only the adaptor/expert are updated during this stage.
Embodied Action Data.
The dual-arm wheeled robot supplies two hundred demonstrations for each of five manipulation tasks. These labeled trajectories include instructions, images, actions and proprioception. The backbone learns without action labels first; each downstream task still requires supervised action-expert training.
3.3 Infrastructures
The FlagScale implementation combines FSDP2 sharding, activation recomputation, chunked cross-entropy and forward/backward prefetching. On the reported H100 setup, throughput rises from 0.66 to 2.91 samples/s/GPU versus StarVLA, about 4.4×. This is training throughput for the tested configuration, not robot control frequency or an architecture-independent speedup.
4 Evaluation
4.1 Effectiveness and Scaling Behavior
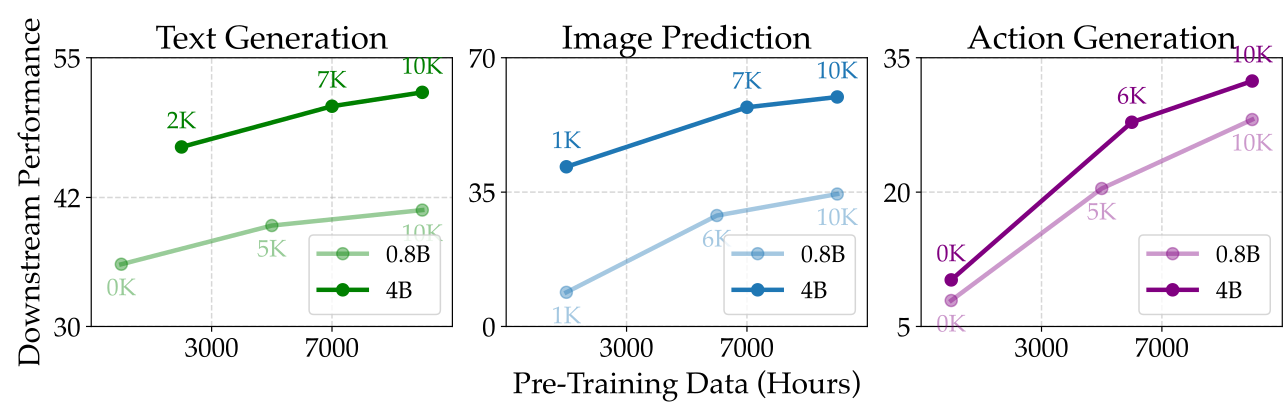
The study tests whether pretraining loss and frozen-backbone readouts improve as model size/data increase. Evidence consists of two backbone sizes and selected checkpoints, rather than a fitted universal scaling law.
4.1.1 Loss of Proposed Learning Paradigm
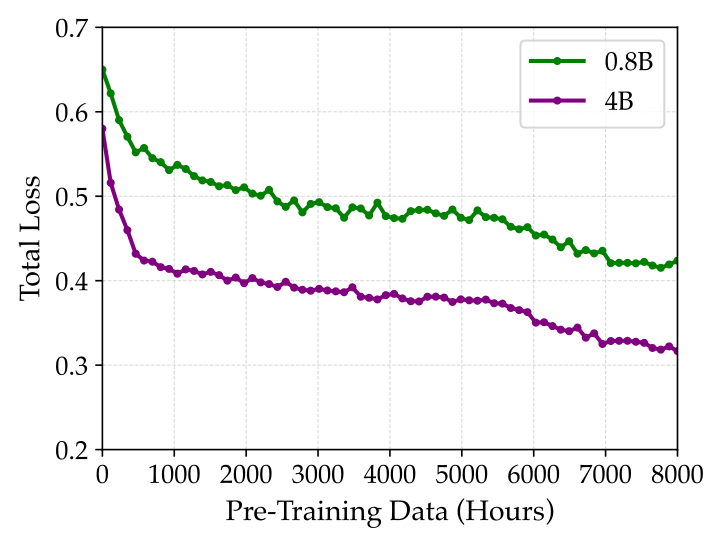
Both 0.8B and 4B models show declining combined training loss as more video is processed, with the larger model lower over the plotted range. This establishes optimization behavior under these objectives; lower training loss alone is not an independent guarantee of calibrated physical prediction or future scaling.
4.1.2 Relationship between latent and downstream readout performance
Selected checkpoints generally improve text benchmark averages, PRICE image scores and robot progress after readout training. The frozen encoder makes this useful evidence for representation transfer. Larger-model gains remain conditioned on the pretrained Qwen initialization, video/VQA data and downstream decoder protocols.
Action improvement from video-based pretraining is not zero-shot action generation: the Action Expert is trained on the robot demonstrations. The limitations section also reports tradeoffs among readouts as pretraining proceeds, so the plotted trends should not imply every capability improves at every checkpoint.
4.2 Downstream Readout Analysis
The three evaluations use distinct metrics: benchmark-answer accuracy, model-judged image quality and robot progress/success. The paper states that evaluation benchmarks are not used for task-specific tuning; this does not make the image and action readouts training-free.
4.2.1 Comparison on Text Generation
Text readout is assessed on temporal, interaction and spatial questions. Aggregate accuracy describes the tested benchmark distribution, not a direct physical-law or causal-identification test.
Benchmarks.
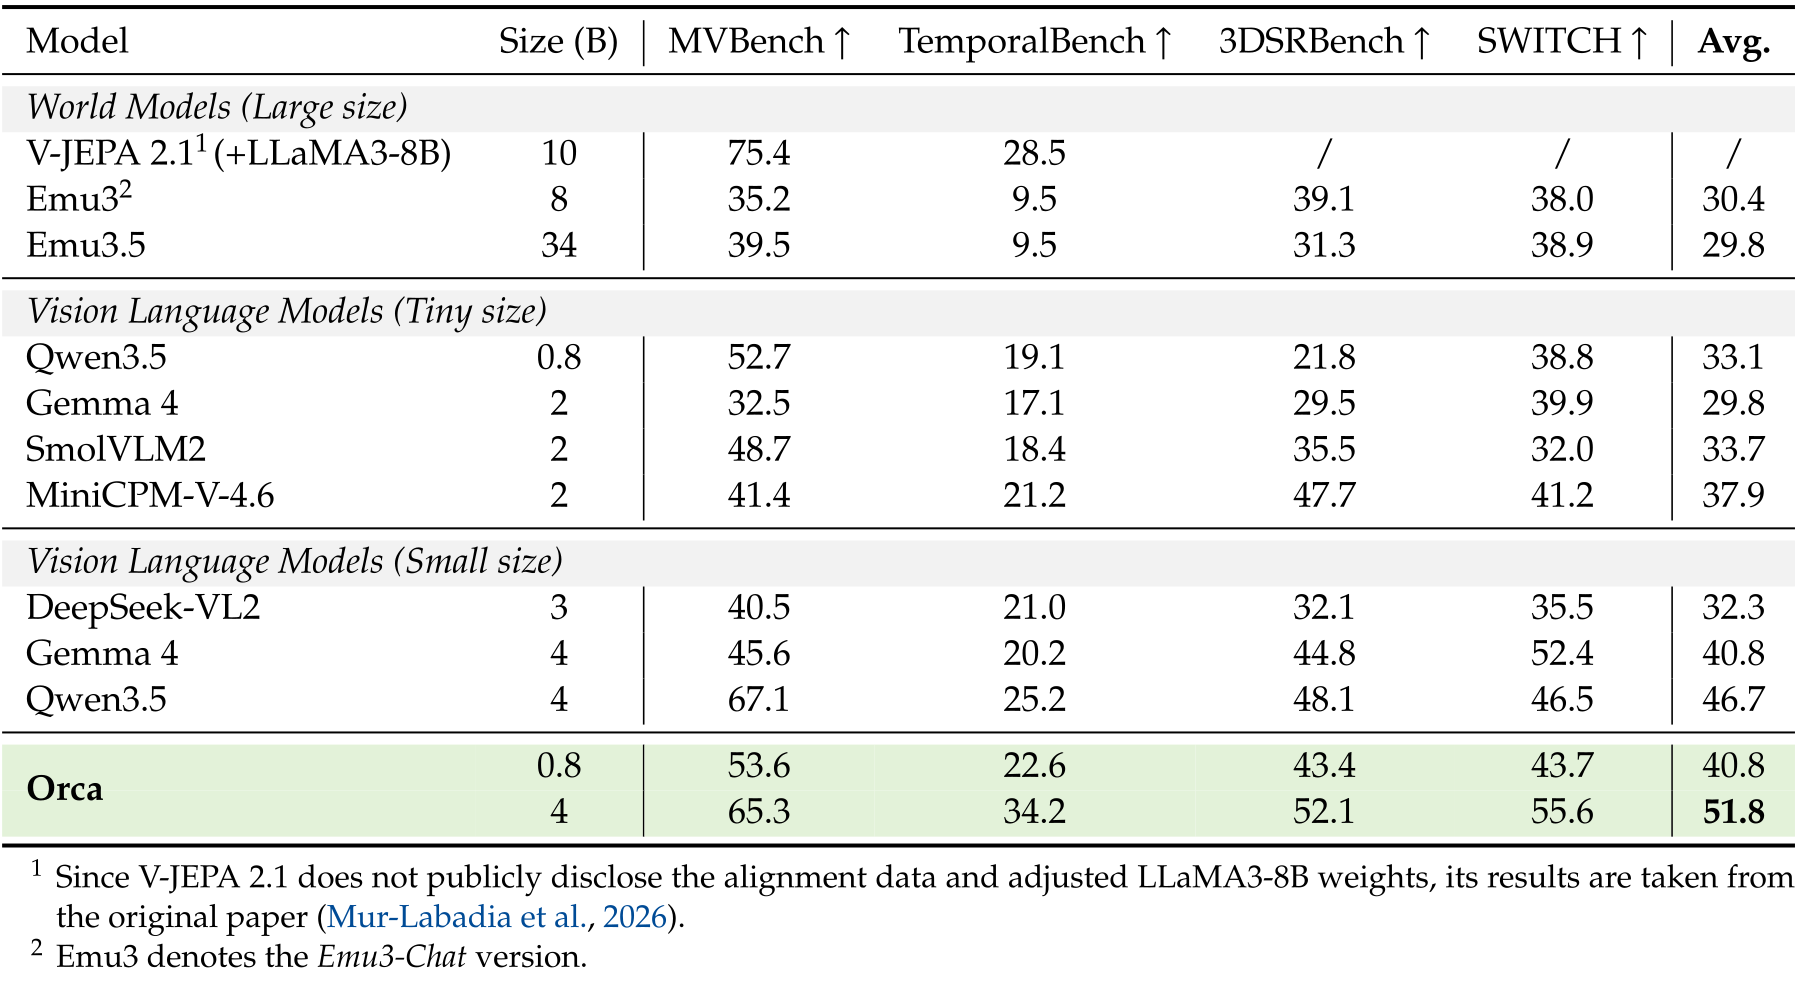
MVBench covers video understanding; TemporalBench emphasizes fine temporal distinctions; 3DSRBench tests 3D spatial reasoning; SWITCH evaluates tangible control interfaces. Their scores are averaged in the main comparison.
Baselines.
Comparators include latent/autoregressive world models and vision-language models at several parameter scales. V-JEPA 2.1’s language results are taken from its original paper because the adjusted language weights/alignment data are unavailable; two benchmark entries and its overall mean are missing. It is therefore not a complete four-benchmark comparison against that system.
Results and Analysis.
Orca-4B averages 51.8 versus Qwen3.5-4B’s 46.7, improving TemporalBench, 3DSRBench and SWITCH but scoring lower on MVBench, 65.3 versus 67.1. Orca-0.8B averages 40.8 versus the same-sized Qwen’s 33.1.
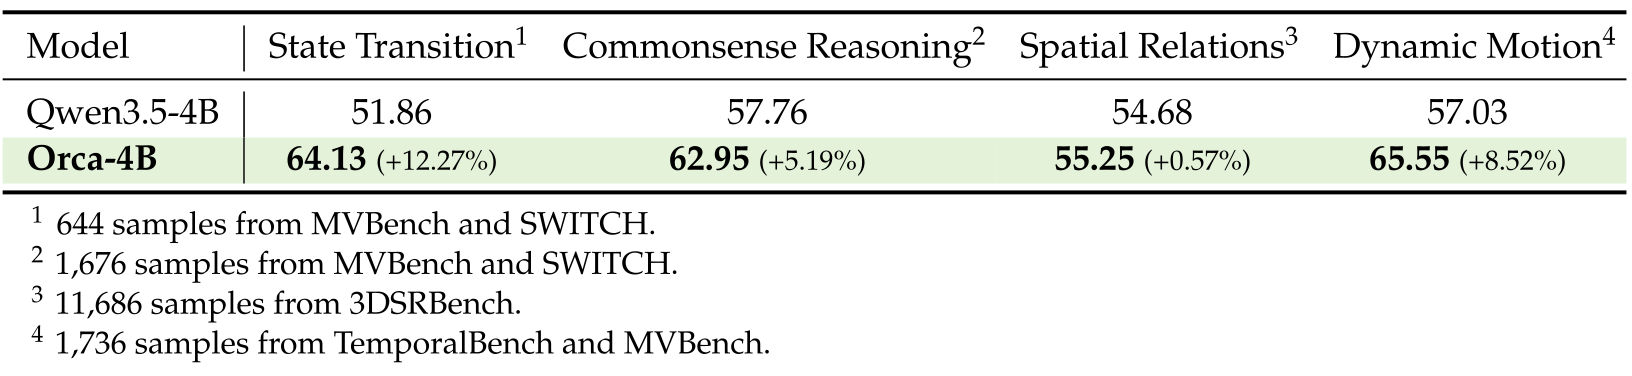
Regrouped capability scores favor Orca-4B over Qwen by 12.27, 5.19, 0.57 and 8.52 percentage points for transition, commonsense, spatial and motion categories. The source prints percent signs for these differences. These are curated subsets of existing benchmarks with unequal sample counts, not new independent intervention experiments or equal-weight evidence across physical capabilities.
Original selectable table
| Model | Size (B) | MVBench | TemporalBench | 3DSRBench | SWITCH | Avg. |
| World Models (Large size) | ||||||
| V-JEPA 2.11 (+LLaMA3-8B) | 10 | 75.4 | 28.5 | / | / | / |
| Emu32 | 8 | 35.2 | 9.5 | 39.1 | 38.0 | 30.4 |
| Emu3.5 | 34 | 39.5 | 9.5 | 31.3 | 38.9 | 29.8 |
| Vision Language Models (Tiny size) | ||||||
| Qwen3.5 | 0.8 | 52.7 | 19.1 | 21.8 | 38.8 | 33.1 |
| Gemma 4 | 2 | 32.5 | 17.1 | 29.5 | 39.9 | 29.8 |
| SmolVLM2 | 2 | 48.7 | 18.4 | 35.5 | 32.0 | 33.7 |
| MiniCPM-V-4.6 | 2 | 41.4 | 21.2 | 47.7 | 41.2 | 37.9 |
| Vision Language Models (Small size) | ||||||
| DeepSeek-VL2 | 3 | 40.5 | 21.0 | 32.1 | 35.5 | 32.3 |
| Gemma 4 | 4 | 45.6 | 20.2 | 44.8 | 52.4 | 40.8 |
| Qwen3.5 | 4 | 67.1 | 25.2 | 48.1 | 46.5 | 46.7 |
| 0.8 | 53.6 | 22.6 | 43.4 | 43.7 | 40.8 | |
| Orca | 4 | 65.3 | 34.2 | 52.1 | 55.6 | 51.8 |
- 1
Since V-JEPA 2.1 does not publicly disclose the alignment data and adjusted LLaMA3-8B weights, its results are taken from the original paper (Mur-Labadia et al., 2026).
- 2
Emu3 denotes the Emu3-Chat version.
Original selectable table
| Model | State Transition1 | Commonsense Reasoning2 | Spatial Relations3 | Dynamic Motion4 |
| Qwen3.5-4B | 51.86 | 57.76 | 54.68 | 57.03 |
| Orca-4B | 64.13 (+12.27%) | 62.95 (+5.19%) | 55.25 (+0.57%) | 65.55 (+8.52%) |
- 1
644 samples from MVBench and SWITCH.
- 2
1,676 samples from MVBench and SWITCH.
- 3
11,686 samples from 3DSRBench.
- 4
1,736 samples from TemporalBench and MVBench.
4.2.2 Comparison on Image Prediction
Image prediction tests whether the generated result plausibly follows an instruction from an observed real scene. Its judge-based metric should be kept separate from measured state prediction or real action success.
Benchmark.
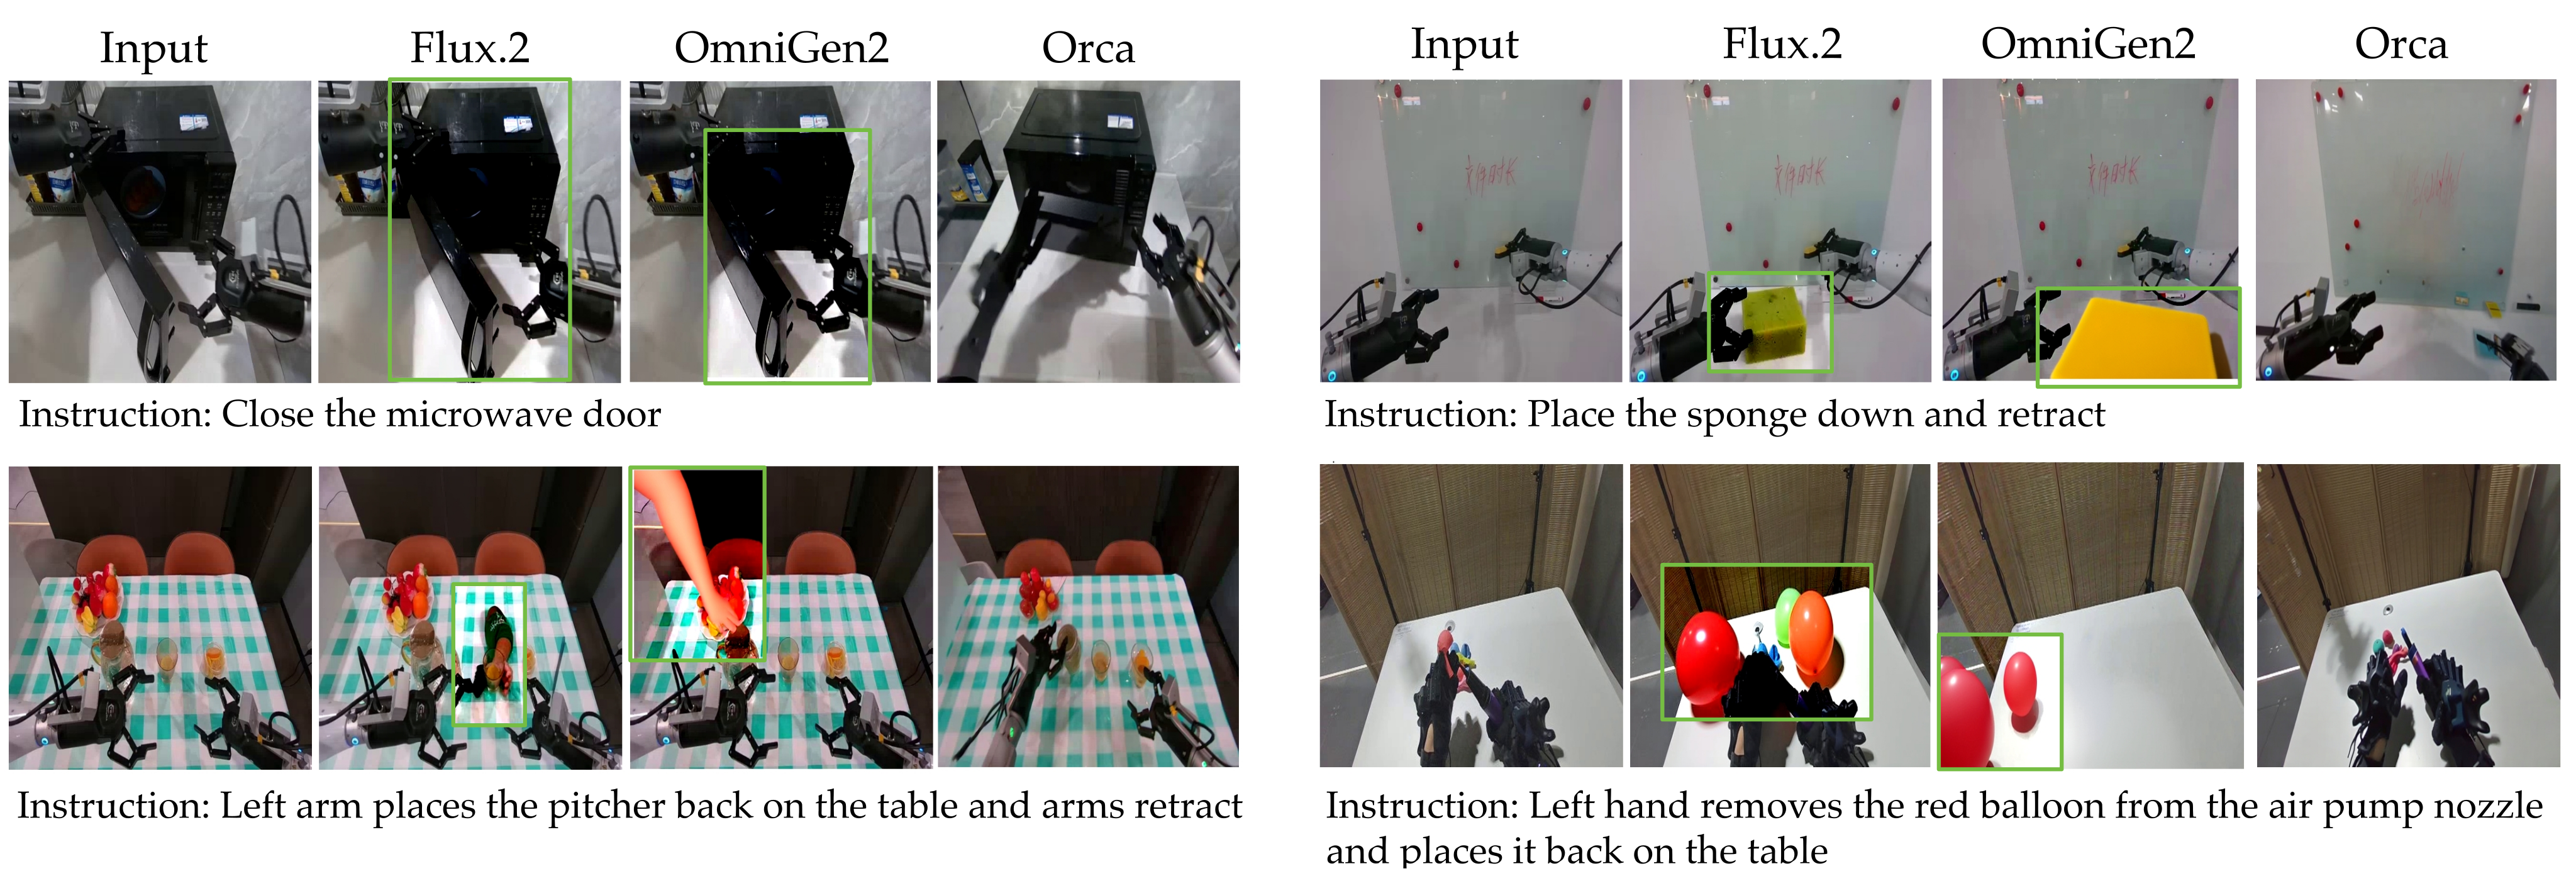
PRICE-V0.1 pairs initial images and instructions from real interaction datasets with target-state examples. It asks for an instruction-conditioned resulting image, emphasizing scene consistency and plausible interactions rather than visual editing quality alone.
Metrics.
Four model judges—Gemini 3.1 Pro, GPT-5.4, Doubao Seed 2.0 Pro and Gemma 4-31B—score generated images. The retained prompt gives each judge the initial and generated images plus instruction, not the recorded target image. It explicitly allows imperfect/in-progress execution and minor artifacts.
These are model judgments of apparent execution and plausibility. They do not certify that a proposed interaction is physically executable, and the reported spread across judges is not a confidence interval over trials.
Baselines.
OmniGen2, FLUX.1-Kontext and FLUX.2 [klein] provide image-generation/editing baselines. Parameter totals include different combinations of language and image decoders; the table’s model-size comparison is not a match of pretraining data, adaptation compute or architecture.
Results and Analysis.
Orca-4B plus its 2B image decoder averages 59.8 across judges versus FLUX.2 [klein]’s 56.1. It leads three judges but loses under Gemma, 66.3 versus 70.2. The 0.8B Orca image result averages only 34.5, below all three baselines.
The 59.8±10.9 notation summarizes the four judge scores, whose disagreement is substantial. Selected image examples illustrate fewer scene/contact inconsistencies; neither that average nor selected examples establish uniform superiority or guaranteed physical consistency.

Original selectable table
| Model | Size (B) | Gemini 3.1 Pro | GPT 5.4 | Doubao-Seed-2.0 | Gemma 4-31B | Avg. |
| OmniGen2 | 3+4 | 24.6 | 46.8 | 41.4 | 45.5 | 39.610.2 |
| FLUX.1-Kontext | 12 | 21.6 | 46.9 | 42.7 | 52.5 | 40.913.5 |
| FLUX.2 [klein] | 4+4 | 29.7 | 64.6 | 60.0 | 70.2 | 56.118.1 |
| 0.8+2 | 17.0 | 48.5 | 46.0 | 26.5 | 34.515.3 | |
| Orca | 4+2 | 44.0 | 67.9 | 61.0 | 66.3 | 59.810.9 |
4.2.3 Comparison on Action Generation
Robot evaluation asks whether a frozen predictive representation helps separately trained action experts on changed appearances and objects. Full success remains rare, making partial-progress diagnostics central to the reported advantage.
Benchmarks.
Five tasks involve book placement, bowl stacking, tissue extraction, stamping and sugar scooping. Environment OOD changes three tablecloth/background appearances. Object OOD substitutes semantically related objects and, as Table E1 shows, also changes concrete instructions and targets—for example, book-to-cutting-board placement and tissue-to-bread extraction.
Metrics.
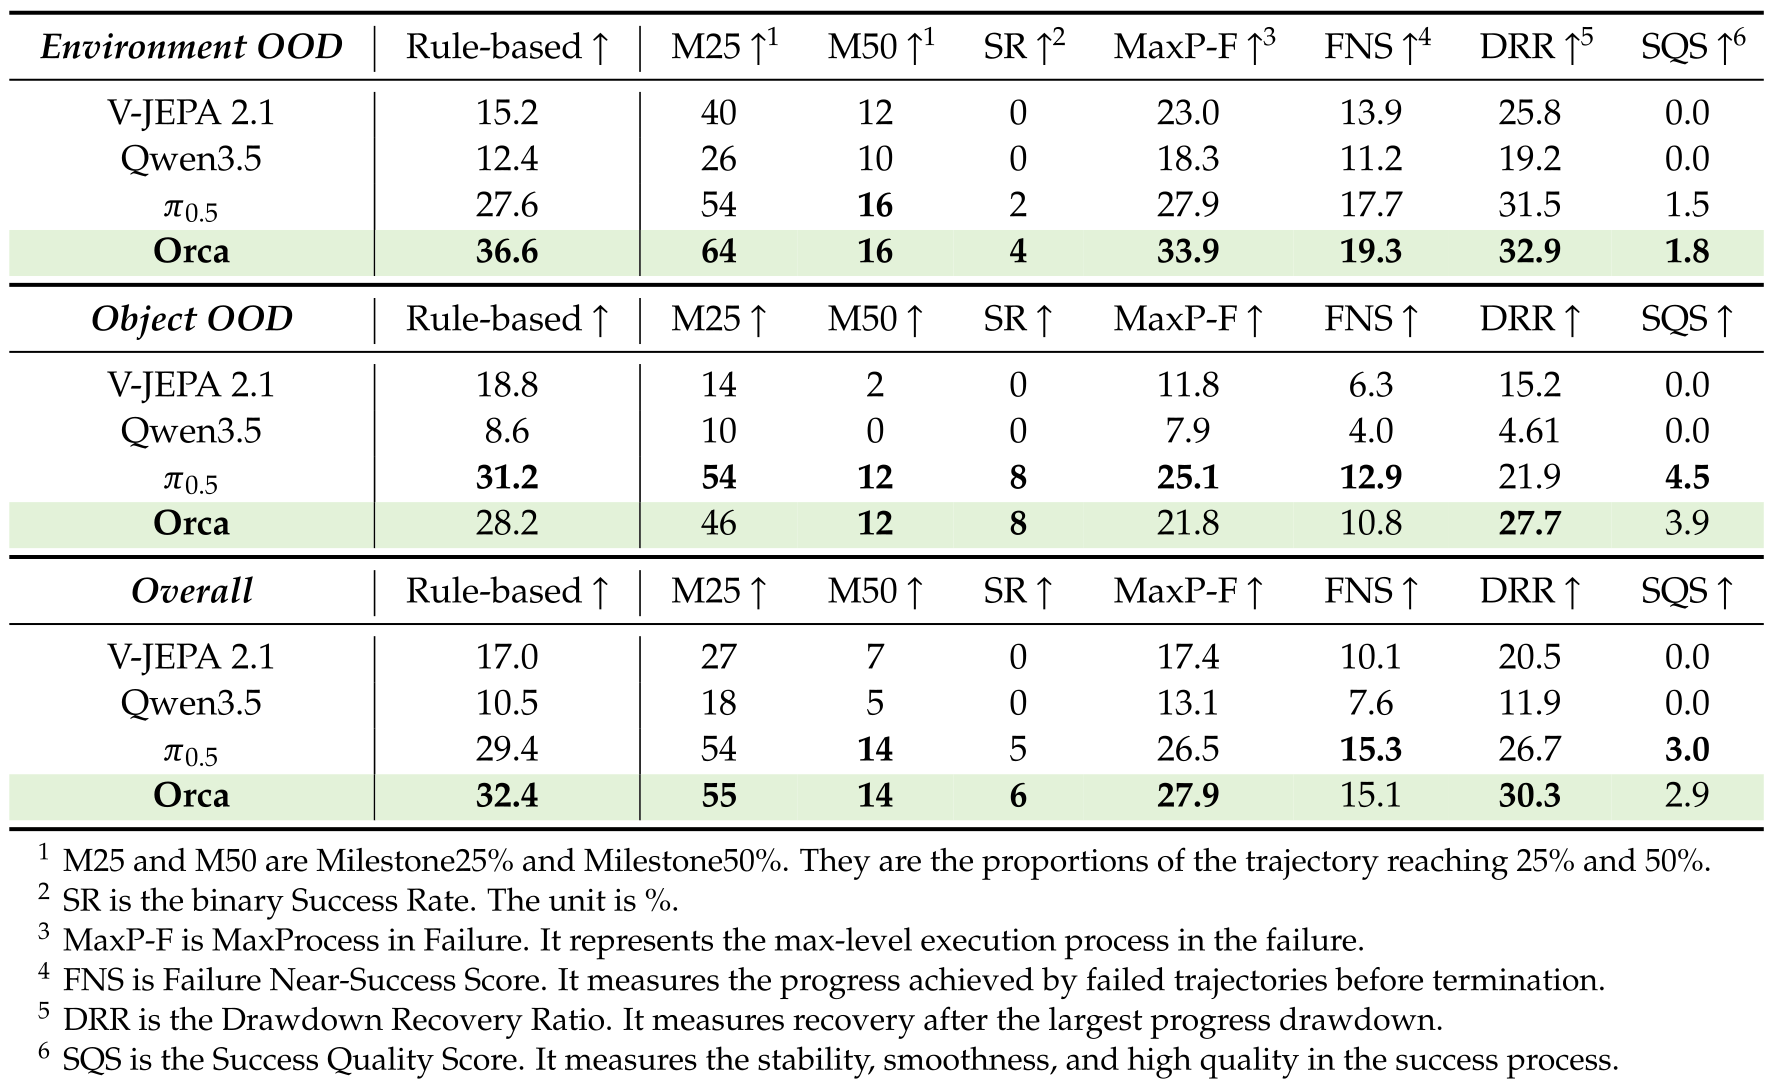
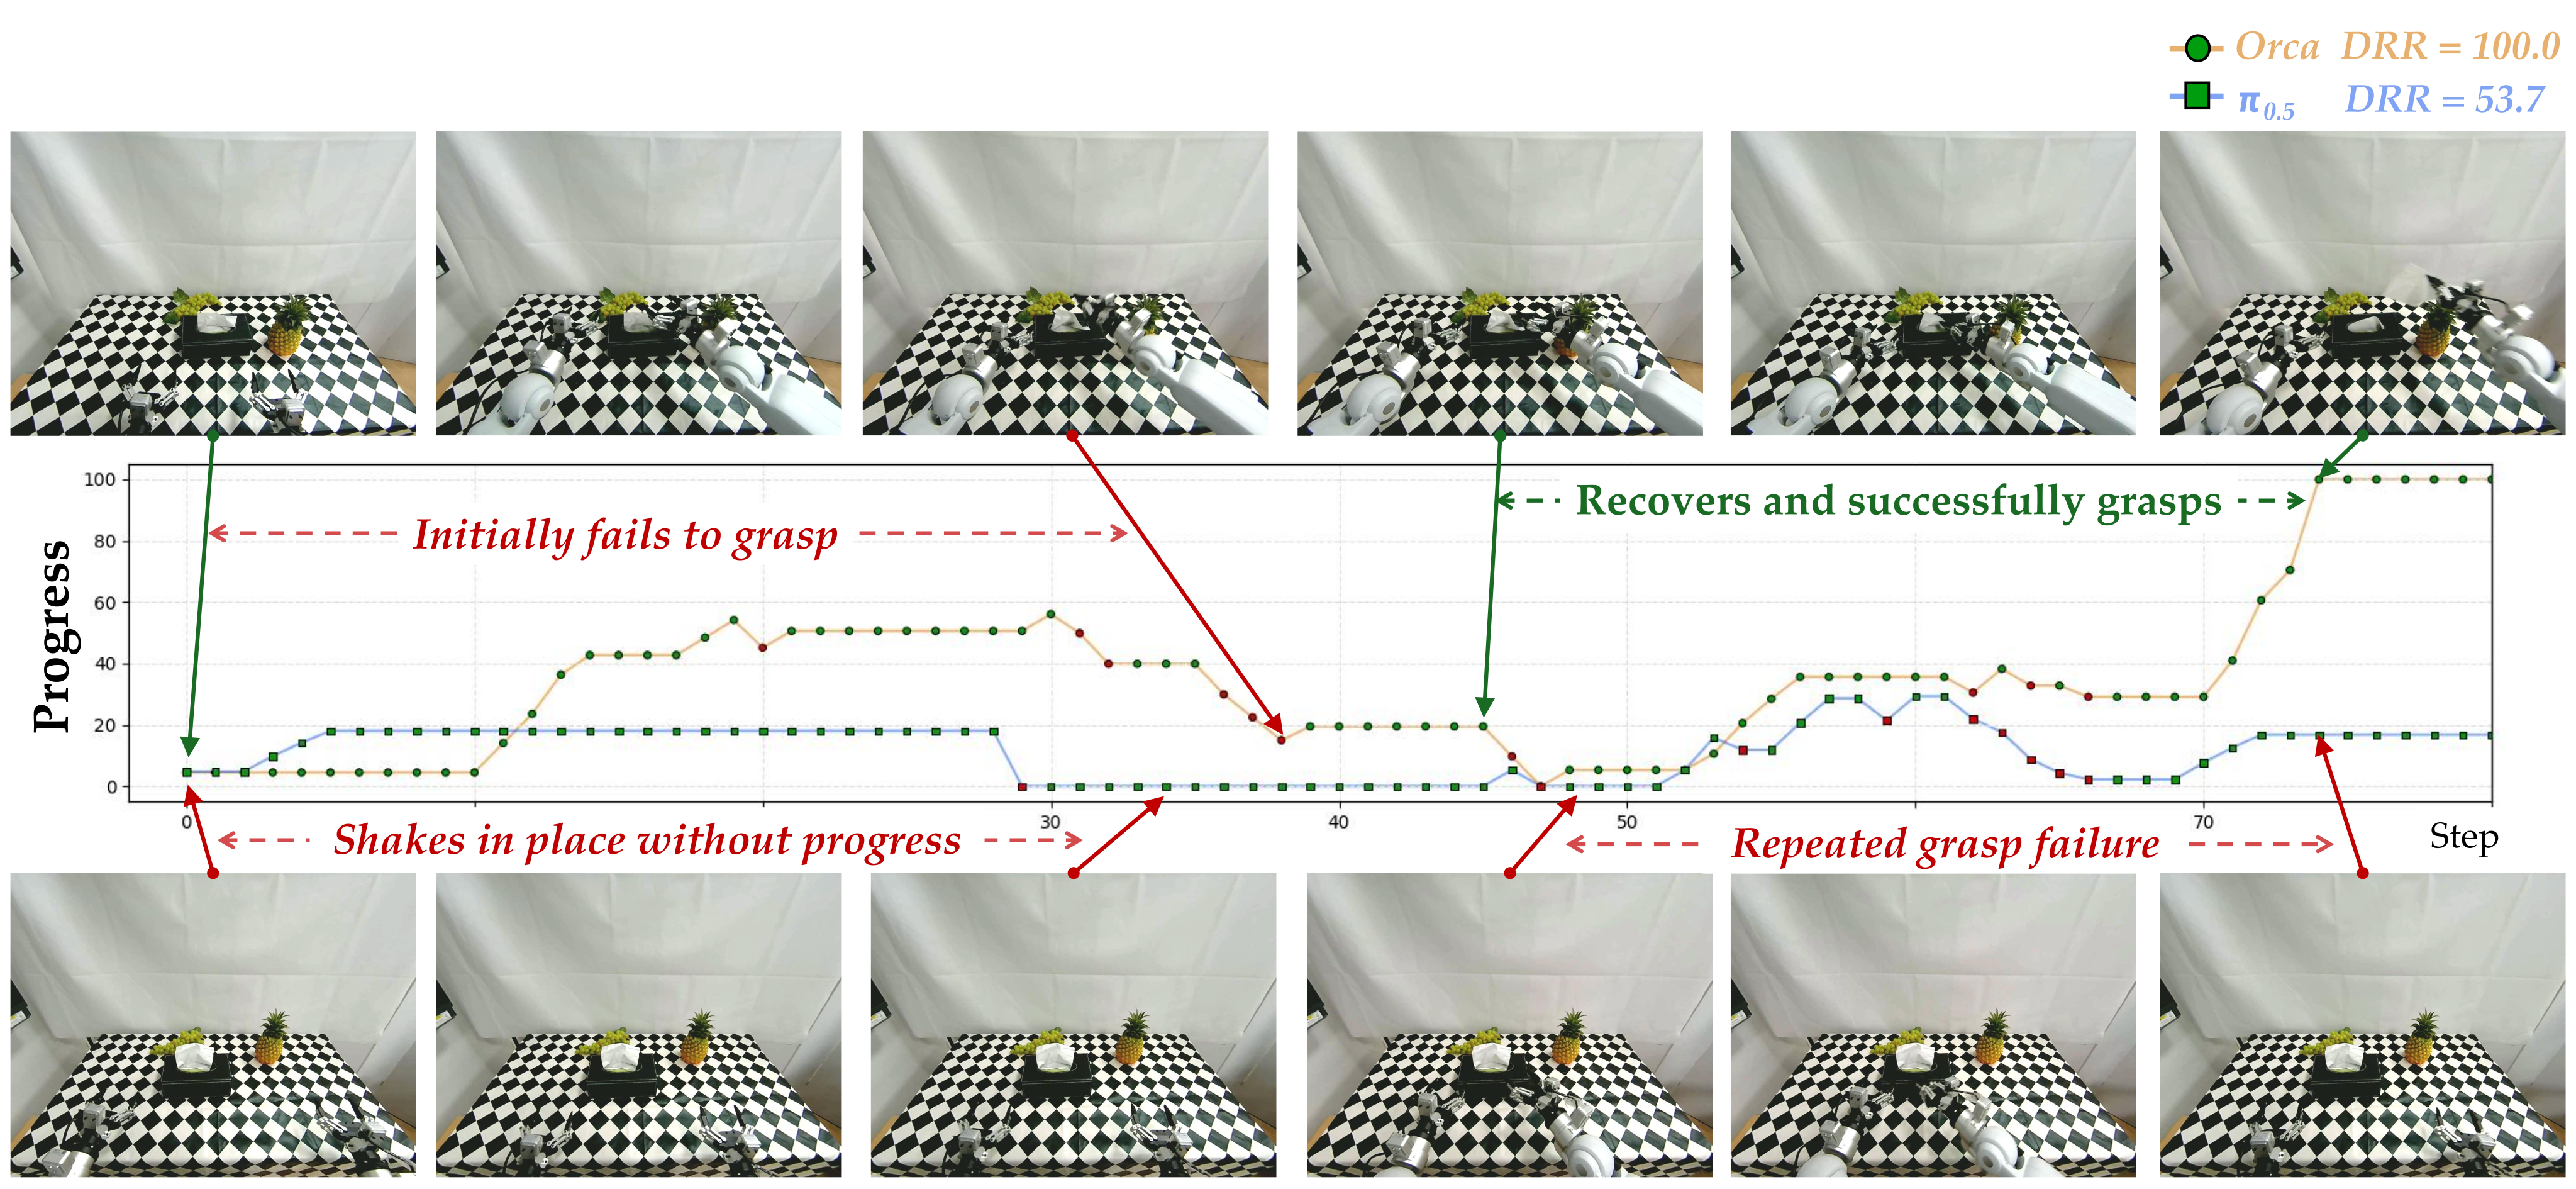
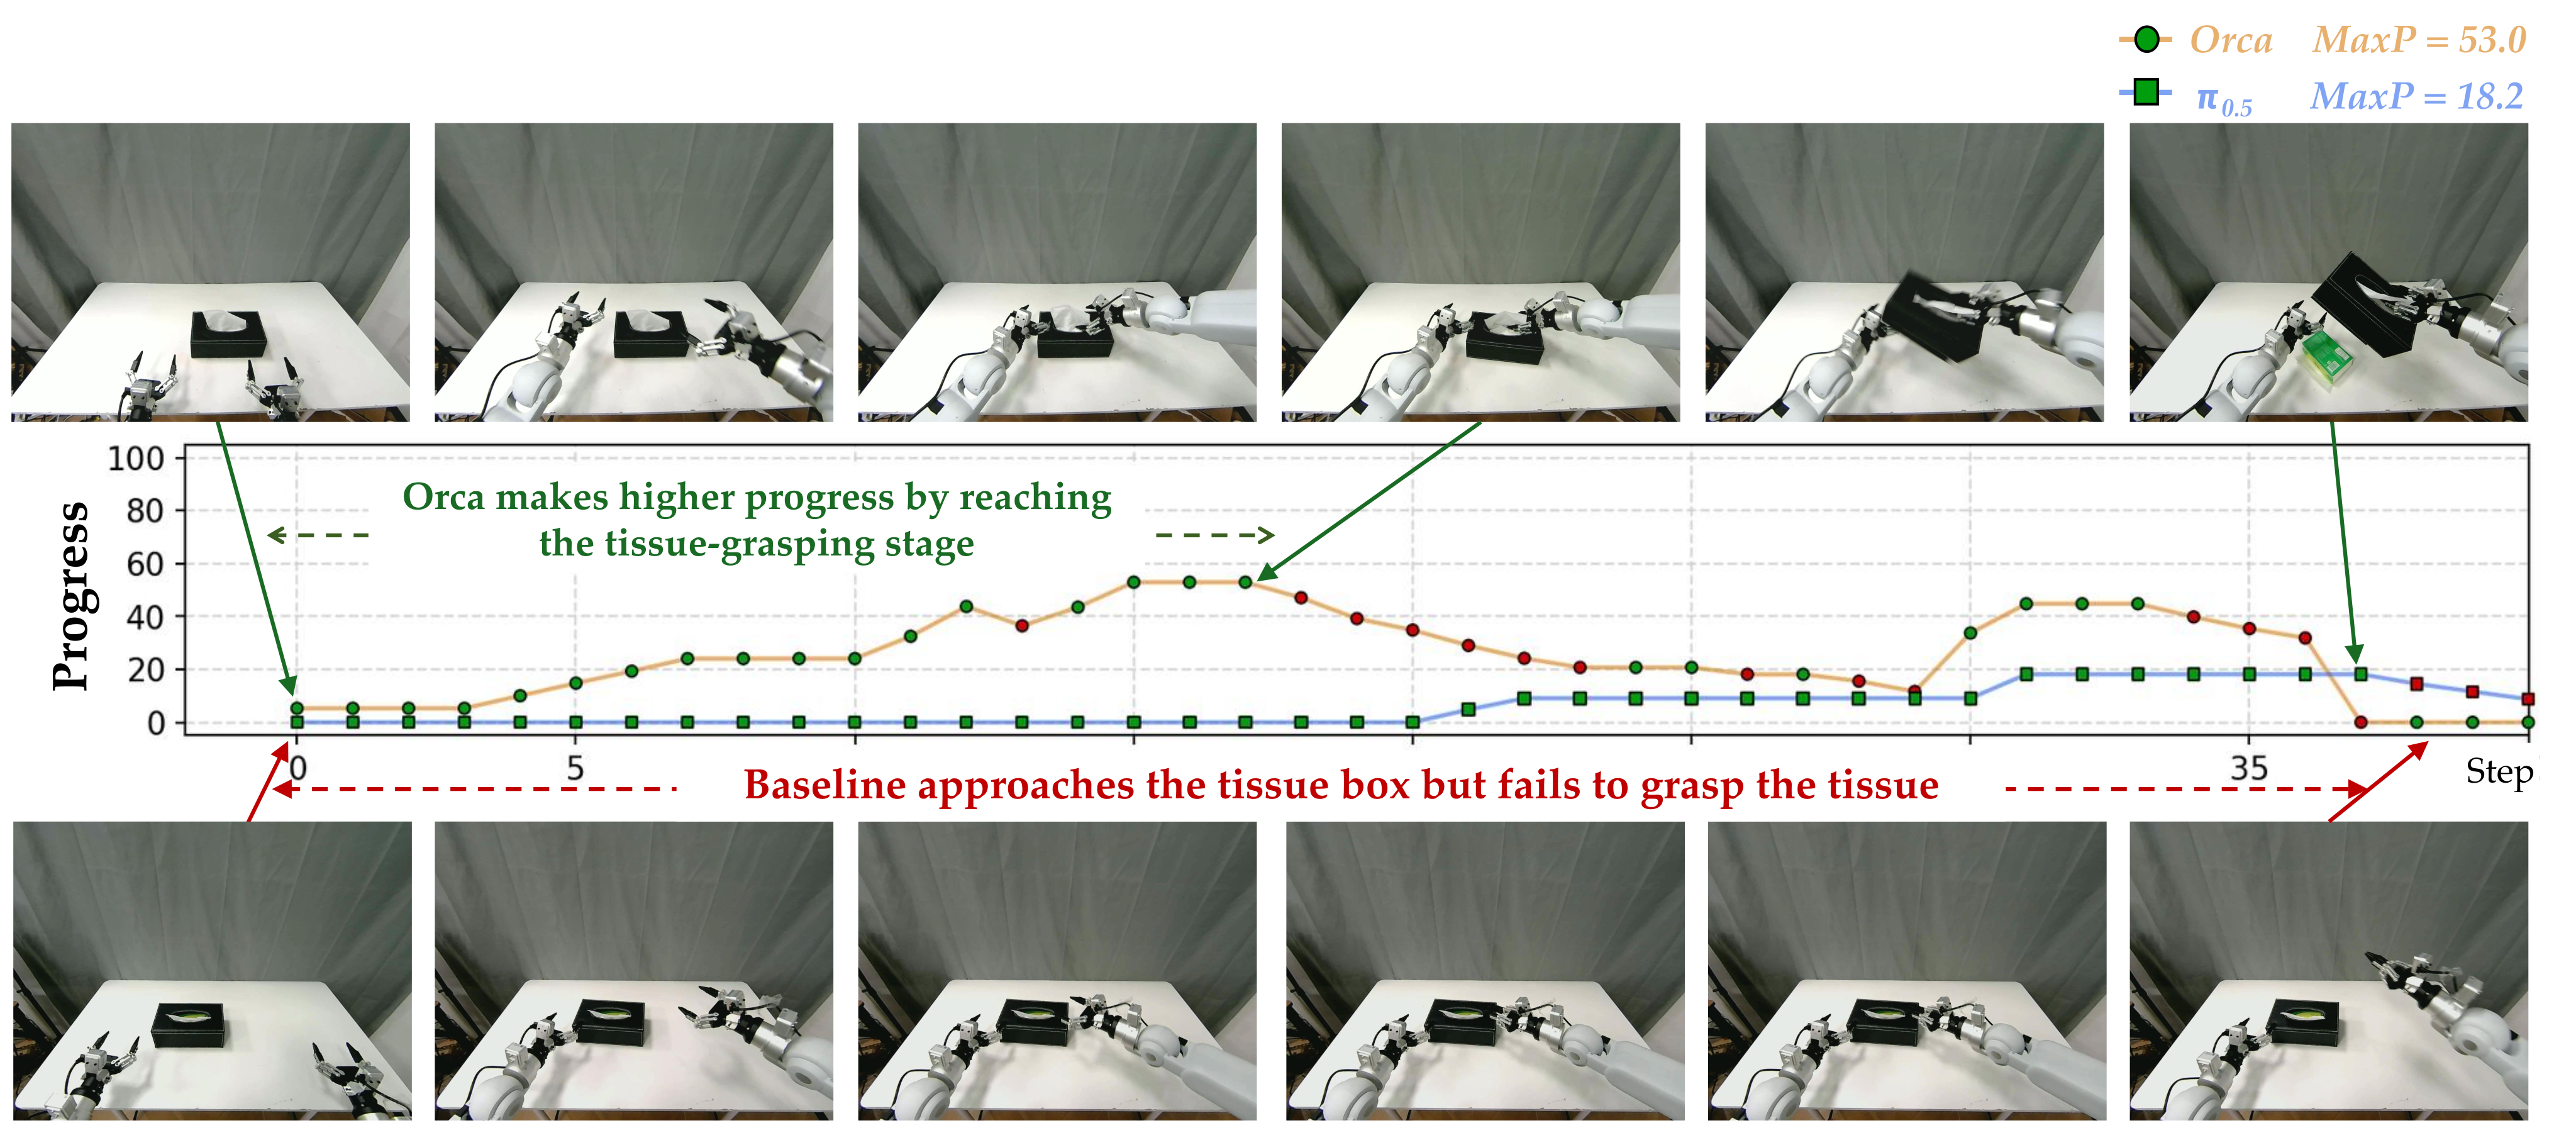
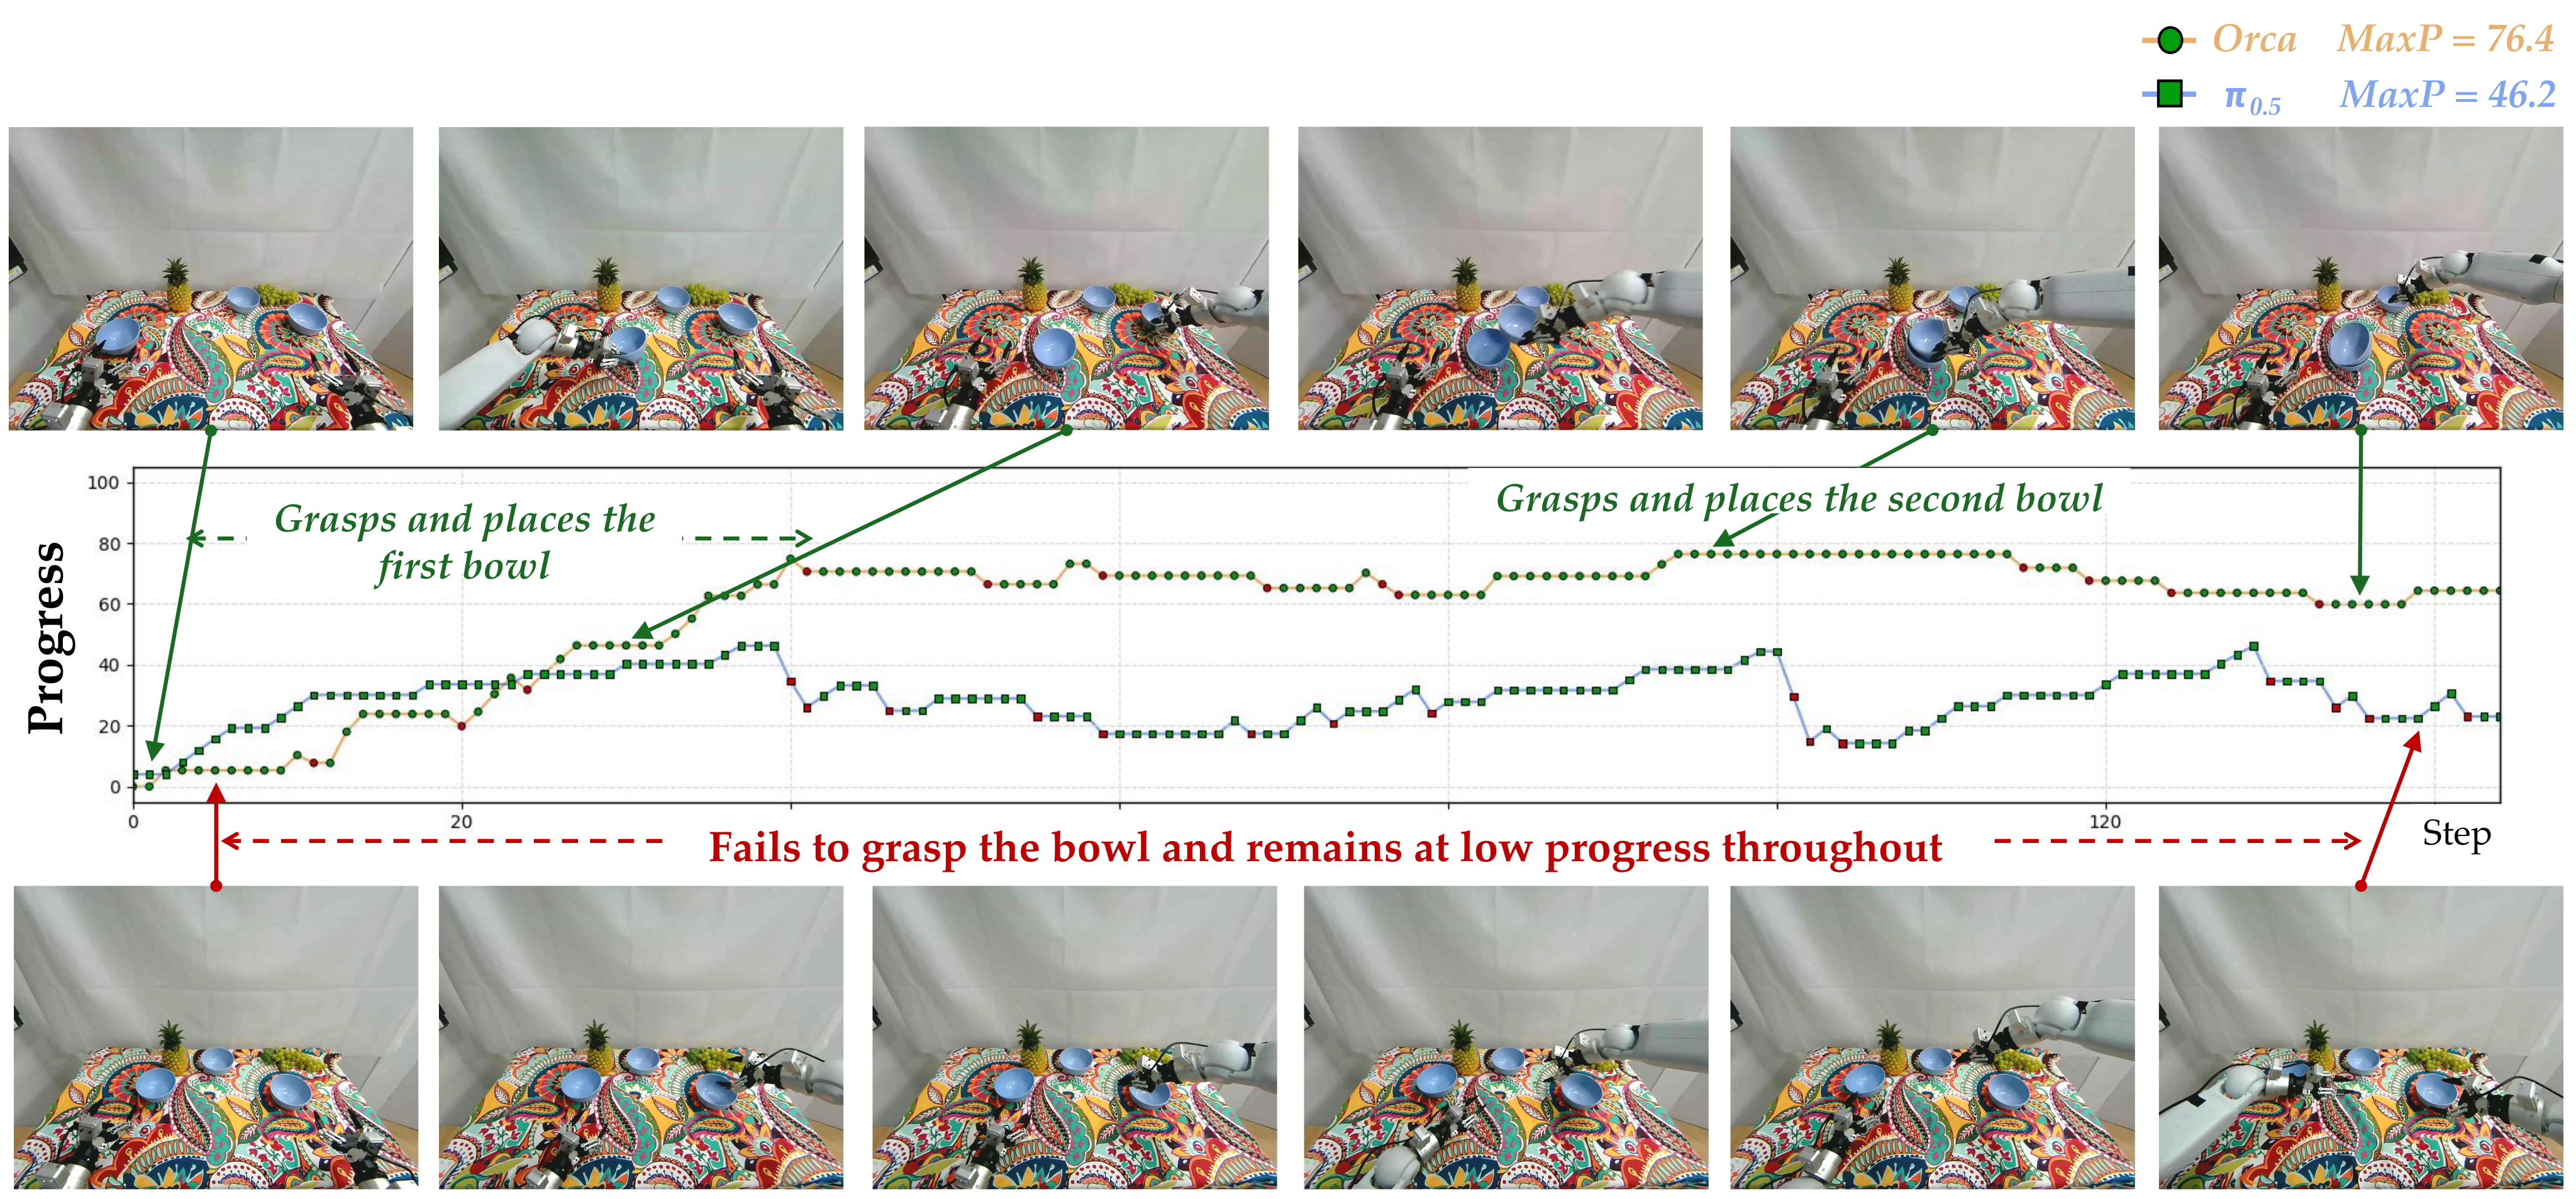
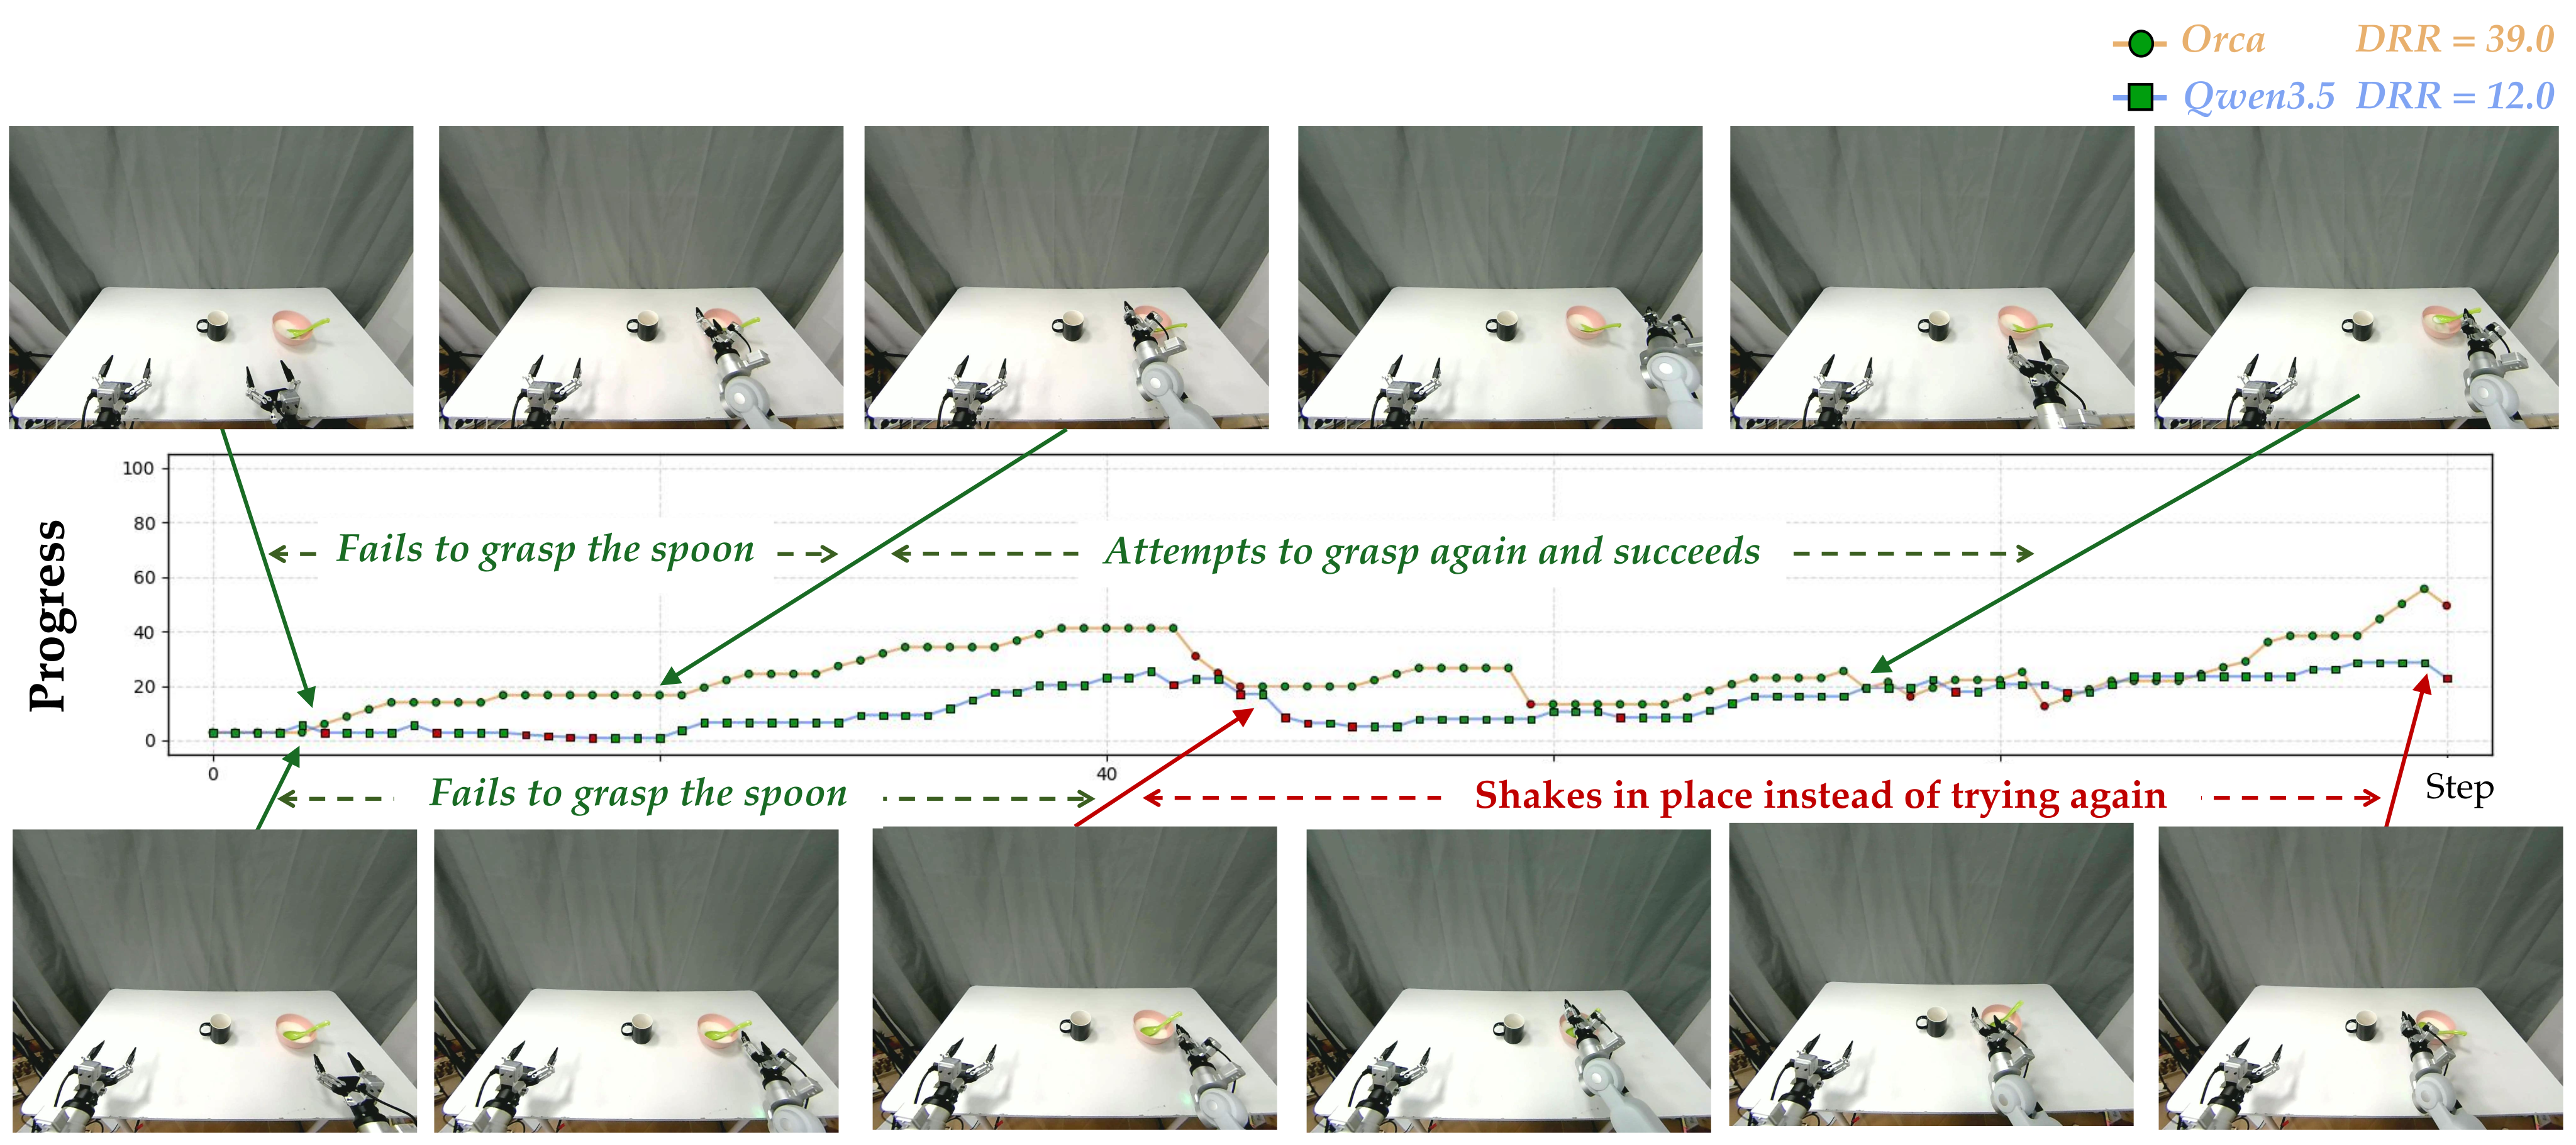
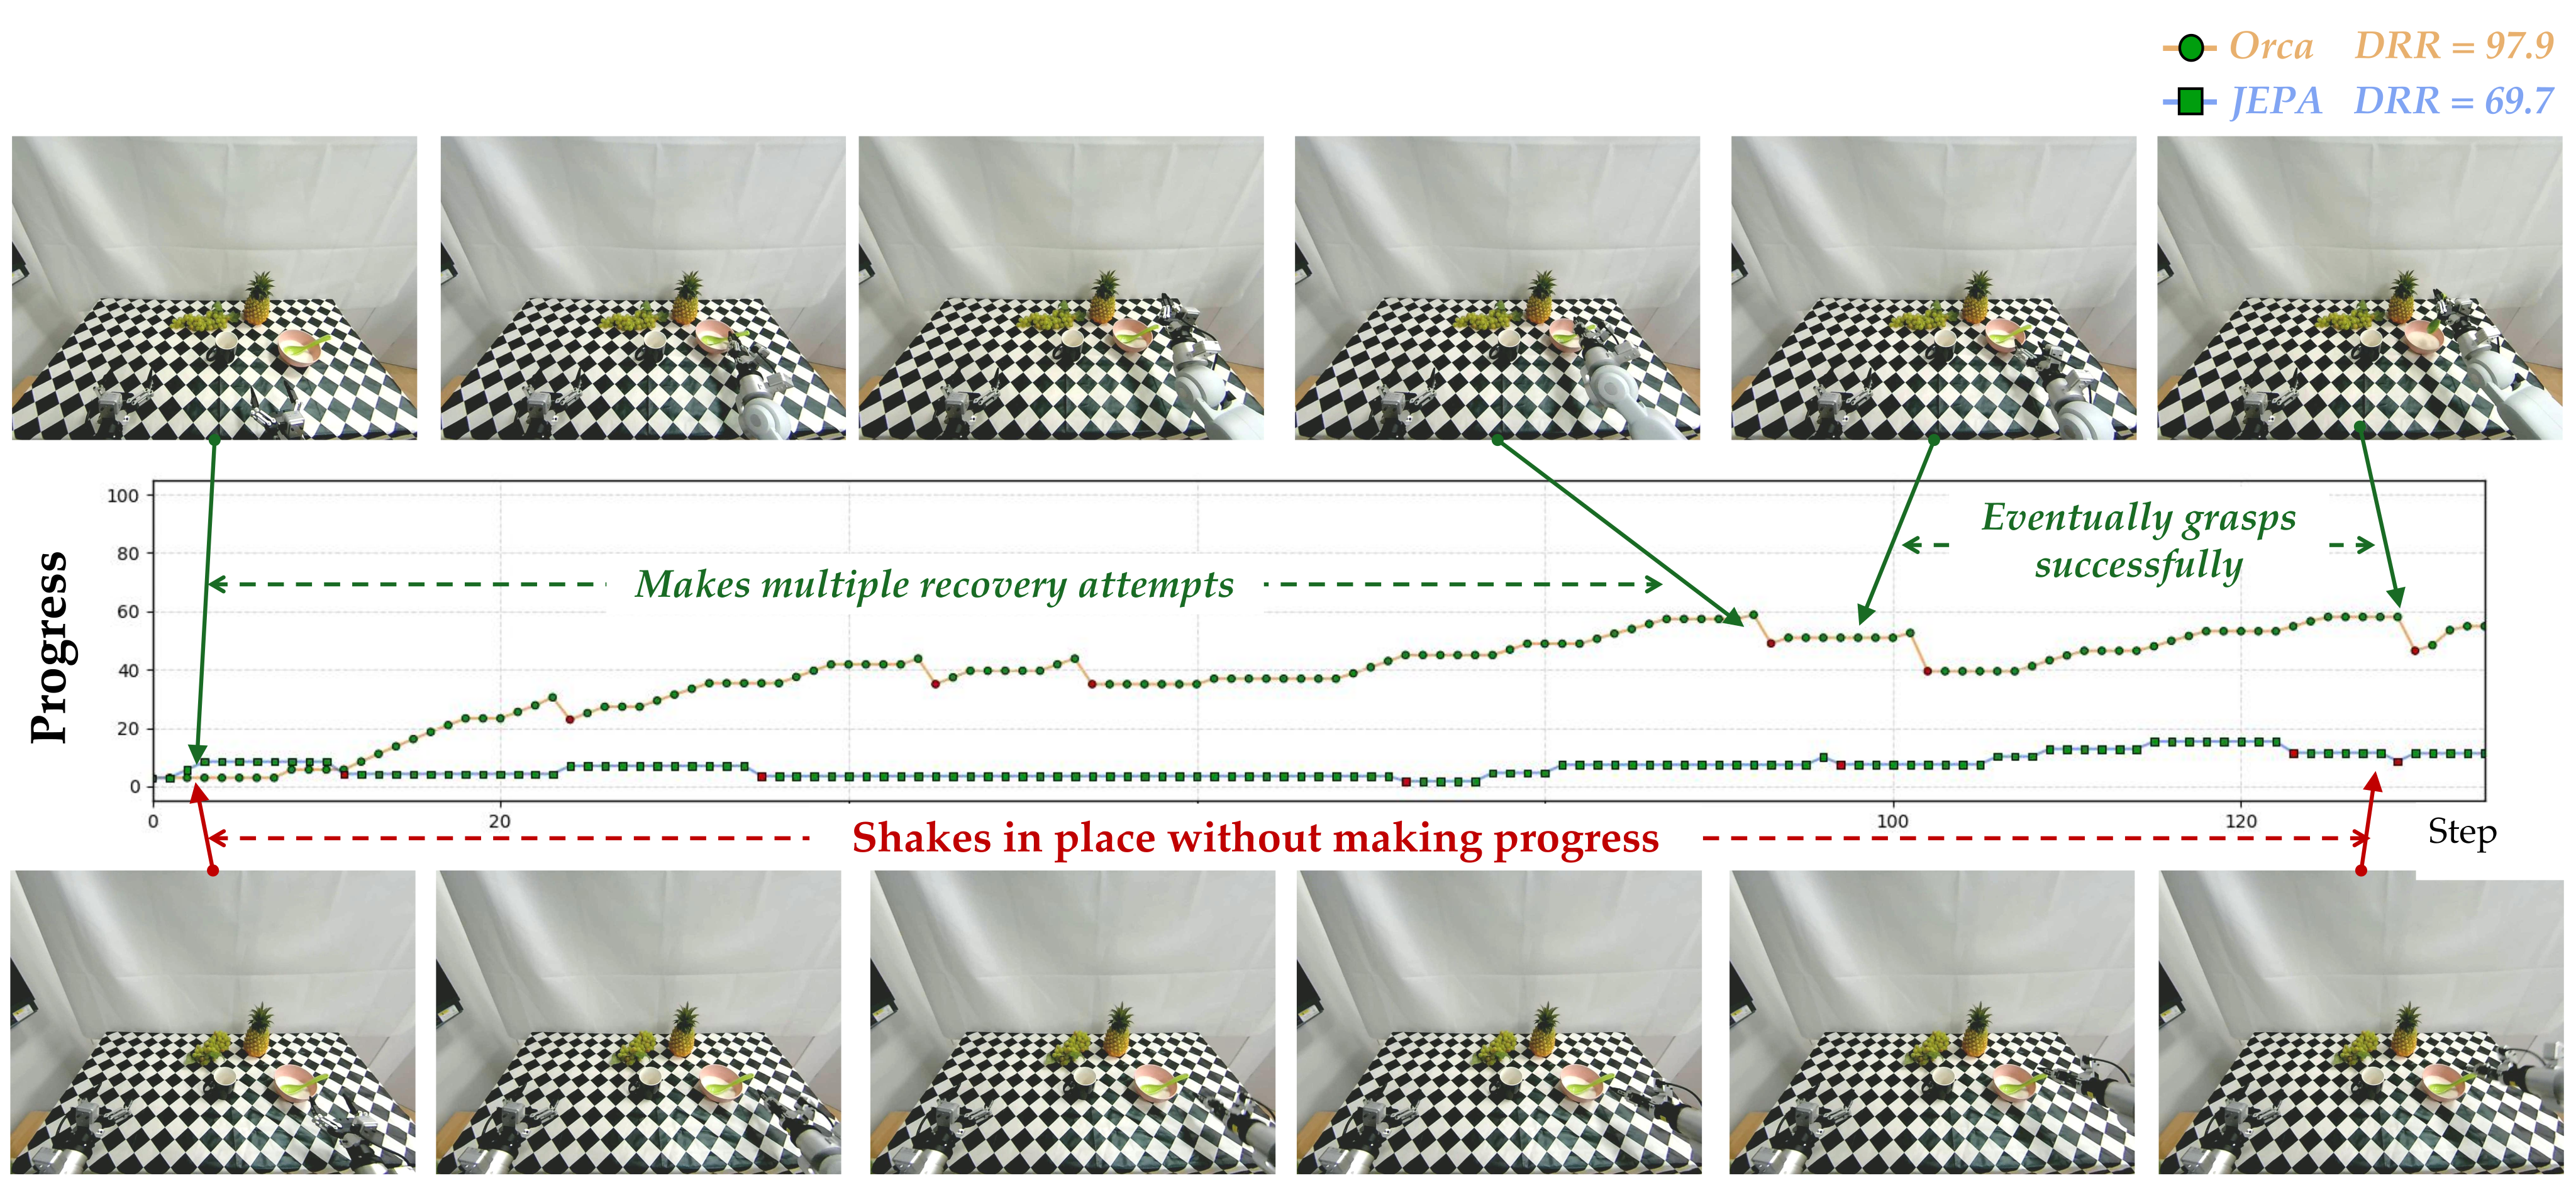
Manual rule-based scores track weighted task stages, taking the highest achieved score within a sixty-second trial. PRM-as-a-Judge adds milestone attainment, binary success, maximum/final progress in failed trajectories, drawdown recovery and successful-trajectory quality. These diagnostics measure different aspects of execution and are not interchangeable success rates.
Baselines.
V-JEPA 2.1 and Qwen3.5 use the same from-scratch Action Expert as Orca, with frozen backbones, two hundred demonstrations/task, twenty thousand updates and batch size 128. This controls the downstream expert protocol for representation comparison.
π₀.₅ instead starts with extensive robot pretraining and uses its official post-training setup: thirty thousand updates, batch size 32, frozen VLM and trainable action expert. The comparison therefore includes different prior action knowledge and optimization budgets. V-JEPA’s native goal-image planner is not evaluated because the task supplies no goal image.
Original selectable table
| Environment OOD | Rule-based | M25 1 | M50 1 | SR 2 | MaxP-F 3 | FNS 4 | DRR 5 | SQS 6 |
| V-JEPA 2.1 | 15.2 | 40 | 12 | 0 | 23.0 | 13.9 | 25.8 | 0.0 |
| Qwen3.5 | 12.4 | 26 | 10 | 0 | 18.3 | 11.2 | 19.2 | 0.0 |
| 27.6 | 54 | 16 | 2 | 27.9 | 17.7 | 31.5 | 1.5 | |
| Orca | 36.6 | 64 | 16 | 4 | 33.9 | 19.3 | 32.9 | 1.8 |
| Object OOD | Rule-based | M25 | M50 | SR | MaxP-F | FNS | DRR | SQS |
| V-JEPA 2.1 | 18.8 | 14 | 2 | 0 | 11.8 | 6.3 | 15.2 | 0.0 |
| Qwen3.5 | 8.6 | 10 | 0 | 0 | 7.9 | 4.0 | 4.61 | 0.0 |
| 31.2 | 54 | 12 | 8 | 25.1 | 12.9 | 21.9 | 4.5 | |
| Orca | 28.2 | 46 | 12 | 8 | 21.8 | 10.8 | 27.7 | 3.9 |
| Overall | Rule-based | M25 | M50 | SR | MaxP-F | FNS | DRR | SQS |
| V-JEPA 2.1 | 17.0 | 27 | 7 | 0 | 17.4 | 10.1 | 20.5 | 0.0 |
| Qwen3.5 | 10.5 | 18 | 5 | 0 | 13.1 | 7.6 | 11.9 | 0.0 |
| 29.4 | 54 | 14 | 5 | 26.5 | 15.3 | 26.7 | 3.0 | |
| Orca | 32.4 | 55 | 14 | 6 | 27.9 | 15.1 | 30.3 | 2.9 |
- 1
- 2
SR is the binary Success Rate. The unit is %.
- 3
MaxP-F is MaxProcess in Failure. It represents the max-level execution process in the failure.
- 4
FNS is Failure Near-Success Score. It measures the progress achieved by failed trajectories before termination.
- 5
DRR is the Drawdown Recovery Ratio. It measures recovery after the largest progress drawdown.
- 6
SQS is the Success Quality Score. It measures the stability, smoothness, and high quality in the success process.
Results and Analysis.
Orca-4B’s mean rule-based score is 32.4 versus π₀.₅’s 29.4, V-JEPA’s 17.0 and Qwen’s 10.5. Its binary success is 6%, compared with 5% for π₀.₅ and zero for the other two. Environment progress favors Orca, 36.6 versus 27.6, but object-OOD progress favors π₀.₅, 31.2 versus 28.2.
Recovery and maximum failed-trajectory progress improve on average, while π₀.₅ slightly leads overall final failed-trajectory progress and success-quality scores. Thus the method is competitive under these protocols rather than better on every metric or setting. The paper does not provide explicit evaluation-trial counts or uncertainty intervals for interpreting these small success differences.
4.3 Ablation
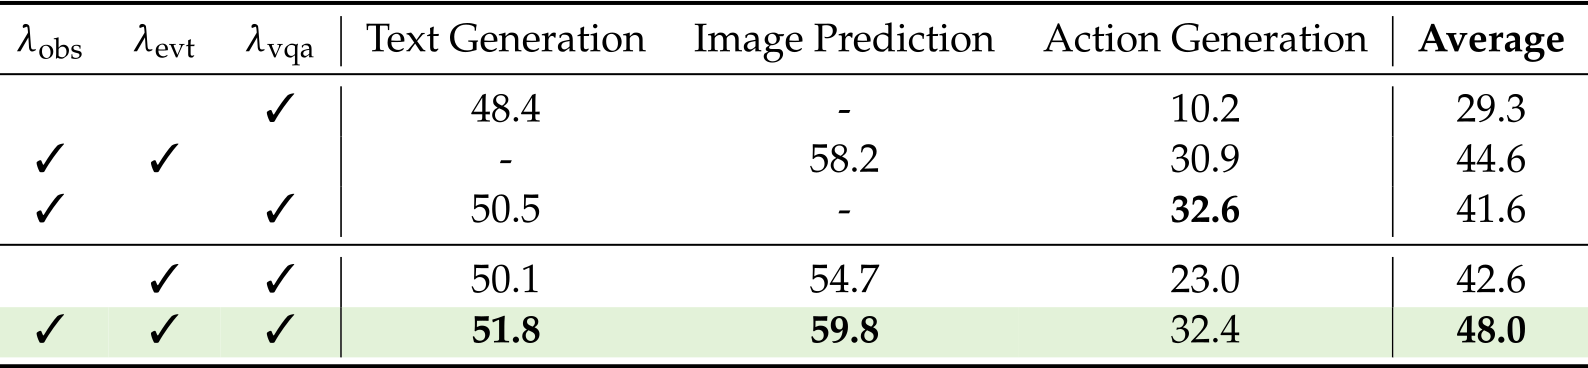
All three objectives provide the best displayed balance across readouts: text 51.8, image 59.8 and action-progress 32.4. Removing observation prediction lowers action progress to 23.0; removing event prediction makes the tested image readout unavailable. VQA is needed for the reported text interface.
The observation-plus-VQA variant slightly exceeds the full system on action progress, 32.6 versus 32.4. Table 5’s first three averages use two available modalities while its last two use three, so those overall averages are not directly like-for-like. Missing entries mean the setting did not work, not measured zero performance.
Original selectable table
| Text Generation | Image Prediction | Action Generation | Average | |||
| ✓ | 48.4 | - | 10.2 | 29.3 | ||
| ✓ | ✓ | - | 58.2 | 30.9 | 44.6 | |
| ✓ | ✓ | 50.5 | - | 32.6 | 41.6 | |
| ✓ | ✓ | 50.1 | 54.7 | 23.0 | 42.6 | |
| ✓ | ✓ | ✓ | 51.8 | 59.8 | 32.4 | 48.0 |
5 Conclusion
The results support predictive visual-language pretraining as a useful shared basis for several readouts. They remain an early representation-transfer study with distinct downstream training and evaluation protocols, rather than a demonstrated general-purpose physical simulator or autonomous learner.
Discussion & Limitation.
Current limits include vision/language-only pretraining, targets tied to a fixed pretrained vision space, small model sizes and tradeoffs among outputs. PRICE has limited scale/diversity, transitions are short-horizon and event-bounded, and robot tasks are relatively short/simple despite low full-success rates.
Three separate training losses only approximate the proposed unified next-state formulation. Readouts cover text, images and actions, leaving other senses and scientific domains untested. More data alone is not shown to solve capacity or representation constraints.
Future Works.
Future directions include aligning richer signals to a common state, training a native representation from scratch, stronger intervention/counterfactual evaluation and closed loops that collect and filter new training experience. Extensions to scientific discovery are research goals, not capabilities evaluated here.
6 Author List
6.1 Core Contributors
Core contributors: Yihao Wang, Yuheng Ji, Mingyu Cao, Yanqing Shen and Runze Xiao. The source marks equal contribution and identifies Yuheng Ji as project lead.
Model Pre-Training.
Huaihai Lyu, Senwei Xie and Mingyu Cao.
Data Infra.
Euan Liu, Klara Tian, Tianfeng Long, Yichi Zhang, Zhengliang Cai, Ruike Chen, Jifan Zhao and Yanqing Shen.
Evaluation.
Ruochuan Shi, Zihan Tang, Jing Lyu and Runze Xiao.
Real Robot.
Jing Lyu, Wenxing Tan, Ningbo Zhang, Yangtao Hu, Euan Liu, Yuming Gao, Xiansheng Chen, Junkai Zhao and Runze Xiao.
Downstream Post-Training.
Senwei Xie, Huaihai Lyu, Congsheng Xu, Boan Zhu and Ziqi Wang.
Infrastructure.
Yupu Feng and Qiongqiong Zhang.
6.2 Contributors
Infrastructure.
Yingli Zhao and Yulong Ao.
Real-Robot Data.
Shaoxuan Xie, You Liu and Guocai Yao.
Product & Operations.
Leiduo Zhang, Xiaodan Liu, Yunyan Zhang and Yance Jiao.
Brand Management.
Xinyan Yang and Jiaxing Wei.
Platform Management.
Xu Liu and Tengfei Pan.
System Management.
Shaokai Nie and Chunlei Men.
6.3 Expert Consultant (Ordered by English last name alphabetically)
Sen Cui, Xiaojie Jin, Hongyang Li, Jianlan Luo, Yao Mu, Yunchao Wei, Jun Yan, Hang Zhao and Xiaolong Zheng are listed as expert consultants.
6.4 Research Leads
Research leads: Jiaming Li, Yonghua Lin, Tiejun Huang, Zhongyuan Wang and Pengwei Wang. Zhongyuan Wang and Pengwei Wang are corresponding authors.
References
Appendix
Appendix A Orca Conception
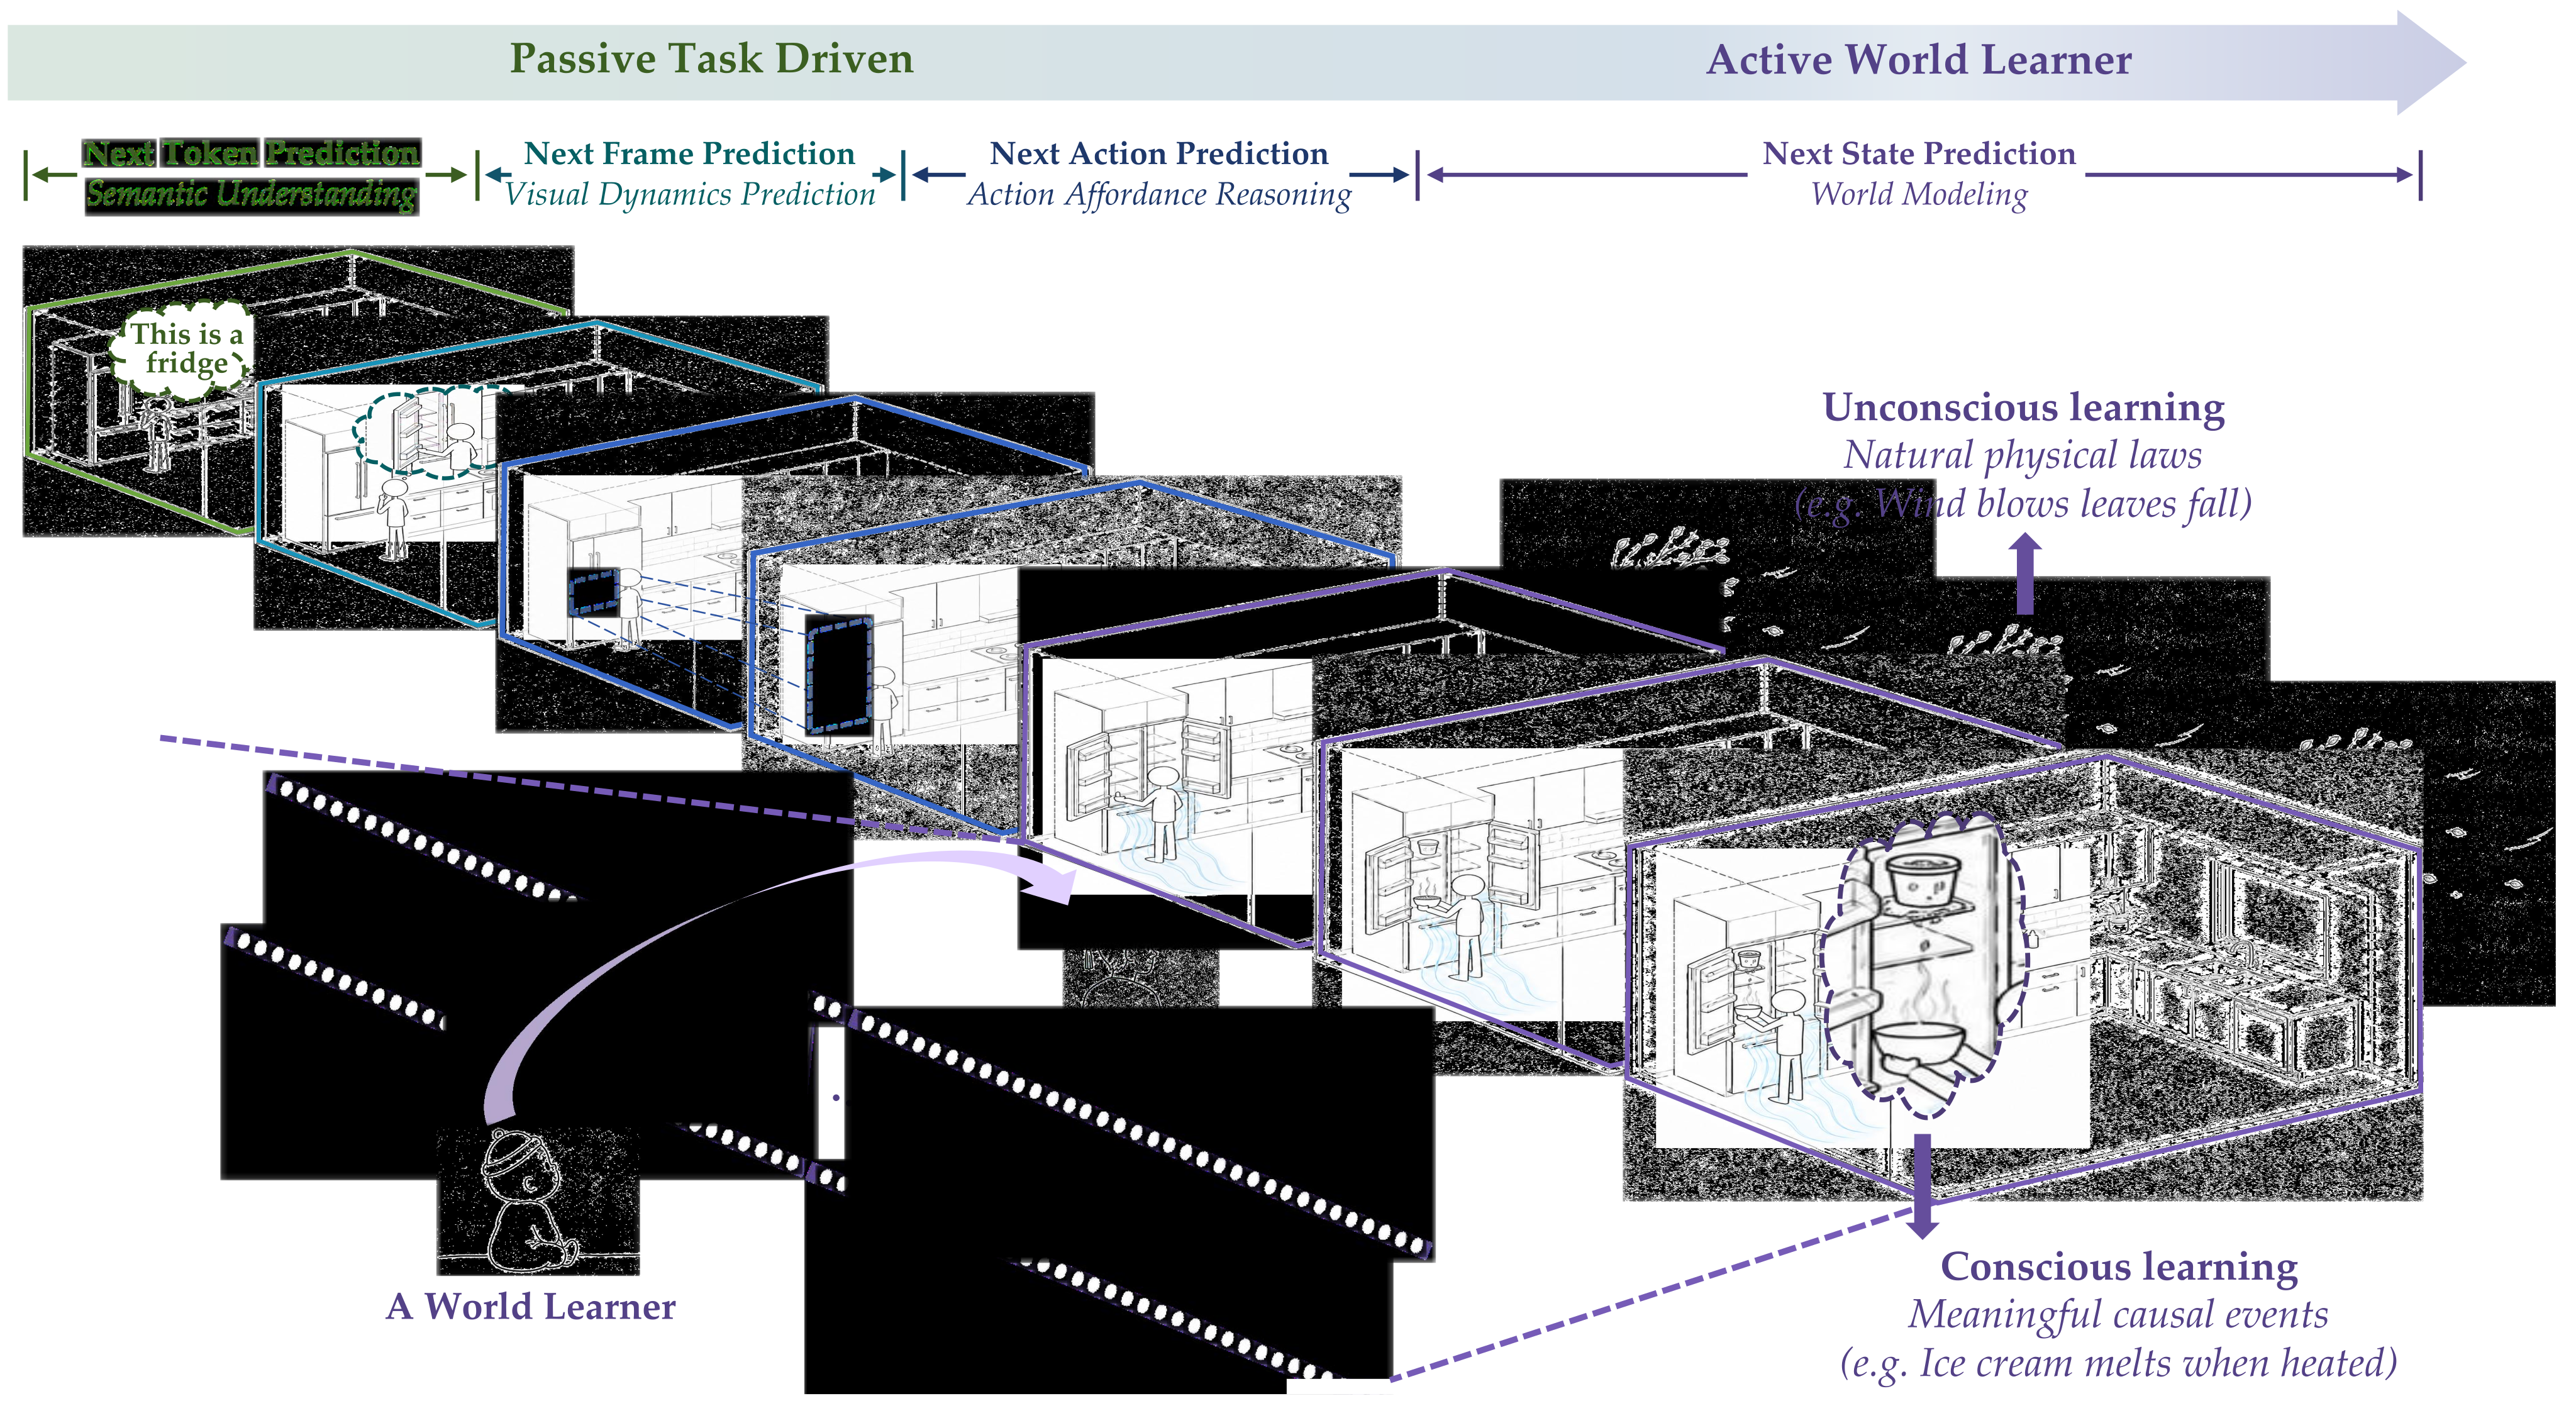
The conceptual figure places latent next-state modeling between observation and multiple output interfaces. Natural video transitions and language-described events provide complementary supervision. This motivates the system’s design; its broad “active world learner” framing extends beyond the fixed-data training/readout experiments actually reported.
Appendix B Related Work
The related-work taxonomy groups methods by their dominant objective while acknowledging overlapping capabilities. It positions Orca’s combination of latent prediction and language conditioning, without implying that other objectives cannot learn dynamics or support several modalities.
B.1 Self-Supervised Learning
Latent World Models.
JEPA-style methods predict representations rather than high-entropy pixels. Image, video and language extensions include I-JEPA, MC-JEPA, VL-JEPA and the V-JEPA series; later work studies training stability, object-centric interventions and latent planning.
How Orca differs.
Orca combines nearby visual prediction with language-conditioned previous/next-event prediction. Its target embeddings still come from a frozen visual encoder; its broader state-modeling interpretation should be distinguished from identification of physical state or causal dynamics.
B.2 Next Token Prediction
Large Language Models.
Autoregressive language-model families provide strong semantic, reasoning and agent interfaces. The paper contrasts their token-level training target with its additional latent-transition supervision, rather than testing all cited language systems.
Multimodal Large Language Models.
Vision-language and unified multimodal models already combine understanding, reasoning and generation. The discussion includes instruction-tuned VLMs, robot-oriented reasoning systems and models such as Emu, BAGEL and Cosmos that span several outputs. These overlapping capabilities make the objective-based taxonomy approximate.
How Orca differs.
Language serves both as a transition condition and as a generated VQA answer in Orca. Next-token training is therefore retained as one component rather than eliminated by the state-prediction formulation.
B.3 Next Frame Prediction
Image Generation Models.
Image generation/editing systems map conditions into visual observations with strong synthesis priors. Orca’s own image readout also depends on such a pretrained decoder, while using its learned state representation for conditioning.
Video Generation Models.
Video models add temporal coherence, controllability and multimodal context to generation. Orca instead supervises visual embeddings during pretraining and separately learns an image readout; it does not demonstrate a general long-horizon video simulator.
How Orca differs.
The intended emphasis is instruction-consistent, physically plausible interaction outcomes. PRICE operationalizes this through visual judges, which remain an imperfect proxy for executable physical transitions.
B.4 Next Action Prediction
Vision Language Action Models.
VLA work such as OpenVLA and the π series learns robot actions from visual/language context; later methods use action-oriented post-training and world-model feedback. Orca delays action supervision until its downstream expert stage.
Video Action Models.
Video-action methods transfer predictive visual information into control, sometimes with inverse-dynamics or coupled action/video heads. This motivates using temporal information beyond a static VLM for the robot readout.
World Action Models.
World-action models jointly or latently model actions and future observations. Orca differs in evaluating a representation pretrained without action labels, then freezing it for separately trained readouts; this does not remove the need for downstream demonstrations.
How Orca differs.
The practical claim is improved adaptation from a predictive representation under limited robot demonstrations and selected OOD changes. “World learning first” describes this training order, not an absence of pretrained visual-language knowledge or later action learning.
Appendix C Training Settings
The training appendix preserves all objective equations and hyperparameter tables for both model scales and the vision/action readouts.
C.1 Pre-Training Settings
C.1.1 Pre-Training Objective Definitions
Latent matching is 0.1 times squared L2 error plus 0.9 times cosine distance. Observation loss predicts the next frame; event loss averages matches to previous- and next-event targets. VQA uses next-token cross-entropy. The combined coefficients are 0.1/0.5/0.4 with approximately five transition samples per VQA sample.
These objectives fit embeddings of observed frames. They do not explicitly enforce conservation laws or guarantee a unique future under uncertainty, even though the conceptual notation describes a transition distribution.
Equations C-1–C-3
| (C-1) |
| (C-2) |
| (C-3) |
C.1.2 Query-Based Implementation
Freshly initialized query vectors are inserted after visual tokens and after the event instruction. Their last-layer hidden states feed the two-layer visual prediction head. Query 2’s supervision follows the specified earlier/later event; the frozen vision encoder supplies both directions’ targets.
C.1.3 Pre-Training Hyperparameters
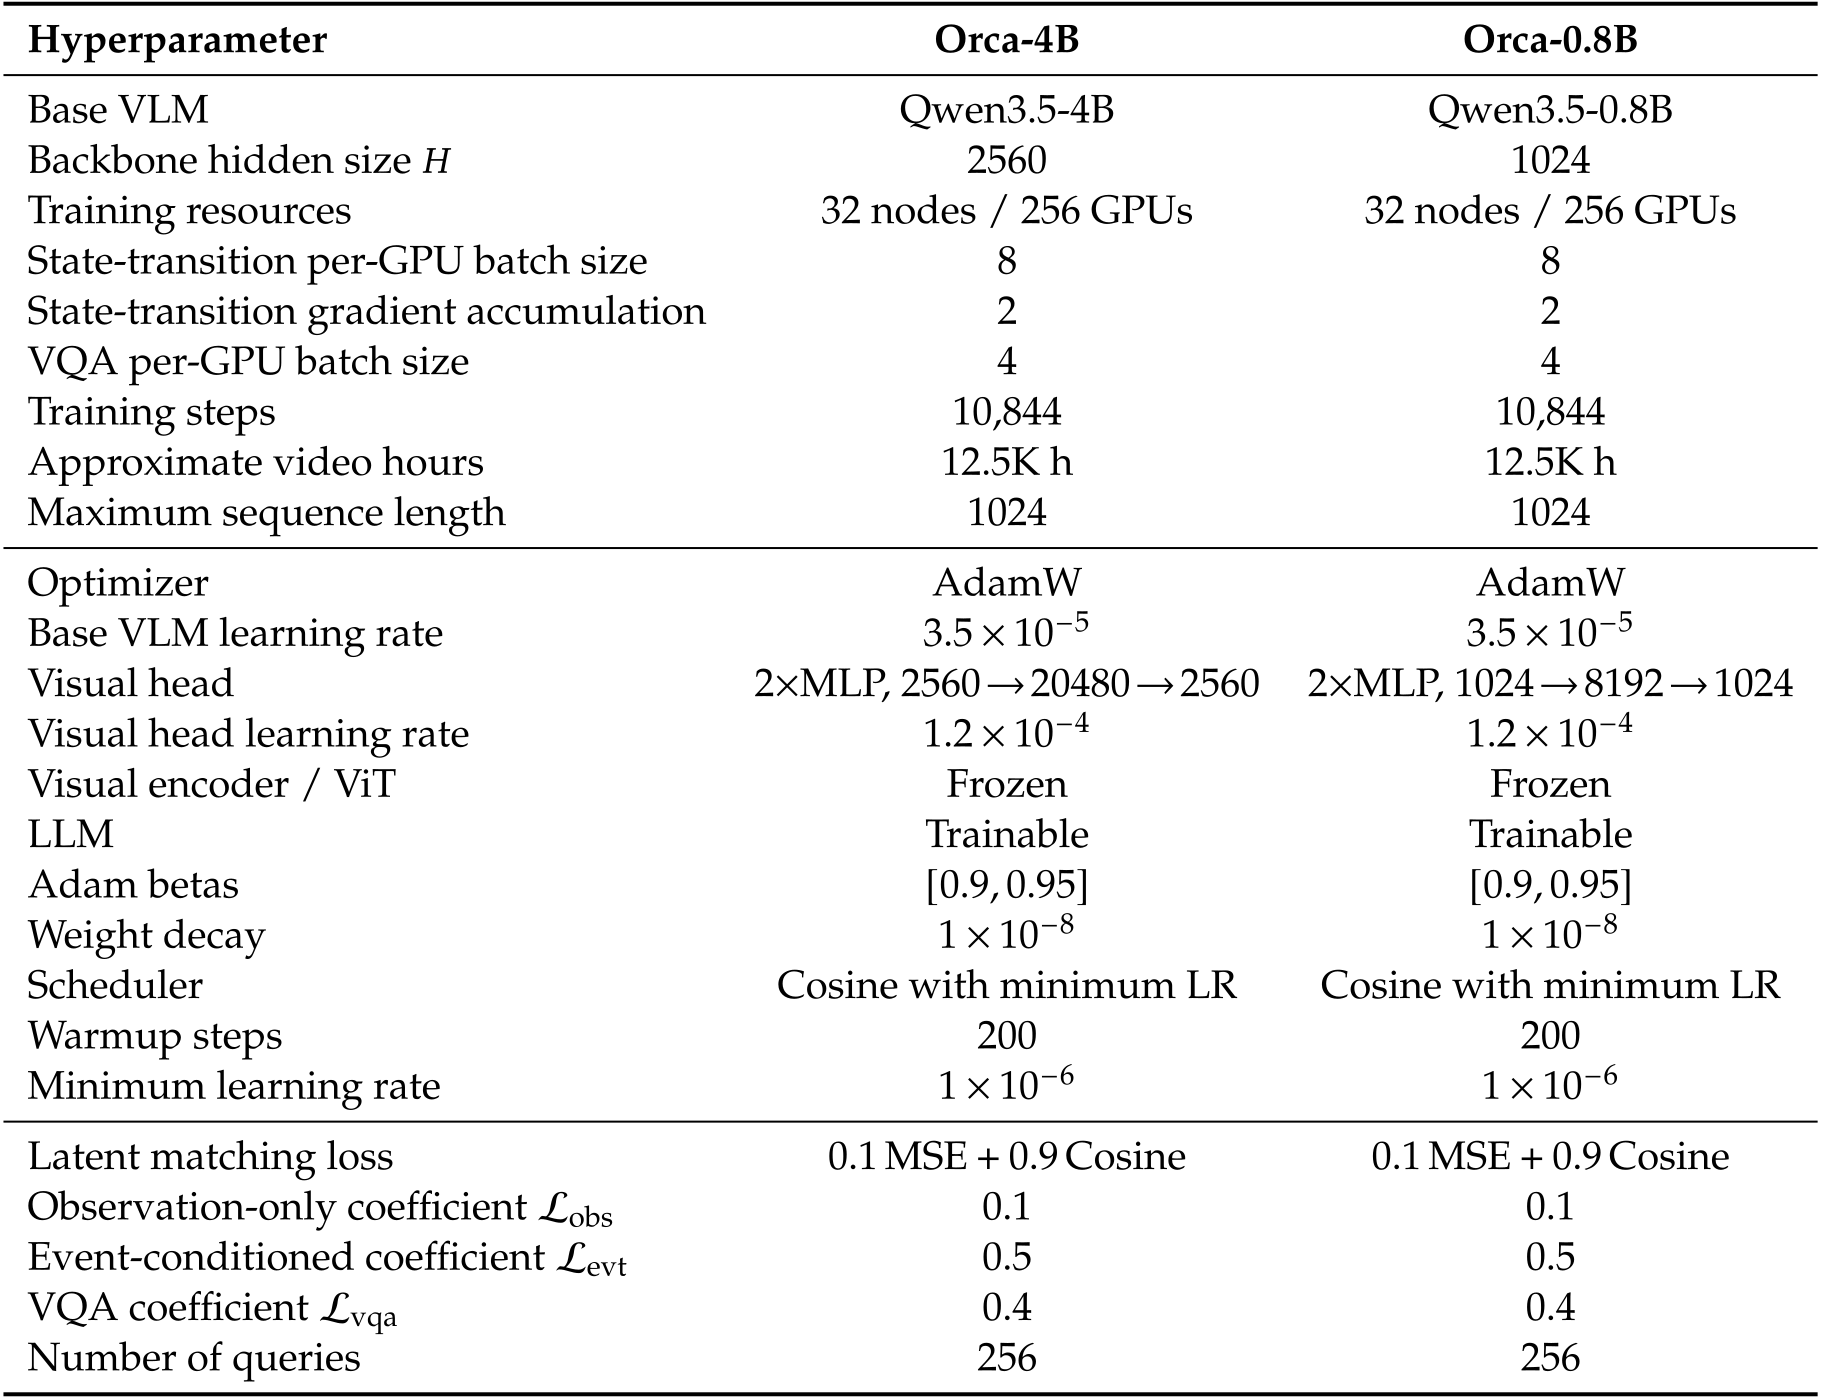
Qwen3.5 initializes 0.8B/4B backbones with hidden widths 1,024/2,560. Table C1 specifies 256 queries, maximum sequence length 1,024, 10,844 updates, approximately 12.5K video hours and 256 GPUs. The vision encoder is frozen while the LLM is trainable.
AdamW uses backbone/head learning rates 3.5×10⁻⁵ and 1.2×10⁻⁴, betas 0.9/0.95, weight decay 10⁻⁸, two hundred warmup steps and cosine decay to 10⁻⁶. The complete table retains distinct transition/VQA batch and accumulation settings.
Original selectable table
PDF transcription note: the visual-head widths are 2560 → 20480 → 2560 for Orca-4B and 1024 → 8192 → 1024 for Orca-0.8B. The original HTML below omits the first two values in each sequence; the native table above preserves them.
| Hyperparameter | Orca-4B | Orca-0.8B |
| Base VLM | Qwen3.5-4B | Qwen3.5-0.8B |
| Backbone hidden size | 2560 | 1024 |
| Training resources | 32 nodes / 256 GPUs | 32 nodes / 256 GPUs |
| State-transition per-GPU batch size | 8 | 8 |
| State-transition gradient accumulation | 2 | 2 |
| VQA per-GPU batch size | 4 | 4 |
| Training steps | 10,844 | 10,844 |
| Approximate video hours | 12.5K h | 12.5K h |
| Maximum sequence length | 1024 | 1024 |
| Optimizer | AdamW | AdamW |
| Base VLM learning rate | ||
| Visual head | 2MLP, | 2MLP, |
| Visual head learning rate | ||
| Visual encoder / ViT | Frozen | Frozen |
| LLM | Trainable | Trainable |
| Adam betas | ||
| Weight decay | ||
| Scheduler | Cosine with minimum LR | Cosine with minimum LR |
| Warmup steps | 200 | 200 |
| Minimum learning rate | ||
| Latent matching loss | ||
| Observation-only coefficient | 0.1 | 0.1 |
| Event-conditioned coefficient | 0.5 | 0.5 |
| VQA coefficient | 0.4 | 0.4 |
| Number of queries | 256 | 256 |
C.2 Downstream Readout Post-Training Settings
Readout training leaves Orca frozen. The original LM head serves language; an adapted pretrained diffusion decoder serves images; a new flow-matching expert serves actions. These are nonlinear learned interfaces rather than equally sized linear probes.
C.2.1 Language Readout
Language reuses the pretrained-and-VQA-trained autoregressive LM head, with no extra trainable readout module. Its results reflect the full pretraining mixture, including explicit answer supervision.
C.2.2 Vision Readout
The SD3.5 VAE/base MMDiT weights remain fixed while the adaptor and LoRA learn to turn Orca’s latent into token-level and pooled conditioning. The decoder’s prior visual knowledge contributes to the resulting image.
Settings.
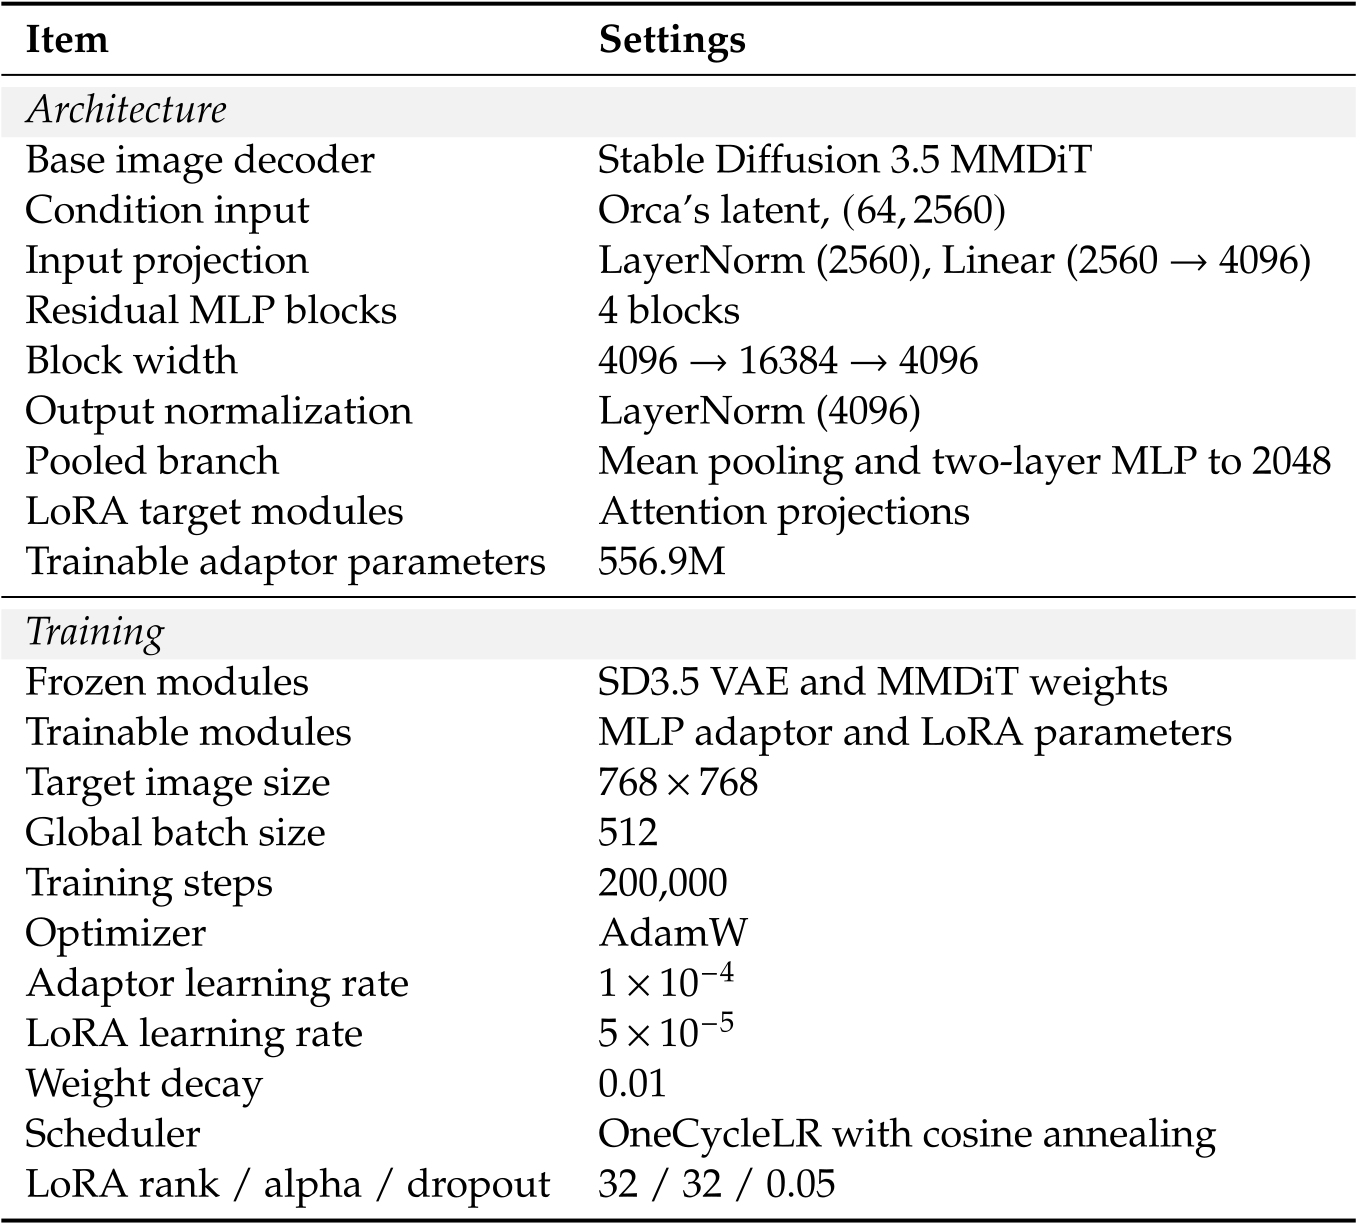
For the reported 4B readout, Table C2 lists a 64×2,560 latent input, projection to 4,096 dimensions, four residual MLP blocks and a pooled branch. Its adaptor alone has 556.9M trainable parameters, so “lightweight” is relative to the full generative system.
Training uses 768×768 targets, batch size 512 and 200,000 steps. Adaptor/LoRA learning rates are 10⁻⁴/5×10⁻⁵, with LoRA rank/alpha 32/32 and dropout 0.05. The source does not explain the token-selection relationship between this 64-token input and the pretraining table’s 256 queries.
Original selectable table
| Item | Settings |
| Architecture | |
| Base image decoder | Stable Diffusion 3.5 MMDiT |
| Condition input | Orca’s latent, |
| Input projection | LayerNorm (2560), Linear (2560 4096) |
| Residual MLP blocks | 4 blocks |
| Block width | 4096 16384 4096 |
| Output normalization | LayerNorm (4096) |
| Pooled branch | Mean pooling and two-layer MLP to 2048 |
| LoRA target modules | Attention projections |
| Trainable adaptor parameters | 556.9M |
| Training | |
| Frozen modules | SD3.5 VAE and MMDiT weights |
| Trainable modules | MLP adaptor and LoRA parameters |
| Target image size | |
| Global batch size | 512 |
| Training steps | 200,000 |
| Optimizer | AdamW |
| Adaptor learning rate | |
| LoRA learning rate | |
| Weight decay | 0.01 |
| Scheduler | OneCycleLR with cosine annealing |
| LoRA rank / alpha / dropout | 32 / 32 / 0.05 |
C.2.3 Action Readout
The action expert conditions on Query 1’s predictive representation, the noisy action and its time, and a sixteen-dimensional robot state. Flow matching learns the denoising velocity from demonstrated action chunks rather than using the visual predictor as an explicit online planning simulator.
Settings.
Eight DiT blocks interleave self- and cross-attention; the listed input width is 768, hidden size 1,024 and head count twelve. Action/state dimensions are sixteen, chunk horizon thirty, repeated samples eight and inference denoising steps four.
Each task trains for twenty thousand updates at batch size 128 with AdamW, learning rate 10⁻⁴, clipping at one, five hundred warmup steps and cosine decay to 10⁻⁶. These settings do not specify a measured end-to-end control latency.
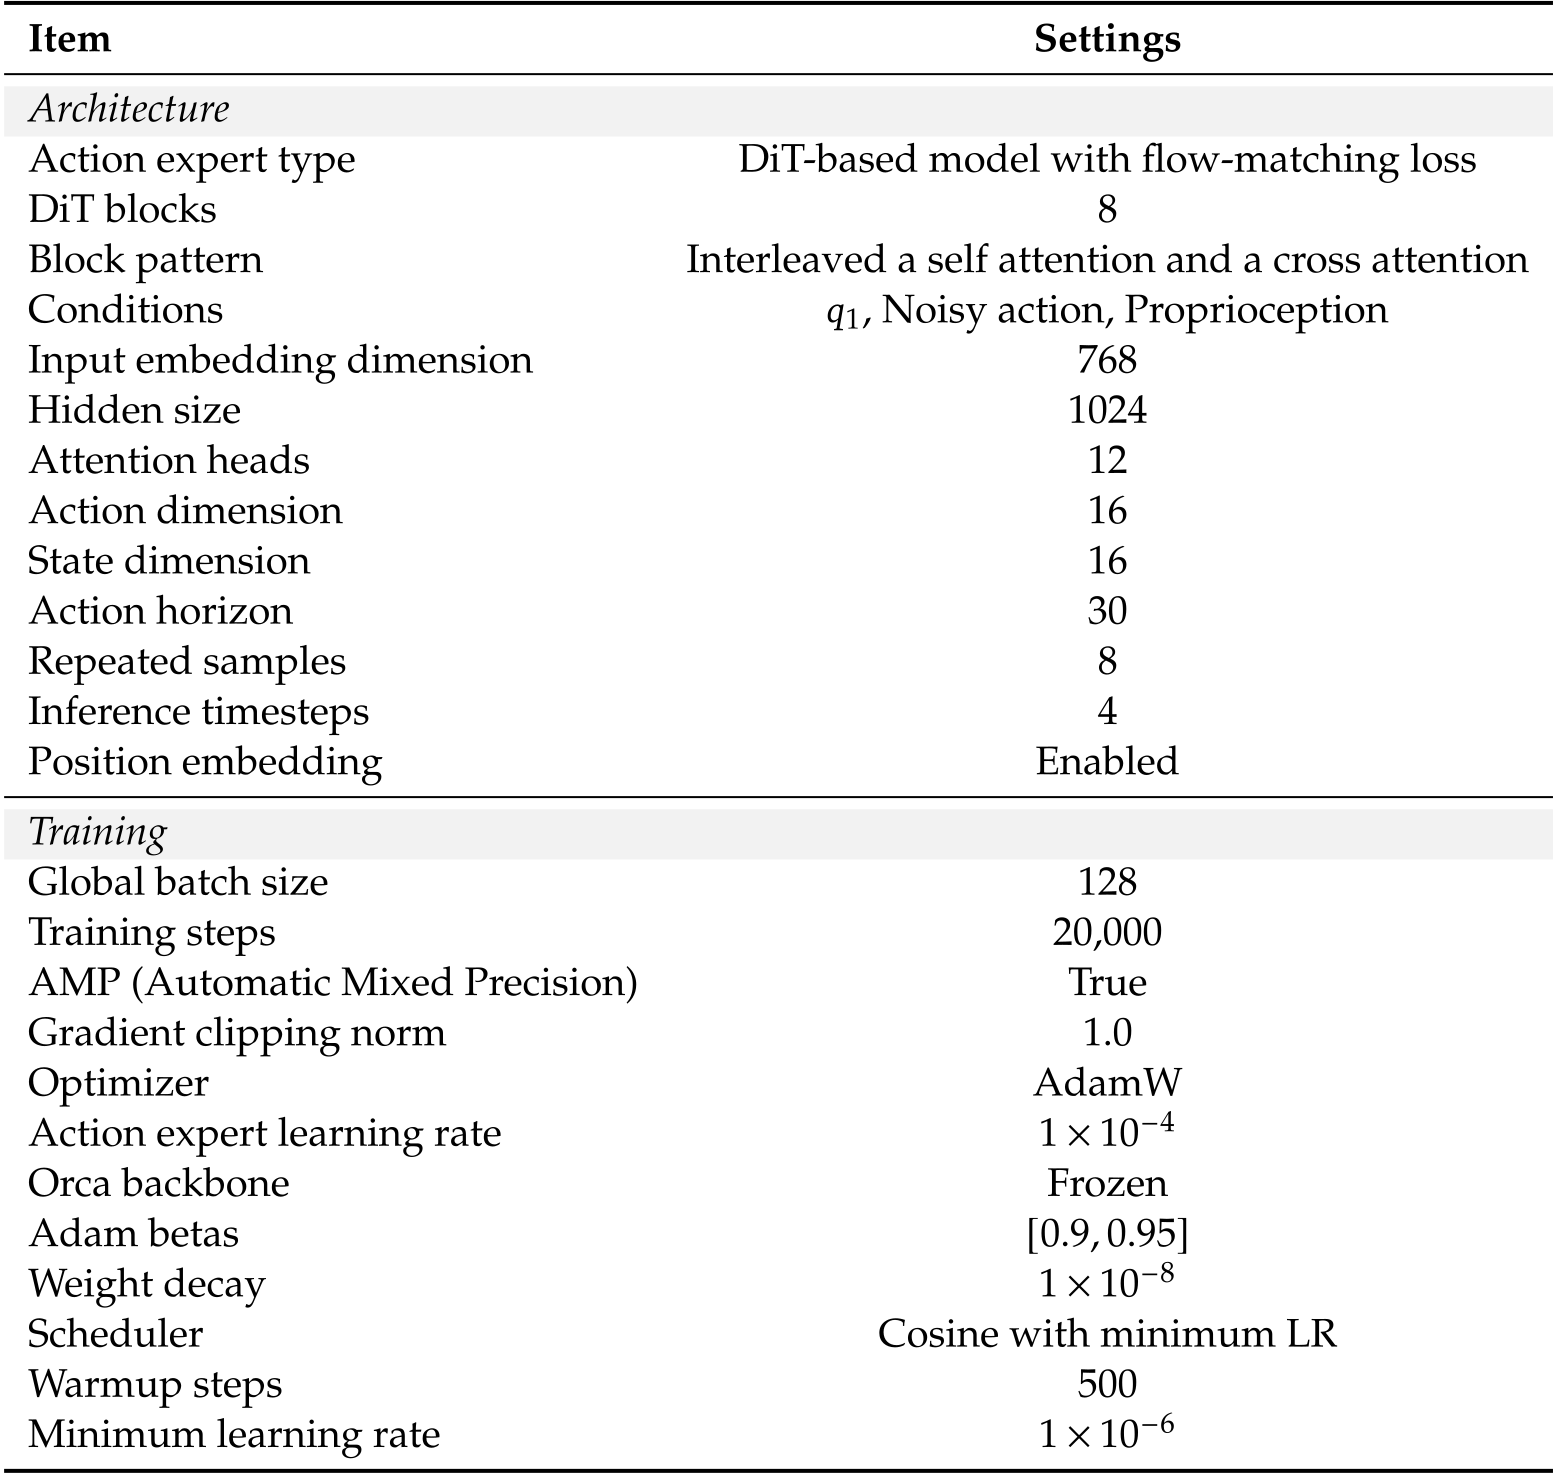
Original selectable table
| Item | Settings |
| Architecture | |
| Action expert type | DiT-based model with flow-matching loss |
| DiT blocks | 8 |
| Block pattern | Interleaved a self attention and a cross attention |
| Conditions | , Noisy action, Proprioception |
| Input embedding dimension | 768 |
| Hidden size | 1024 |
| Attention heads | 12 |
| Action dimension | 16 |
| State dimension | 16 |
| Action horizon | 30 |
| Repeated samples | 8 |
| Inference timesteps | 4 |
| Position embedding | Enabled |
| Training | |
| Global batch size | 128 |
| Training steps | 20,000 |
| AMP (Automatic Mixed Precision) | True |
| Gradient clipping norm | 1.0 |
| Optimizer | AdamW |
| Action expert learning rate | |
| Orca backbone | Frozen |
| Adam betas | |
| Weight decay | |
| Scheduler | Cosine with minimum LR |
| Warmup steps | 500 |
| Minimum learning rate | |
Appendix D Infrastructure
The infrastructure appendix isolates memory and communication changes in the reported training stack. Their throughput benefit is empirical for the tested workload/hardware.
FSDP2.
FSDP2 shards parameters, gradients and optimizer state, then reshards to release redundant copies. Lightweight visual blocks avoid unnecessary sharding overhead.
Activation Recompute.
Activation checkpointing recomputes intermediates during backpropagation to reduce retained memory. The extra computation allows larger effective batches and higher measured throughput under the memory-constrained setup.
Chunked Cross-Entropy Loss.
Chunking cross-entropy over tokens reduces large-vocabulary logits/log-softmax memory pressure. This frees capacity for longer sequences or larger batches without changing the intended language objective.
Forward/Backward Pre-fetching.
Prefetching overlaps parameter all-gather with layer computation. Table D1 progresses from FSDP2’s 0.97 to 1.35 after chunked loss, 2.86 after recomputation and 2.91 after prefetching, compared with StarVLA’s 0.66 samples/s/GPU. The largest incremental gain in this sequence accompanies recomputation; these are cumulative changes.
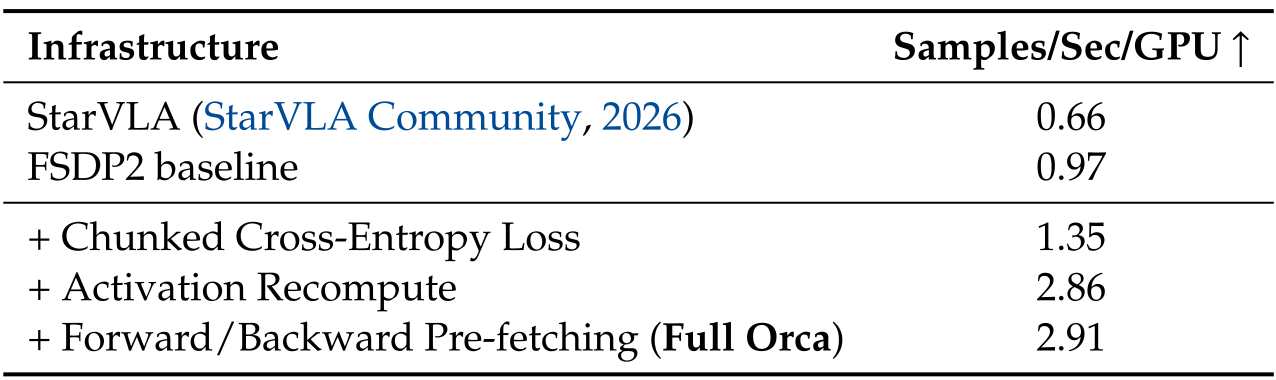
Original selectable table
| Infrastructure | Samples/Sec/GPU |
| StarVLA (StarVLA Community, 2026) | 0.66 |
| FSDP2 baseline | 0.97 |
| + Chunked Cross-Entropy Loss | 1.35 |
| + Activation Recompute | 2.86 |
| + Forward/Backward Pre-fetching (Full Orca) | 2.91 |
Appendix E Evaluation Settings
E.1 Text Generation
Benchmarks.
MVBench provides multiple-choice video questions; TemporalBench uses multiple-binary accuracy on fine-grained short-video distinctions. SWITCH probes tangible interfaces and action consequences, while 3DSRBench covers height, location, orientation and multi-object geometry. Their differing task distributions remain relevant when averaging scores.
Baselines.
The baseline set spans V-JEPA, Emu, Qwen, Gemma, DeepSeek-VL, MiniCPM and SmolVLM. V-JEPA’s text interface uses separately aligned language weights whose published results are imported; its missing benchmark entries prevent an overall comparison. All reference entries are retained.
E.2 Image Prediction
E.2.1 Benchmarks
PRICE draws initial/instruction/target examples from AgiBot-World, HomeInteract, PE-Video and PSI-Ego. HomeInteract is closed-source household data collected with the dual-arm wheeled robot. The images illustrate object manipulation, scene changes and human/robot interactions.
Although the dataset contains recorded target images, the specified scoring prompt compares only the initial image and generated result under the instruction. Benchmark size and an explicit uncertainty analysis are not supplied in these settings.
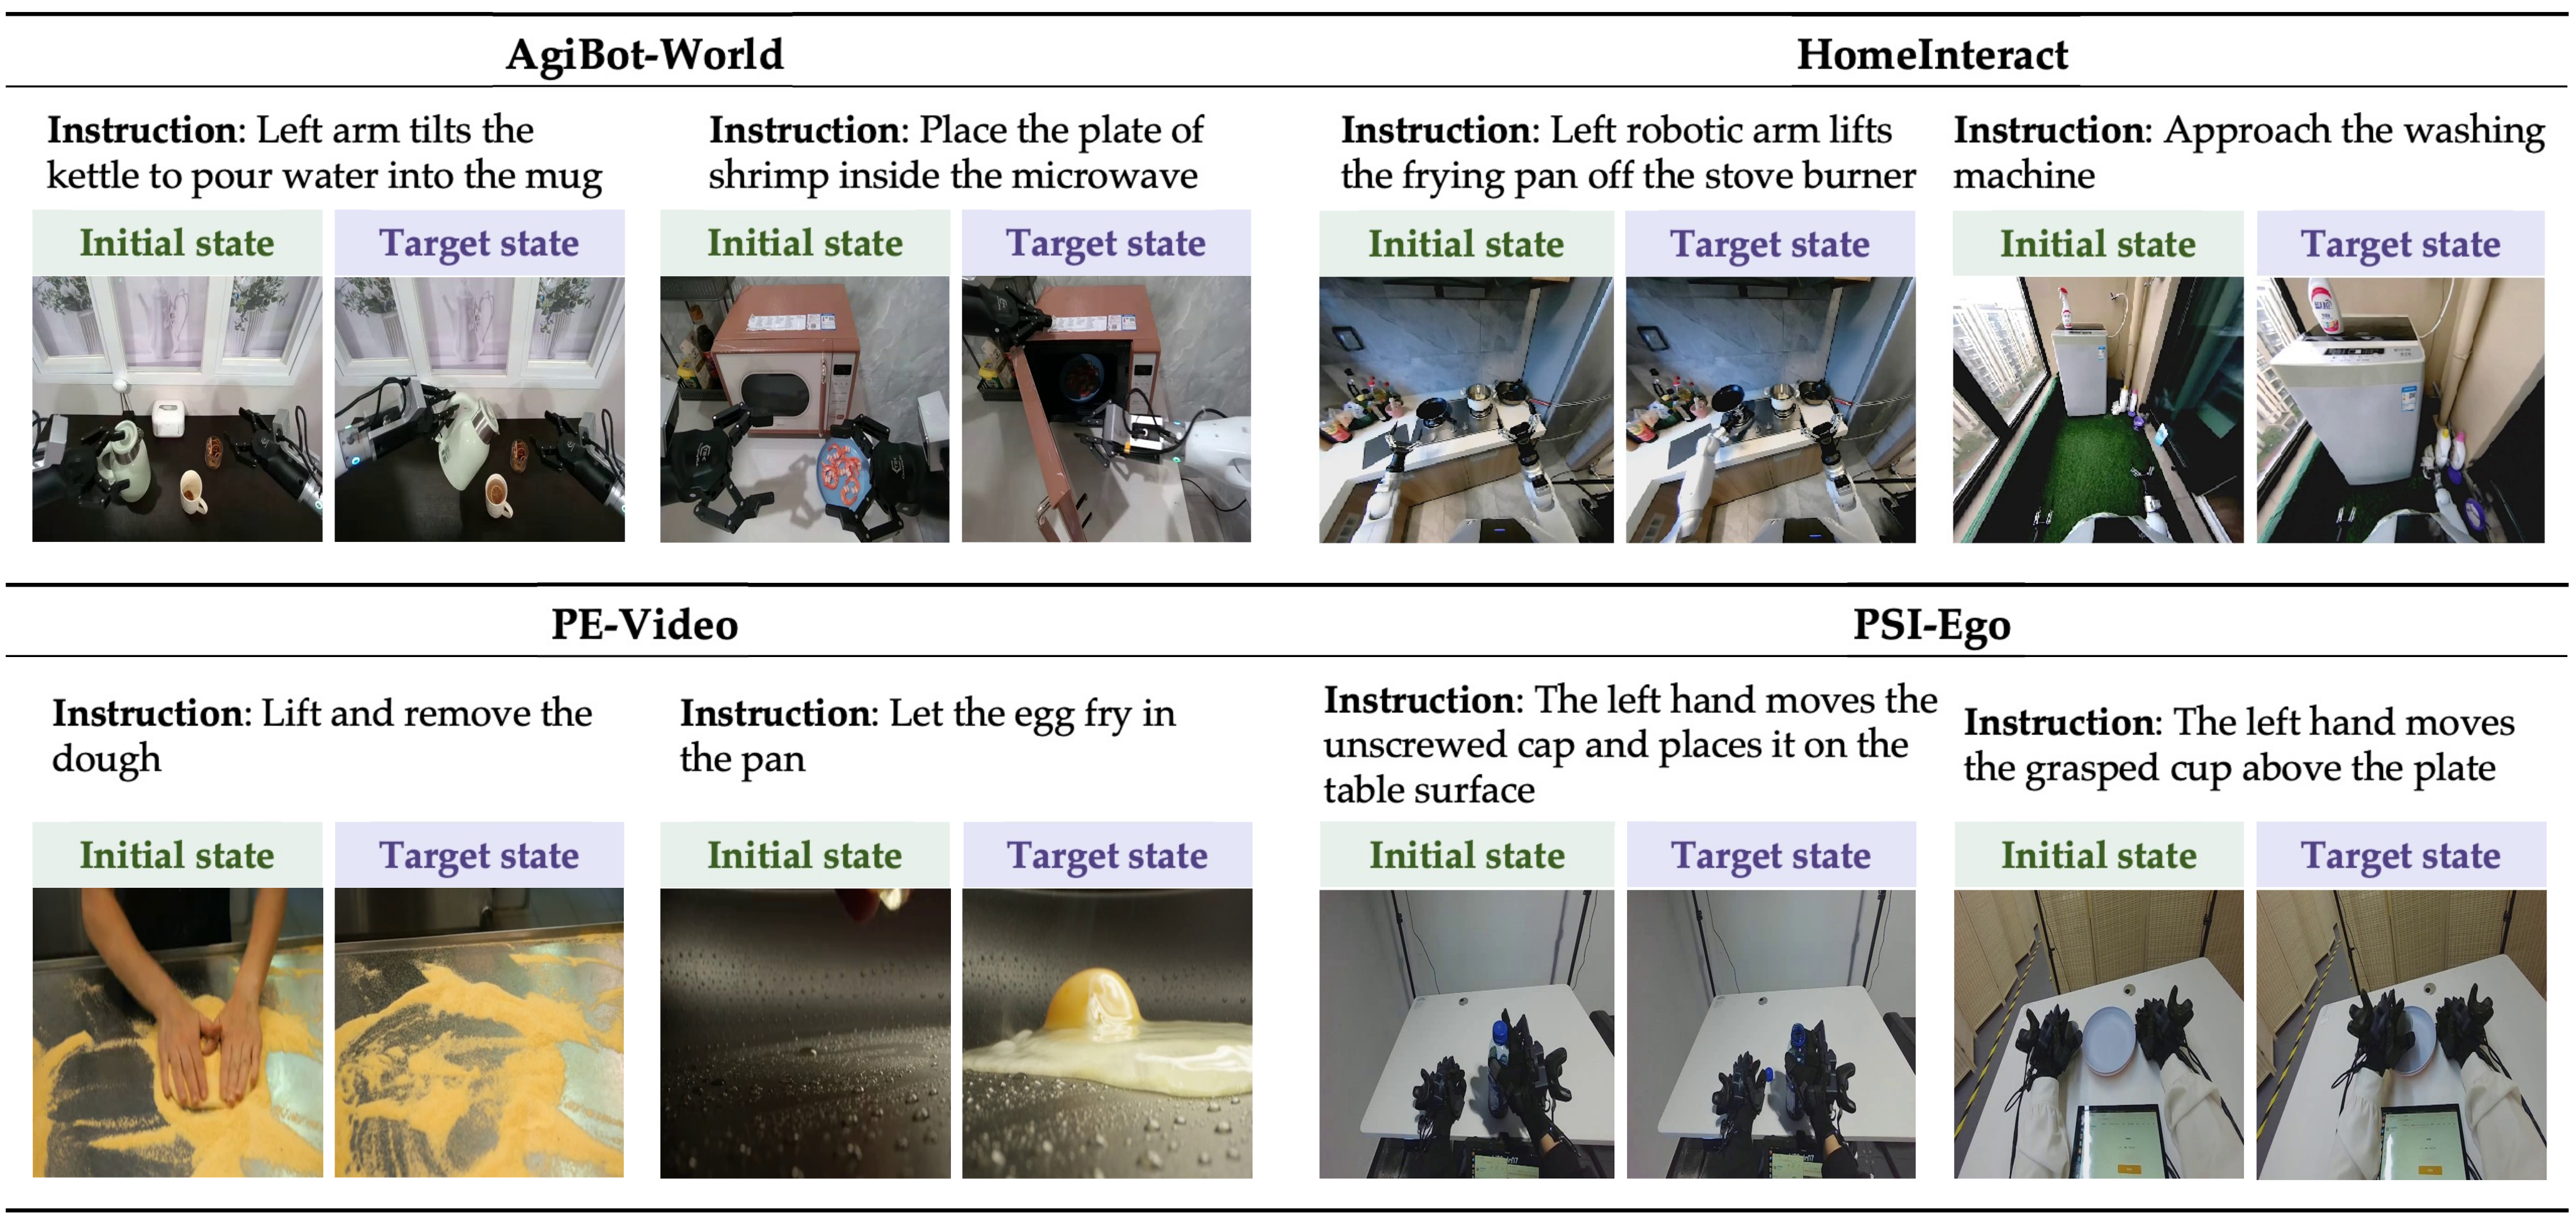
E.2.2 Metrics
Each judge returns a 1–5 integer and reasoning, then the paper converts averaged scores to its reported percentage scale without an explicit conversion formula. Listing E1 preserves the exact prompt, including its lenient treatment of partial execution, blur and minor ambiguity.
Judges penalize apparent teleportation or unchanged agent contact when an instruction implies action. They assess visible plausibility from two images; they cannot observe the intervening physical execution. Table 3’s standard deviation across judges is not a measure of trial-sampling uncertainty.
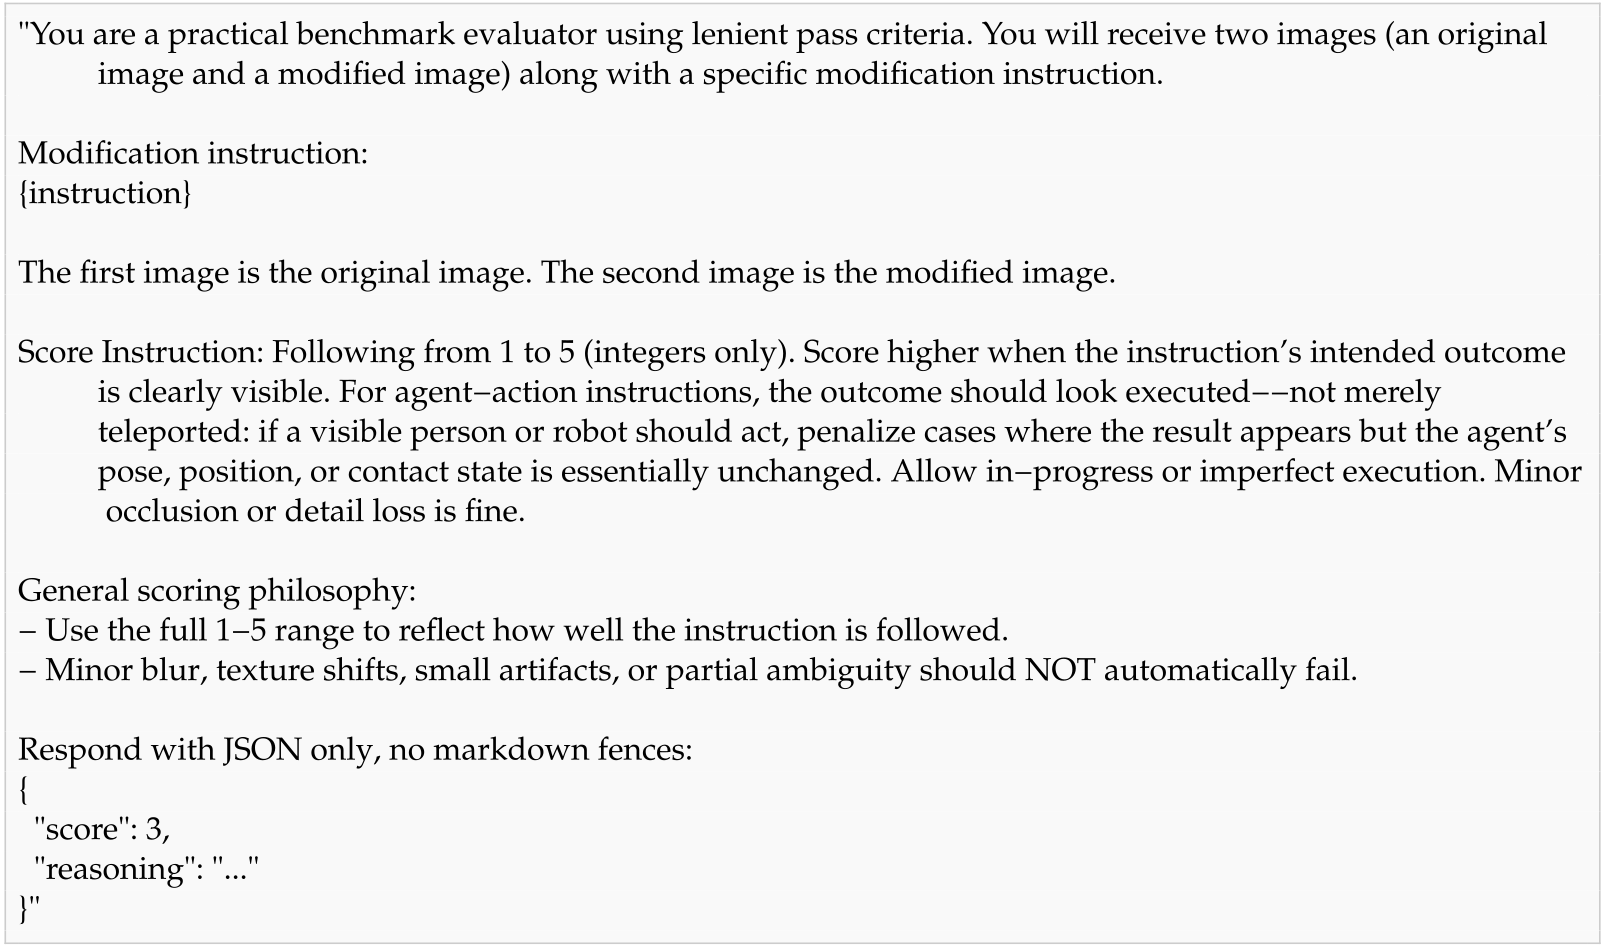
Exact selectable prompt
"You are a practical benchmark evaluator using lenient pass criteria. You will receive two images (an original image and a modified image) along with a specific modification instruction.

Modification instruction:
{instruction}

The first image is the original image. The second image is the modified image.

Score Instruction: Following from 1 to 5 (integers only). Score higher when the instruction's intended outcome is clearly visible. For agent-action instructions, the outcome should look executed--not merely teleported: if a visible person or robot should act, penalize cases where the result appears but the agent's pose, position, or contact state is essentially unchanged. Allow in-progress or imperfect execution. Minor occlusion or detail loss is fine.

General scoring philosophy:
- Use the full 1-5 range to reflect how well the instruction is followed.
- Minor blur, texture shifts, small artifacts, or partial ambiguity should NOT automatically fail.

Respond with JSON only, no markdown fences:
{
  "score": 3,
  "reasoning": "..."
}"
E.2.3 Baselines
OmniGen2 provides instruction-aligned image generation/editing; FLUX.1-Kontext handles contextual edits; FLUX.2 [klein] provides compact image generation/editing with multimodal conditions. Their decoder sizes and training histories differ from Orca’s SD3.5-based readout.
E.3 Action Generation
E.3.1 Real-Robot Benchmark
Each of five tasks contributes two hundred training trajectories. Three unseen appearance settings change backgrounds/tablecloths; object transfer changes objects and associated wording. Table E1 retains exact pairs: books→cutting boards, bowls→boxes, tissue→bread, regular→children’s stamps, and sugar/mug→candy/paper cup.
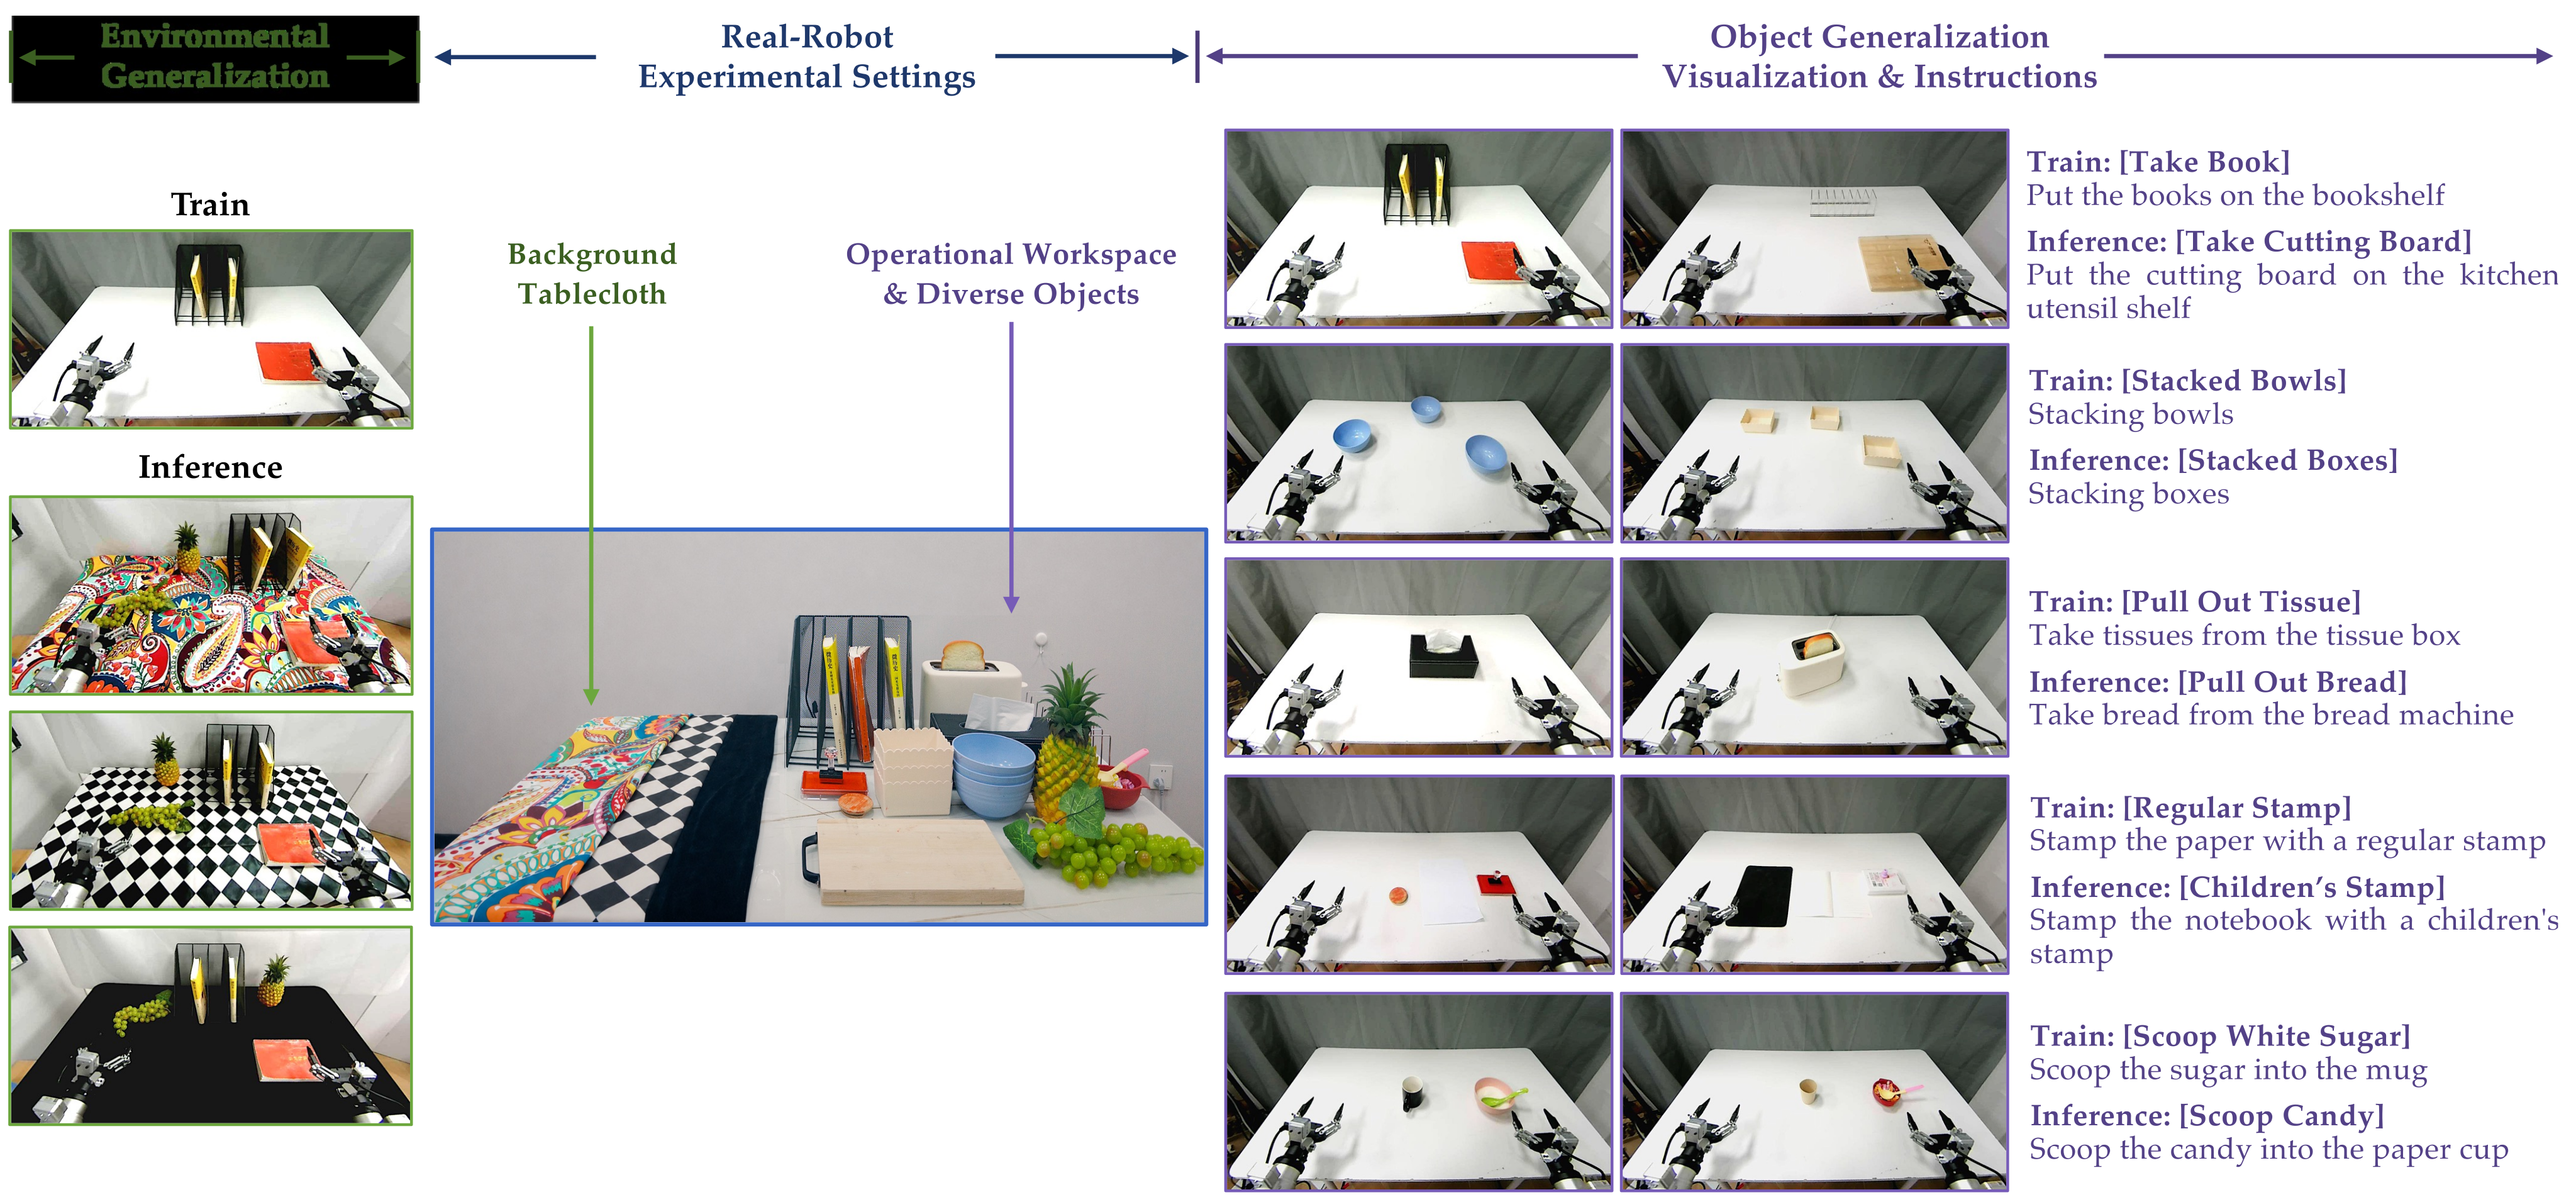

Original selectable table
| Task | Training Instruction | Inference Instruction |
| Take Book | Put the book on the bookshelf. | Put the cutting board on the kitchen utensil shelf. |
| Stacked Bowls | Stack bowls. | Stack boxes. |
| Pull Out Tissue | Take tissue from the tissue box. | Take bread from the bread machine. |
| Stamp | Stamp the paper with a regular stamp. | Stamp the notebook with a children’s stamp. |
| Scoop Sugar | Scoop sugar into the mug with a spoon. | Scoop candy into the paper cup with a spoon. |
E.3.2 Metrics
The sixty-second evaluation stops if a severe collision locks the robot or a fallen object makes continuation impossible. Rule-based scoring keeps the highest achieved stage score, so substantial progress may coexist with final failure.
The complete rubric is retained. Some scooping movement/pouring stages explicitly do not require sugar to remain in the spoon, and tissue handling scores the two arms separately. Therefore the progress score should not be described as the fraction of tasks fully completed or as an independent material-transfer measurement.
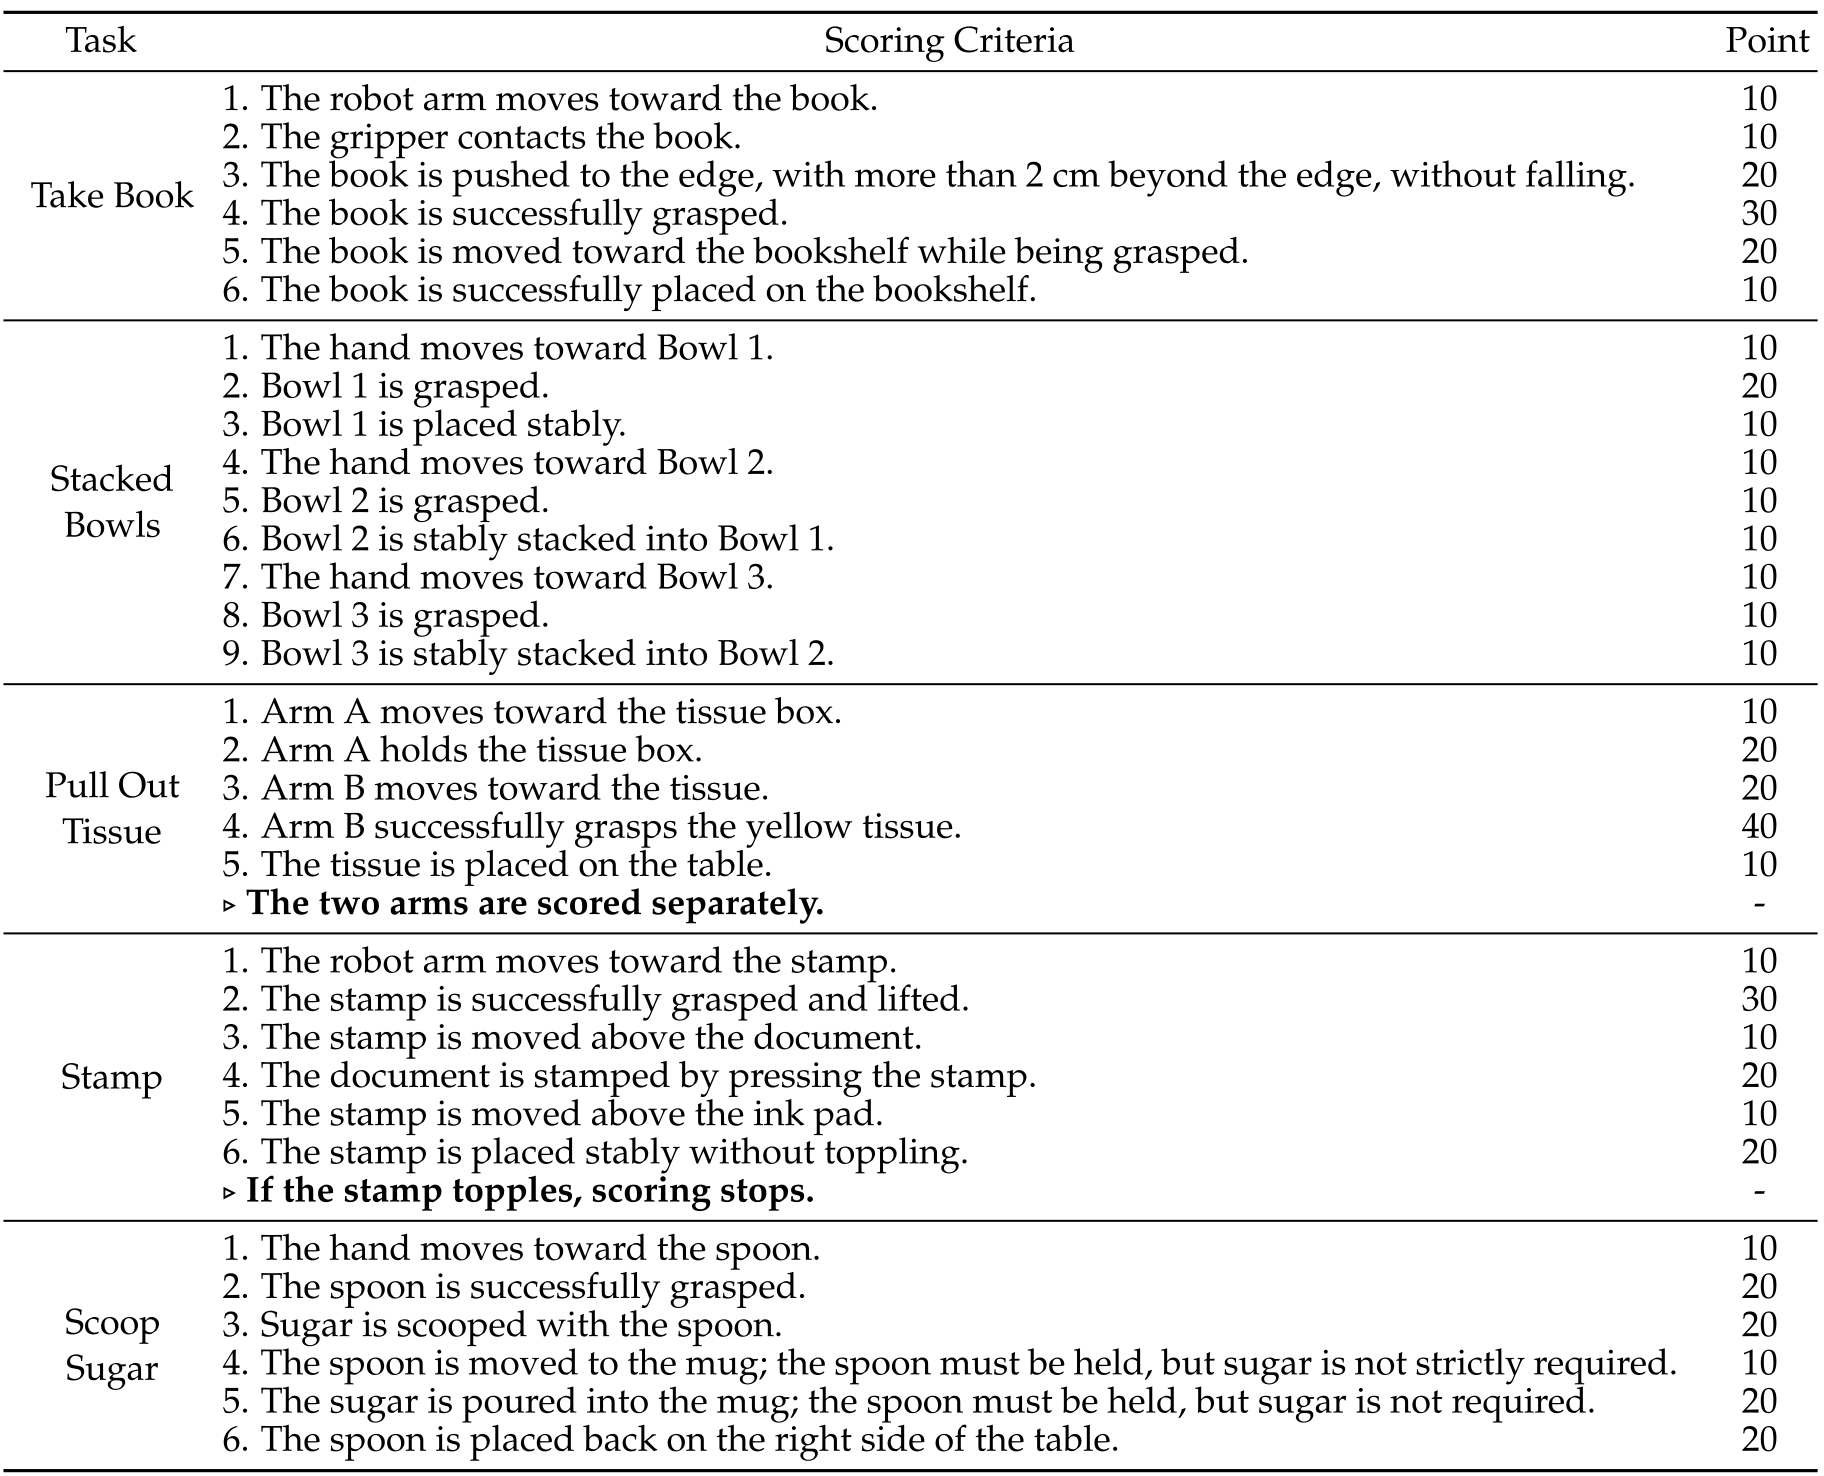
Original selectable table
| Task | Scoring Criteria | Point |
| Take Book | 1. The robot arm moves toward the book. | 10 |
| 2. The gripper contacts the book. | 10 | |
| 3. The book is pushed to the edge, with more than 2 cm beyond the edge, without falling. | 20 | |
| 4. The book is successfully grasped. | 30 | |
| 5. The book is moved toward the bookshelf while being grasped. | 20 | |
| 6. The book is successfully placed on the bookshelf. | 10 | |
| Stacked Bowls | 1. The hand moves toward Bowl 1. | 10 |
| 2. Bowl 1 is grasped. | 20 | |
| 3. Bowl 1 is placed stably. | 10 | |
| 4. The hand moves toward Bowl 2. | 10 | |
| 5. Bowl 2 is grasped. | 10 | |
| 6. Bowl 2 is stably stacked into Bowl 1. | 10 | |
| 7. The hand moves toward Bowl 3. | 10 | |
| 8. Bowl 3 is grasped. | 10 | |
| 9. Bowl 3 is stably stacked into Bowl 2. | 10 | |
| Pull Out Tissue | 1. Arm A moves toward the tissue box. | 10 |
| 2. Arm A holds the tissue box. | 20 | |
| 3. Arm B moves toward the tissue. | 20 | |
| 4. Arm B successfully grasps the yellow tissue. | 40 | |
| 5. The tissue is placed on the table. | 10 | |
| The two arms are scored separately. | - | |
| Stamp | 1. The robot arm moves toward the stamp. | 10 |
| 2. The stamp is successfully grasped and lifted. | 30 | |
| 3. The stamp is moved above the document. | 10 | |
| 4. The document is stamped by pressing the stamp. | 20 | |
| 5. The stamp is moved above the ink pad. | 10 | |
| 6. The stamp is placed stably without toppling. | 20 | |
| If the stamp topples, scoring stops. | - | |
| Scoop Sugar | 1. The hand moves toward the spoon. | 10 |
| 2. The spoon is successfully grasped. | 20 | |
| 3. Sugar is scooped with the spoon. | 20 | |
| 4. The spoon is moved to the mug; the spoon must be held, but sugar is not strictly required. | 10 | |
| 5. The sugar is poured into the mug; the spoon must be held, but sugar is not required. | 20 | |
| 6. The spoon is placed back on the right side of the table. | 20 |
E.3.3 Baselines
The three representation-based experts share initialization/training settings, while π₀.₅ follows its own pretrained action-expert setup and update/batch budget. The absent goal image rules out V-JEPA’s native planner here, so this tests a newly attached readout rather than every way to deploy that backbone.
E.3.4 Detailed Real-Robot Results
Task-level results are uneven. Environment-OOD Orca-4B reaches 62 on stamping versus π₀.₅’s 9, but only 16 on sugar versus 26. Under object OOD, Orca scores 4 on stamping versus 13 and 28 on stacking versus 46, while tissue/bread transfer favors Orca, 59 versus 55.
The smaller Orca has environment/object averages 27.4/26.8, and its object tissue score 65 exceeds the larger model’s 59. These variations qualify aggregate size/transfer trends; Table E3 reports progress, not complete-task success.
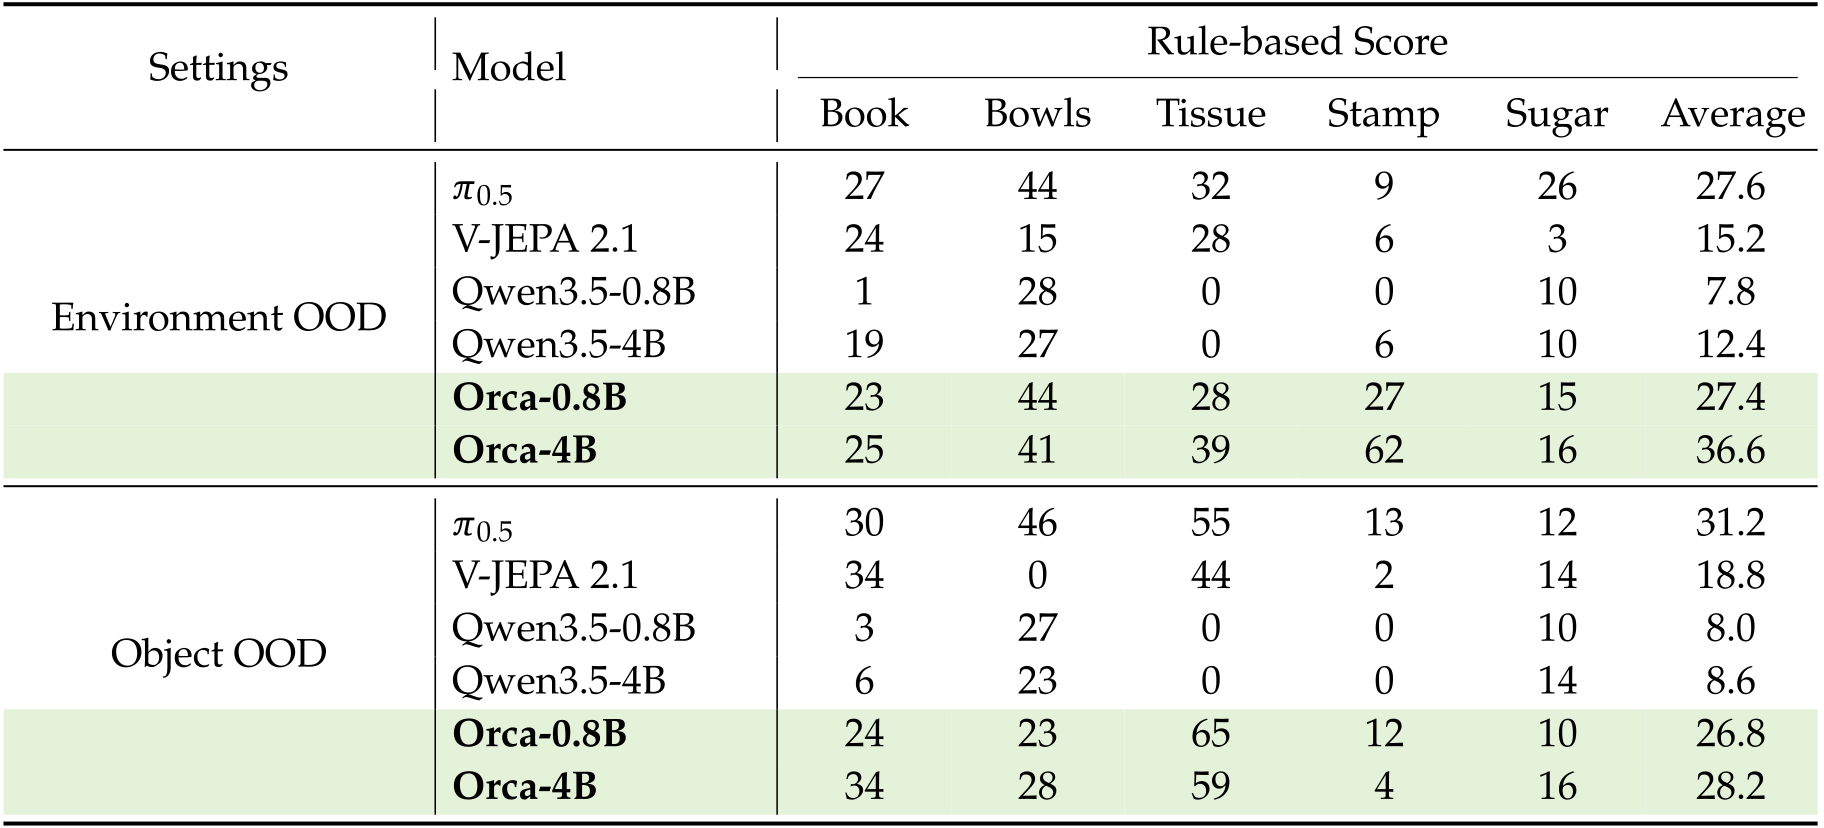
Original selectable table
| Settings | Model | Rule-based Score | |||||
| Book | Bowls | Tissue | Stamp | Sugar | Average | ||
| Environment OOD | 27 | 44 | 32 | 9 | 26 | 27.6 | |
| V-JEPA 2.1 | 24 | 15 | 28 | 6 | 3 | 15.2 | |
| Qwen3.5-0.8B | 1 | 28 | 0 | 0 | 10 | 7.8 | |
| Qwen3.5-4B | 19 | 27 | 0 | 6 | 10 | 12.4 | |
| Orca-0.8B | 23 | 44 | 28 | 27 | 15 | 27.4 | |
| Orca-4B | 25 | 41 | 39 | 62 | 16 | 36.6 | |
| Object OOD | 30 | 46 | 55 | 13 | 12 | 31.2 | |
| V-JEPA 2.1 | 34 | 0 | 44 | 2 | 14 | 18.8 | |
| Qwen3.5-0.8B | 3 | 27 | 0 | 0 | 10 | 8.0 | |
| Qwen3.5-4B | 6 | 23 | 0 | 0 | 14 | 8.6 | |
| Orca-0.8B | 24 | 23 | 65 | 12 | 10 | 26.8 | |
| Orca-4B | 34 | 28 | 59 | 4 | 16 | 28.2 | |
E.3.5 Additional Qualitative Visualizations
Five additional trajectories illustrate higher progress before failure and retries after grasp failures. The stamp example still ends in a drop; improved spoon grasping need not finish scooping. These selected sequences support process-level interpretation but are not independent success-rate estimates.
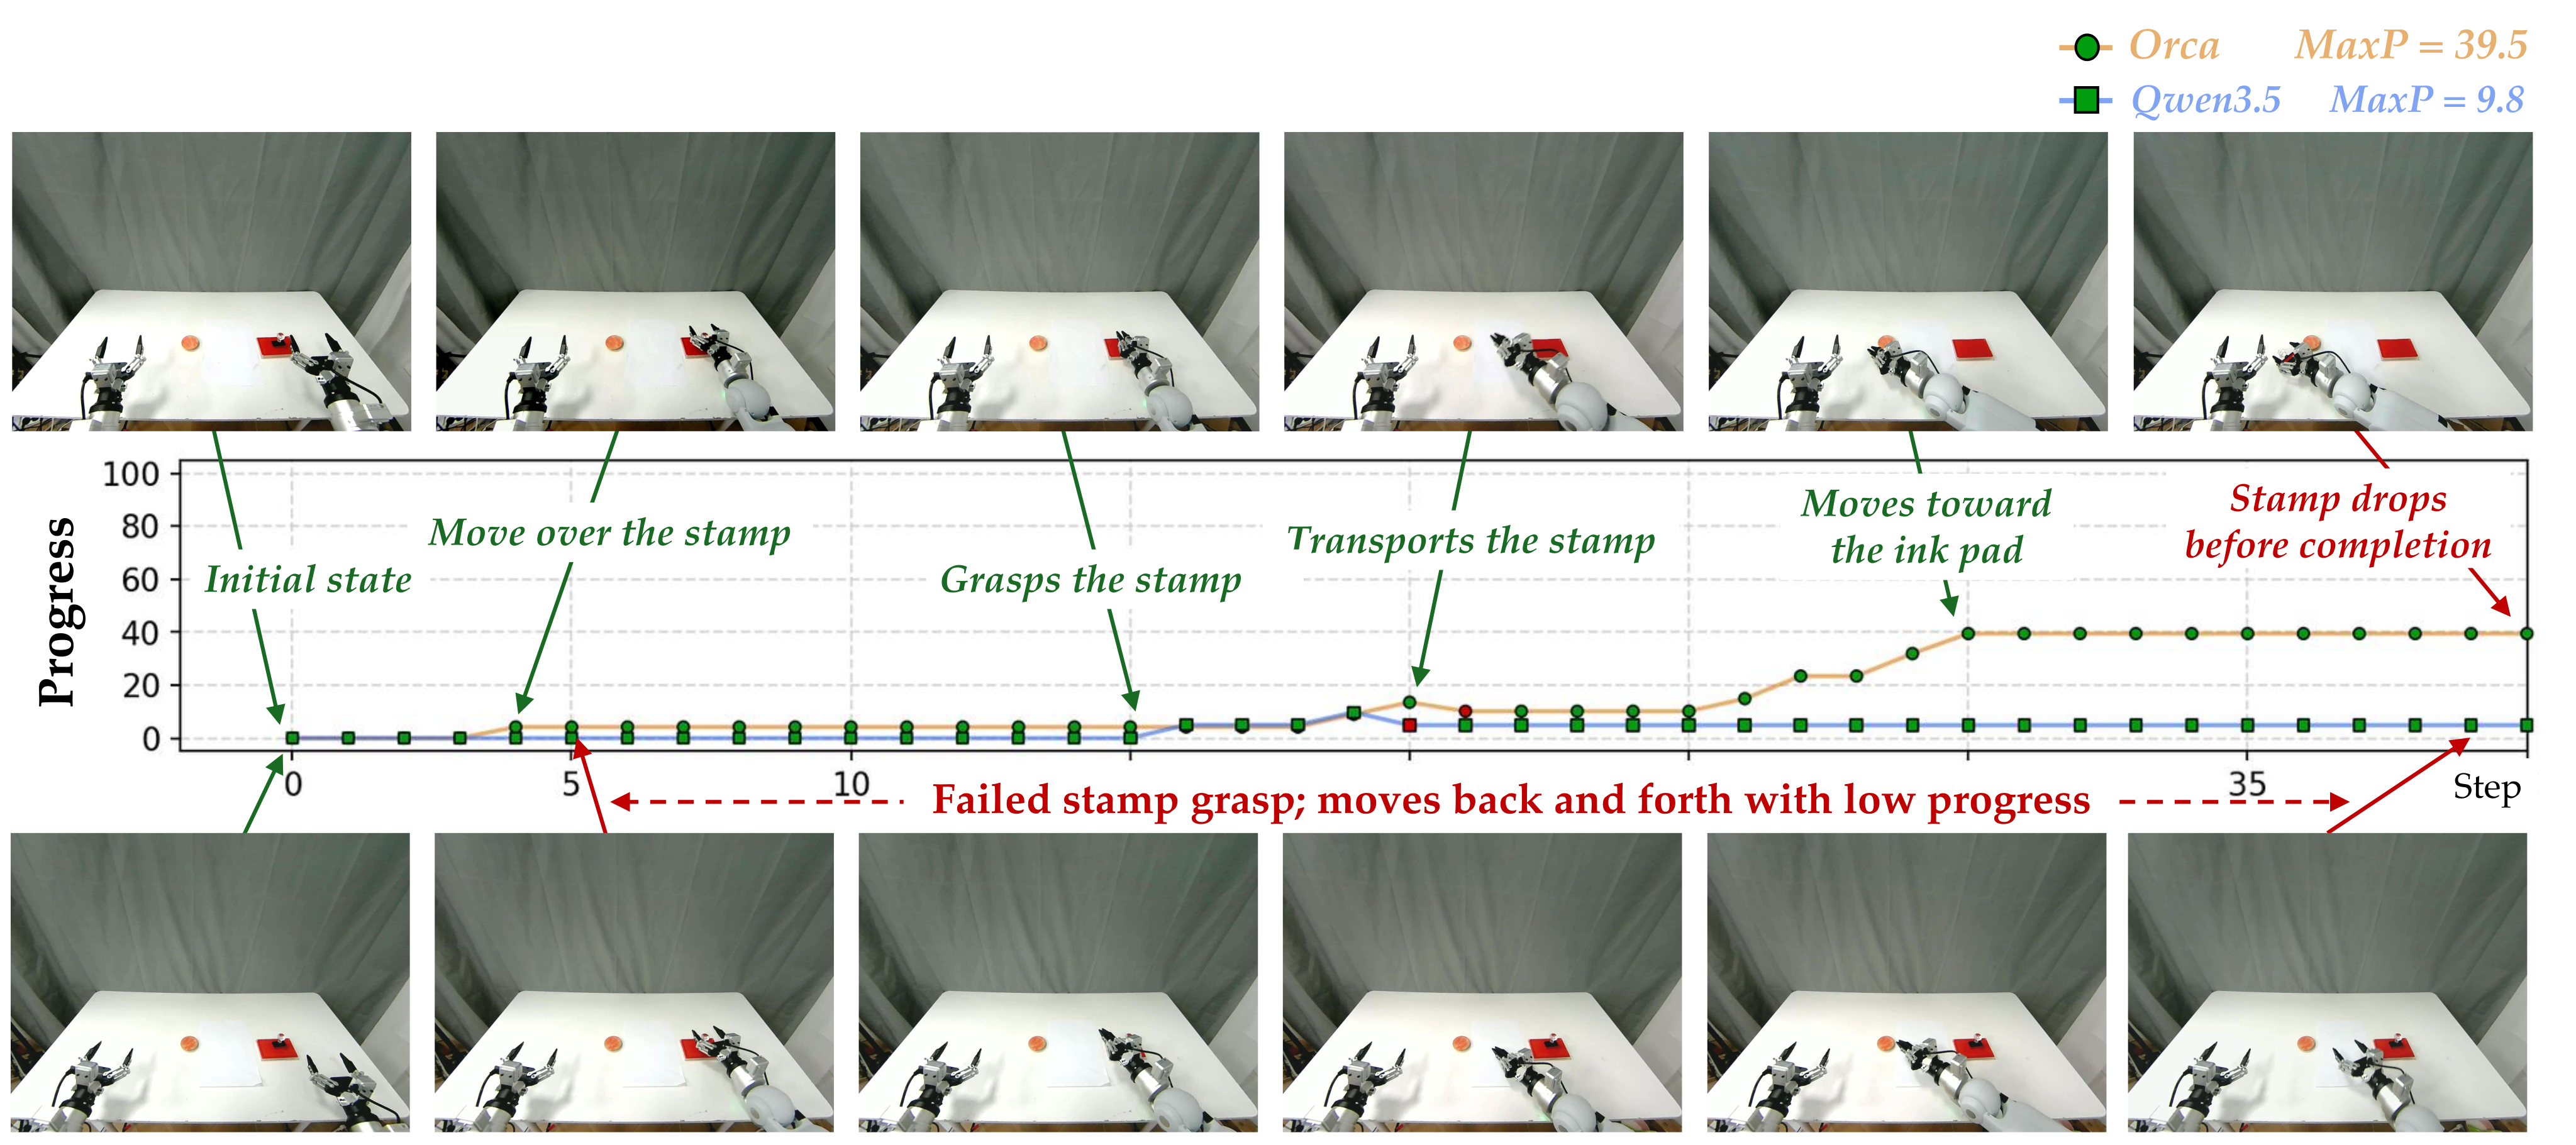
Appendix F More Visualization
F.1 Cross-Benchmark Capability Analysis for Text Generation
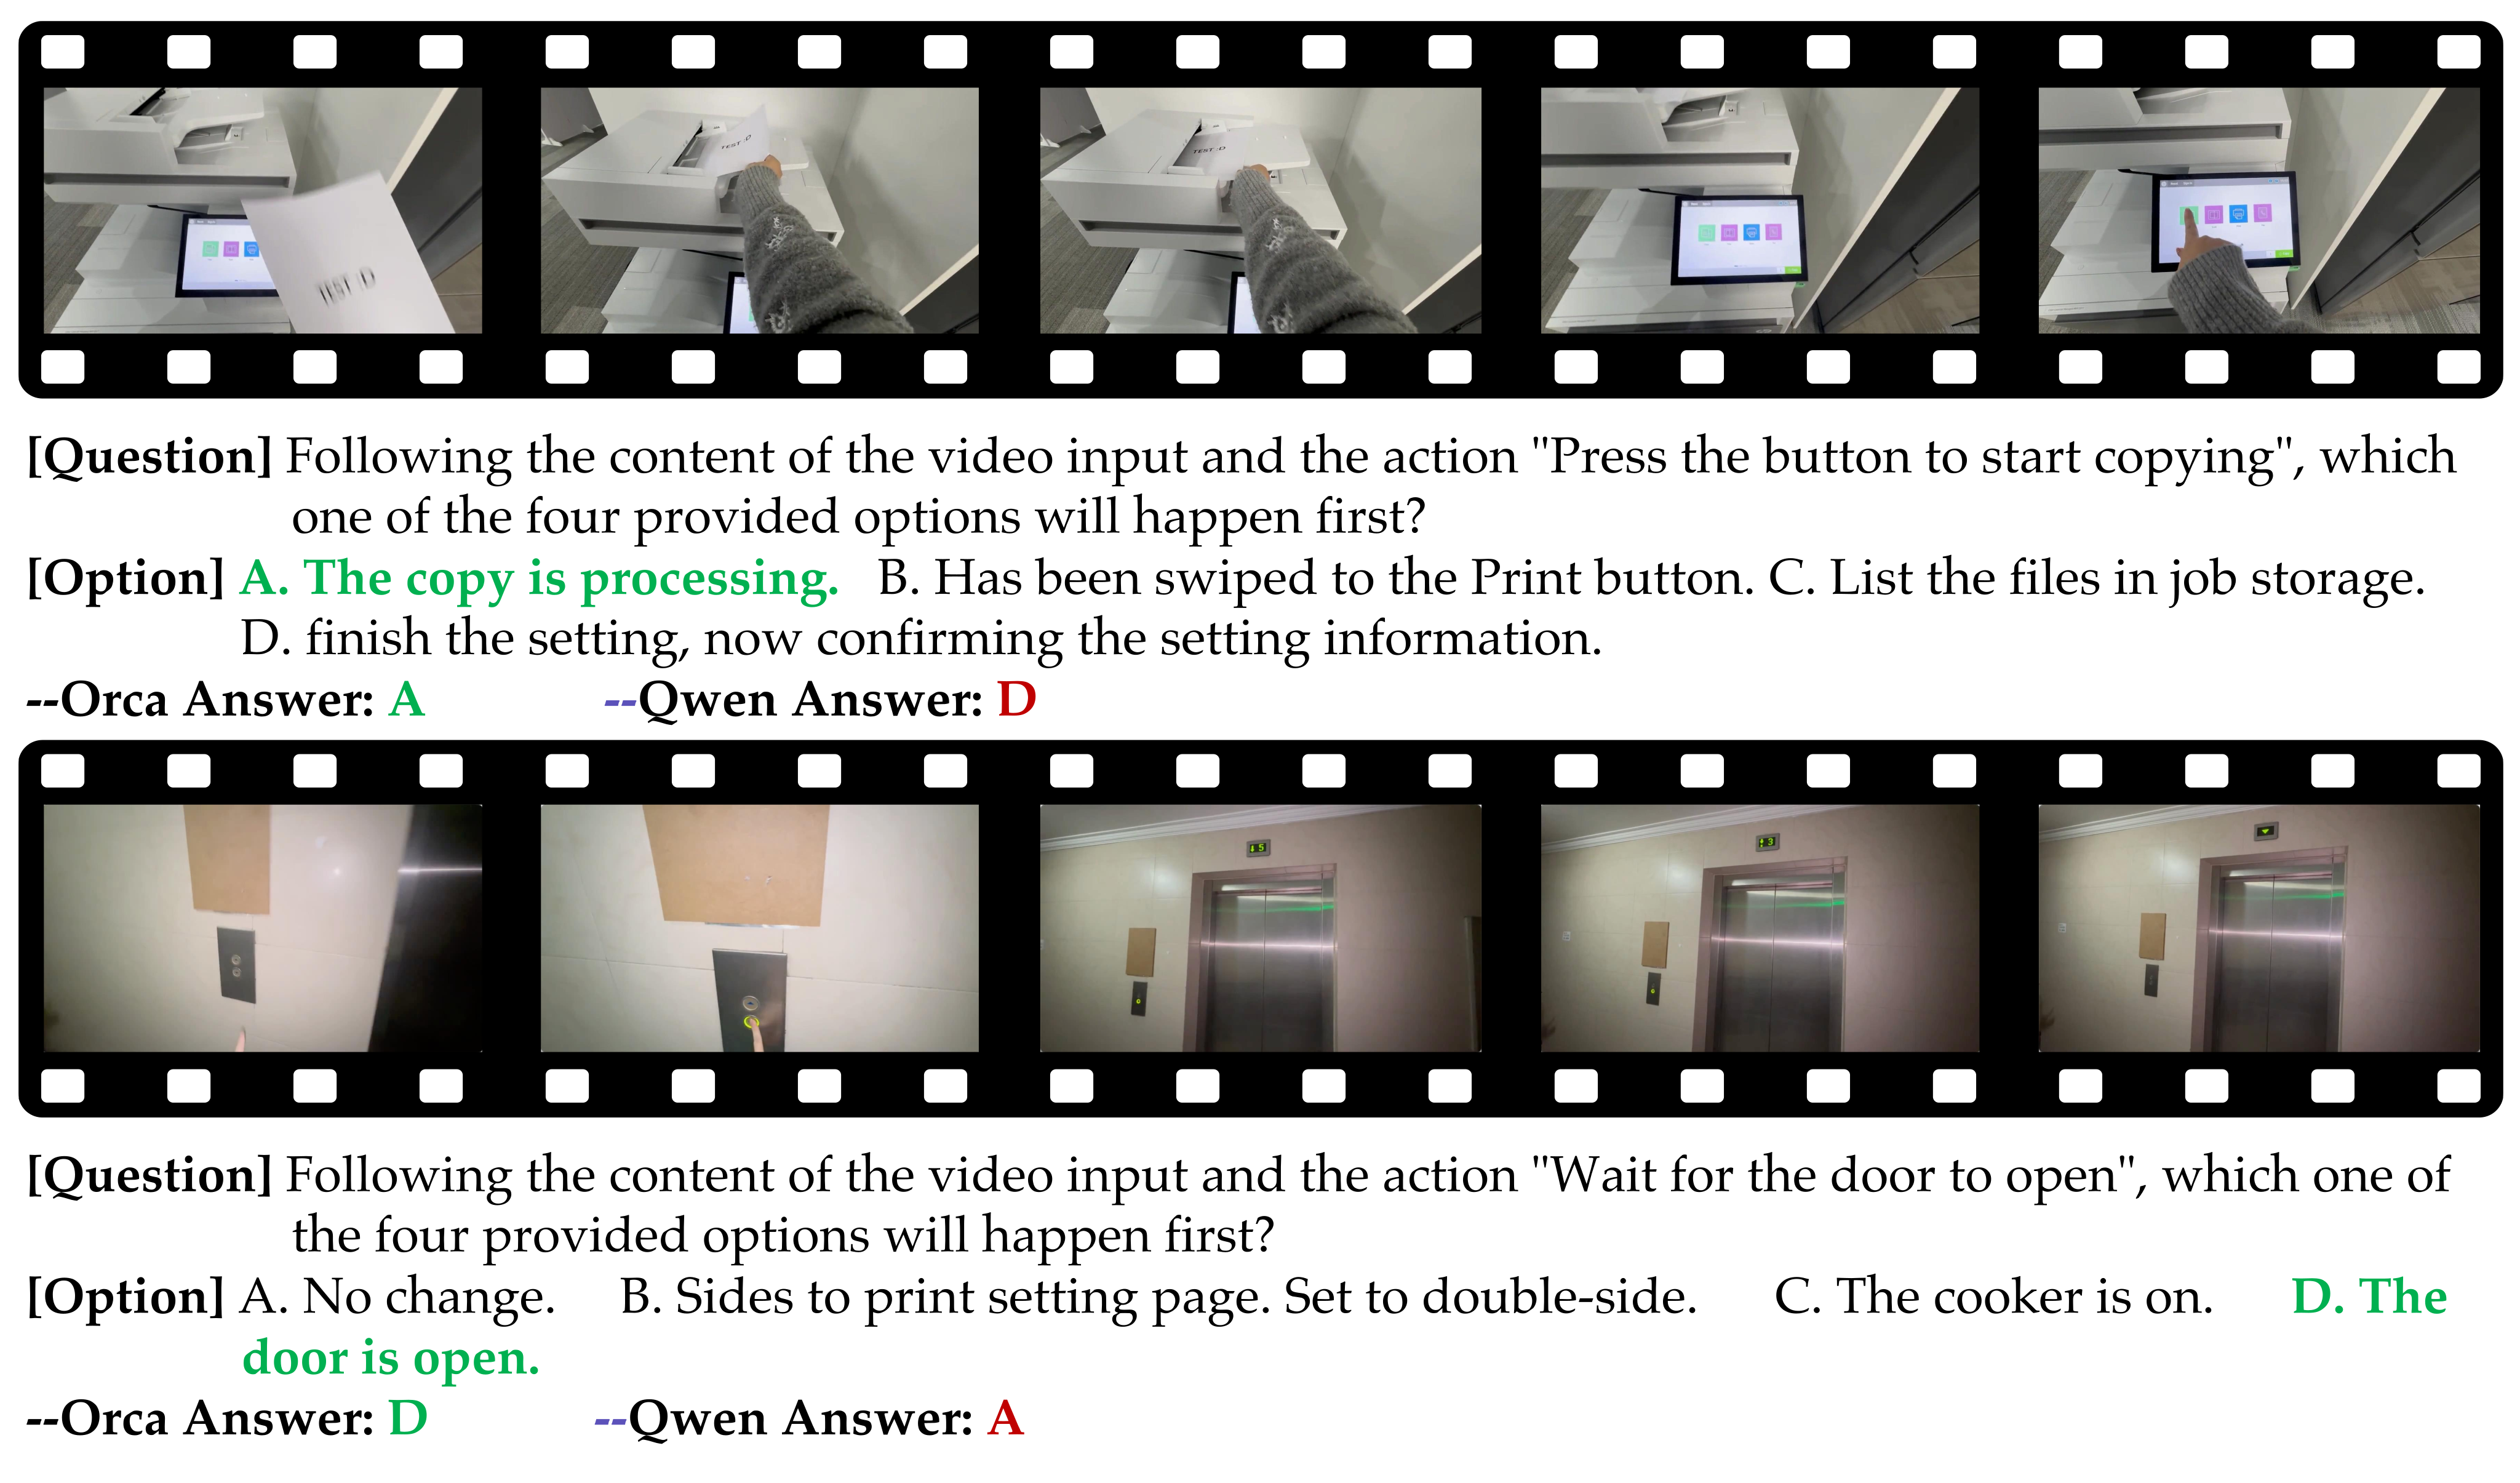
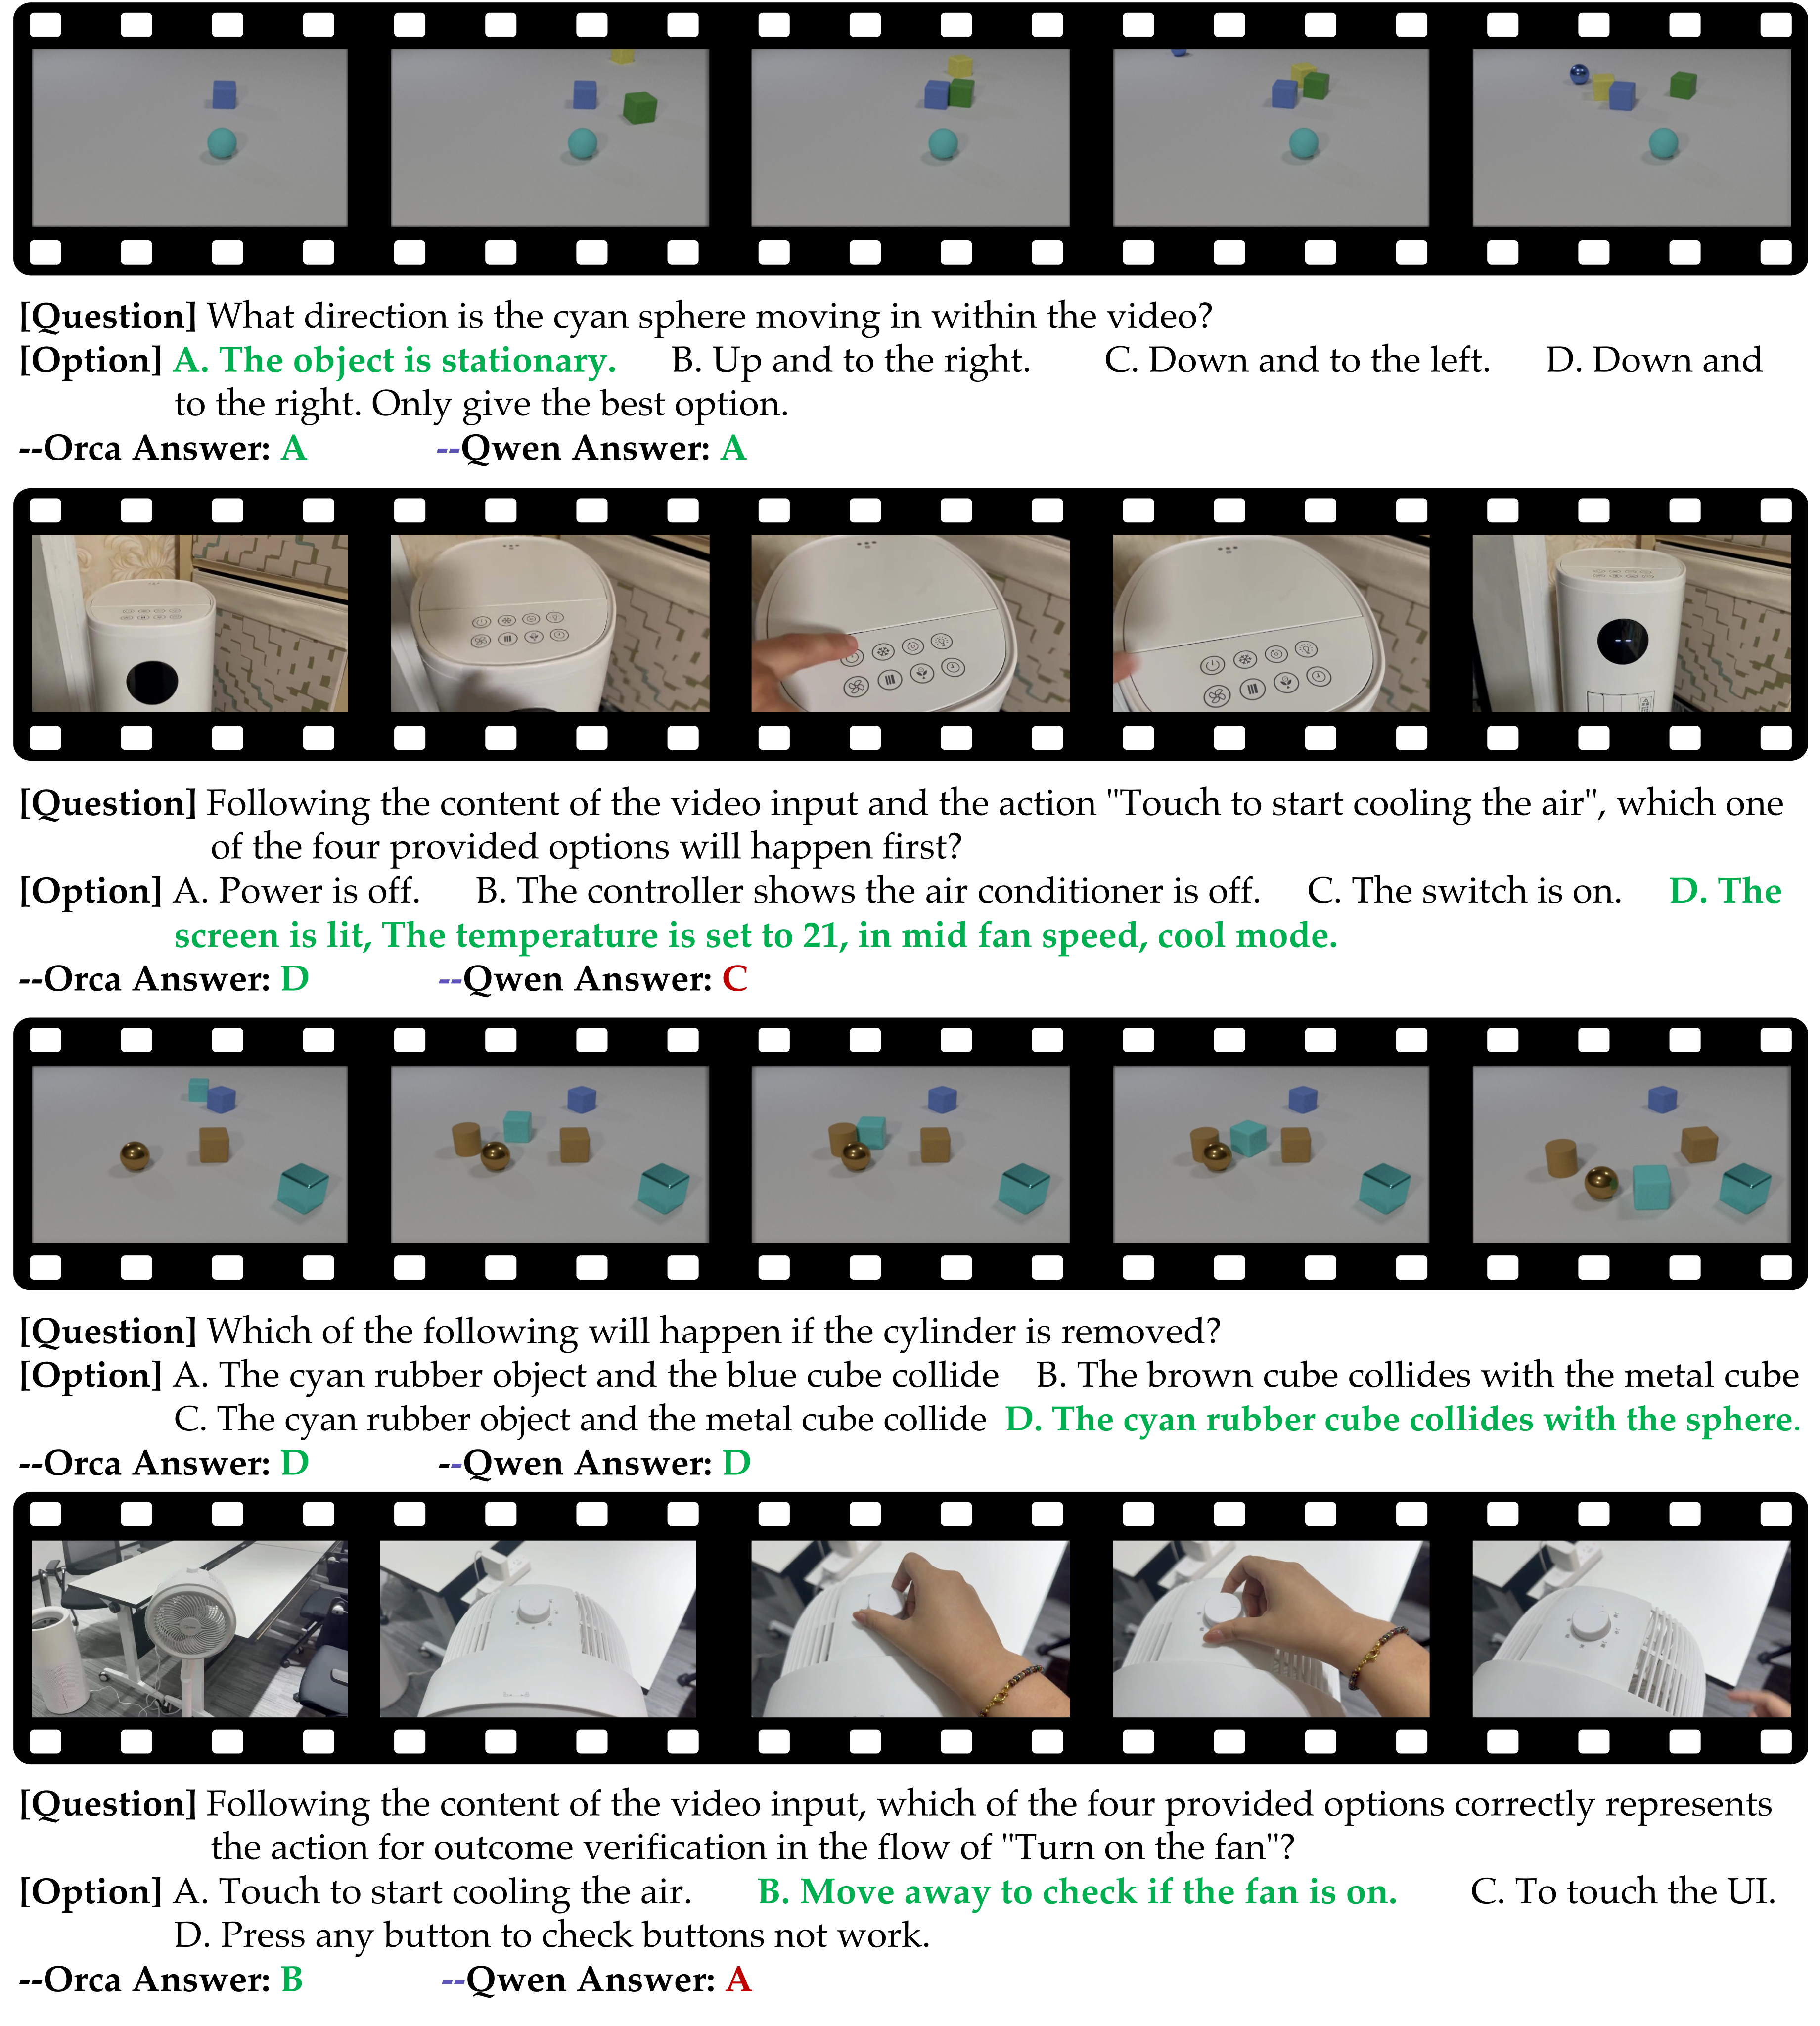
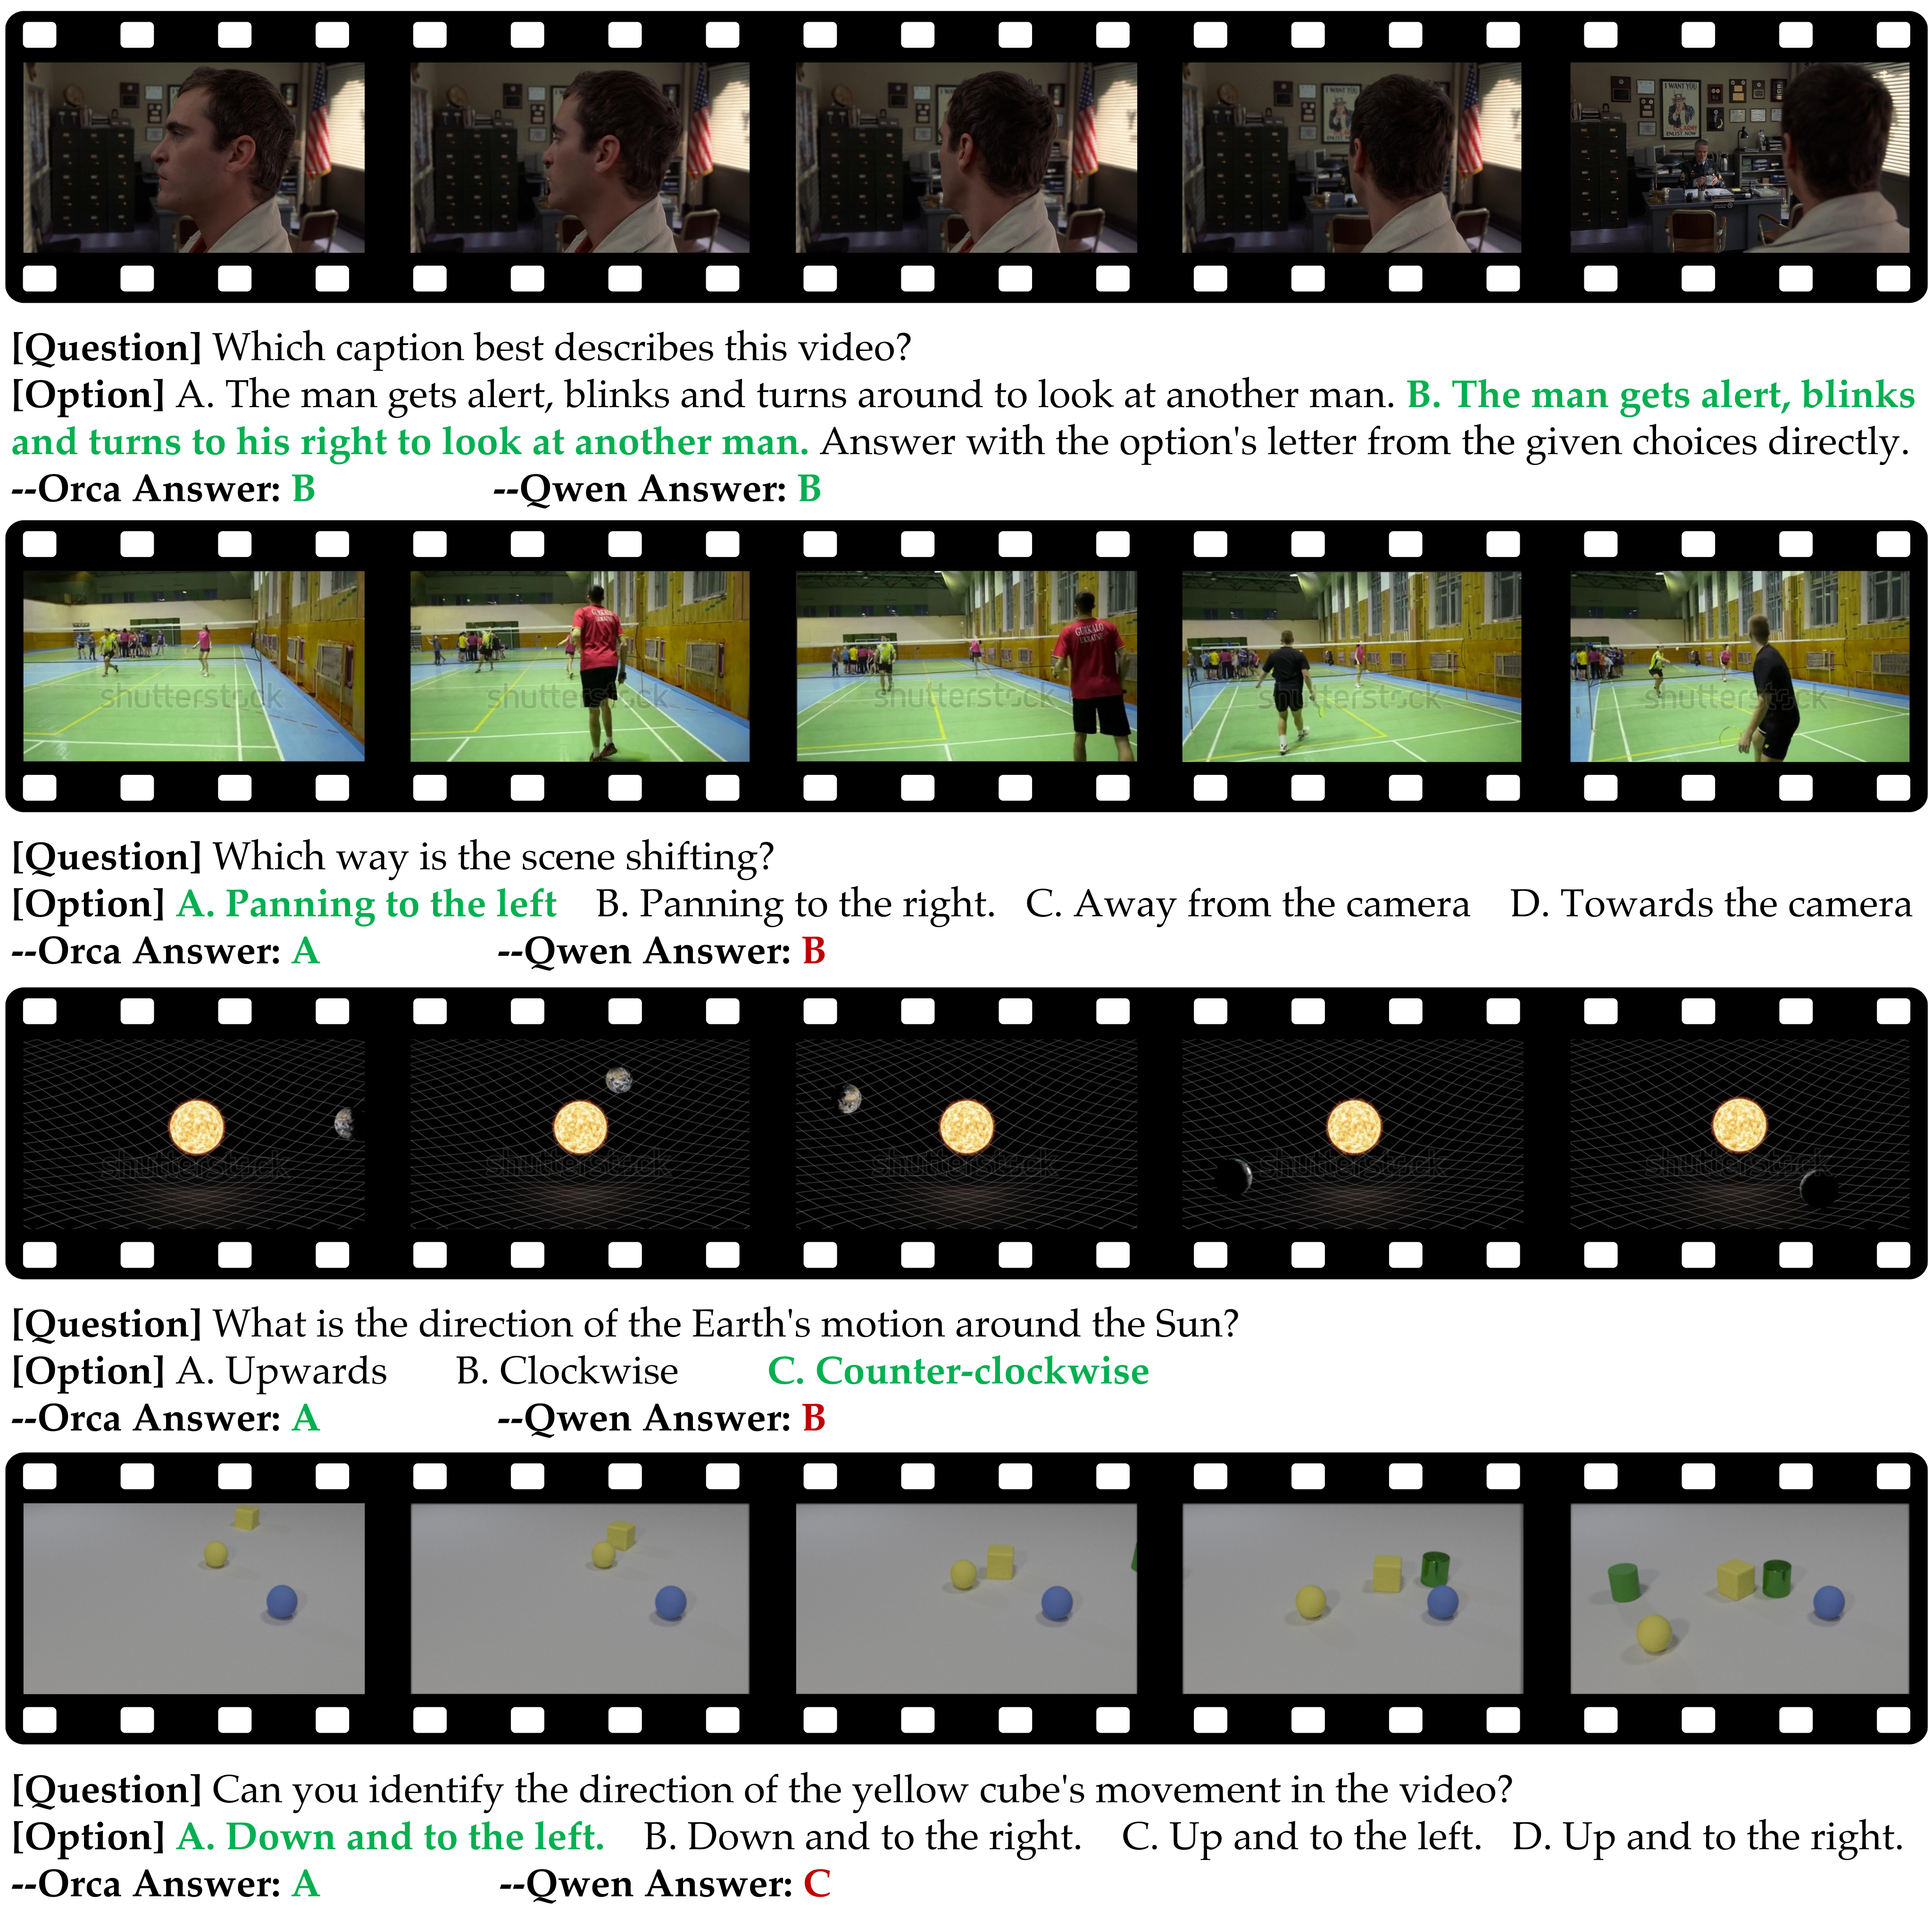
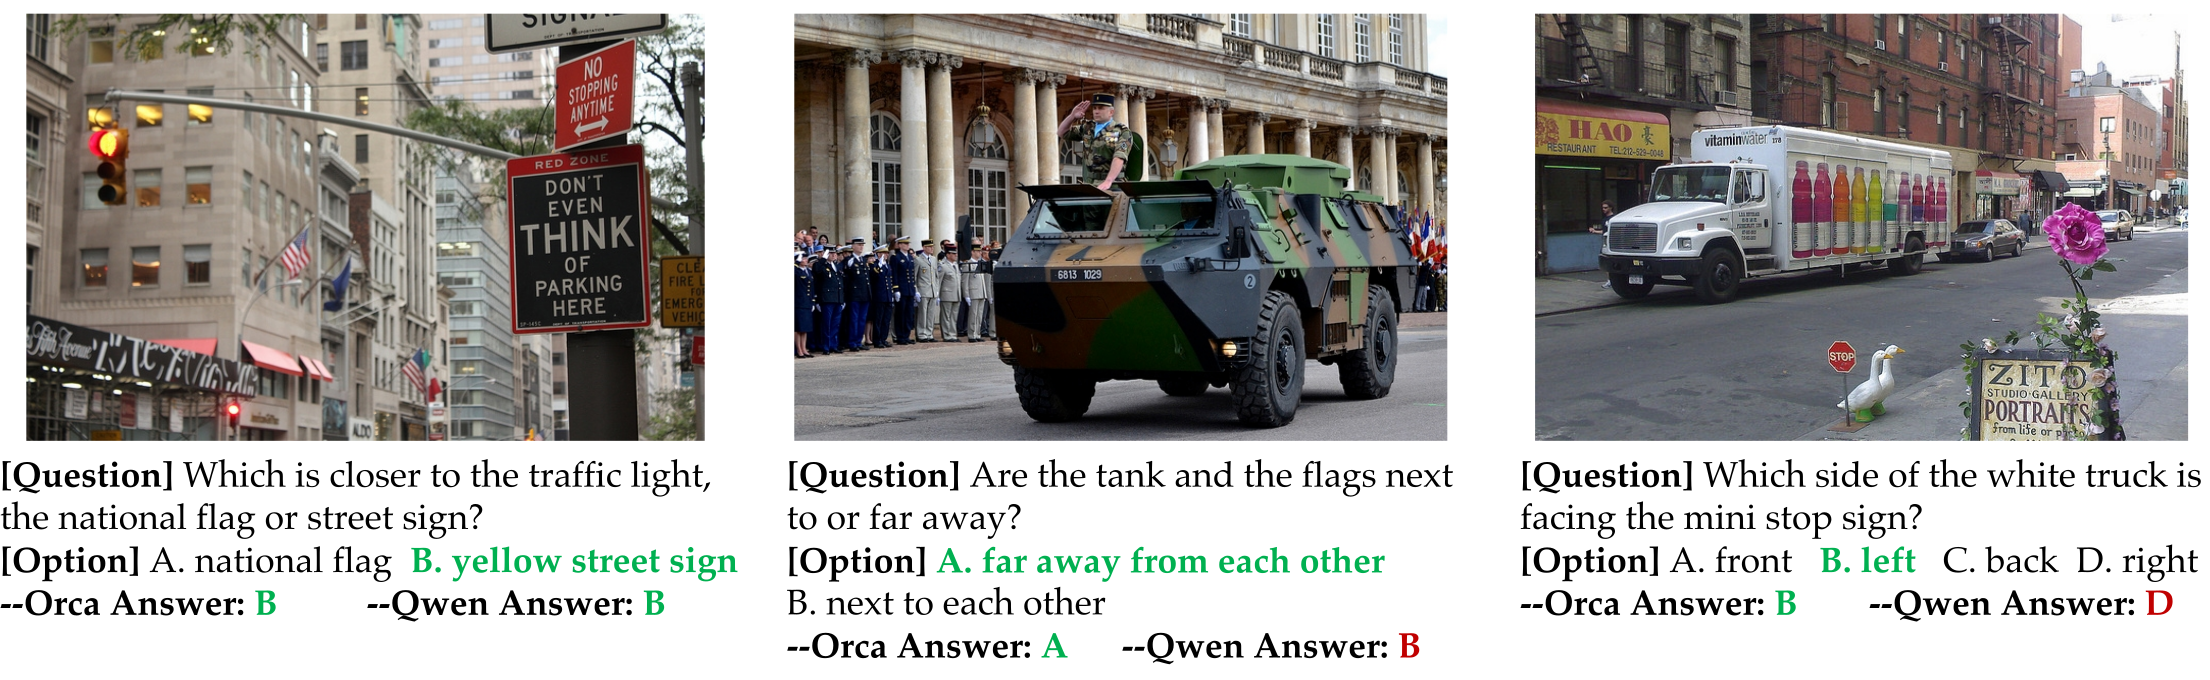
Figures F1–F5 retain every video strip, question, option and model answer for transition, commonsense, motion and spatial examples. They include ties and mistakes as well as improvements. In Figure F4’s orbital-motion example, the marked correct option is C while Orca answers A and Qwen B; the qualitative gallery therefore should not be read as uniformly correct reasoning.