Overview
This edition covers the complete 52-page v4, including every prompt, task card and qualitative reconstruction table. The PDF front matter is dated 25 June 2026; its arXiv version stamp is 5 August 2026. The pipeline supports automatic reconstruction, but the reported robotics scenes were interactively refined after automatic generation.
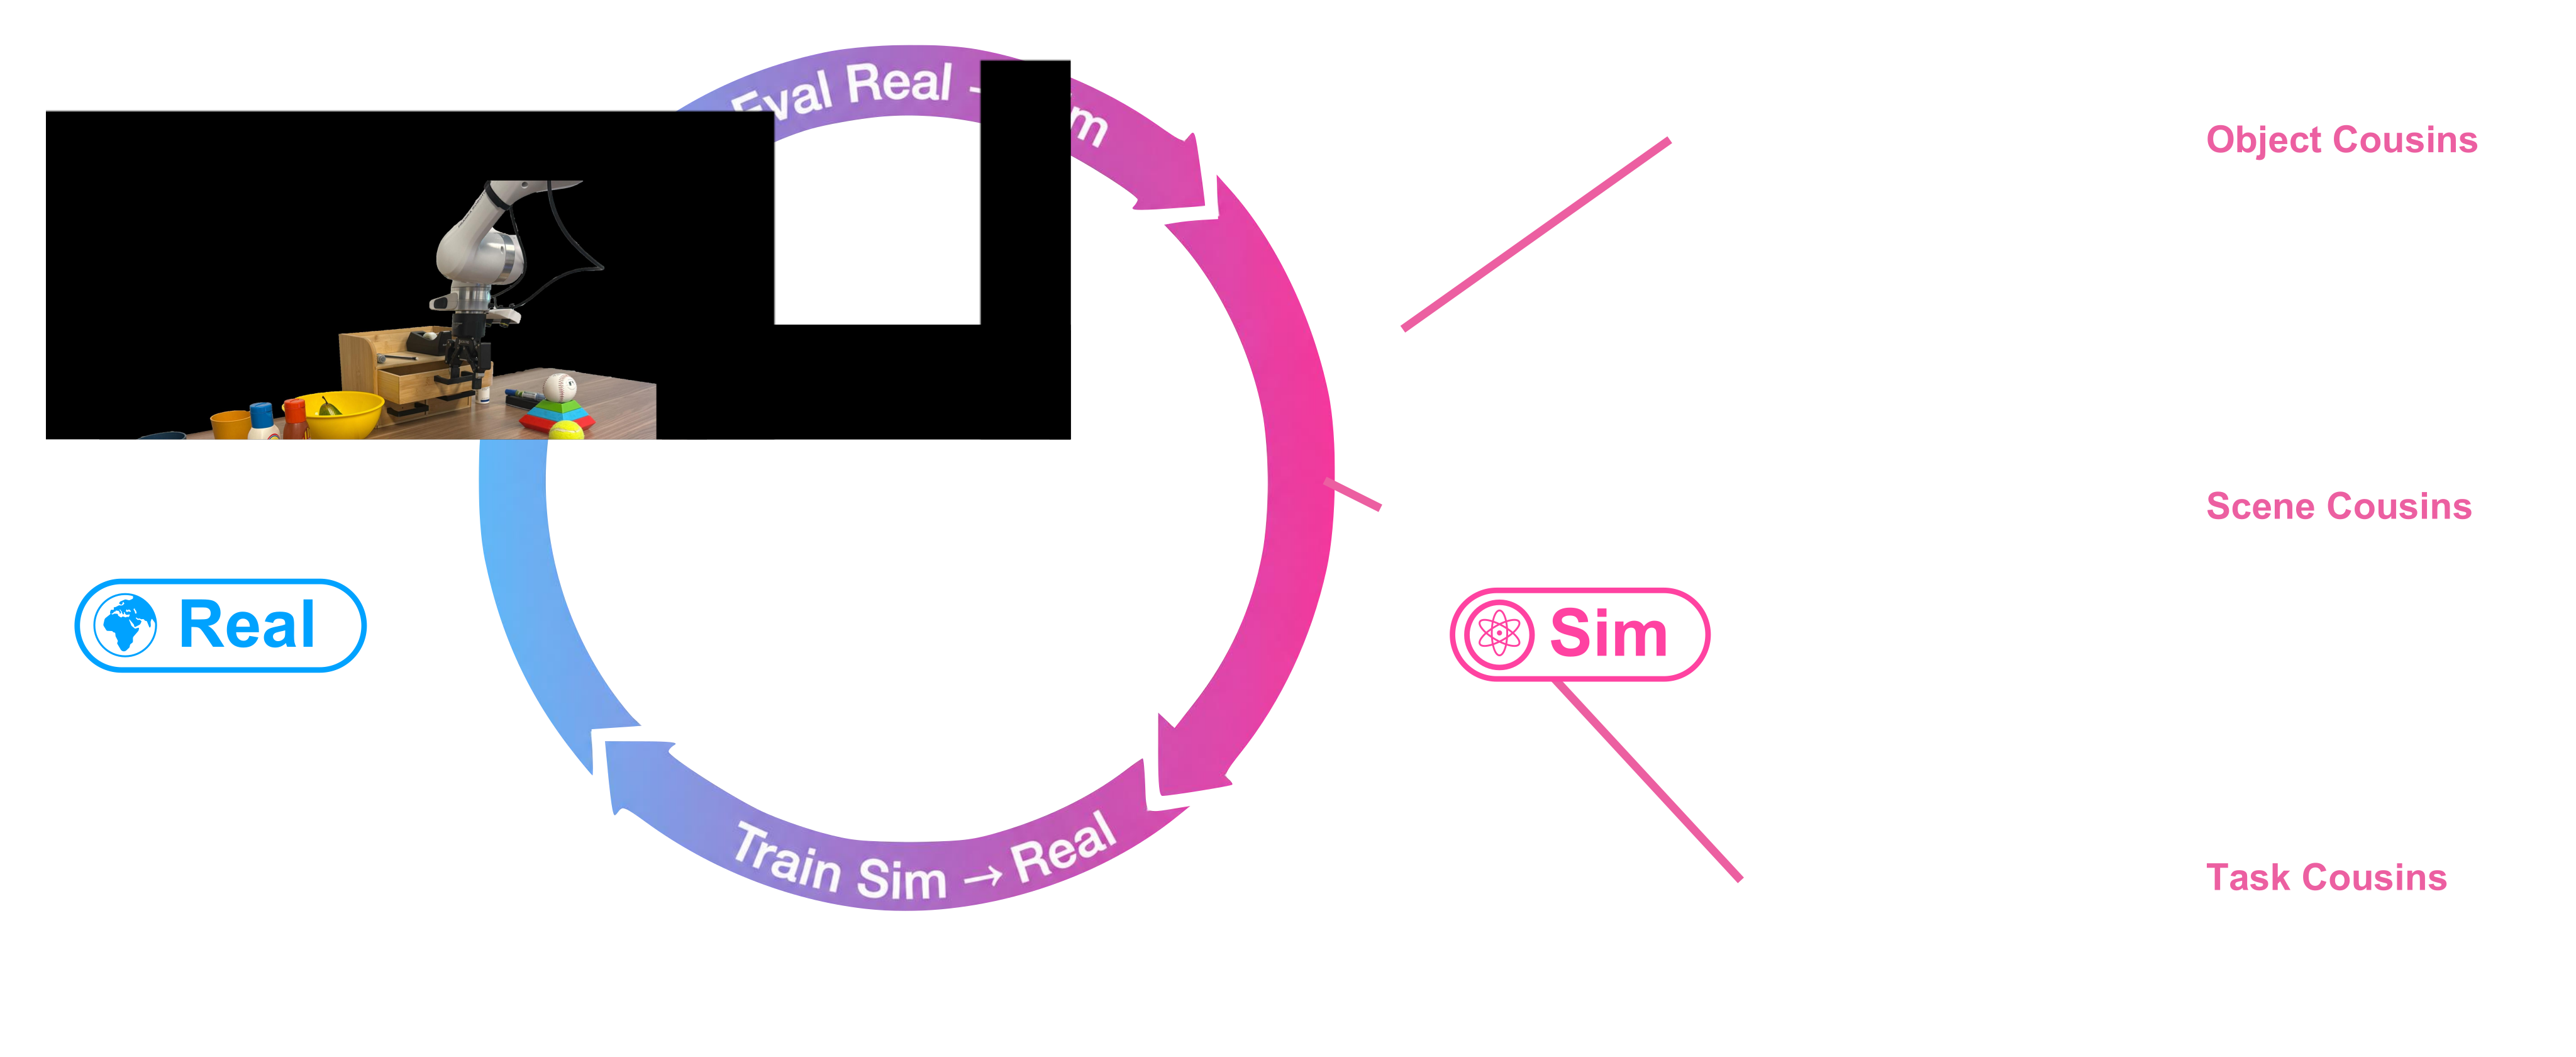
At a glance
SimFoundry reconstructs interactive objects and scenes from a video, then varies object instances, spatial layouts and task goals to generate training environments. Across seven policy-evaluation tasks it reports mean Pearson correlation .911 and mean maximum rank violation .018 between simulated and real performance. Simulation demonstrations can also train policies that transfer to physical robots. Reported gains depend on the particular tasks, training mix, human refinement and checkpoint-selection protocol.
1 Introduction
Real-world demonstrations and systematic robot evaluation are expensive; simulation helps only if scene construction is practical and the resulting geometry, appearance and dynamics support meaningful interaction. SimFoundry combines reconstruction, controlled variation, demonstration generation and evaluation in one modular pipeline. A digital twin approximates the captured scene; digital cousins preserve relevant affordances while changing objects, layouts or tasks. Its studies span articulated objects, multi-step tasks and bimanual manipulation, with separate geometric-fidelity and policy-performance evaluations.
2 Related Work
The system composes image-to-mesh generation, segmentation, depth estimation, pose alignment and articulation tools. Its distinction is the complete evaluation-and-training workflow plus several kinds of scene variation; Table 1 preserves the authors’ comparison with prior systems. Automated digital-cousin generation motivates object diversity, while PolaRiS is the main simulation-evaluation baseline. Detailed related-work distinctions remain in Appendix D.
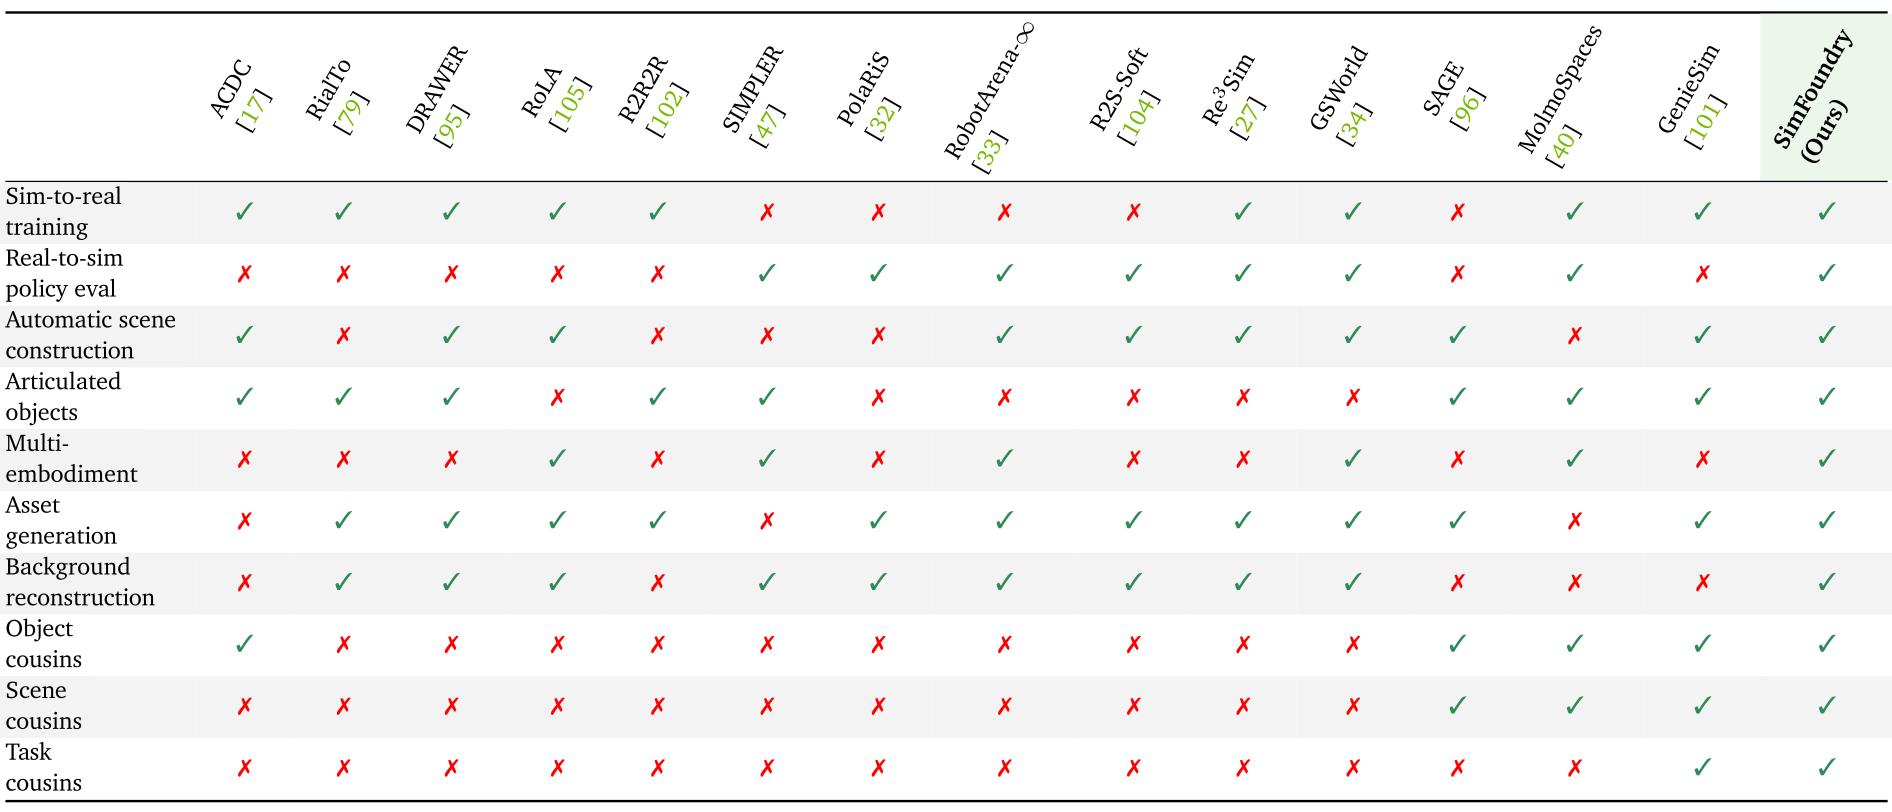
Selectable original table labels and values
|
RialTo
[79]
|
RoLA
[105]
|
PolaRiS
[32]
|
RobotArena-
[33]
|
Re3Sim
[27]
|
GSWorld
[34]
|
MolmoSpaces
[40]
|
GenieSim
[101]
|
SimFoundry
(Ours)
| |||||||
|
Sim-to-real
training
|
✓ | ✓ | ✓ | ✓ | ✓ | ✗ | ✗ | ✗ | ✗ | ✓ | ✓ | ✗ | ✓ | ✓ | ✓ |
|
Real-to-sim
policy eval
|
✗ | ✗ | ✗ | ✗ | ✗ | ✓ | ✓ | ✓ | ✓ | ✓ | ✓ | ✗ | ✓ | ✗ | ✓ |
|
Automatic scene
construction
|
✓ | ✗ | ✓ | ✓ | ✗ | ✗ | ✗ | ✓ | ✓ | ✓ | ✓ | ✓ | ✗ | ✓ | ✓ |
|
Articulated
objects
|
✓ | ✓ | ✓ | ✗ | ✓ | ✓ | ✗ | ✗ | ✗ | ✗ | ✗ | ✓ | ✓ | ✓ | ✓ |
|
Multi-
embodiment
|
✗ | ✗ | ✗ | ✓ | ✗ | ✓ | ✗ | ✓ | ✗ | ✗ | ✓ | ✗ | ✓ | ✗ | ✓ |
|
Asset
generation
|
✗ | ✓ | ✓ | ✓ | ✓ | ✗ | ✓ | ✓ | ✓ | ✓ | ✓ | ✓ | ✗ | ✓ | ✓ |
|
Background
reconstruction
|
✗ | ✓ | ✓ | ✓ | ✗ | ✓ | ✓ | ✓ | ✓ | ✓ | ✓ | ✗ | ✗ | ✗ | ✓ |
|
Object
cousins
|
✓ | ✗ | ✗ | ✗ | ✗ | ✗ | ✗ | ✗ | ✗ | ✗ | ✗ | ✓ | ✓ | ✓ | ✓ |
|
Scene
cousins
|
✗ | ✗ | ✗ | ✗ | ✗ | ✗ | ✗ | ✗ | ✗ | ✗ | ✗ | ✓ | ✓ | ✓ | ✓ |
|
Task
cousins
|
✗ | ✗ | ✗ | ✗ | ✗ | ✗ | ✗ | ✗ | ✗ | ✗ | ✗ | ✗ | ✗ | ✓ | ✓ |
3 Preliminaries
Real-to-sim evaluation runs existing policies in reconstructed scenes; sim-to-real training generates demonstrations there before physical deployment. End-to-end success requires every task criterion, while Pearson correlation measures linear agreement across policies and mean maximum rank violation measures the magnitude of ranking errors. MimicGen expands a small set of human demonstrations by transforming and joining subtask trajectories.
Equation
4 SimFoundry: A modular, automated real-to-sim generation pipeline
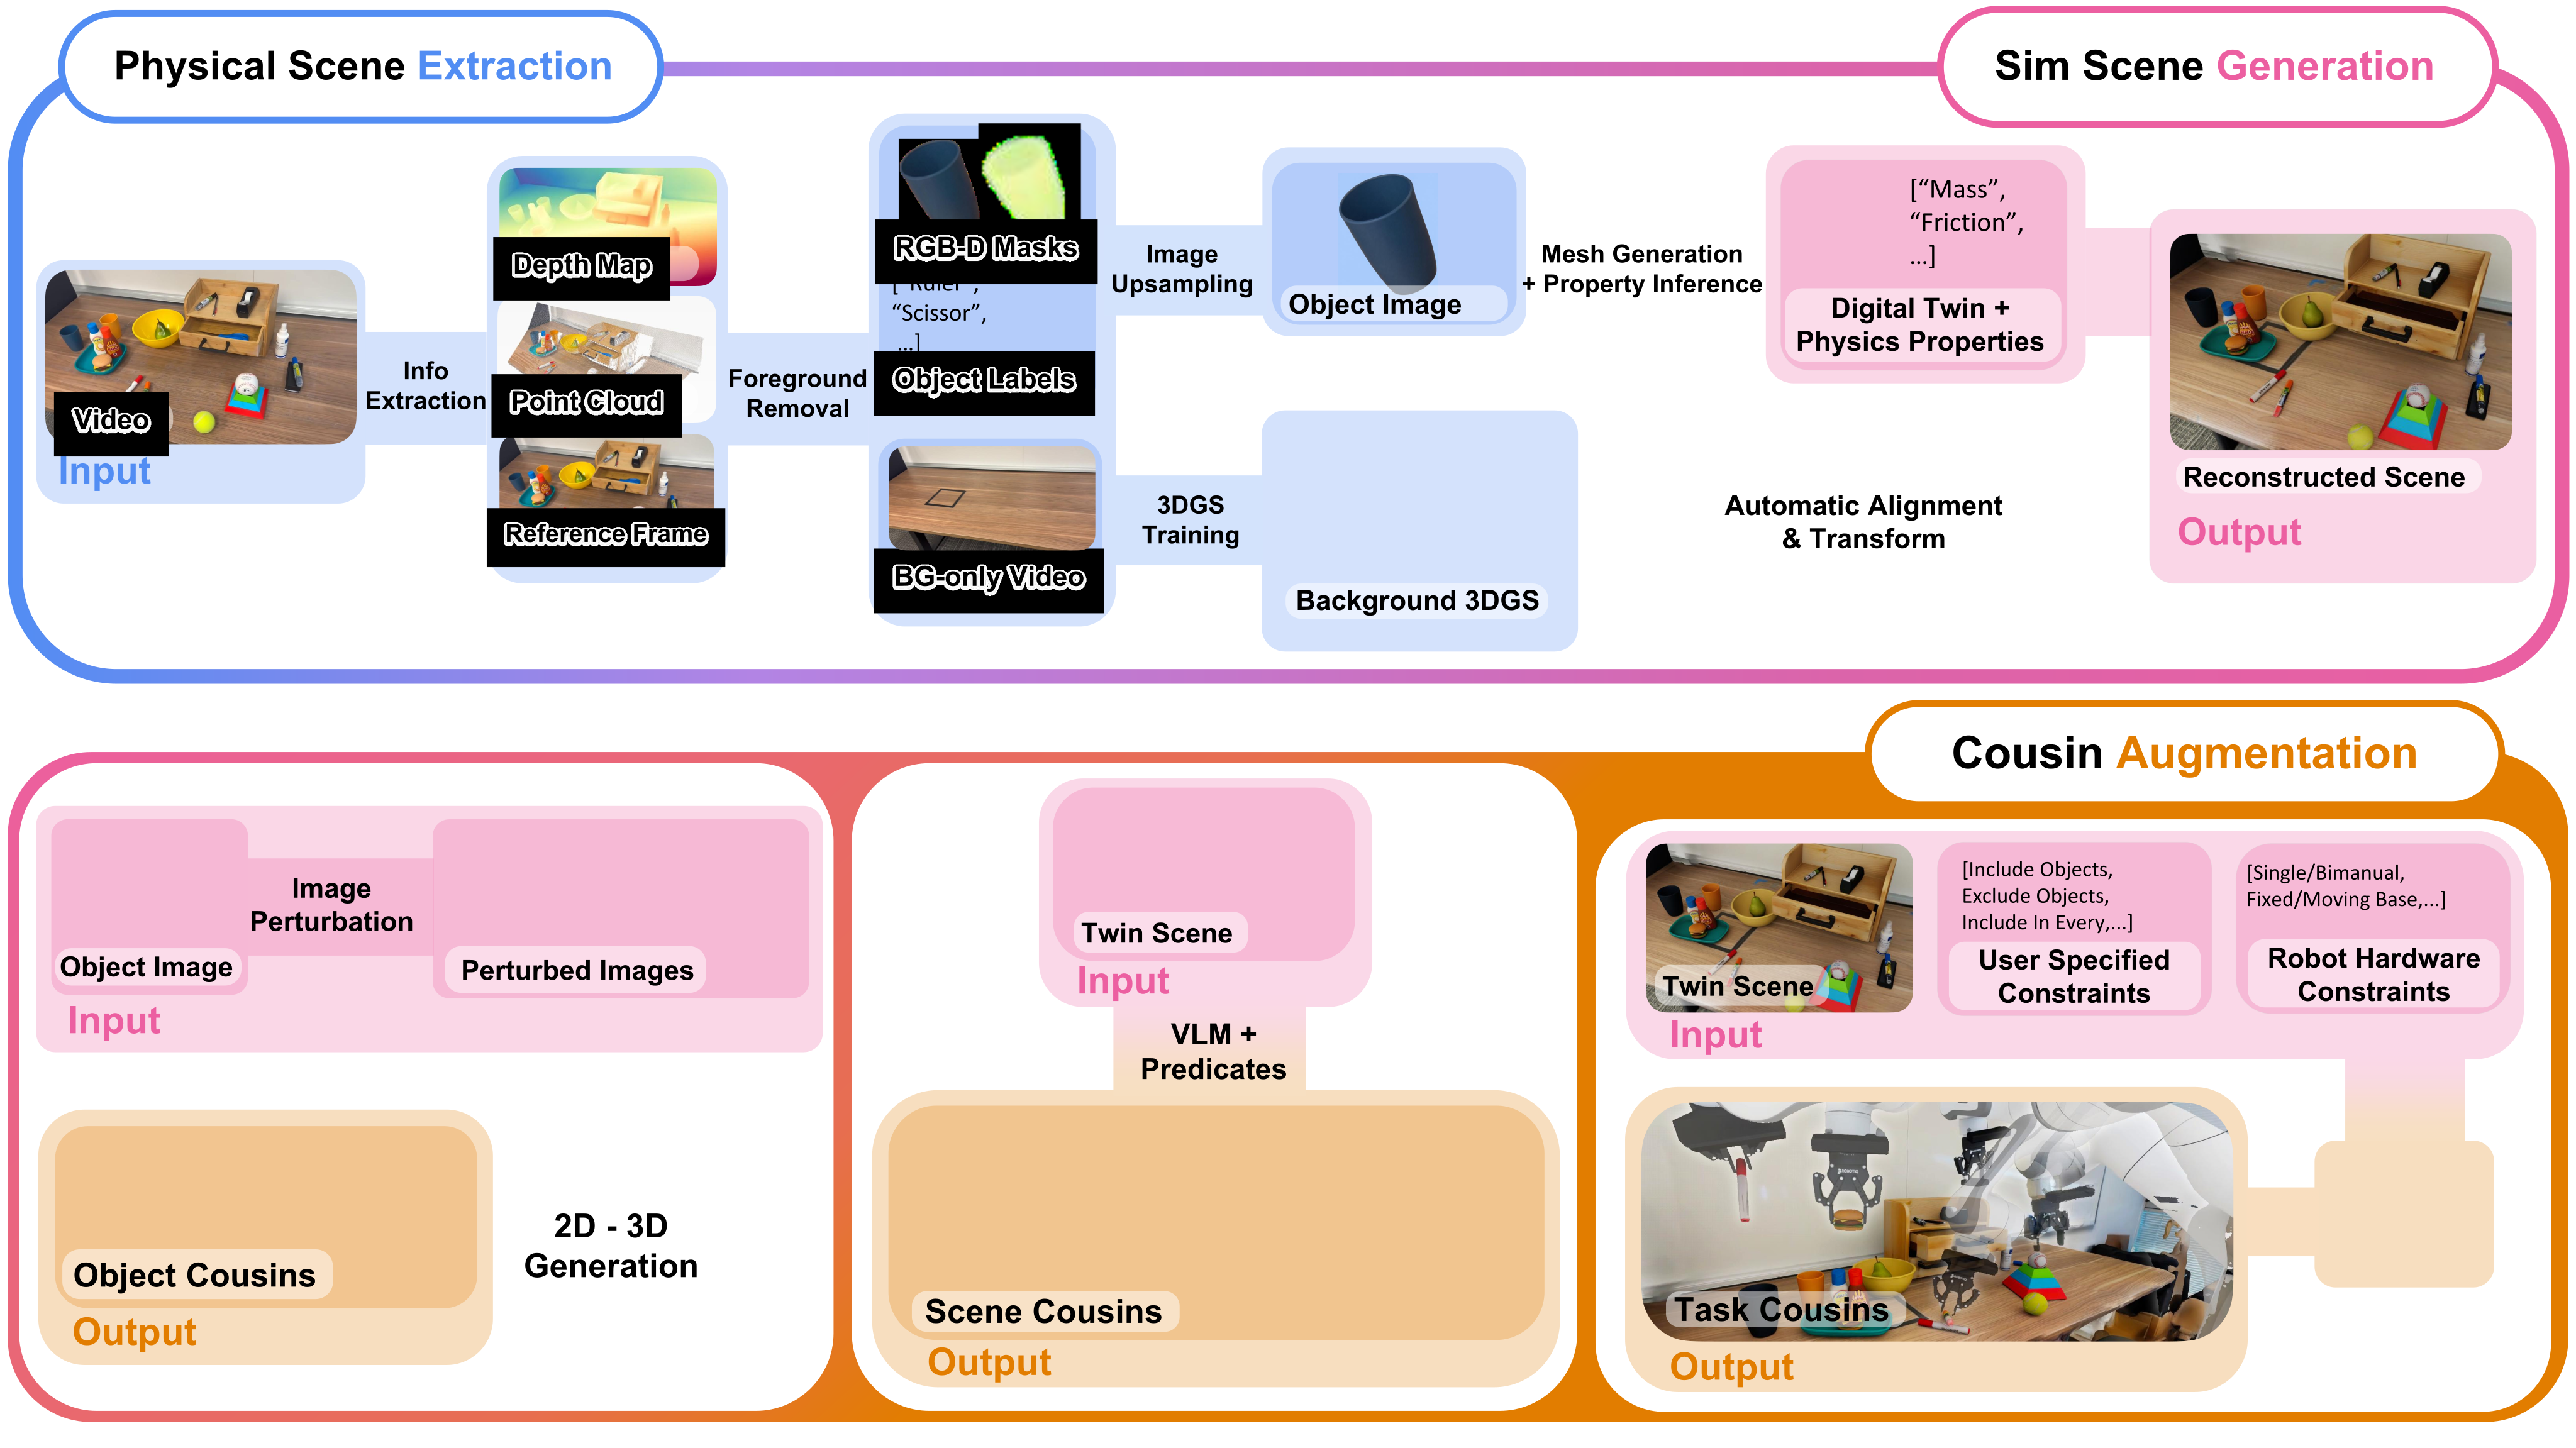
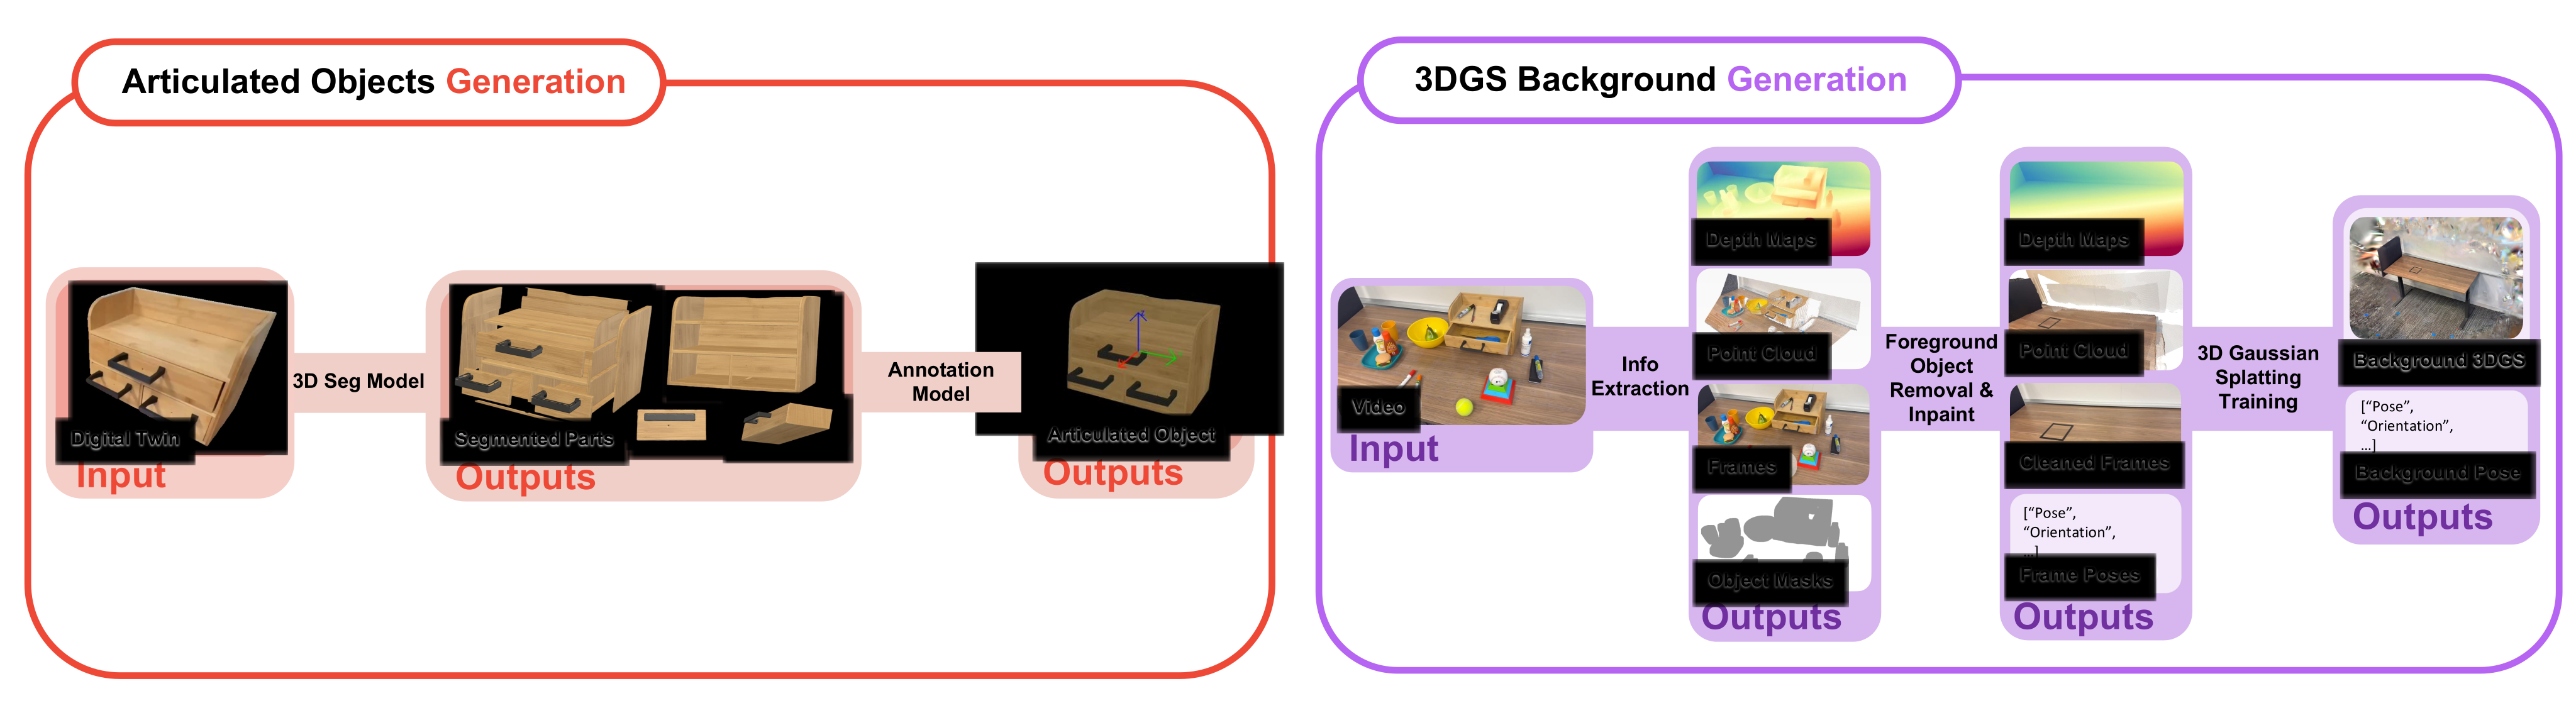
Extraction chooses a representative RGB frame, estimates depth and camera intrinsics, fits a ground frame, then repeatedly segments and inpaints foreground objects. Generation upsamples object crops, produces meshes, estimates pose/scale, infers articulation, creates collision geometry and assigns physical properties before settling objects in simulation. Augmentation creates affordance-preserving object variants, semantic layout changes and new predicate-defined tasks. These categories may be combined rather than being disjoint. Static backgrounds can use automatically inpainted Gaussian splats, a separate clean capture with manual alignment, or mesh scans; the robotics experiments use mesh backgrounds in some cases.
5 Experiments
The evaluation covers DROID’s single-arm platform and a YAM bimanual workcell. It separates prediction of real policy performance, training from simulation demonstrations, and reconstruction quality/throughput.
5.1 Real-to-Sim Policy Evaluation
Existing real-world policies are tested in simulation without adaptation to either simulation framework. This does not mean every policy is unfinetuned: difficult-task policies have already received real task demonstrations.
Setup.
Five pretrained policy types—π0, π0.5, GR00T N1.6/N1.7 and DreamZero—are tested on four easier tasks. Three policy types are separately finetuned on fifty real demonstrations per task for three harder tasks. The different task groups avoid uniformly zero outcomes; they are not a common seven-task evaluation of all five models.
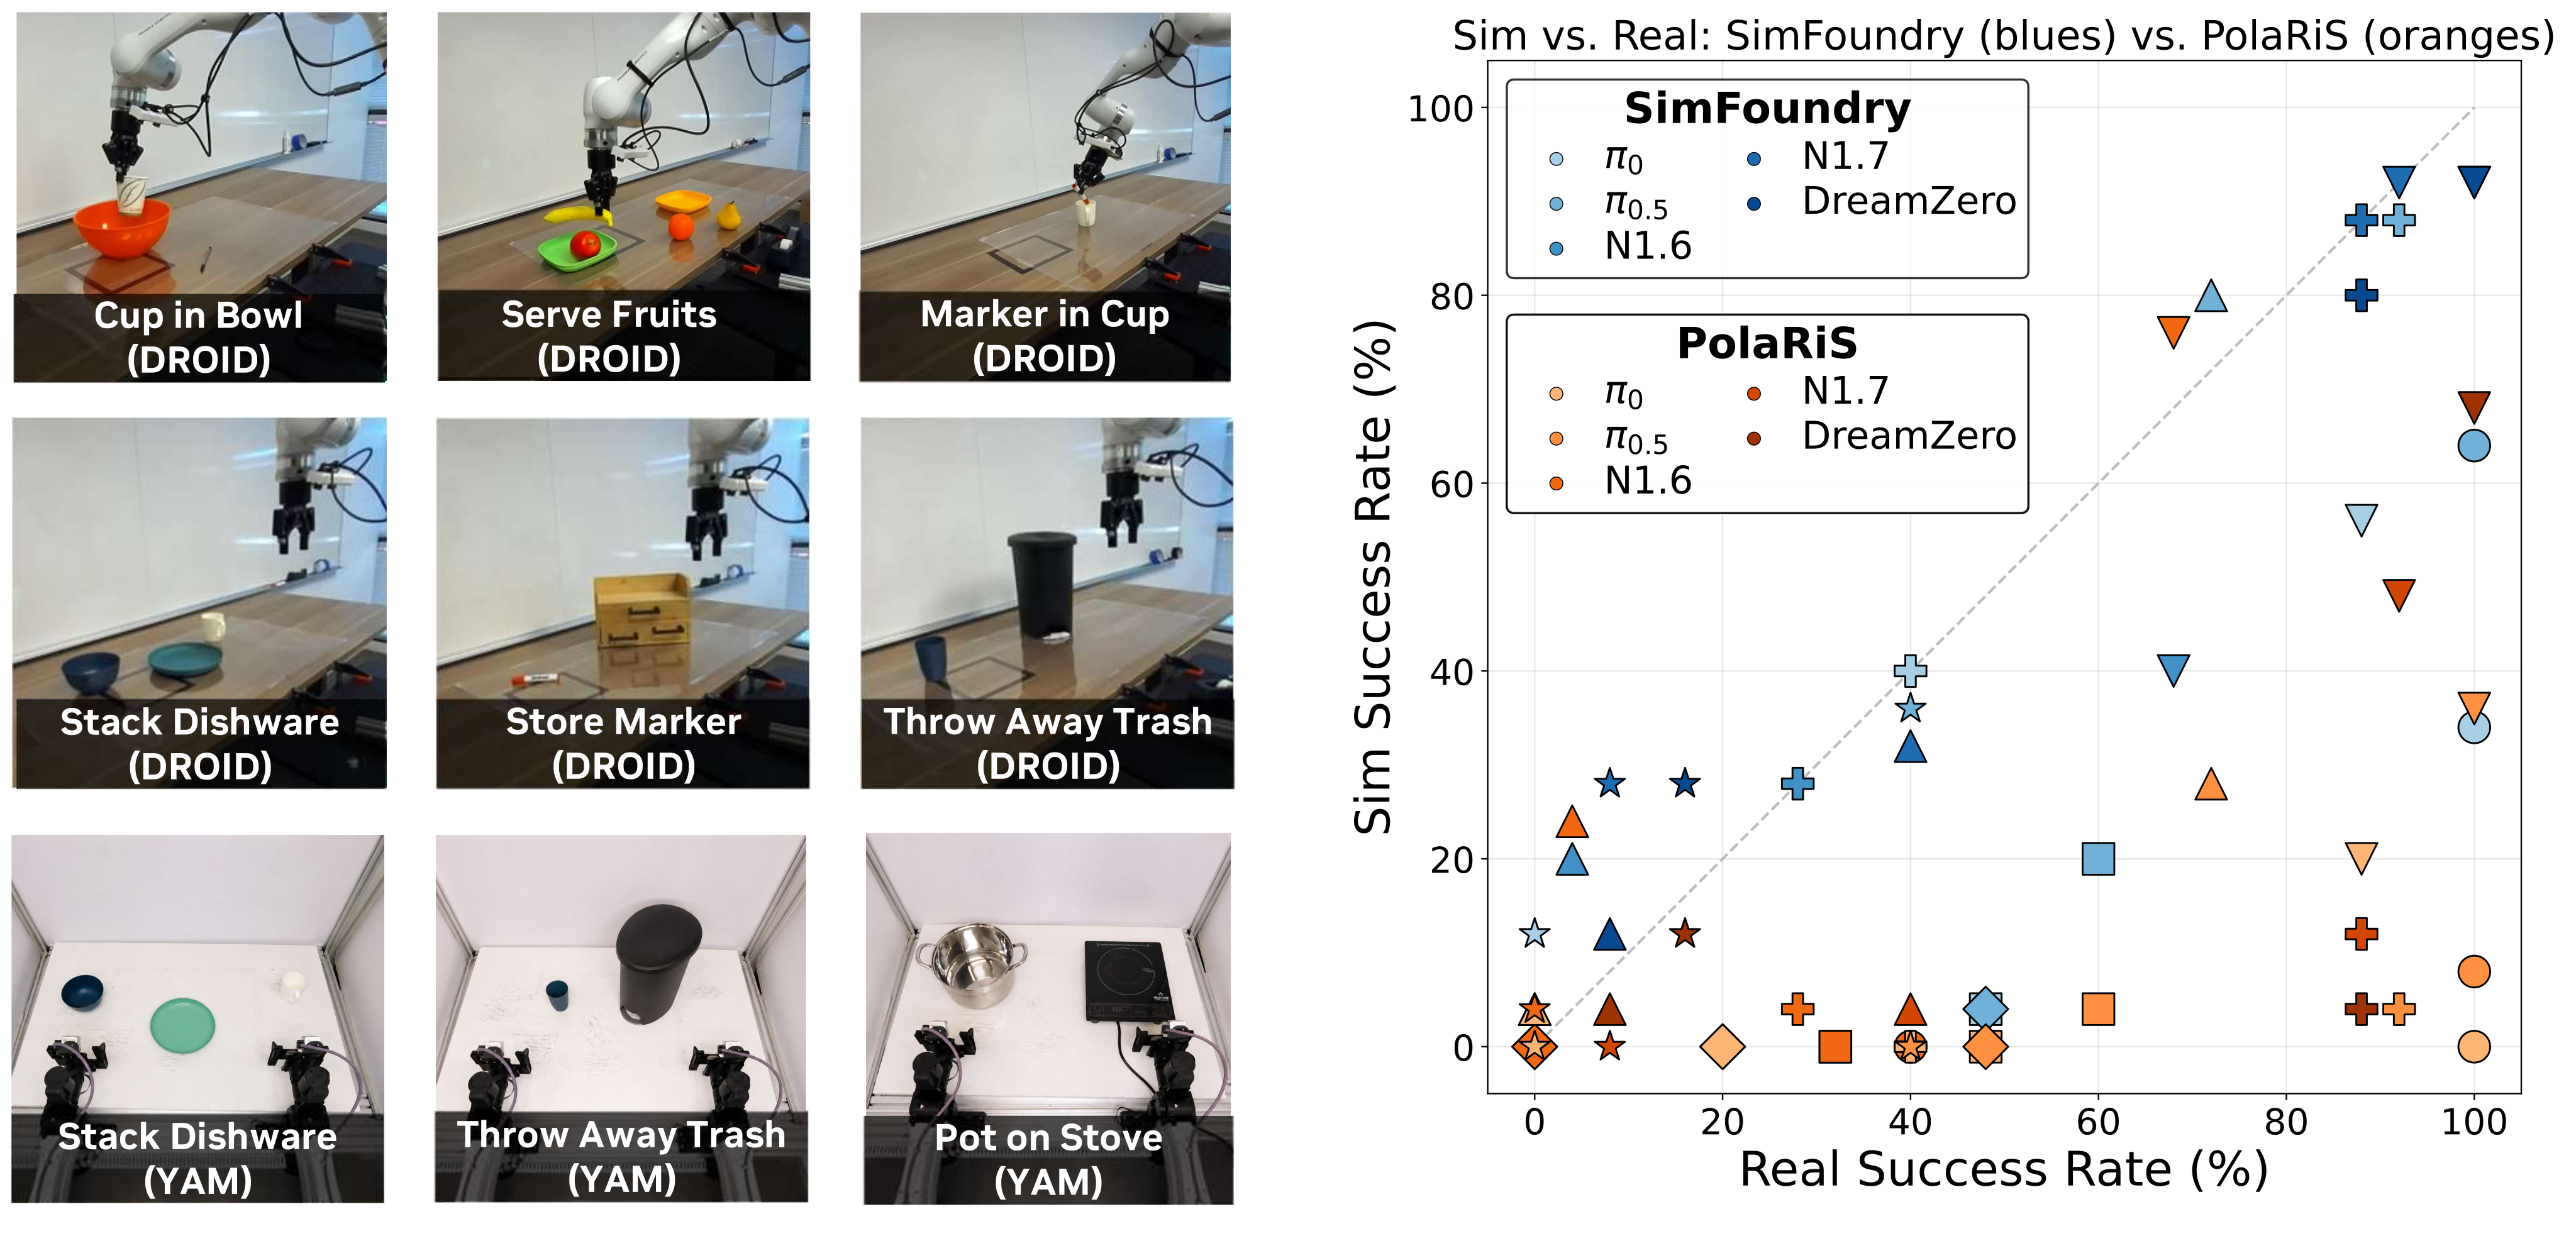
SimFoundry scene evaluations strongly correlate with real-world performance across diverse policies.
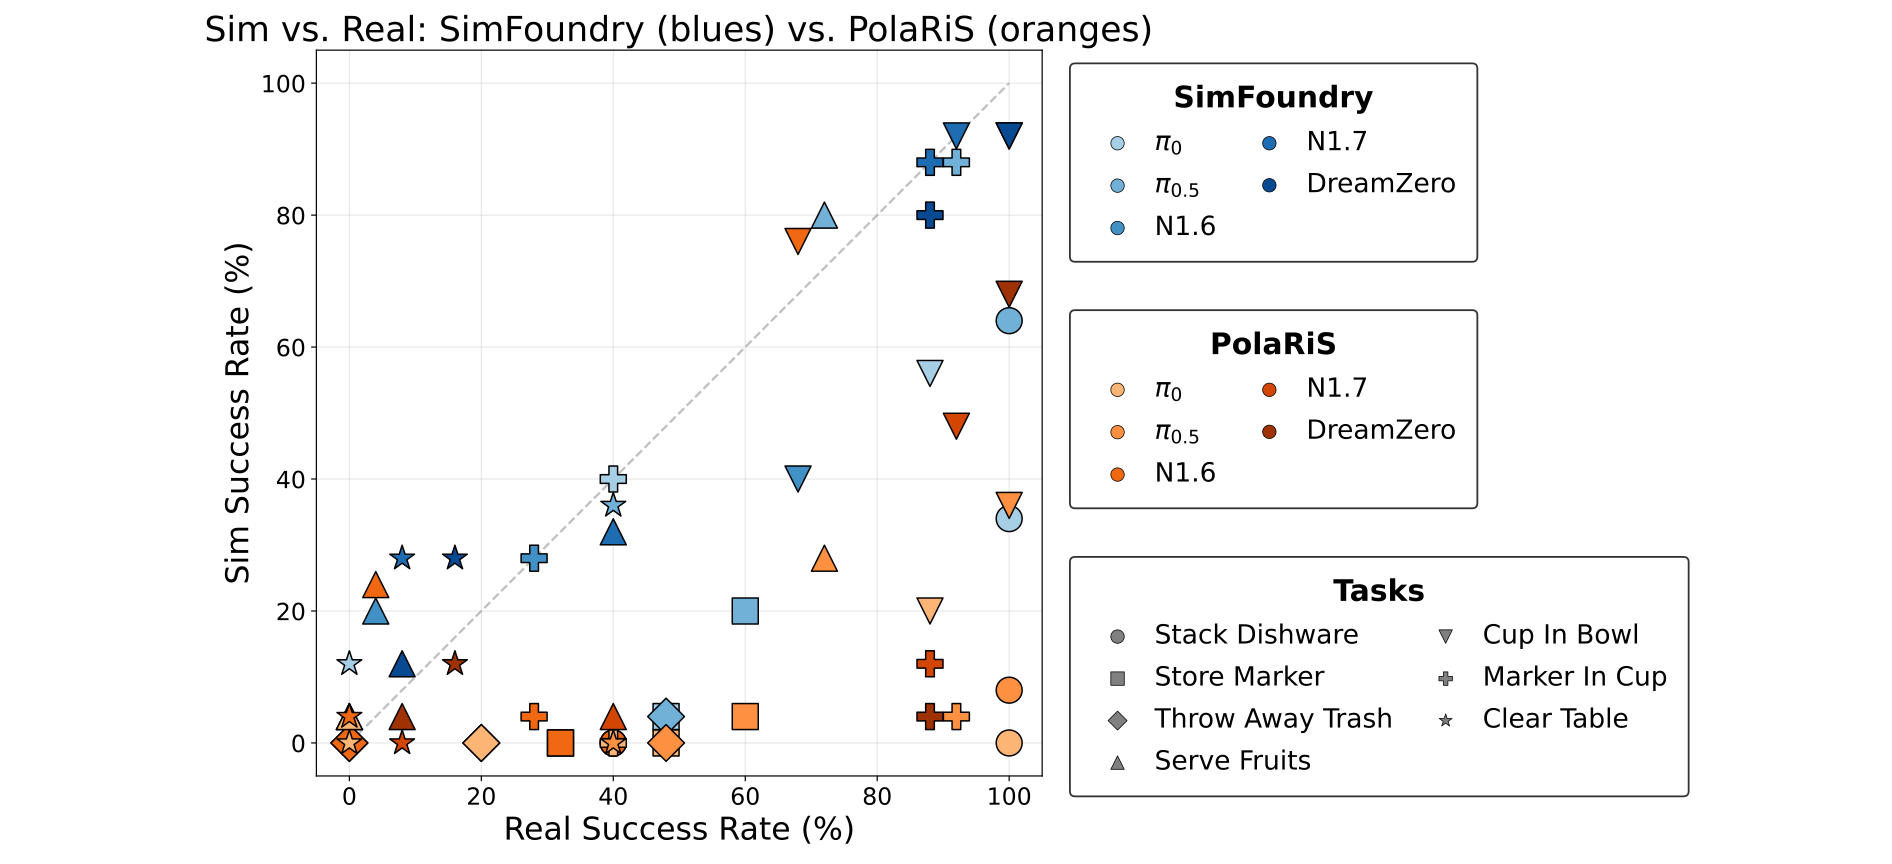
SimFoundry reports mean per-task Pearson correlation .911 and mean maximum rank violation .018. Table G.1 retains every real/sim score and unevaluated cell. Correlation indicates useful relative agreement across the evaluated policies; it is not a guarantee of matching absolute success on new policies or tasks.
Sub-task evaluations improve correlations, especially on multi-step tasks.
For the harder finetuned tasks, starting simulations with early subtasks completed raises mean correlation from .902 to .951. These residual-task simulated successes are compared with full real-world task successes, so this is a changed evaluation protocol rather than improved end-to-end scene fidelity under the same initial states.
SimFoundry outperforms state-of-the-art simulation evaluation frameworks and makes fewer assumptions.
Under zero-shot simulation evaluation, SimFoundry’s mean Pearson score exceeds PolaRiS by over .59. PolaRiS benefits from shallow simulation finetuning, but its adapted checkpoint is intentionally excluded because the comparison targets existing policies without simulator-specific adaptation.
5.2 Sim-to-Real Policy Training
Training studies distinguish simulation-only task adaptation, combined real/simulation demonstrations, and multi-task transfer. Pretrained DROID models retain their earlier real-world training even when task-specific finetuning uses only simulation.
Policies trained on SimFoundry-generated data transfer zero-shot to the real world.
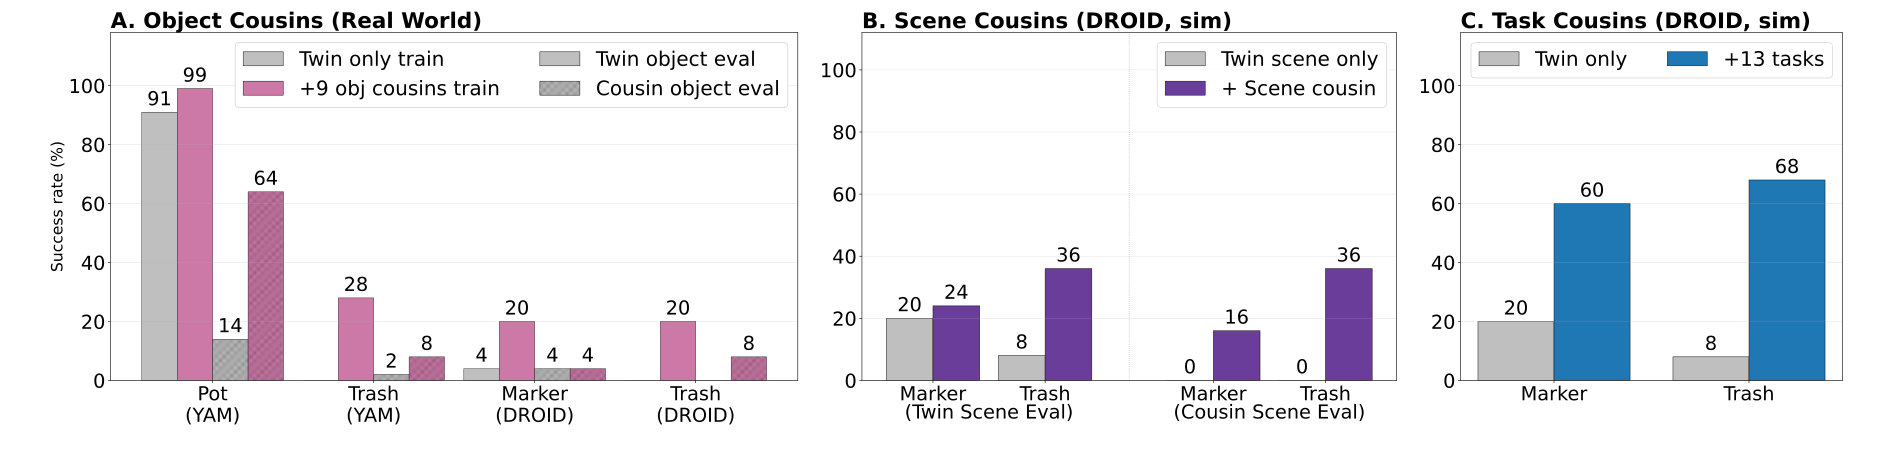
Simulation-only training reaches 99% on YAM Pot on Stove and 100% on DROID Stack Dishware in the reported settings. YAM uses a flow-matching policy trained from scratch; DROID finetunes a π0.5 checkpoint already pretrained on real DROID data. Full per-object and held-out-instance results remain in Table G.4.
Co-training with sim and real data further improves performance.
Adding limited real demonstrations improves most DROID settings: π0.5 Store Marker rises from 60% to 92% real success, and π0 Throw Away Trash gains 36 percentage points in simulation. Table G.7 also retains exceptions, including a simulated Stack Dishware decline for π0.
Object cousins improve robustness to unseen objects.
Object cousins vary shape, appearance and topology while aiming to retain function. Gains include fifty percentage points on held-out real Pot on Stove objects and up to twenty points for DROID Throw Away Trash. Held-out object and original-object performance are reported separately.
Scene cousins improve layout generalization.
Scene cousins change semantic spatial relations. They improve simulated Throw Away Trash by 28 points in the twin scene and allow 16% Store Marker success on cousin layouts versus zero without scene variation. These particular scene-cousin results are simulation results.
Multi-Task Sim-to-Real and Task Generalization.
One reconstructed cluttered scene yields thirteen generated-data tasks and seven held-out tasks. A single policy is finetuned on the generated multi-task demonstrations and evaluated in both simulation and reality; Table 2 preserves checkpoint-specific outcomes.
SimFoundry can train generalist policies and task cousins improve few-shot downstream learning.
Multi-task training improves seen-task performance over the base DROID checkpoint by up to 31 points in simulation and eighteen in reality. π0.5-FT reaches 29% on held-out real tasks. At fixed total demonstration count, thirteen related task cousins raise simulated Throw Away Trash by sixty points and Store Marker by forty; these gains should not be described as measured real-world improvements.
5.3 System Analysis
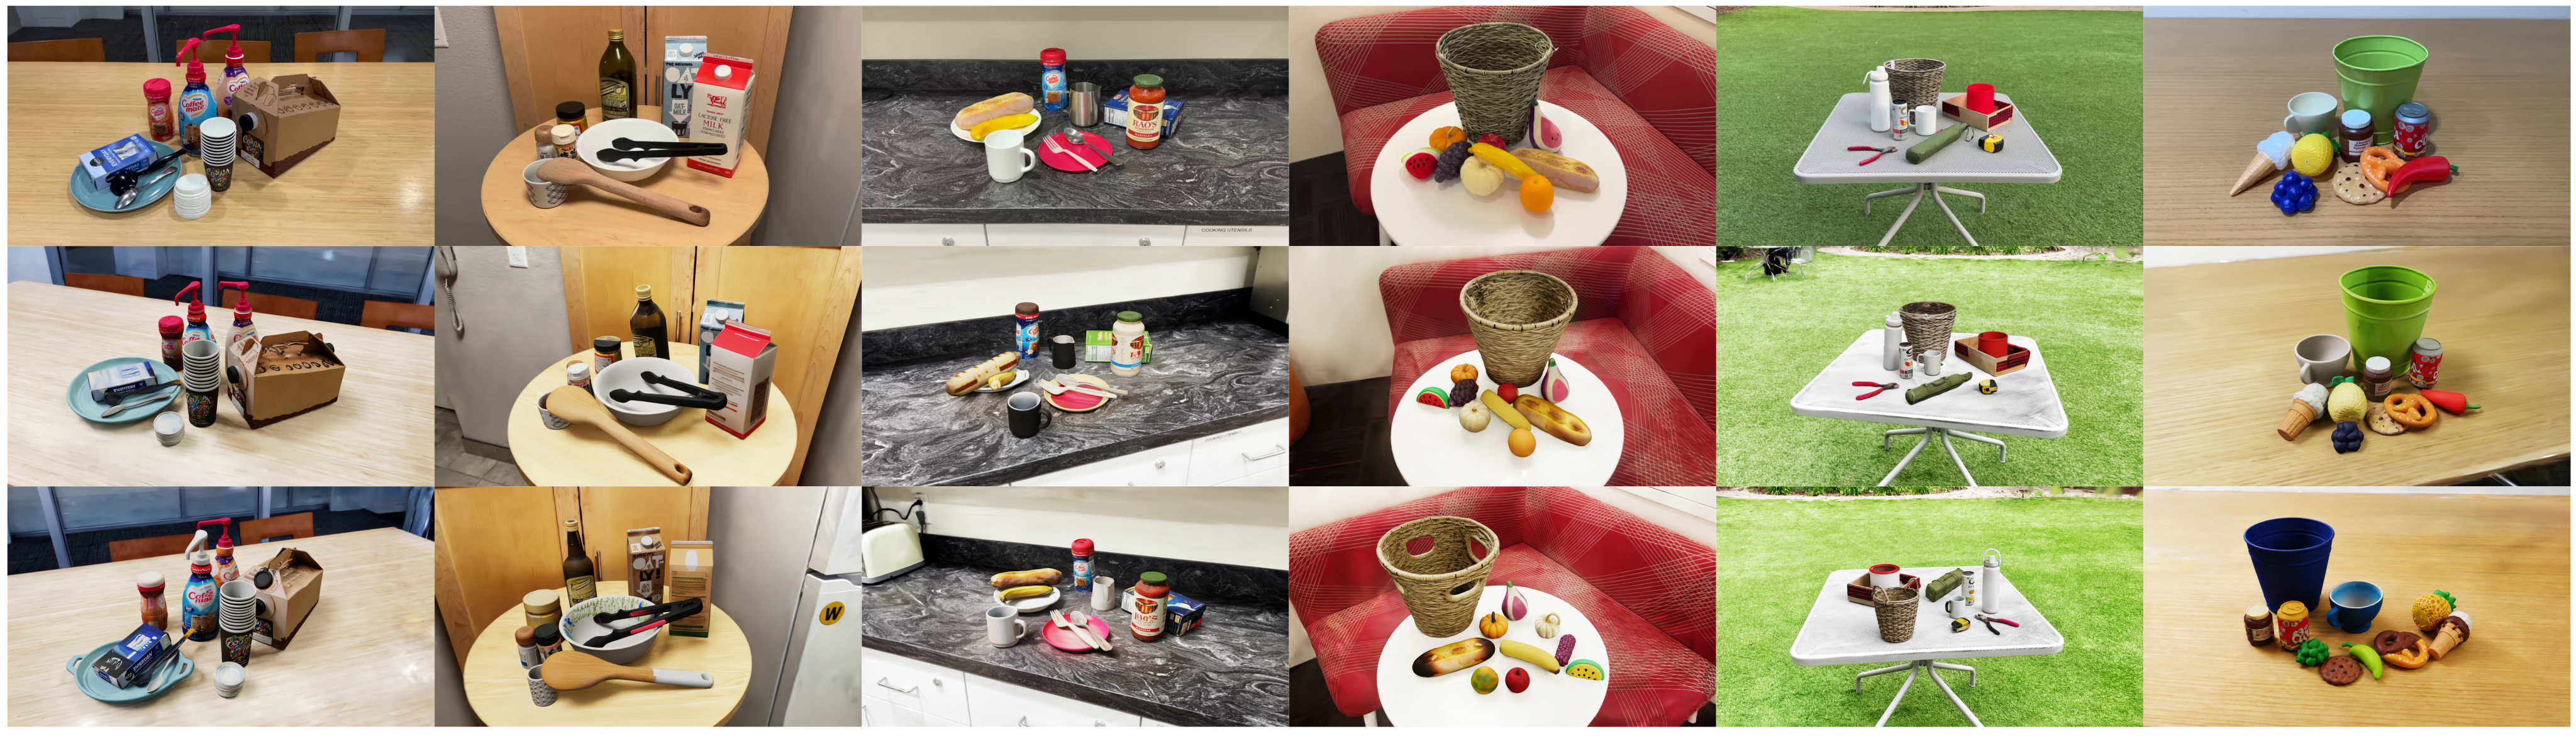
Across twelve staged scenes, automatic reconstruction achieves F1 .81–.92 versus SAM3D .66–.71 at a one-centimeter threshold. About three minutes of per-object manual tuning raises F1 to .93–.99. The roughly five-minute-per-object foreground reconstruction average excludes the separate approximately ninety-minute automatic background-inpainting cost.
6 Limitations
The system inherits failures and nondeterminism of its component models, and its settling procedure assumes a single flat tabletop. Appendix C adds depth/scale error, difficult articulation segmentation, background hallucinations and rendering trade-offs.
7 Conclusion
The experiments support reconstructed simulation as a useful environment for ranking existing policies and generating training data. Object, layout and task diversity address different transfer limitations, but the evidence remains tied to the tested robot/task settings, manual scene refinement and selected checkpoints.
8 Acknowledgments
The acknowledgments credit data collection, policy evaluation, hardware support and feedback. Nadun Ranawaka is partially supported by Georgia Tech’s Agricultural Technology Research Program.
Appendix
The complete appendix is retained below, covering reconstruction, augmentation, protocols, policy settings, human intervention and quantitative/qualitative analysis.
Appendix A Overview
Appendices B–L cover FAQs and limits, extended related work, scene generation, digital cousins, detailed results, policy training, robot/task definitions, evaluation, manual editing and system analysis.
Appendix B FAQ
The FAQ confirms that robotics scenes were automatically generated and then manually refined for a few minutes. Physics settling can move estimated objects. Transparency support depends on the mesh generator: Hunyuan 2.1 lacks it, whereas TRELLIS.2 supports it. Base DROID checkpoints score zero on Store Marker and Throw Away Trash but 48–52% on Stack Dishware, so task data adds value beyond pretraining. Main success is binary completion of all criteria, rather than a partial-credit normalized reward.
Appendix C Limitations
Remote VLMs can produce inconsistent inpainting and duplicated or degenerate objects. Monocular depth limits metric scale/shape; articulation depends on reliable segmentation of visible and internal surfaces. Settling assumes a flat support plane. Automatic background inpainting takes about ninety minutes per scene on one GPU and may hallucinate surfaces. Some robotics experiments instead use mesh backgrounds because Gaussian splats suffer near-field clipping and rendering latency.
Appendix D Full Related Work
The expanded discussion distinguishes physically simulated policy learning/evaluation from rendering-only scene reconstruction.
D.1 Real–to–Sim for Simulation Environment Creation and Applications
Prior real-to-sim work is grouped by downstream application and physical modeling requirements.
Real–to–sim–to–real manipulation.
Real-to-sim-to-real manipulation reconstructs scenes for robot training, often with rigid objects and simple pick/place tasks. SimFoundry targets articulated, bimanual and multi-step settings and adds object, scene and task variants to escape a single static twin.
Real–to–sim–to–real for navigation and locomotion.
Navigation and locomotion also use reconstructed environments, but their contact and control demands differ from the manipulation settings evaluated here.
Real–to–sim policy evaluation.
Several simulation-evaluation systems correlate with real performance without demonstrating that their data trains physical agents. The authors position SimFoundry as supporting both uses and general articulated-object tasks; this is their comparison of the cited methods.
Real–to–render.
Rendering-only methods avoid physical simulation, which limits their direct use for contact-sensitive manipulation. SimFoundry models physical interactions and expands each reconstructed scene with controlled variants.
D.2 Imitation Learning from Human Demonstrations and Synthetic Data Generation.
Teleoperation plus behavior cloning scales through large human data-collection efforts. Synthetic generation tools can transform a few demonstrations into many trajectories with broader scene coverage. SimFoundry supplies reconstructed environments and variations for that process, while still requiring initial human demonstrations.
Appendix E Scene Reconstruction
Scene reconstruction separates foreground extraction/generation, articulation, physical settling and background registration.
E.1 Extraction Details
The extraction loop turns the representative image into a metric point cloud, isolates foreground RGB-D crops and masks, and inpaints removed objects before searching the residual scene. Occluded geometry remains inferred rather than directly measured.
Representative Frame Selection
The current default is frame zero. Users should begin filming from a clear, broadly front-facing view of the whole scene with minimal occlusion; there is no automatic best-frame search in this implementation.
E.2 Foundation Model Details
Default modules are DepthAnything3 for monocular/video depth, FoundationStereo for stereo, SAM3 for image masks, Gemini-Pro-3 for reasoning/articulation, Gemini-Pro-3-Image-Preview for editing, PriorDepthAnything for depth inpainting, Hunyuan2.1 or TRELLIS.2 for meshes, FoundationPose for pose refinement, and P3-SAM for mesh segmentation. SAM2 propagates video masks and VOID performs two-pass video inpainting. Segment Any Mesh and Partfield are alternative mesh segmenters.
E.3 Articulated Object Generation
The articulation module builds on Articulate Anymesh and Articulate Anything to turn a static generated mesh into linked parts and joints.
Segmentation
A VLM identifies movable semantic parts and joint types from multiple views. Mesh segmentation labels faces; adjacency majority voting fills unlabeled internal faces. Colored segment renderings let the VLM merge oversegmented pieces into semantic parts. Users can refine segmentation/assignments through the GUI.
Joint Generation
A VLM writes calls to a part-relative joint-placement API, which compiles to URDF. The simulator animates the proposed joints, and a separate critic rates movement and proposes corrections. Iteration stops after the critic exceeds a threshold; plausibility judgments are model-based, not measured physical identification.
Physical Parameters
The VLM estimates link mass, joint friction and damping using part and object volumes as context. These parameters are inferred from visual/semantic information.
E.4 Object Depenetration and Physical Stability
CoACD produces collision meshes. PyBullet steps the assembled scene while resetting velocities to zero after every step to suppress depenetration explosions. Once settled, poses are cached for stable initialization; this may alter alignment with the original observed poses.
E.5 Background Reconstruction and Alignment
Both background paths output a Gaussian splat with a transform into the reconstructed scene. Automatic processing reuses the original capture; manual processing uses a separate foreground-free capture.
E.5.1 Automatic Background Reconstruction and Alignment
Automatic reconstruction performs foreground removal, metric depth/pose recovery, depth-supervised splat training and a derived rigid alignment to the simulator.
Frame preparation and foreground inpainting.
Frames are uniformly subsampled. A VLM enumerates foreground categories, SAM3 refines masks and SAM2 propagates them. VOID first fills removed regions and then re-inpaints residual hallucinations in GPU-sized chunks, producing a synthetic background RGB stream.
Metric depth and pose recovery.
DepthAnything3 runs on original frames for camera poses and inpainted frames for depth. Overlapping chunks are joined by Umeyama similarity fits on shared camera centers. A second fit aligns the inpainted-depth point cloud to the original-stream world and exports seed positions for splat training. Claimed millimeter residuals concern these alignment fits under smooth capture, not ground-truth reconstruction accuracy.
Depth-supervised splat training.
Nerfstudio trains the splat using inpainted RGB plus confidence-masked L1 depth supervision. Original-stream poses place the cameras; per-camera rigid pose optimization absorbs residual mismatch and is reported as essential for sharpness. Depth supervision reduces floaters over textureless surfaces.
Rigid bridge into the simulator world.
The anchor frame’s pose in the original camera world is composed with its ground-plane-aligned extraction pose to map the splat into simulation. This establishes registration through shared estimated poses, rather than a new independent manual alignment.
E.5.2 Manual Background Alignment
The manual path clears foreground objects physically, records another video, reconstructs a clean background and then aligns it in the scene editor.
Clean-stream capture and pose estimation.
A similar camera trajectory captures the emptied scene. Nerfstudio extracts frames and COLMAP estimates intrinsics, camera poses and a sparse initialization cloud.
Splat training on the foreground-free video.
Nerfstudio’s splatfacto-big model trains with photometric supervision on real foreground-free images and exports a PLY. Avoiding inpainting can yield sharper surfaces and silhouettes.
Interactive alignment via the scene editor.
Because the second capture has an independent COLMAP coordinate system and scale, a user aligns translation, rotation and isotropic scale against reconstructed foreground meshes. The saved transform is reused on later loads.
E.5.3 Comparison and Trade-offs
Automatic processing saves capture/alignment effort and better registers rendered viewpoints, but adds approximately ninety minutes of two-pass inpainting on an RTX 3090 and may hallucinate hidden surfaces. A second clean capture improves surface fidelity at the cost of physical scene clearing and manual alignment. Better pixel-alignment metrics do not by themselves establish sharper underlying surface geometry.
Appendix F Digital Cousins Augmentation
Object, scene and task cousins vary different aspects of the reconstructed environment while aiming to preserve executable interactions.
F.1 Object Cousins Augmentation
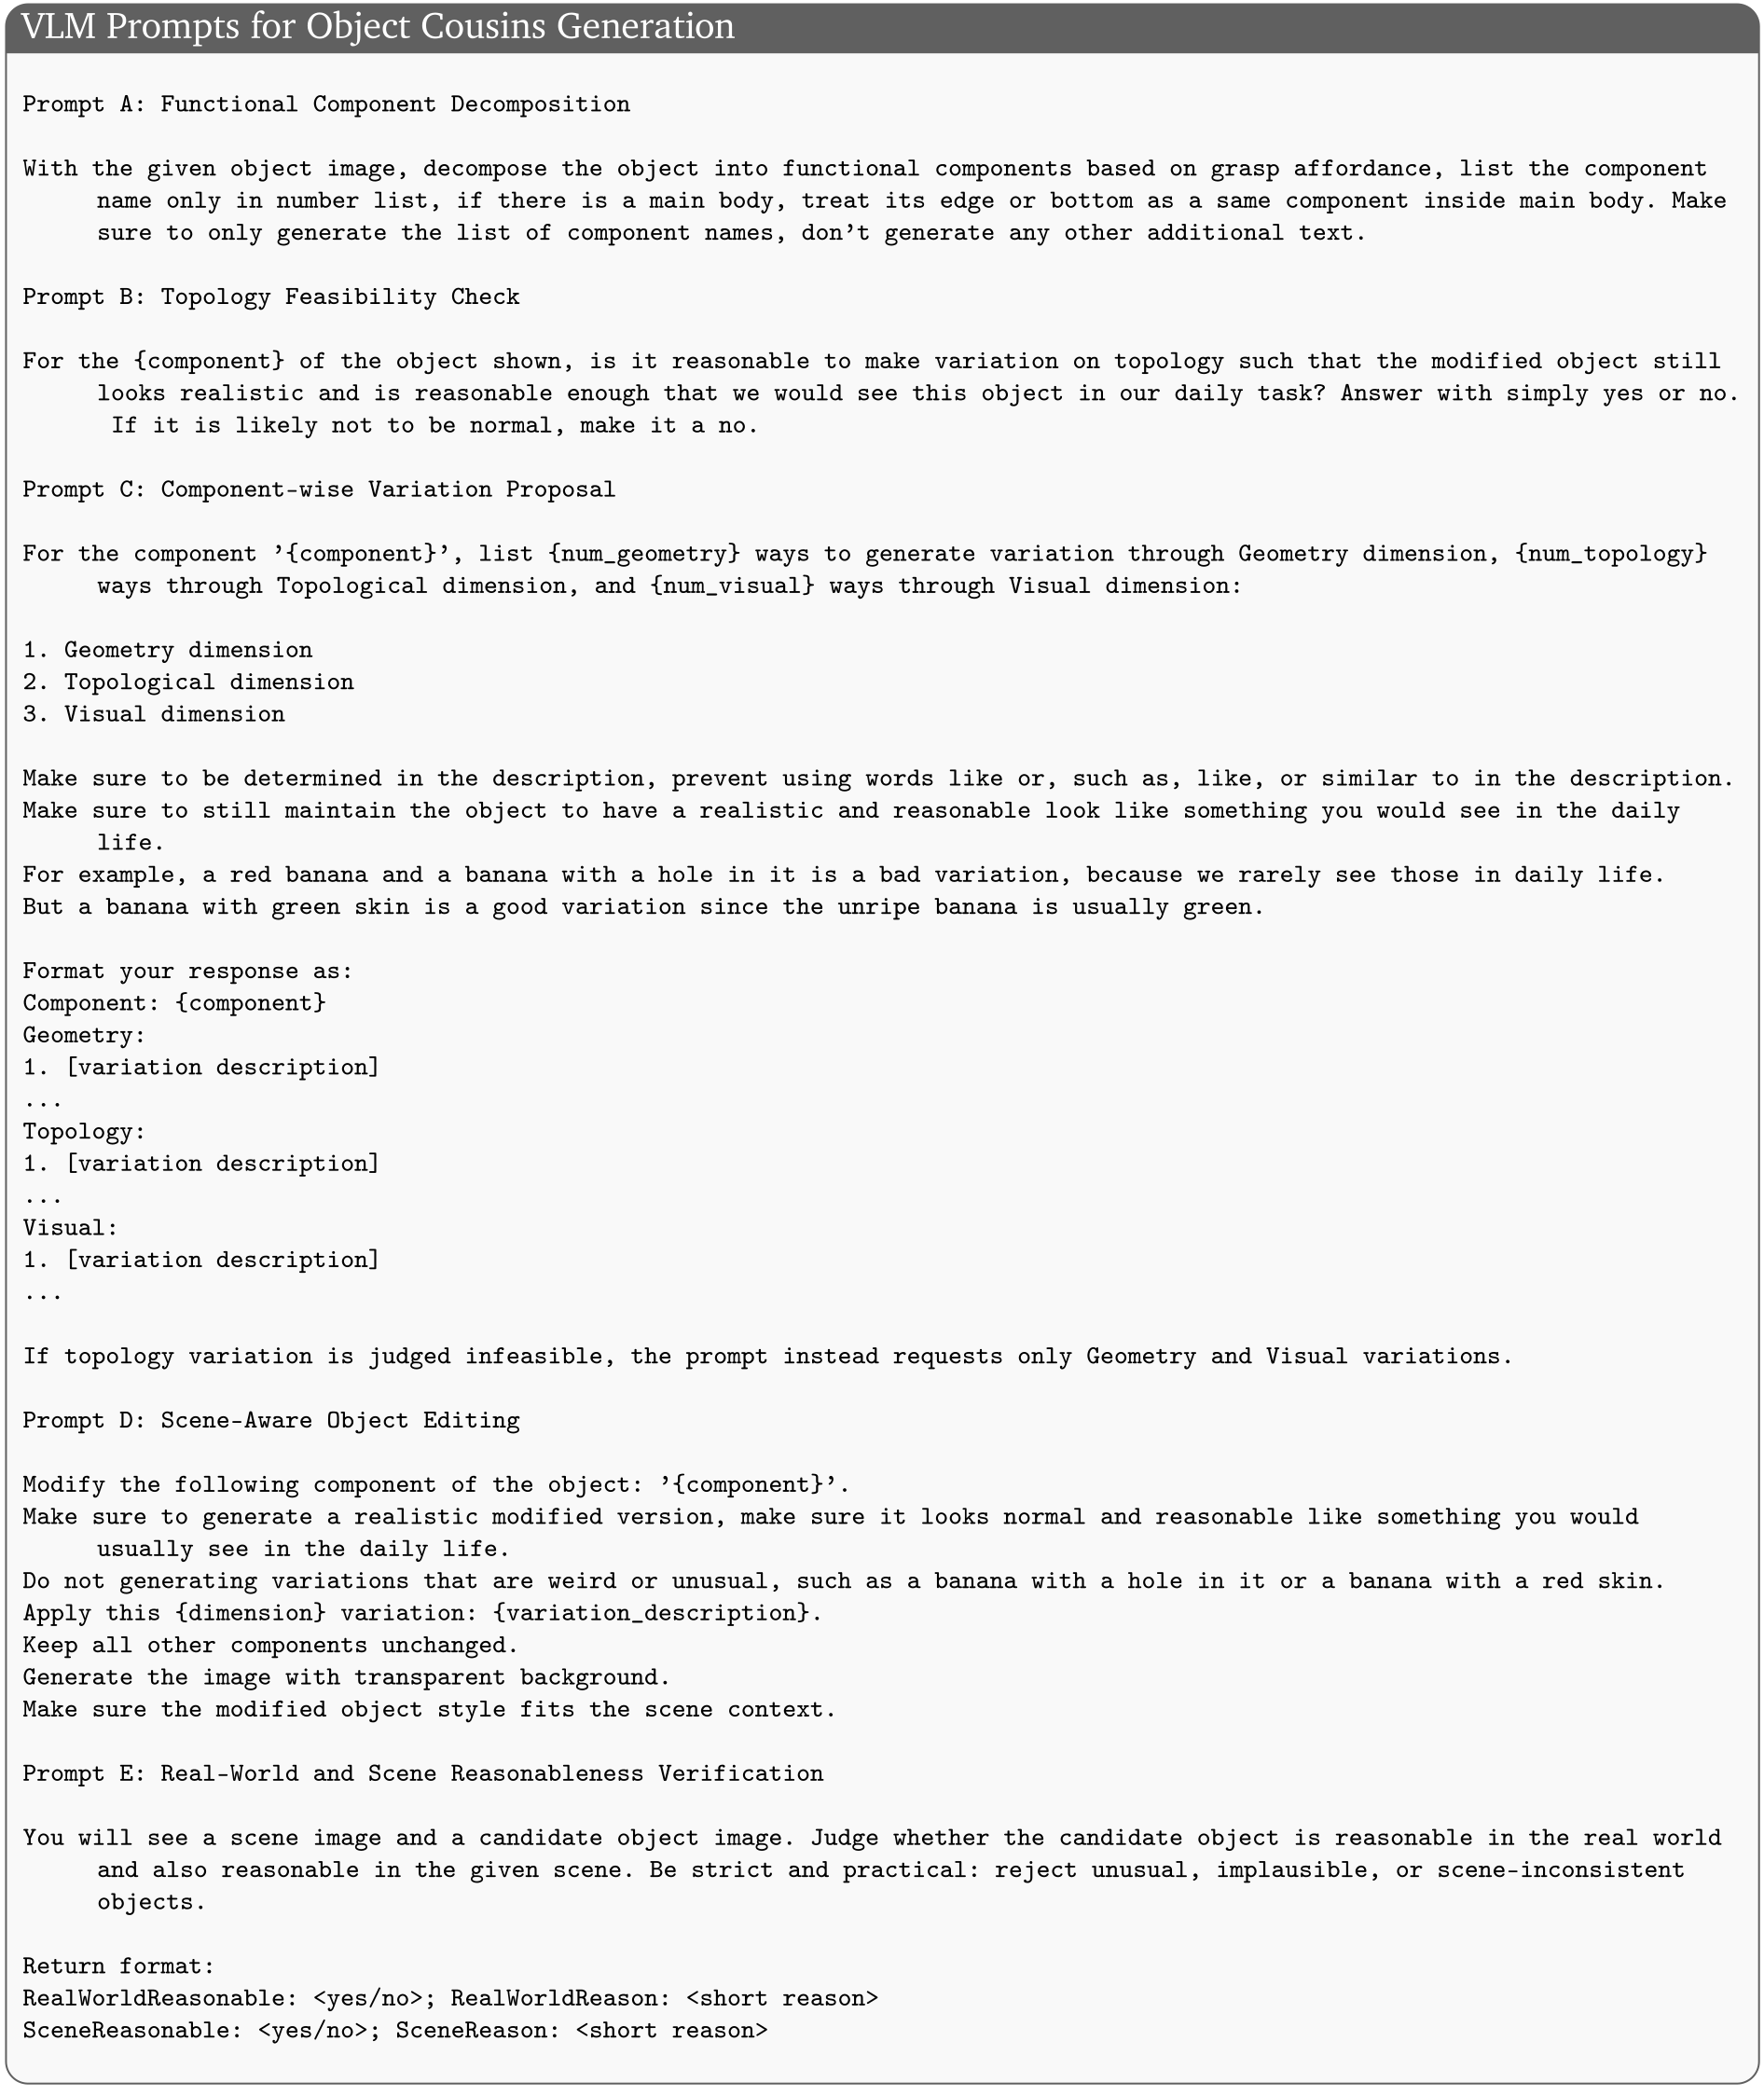
The object pipeline canonicalizes names, identifies functional parts, proposes geometric/topological/visual changes, edits only the selected component with scene context, and filters outputs for plausibility. Topological variation is suppressed when implausible. Accepted variants retain prompts, descriptions and verification metadata. The complete original prompt templates are restored below.
Selectable original prompt restored from PDF
VLM Prompts for Object Cousins Generation
Prompt A: Functional Component Decomposition

With the given object image, decompose the object into functional components based on grasp affordance, list the component
     name only in number list, if there is a main body, treat its edge or bottom as a same component inside main body. Make
     sure to only generate the list of component names, don’t generate any other additional text.

Prompt B: Topology Feasibility Check

For the {component} of the object shown, is it reasonable to make variation on topology such that the modified object still
     looks realistic and is reasonable enough that we would see this object in our daily task? Answer with simply yes or no.
      If it is likely not to be normal, make it a no.

Prompt C: Component-wise Variation Proposal

For the component ’{component}’, list {num_geometry} ways to generate variation through Geometry dimension, {num_topology}
     ways through Topological dimension, and {num_visual} ways through Visual dimension:

1. Geometry dimension
2. Topological dimension
3. Visual dimension

Make sure to be determined in the description, prevent using words like or, such as, like, or similar to in the description.
Make sure to still maintain the object to have a realistic and reasonable look like something you would see in the daily
     life.
For example, a red banana and a banana with a hole in it is a bad variation, because we rarely see those in daily life.
But a banana with green skin is a good variation since the unripe banana is usually green.

Format your response as:
Component: {component}
Geometry:
1. [variation description]
...
Topology:
1. [variation description]
...
Visual:
1. [variation description]
...

If topology variation is judged infeasible, the prompt instead requests only Geometry and Visual variations.

Prompt D: Scene-Aware Object Editing

Modify the following component of the object: ’{component}’.
Make sure to generate a realistic modified version, make sure it looks normal and reasonable like something you would
     usually see in the daily life.
Do not generating variations that are weird or unusual, such as a banana with a hole in it or a banana with a red skin.
Apply this {dimension} variation: {variation_description}.
Keep all other components unchanged.
Generate the image with transparent background.
Make sure the modified object style fits the scene context.

Prompt E: Real-World and Scene Reasonableness Verification

You will see a scene image and a candidate object image. Judge whether the candidate object is reasonable in the real world
     and also reasonable in the given scene. Be strict and practical: reject unusual, implausible, or scene-inconsistent
     objects.

Return format:
RealWorldReasonable: <yes/no>; RealWorldReason: <short reason>
SceneReasonable: <yes/no>; SceneReason: <short reason>
F.2 Scene Cousins Augmentation
An anchor is selected by the user or a VLM, then objects receive allowed LeftOf, RightOf, InFrontOf, Behind, OnTopOf or Inside predicates, potentially in combination. The user specifies which predicates are valid for each object/task. BEHAVIOR distractors can be filtered by category, mass, volume and density, then placed without collisions.
F.3 Task Cousins Augmentation
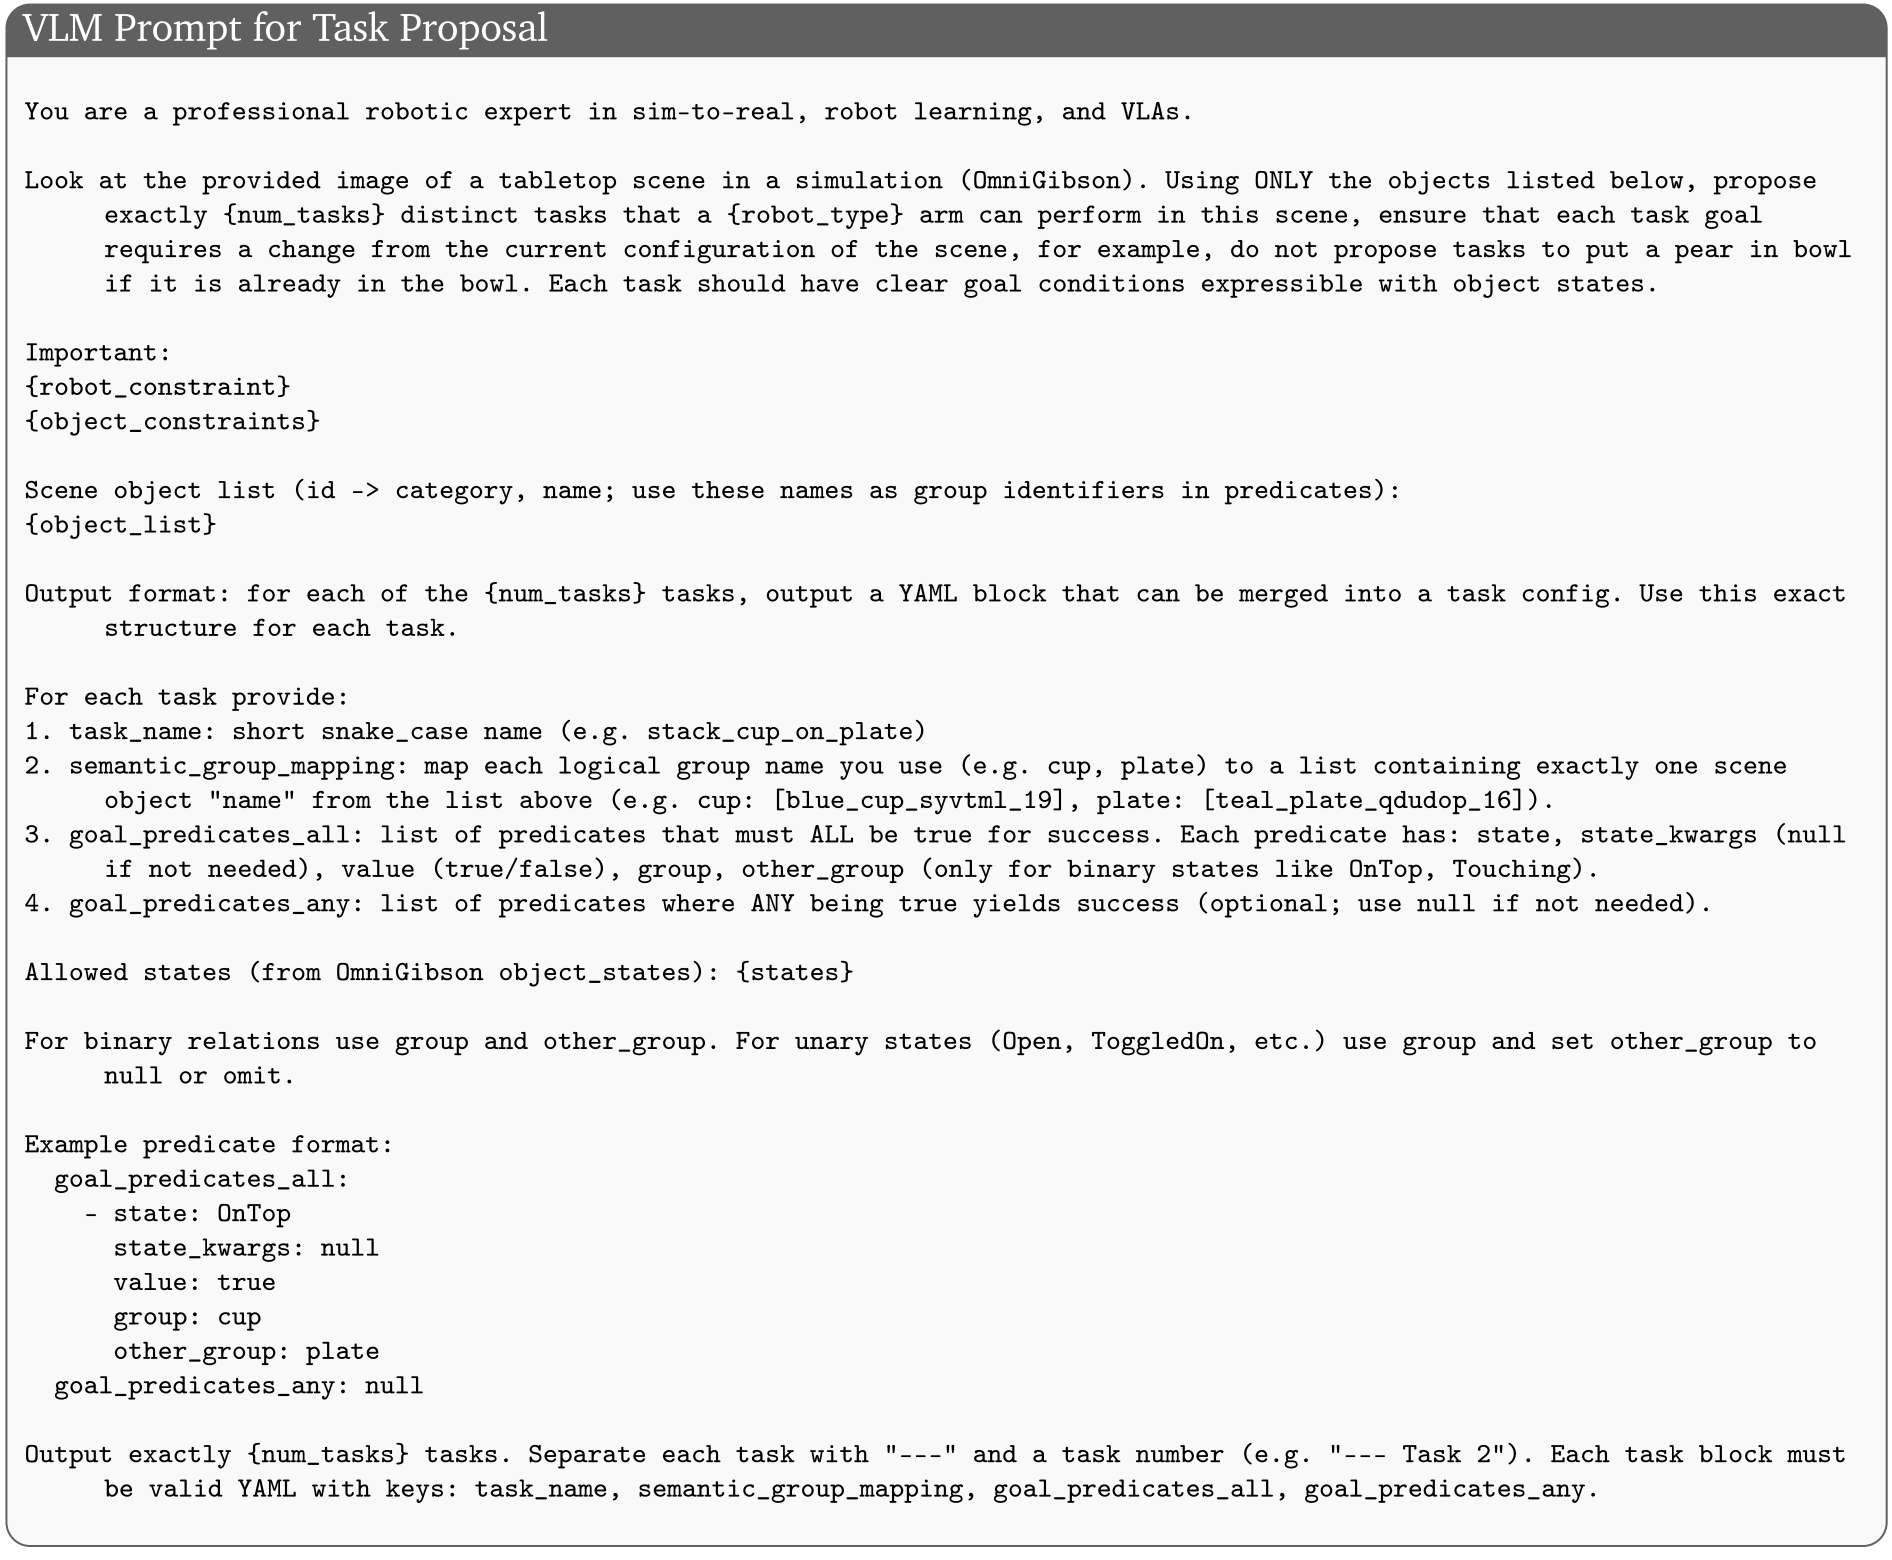
A VLM receives a scene image, interactable-object list, robot constraints and allowable predicates. It proposes tasks requiring changes from the initial state and emits structured semantic groups and goal conditions for simulation/data generation. These proposals remain constrained by inferred affordances and validation, rather than proving arbitrary tasks executable.
Selectable original prompt restored from PDF
VLM Prompt for Task Proposal
You are a professional robotic expert in sim-to-real, robot learning, and VLAs.

Look at the provided image of a tabletop scene in a simulation (OmniGibson). Using ONLY the objects listed below, propose
     exactly {num_tasks} distinct tasks that a {robot_type} arm can perform in this scene, ensure that each task goal
     requires a change from the current configuration of the scene, for example, do not propose tasks to put a pear in bowl
     if it is already in the bowl. Each task should have clear goal conditions expressible with object states.

Important:
{robot_constraint}
{object_constraints}

Scene object list (id -> category, name; use these names as group identifiers in predicates):
{object_list}

Output format: for each of the {num_tasks} tasks, output a YAML block that can be merged into a task config. Use this exact
     structure for each task.

For each task provide:
1. task_name: short snake_case name (e.g. stack_cup_on_plate)
2. semantic_group_mapping: map each logical group name you use (e.g. cup, plate) to a list containing exactly one scene
     object "name" from the list above (e.g. cup: [blue_cup_syvtml_19], plate: [teal_plate_qdudop_16]).
3. goal_predicates_all: list of predicates that must ALL be true for success. Each predicate has: state, state_kwargs (null
     if not needed), value (true/false), group, other_group (only for binary states like OnTop, Touching).
4. goal_predicates_any: list of predicates where ANY being true yields success (optional; use null if not needed).

Allowed states (from OmniGibson object_states): {states}

For binary relations use group and other_group. For unary states (Open, ToggledOn, etc.) use group and set other_group to
     null or omit.

Example predicate format:
  goal_predicates_all:
    - state: OnTop
      state_kwargs: null
      value: true
      group: cup
      other_group: plate
  goal_predicates_any: null

Output exactly {num_tasks} tasks. Separate each task with "---" and a task number (e.g. "--- Task 2"). Each task block must
     be valid YAML with keys: task_name, semantic_group_mapping, goal_predicates_all, goal_predicates_any.
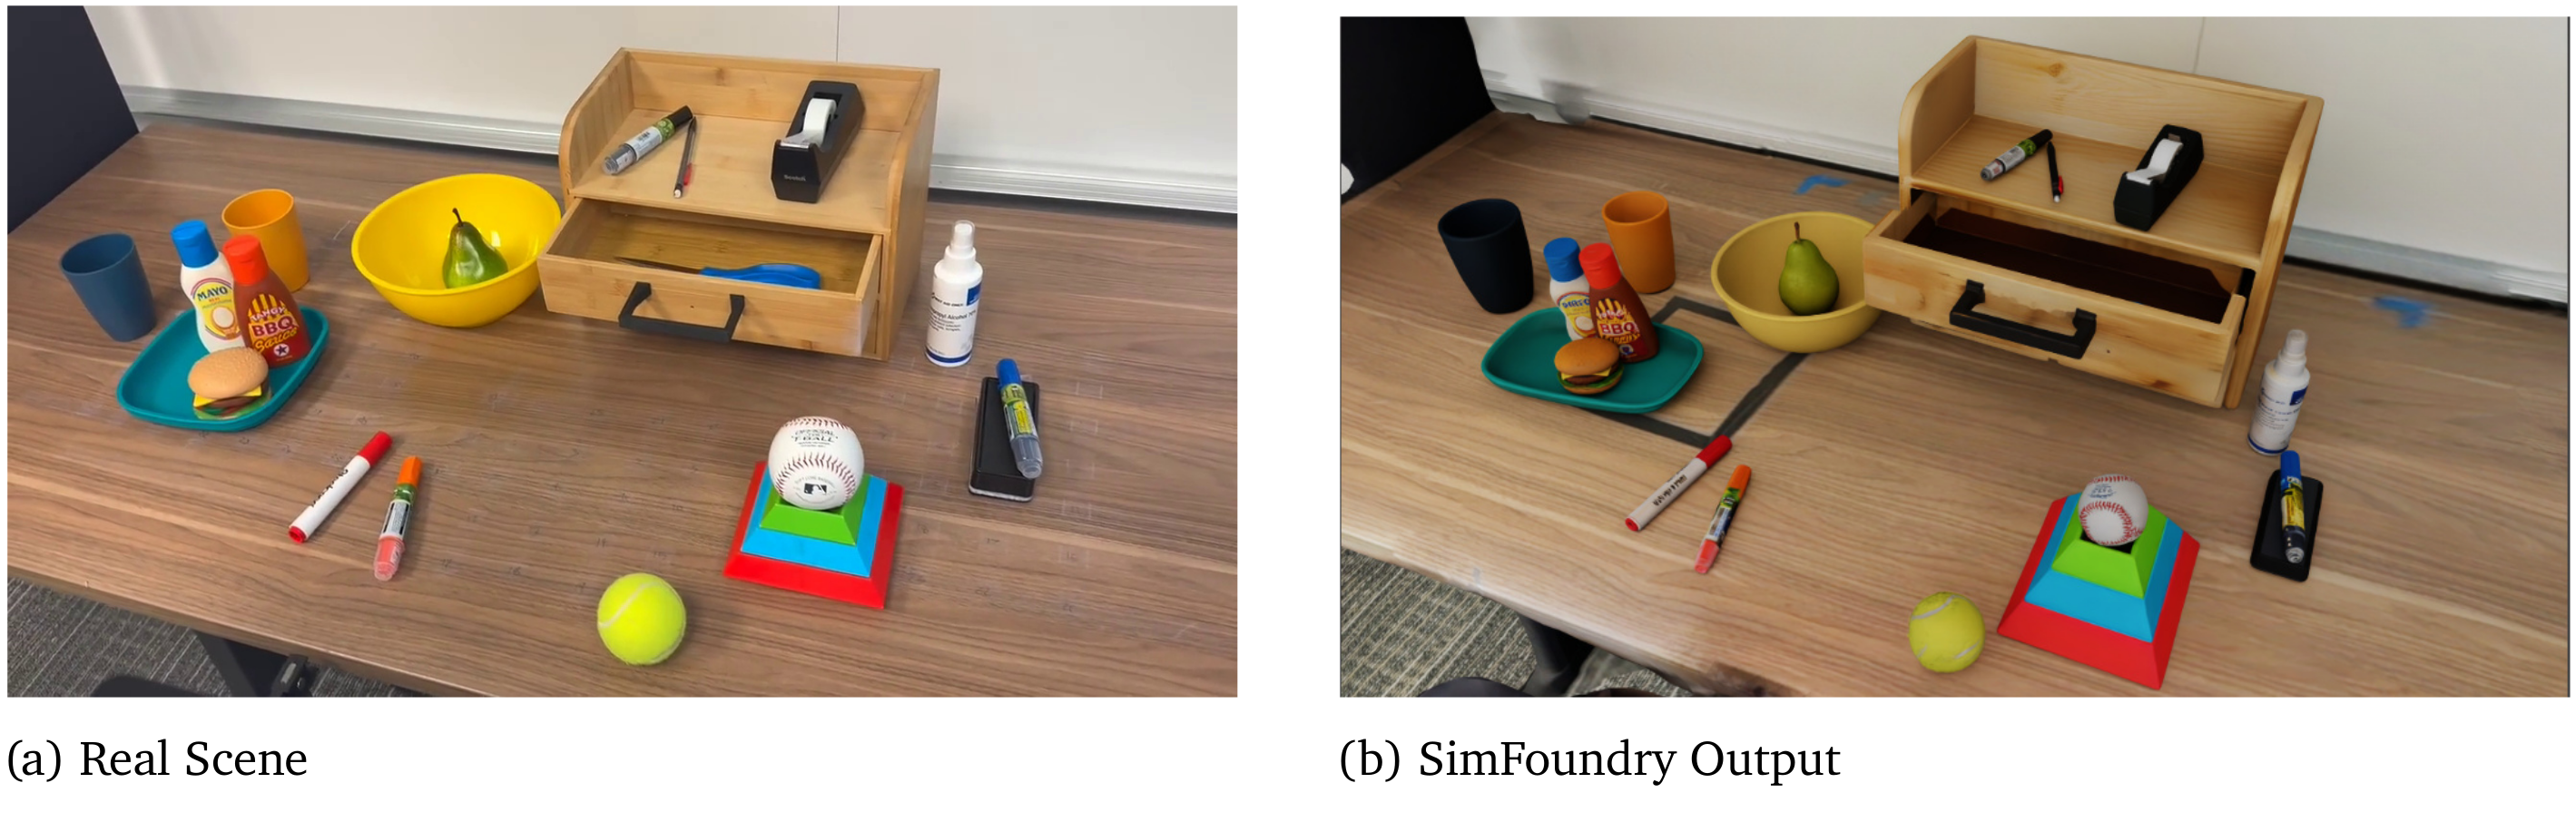
F.3.1 Task Cousins Example
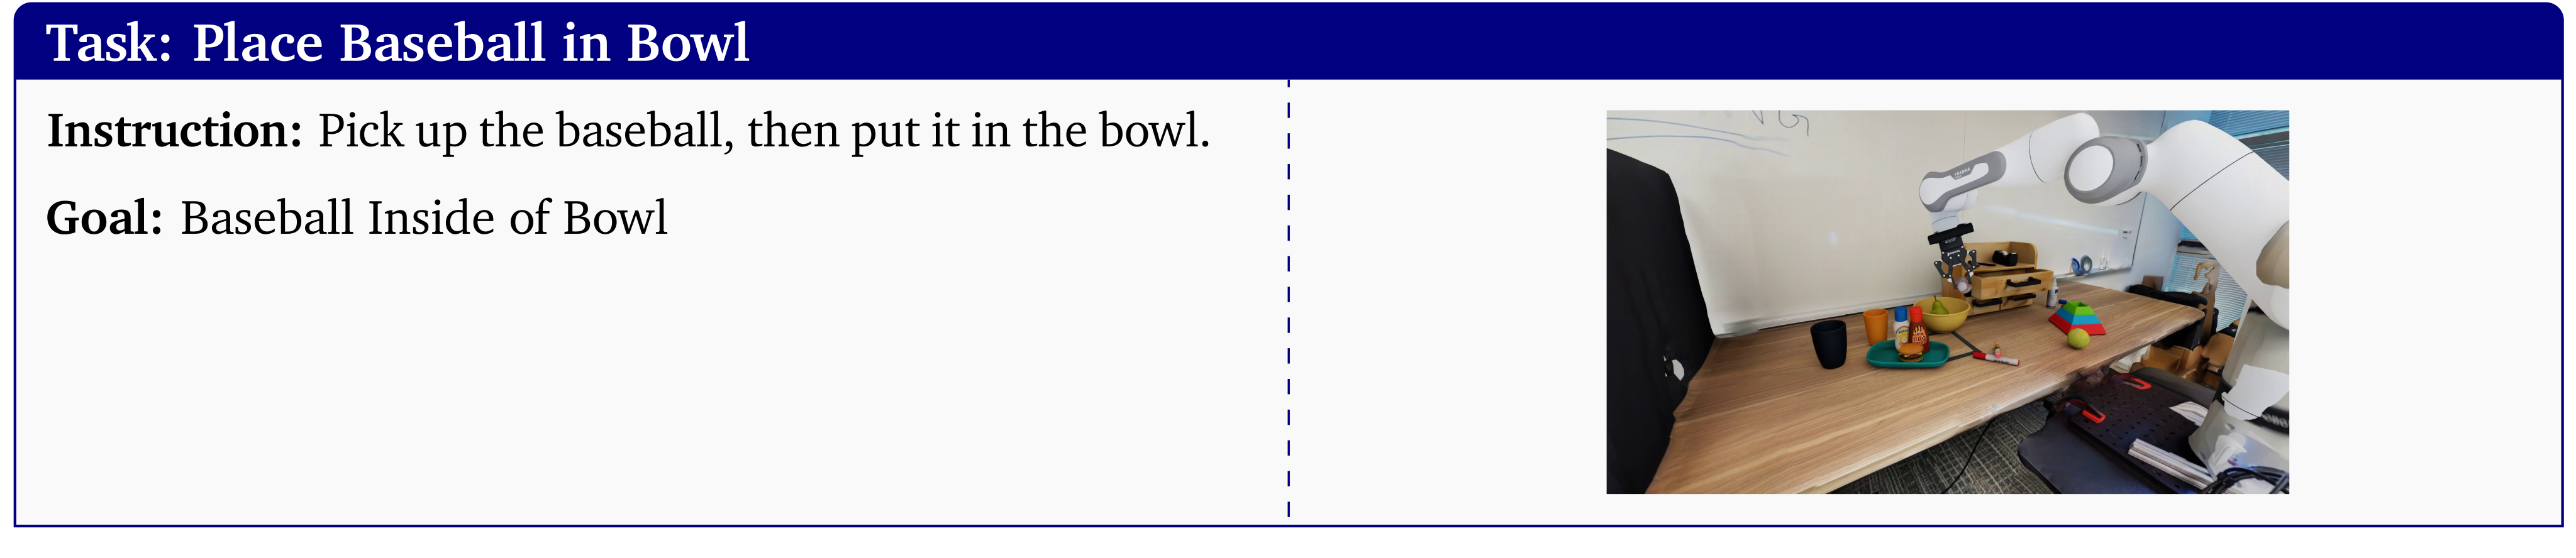
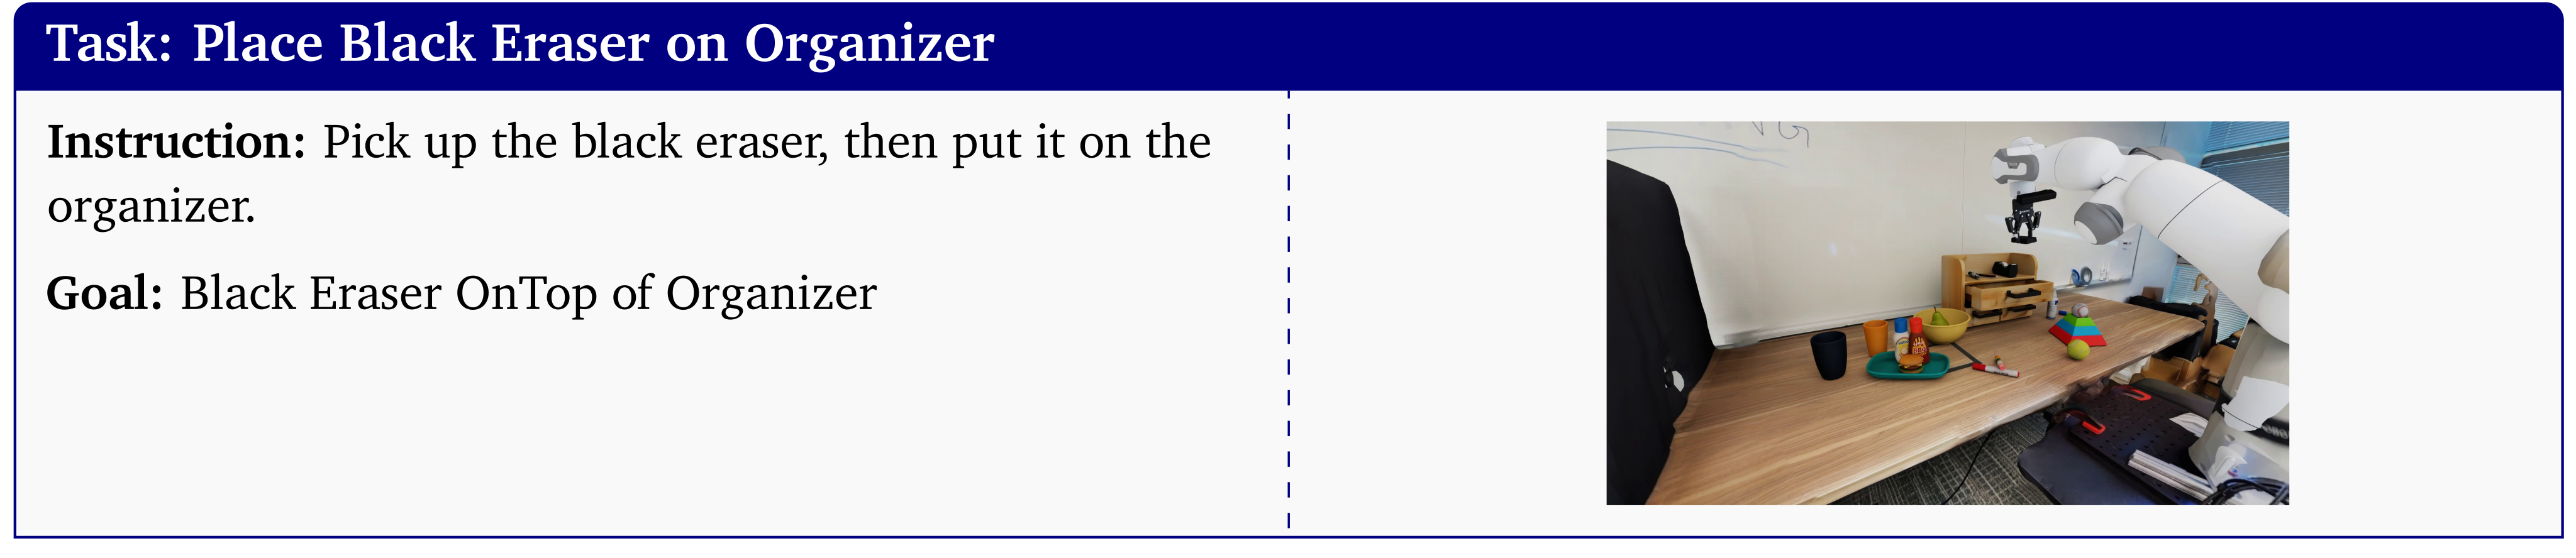
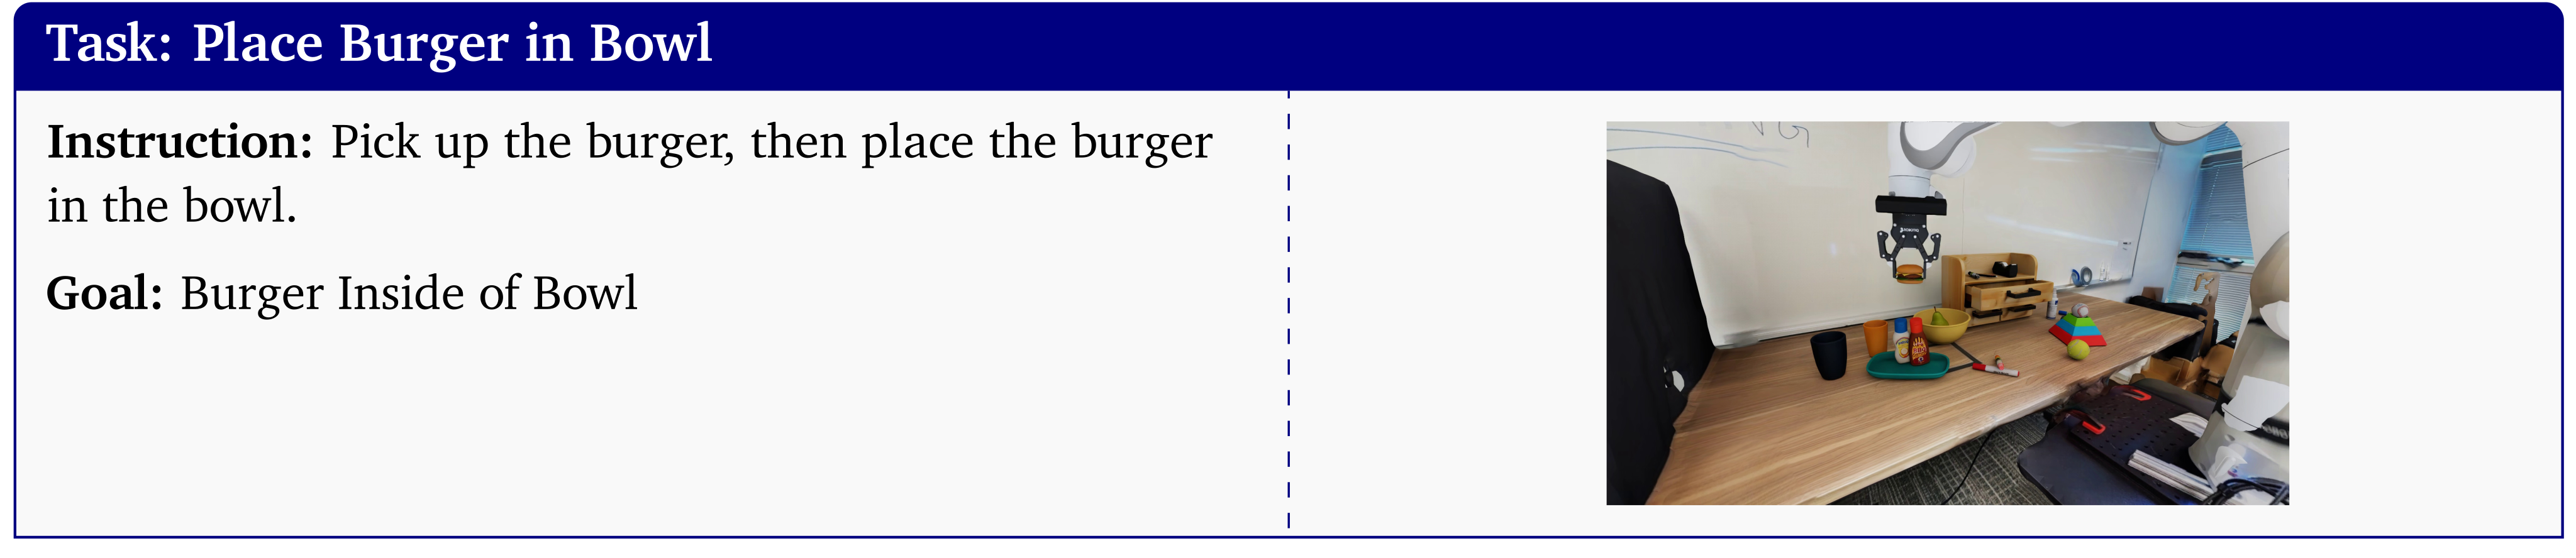
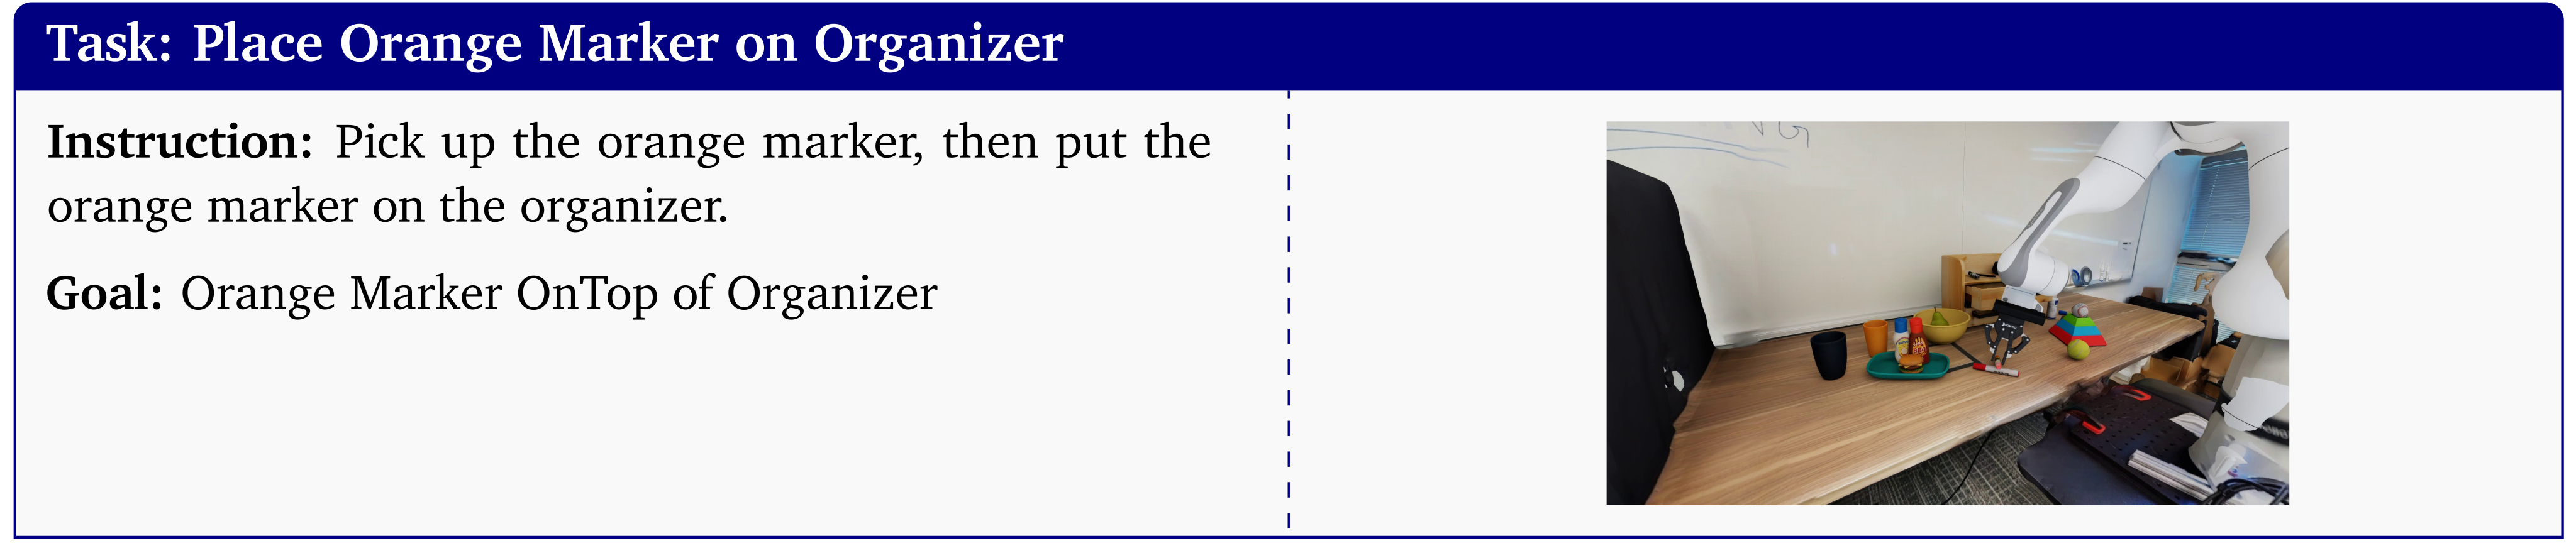
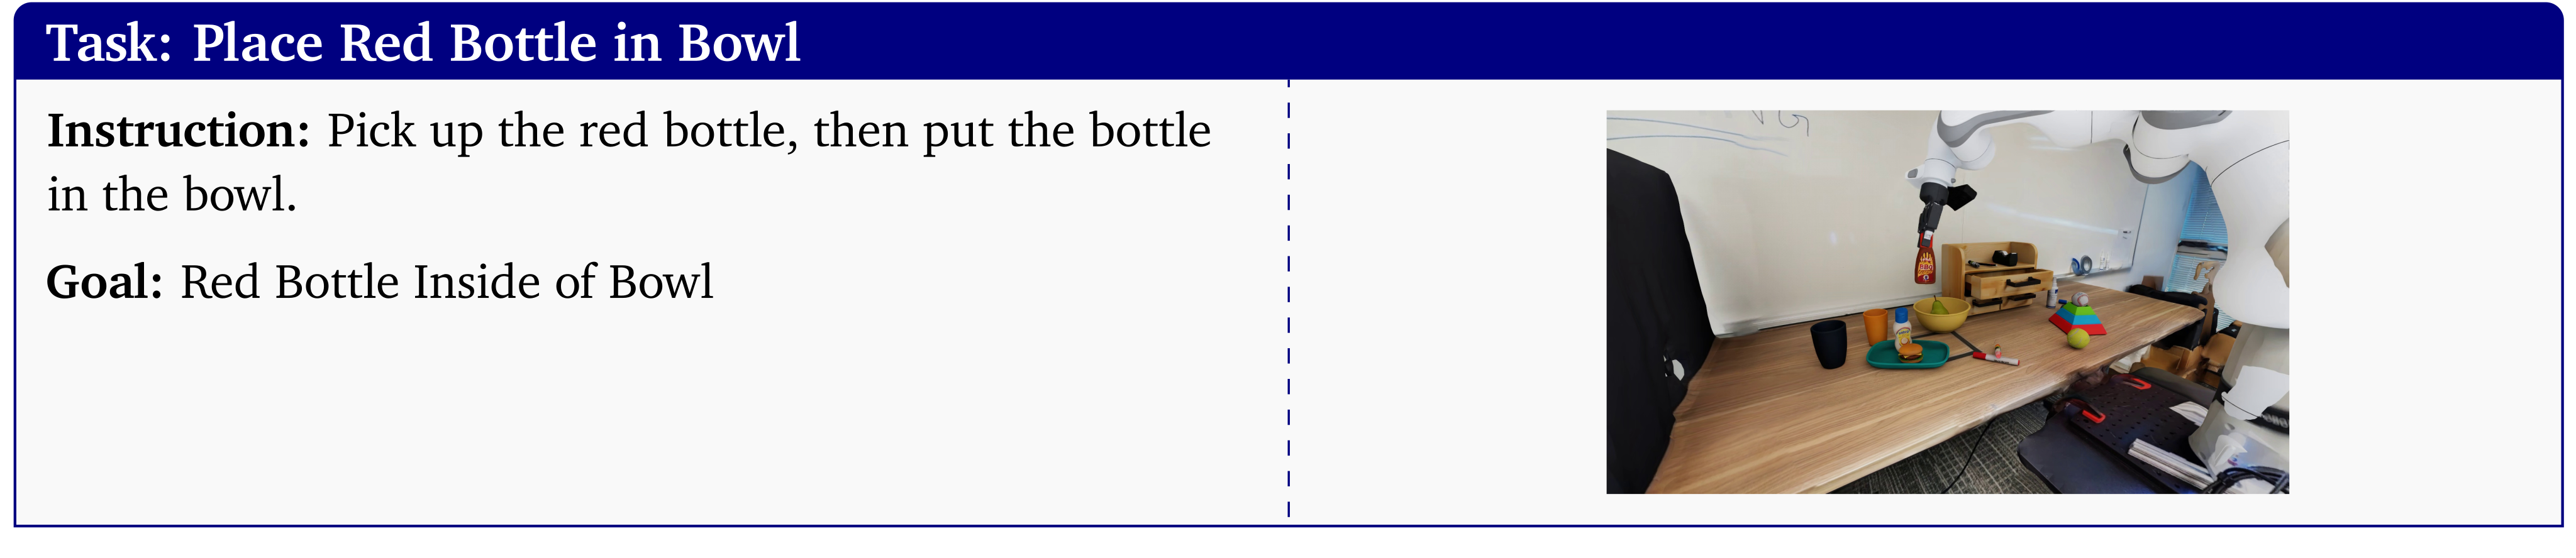
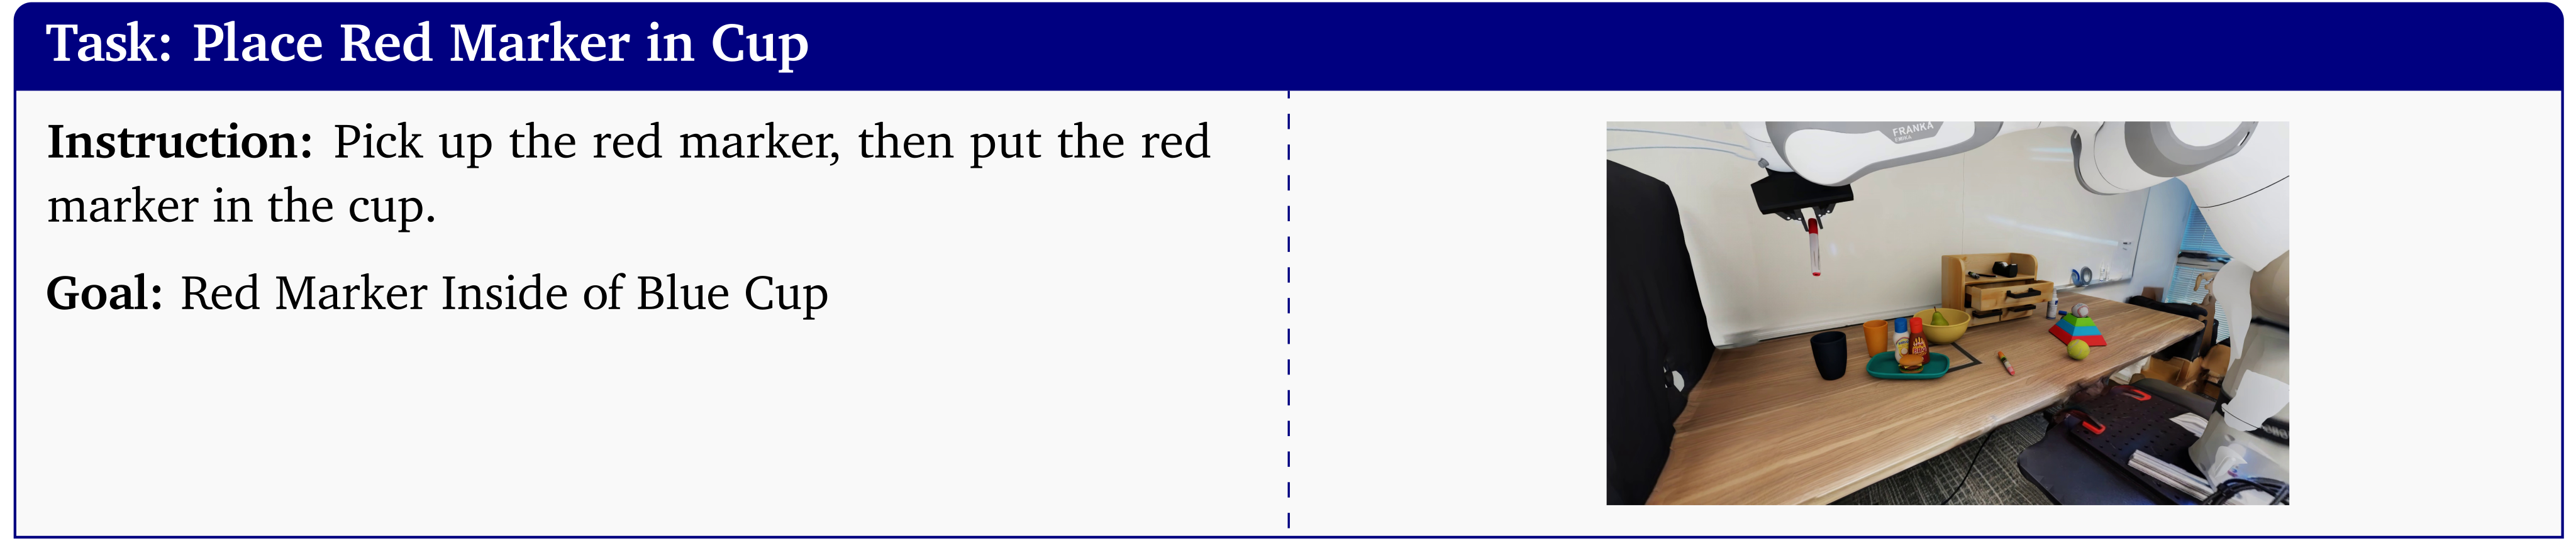
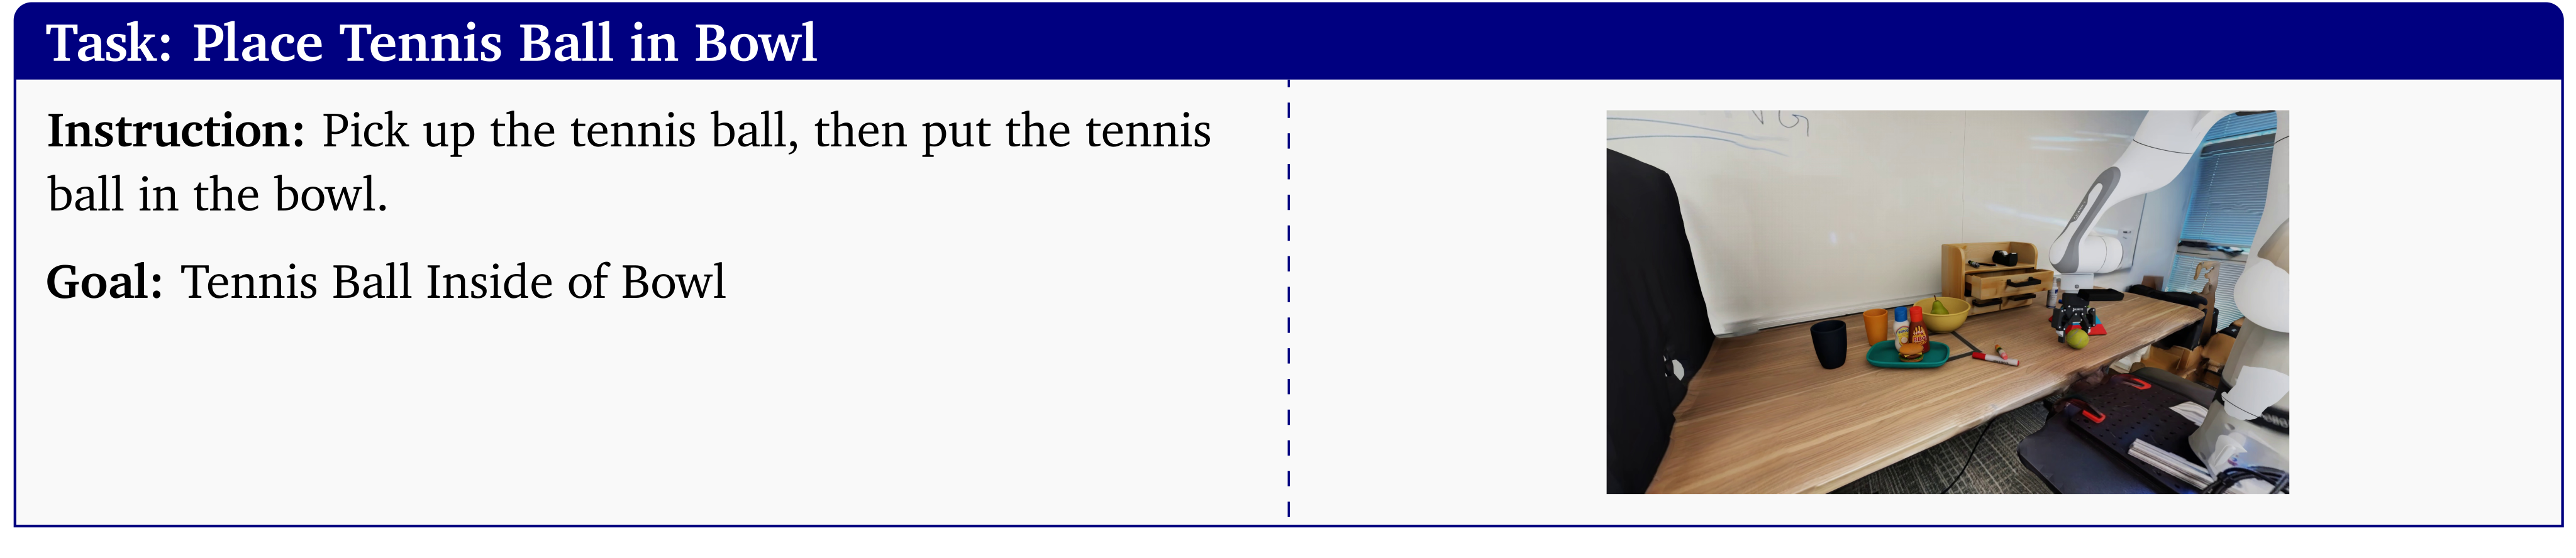
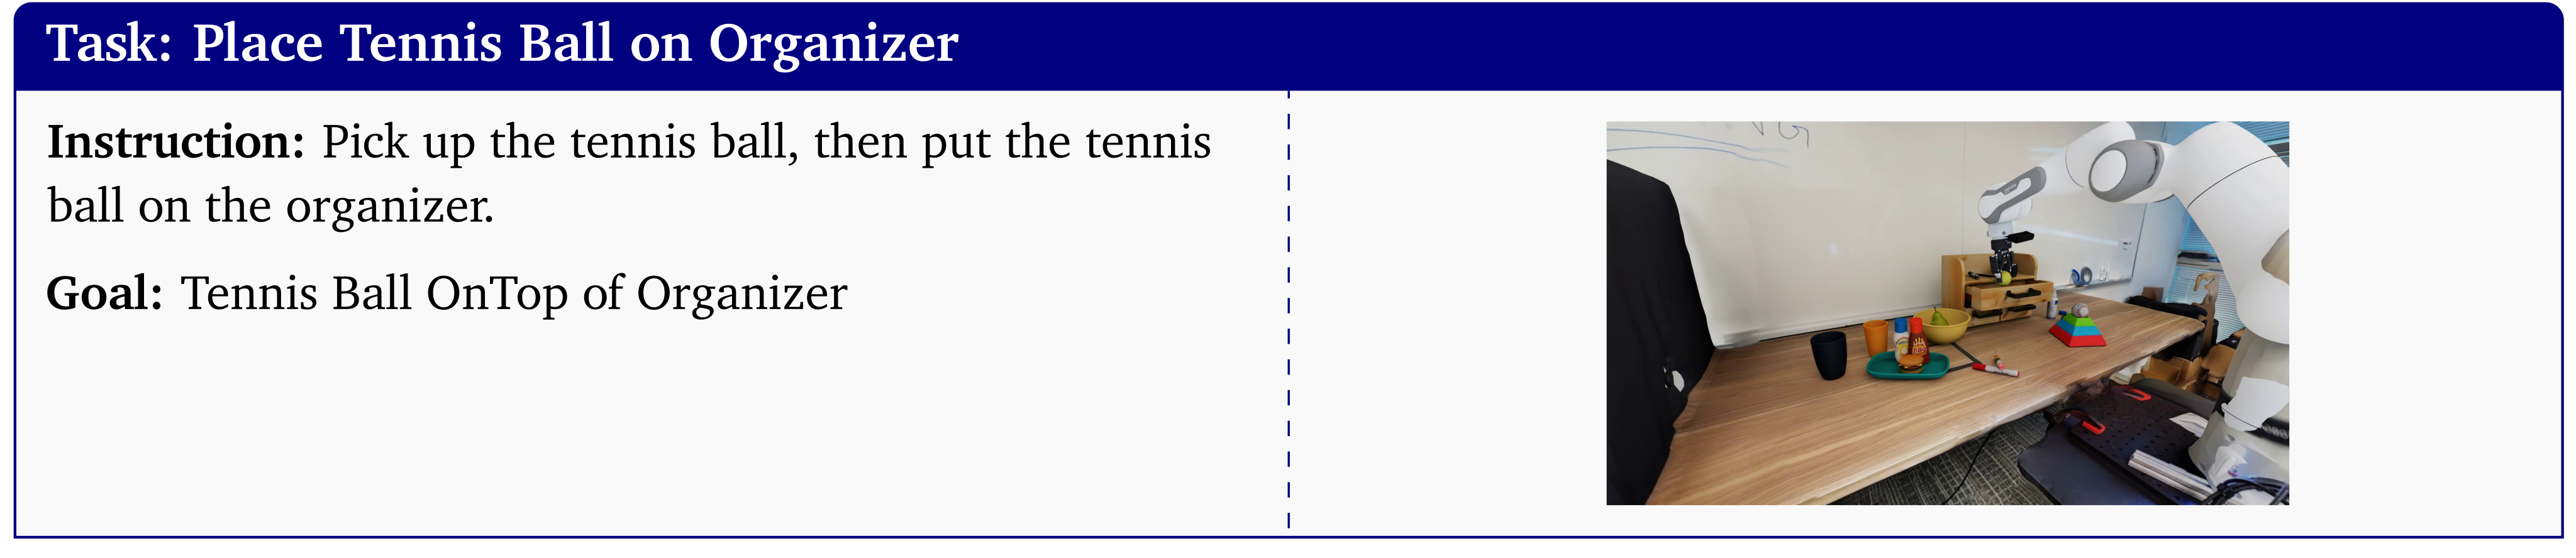
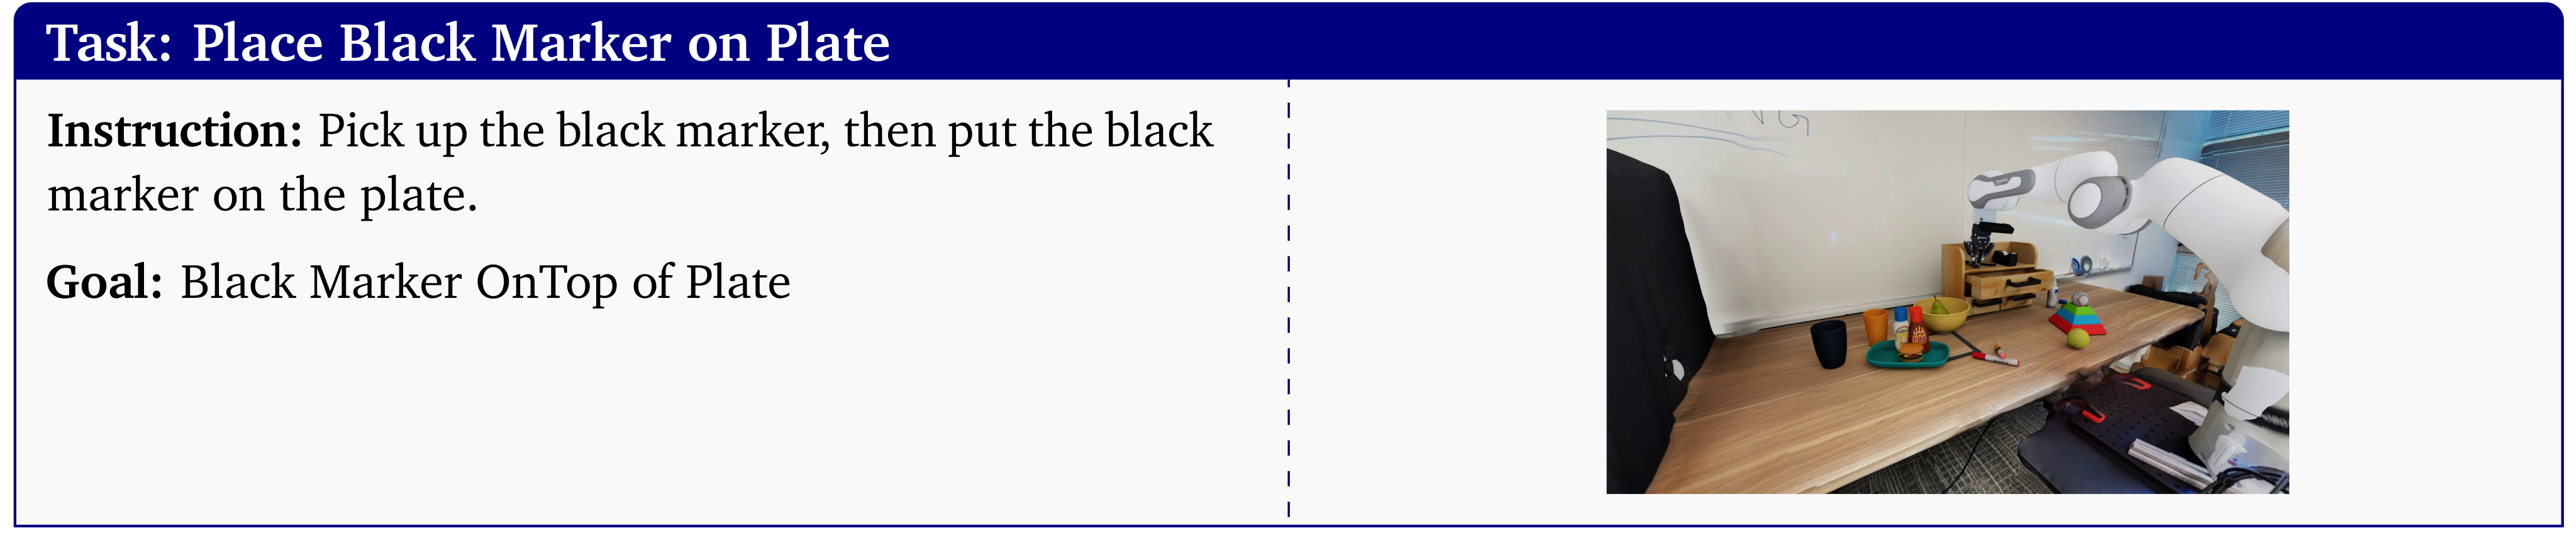
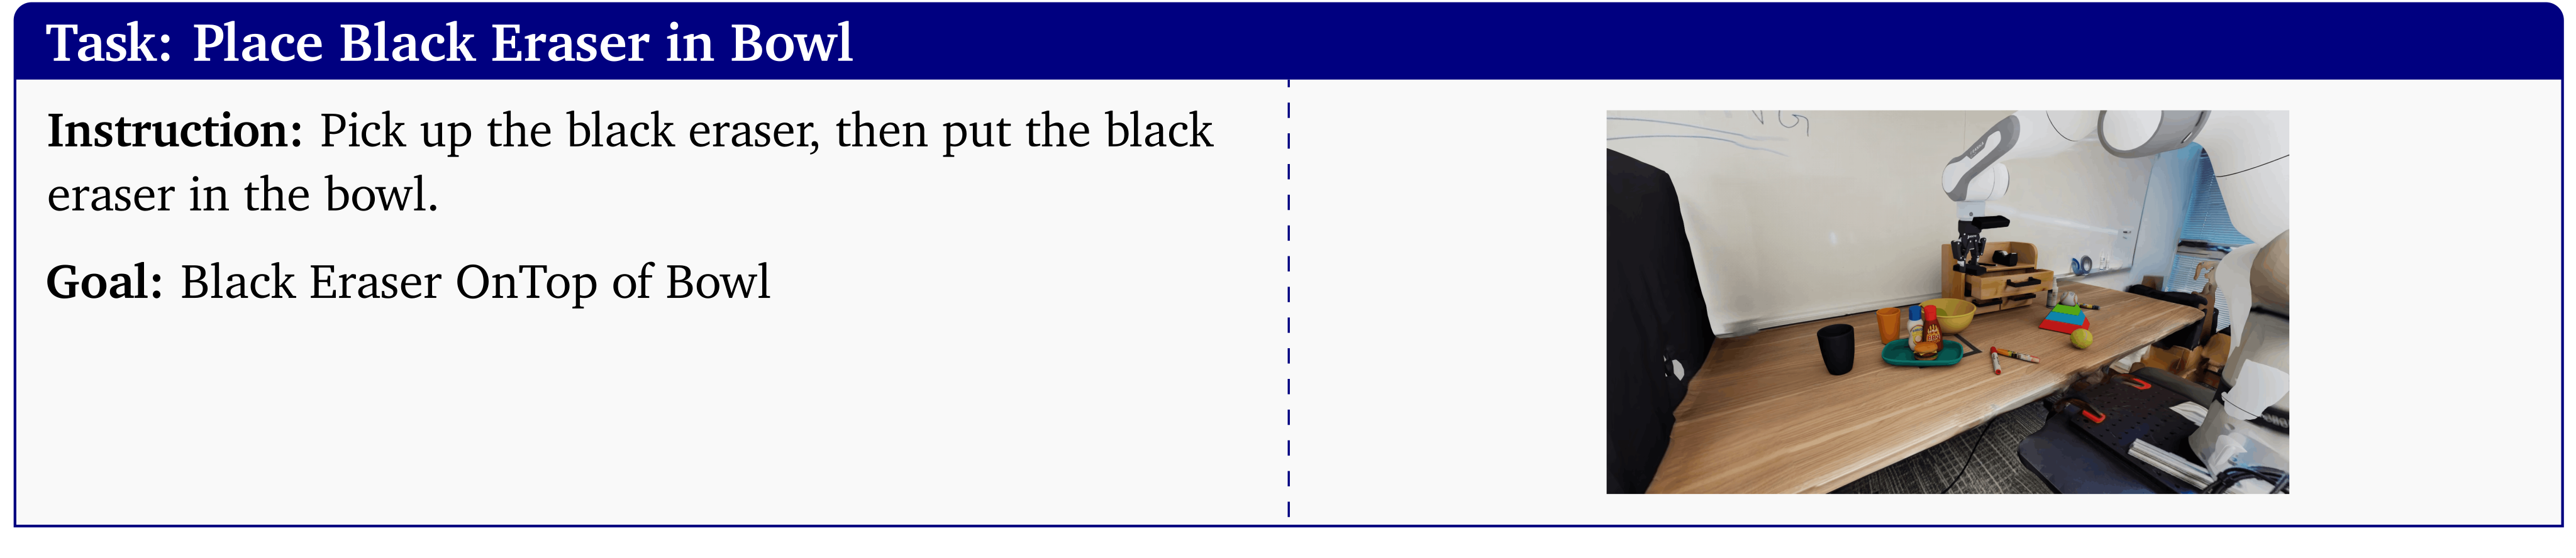
The example generates thirteen tasks, collects ten human teleoperated demonstrations per task and uses MimicGen to generate one hundred per task before multi-task π0.5 finetuning. All thirteen illustrated instructions/goals remain intact. Two cards say to put an eraser or cup “in” a bowl but specify OnTop, an inconsistency retained from the source.
Selectable original panel labels
(a) Real Scene
(b) SimFoundry Output
Selectable original task instruction and goal
Task: Place Baseball in Bowl Instruction: Pick up the baseball, then put it in the bowl. Goal: Baseball Inside of Bowl
Selectable original task instruction and goal
Task: Place Black Eraser on Organizer Instruction: Pick up the black eraser, then put it on the organizer. Goal: Black Eraser OnTop of Organizer
Selectable original task instruction and goal
Task: Place Burger in Bowl Instruction: Pick up the burger, then place the burger in the bowl. Goal: Burger Inside of Bowl
Selectable original task instruction and goal
Task: Place Orange Marker on Organizer Instruction: Pick up the orange marker, then put the orange marker on the organizer. Goal: Orange Marker OnTop of Organizer
Selectable original task instruction and goal
Task: Place Red Bottle in Bowl Instruction: Pick up the red bottle, then put the bottle in the bowl. Goal: Red Bottle Inside of Bowl
Selectable original task instruction and goal
Task: Place Red Marker in Cup Instruction: Pick up the red marker, then put the red marker in the cup. Goal: Red Marker Inside of Blue Cup
Selectable original task instruction and goal
Task: Place Tennis Ball in Bowl Instruction: Pick up the tennis ball, then put the tennis ball in the bowl. Goal: Tennis Ball Inside of Bowl
Selectable original task instruction and goal
Task: Place Tennis Ball on Organizer Instruction: Pick up the tennis ball, then put the tennis ball on the organizer. Goal: Tennis Ball OnTop of Organizer
Selectable original task instruction and goal
Task: Place Black Marker on Plate Instruction: Pick up the black marker, then put the black marker on the plate. Goal: Black Marker OnTop of Plate
Selectable original task instruction and goal
Task: Place Black Eraser in Bowl Instruction: Pick up the black eraser, then put the black eraser in the bowl. Goal: Black Eraser OnTop of Bowl
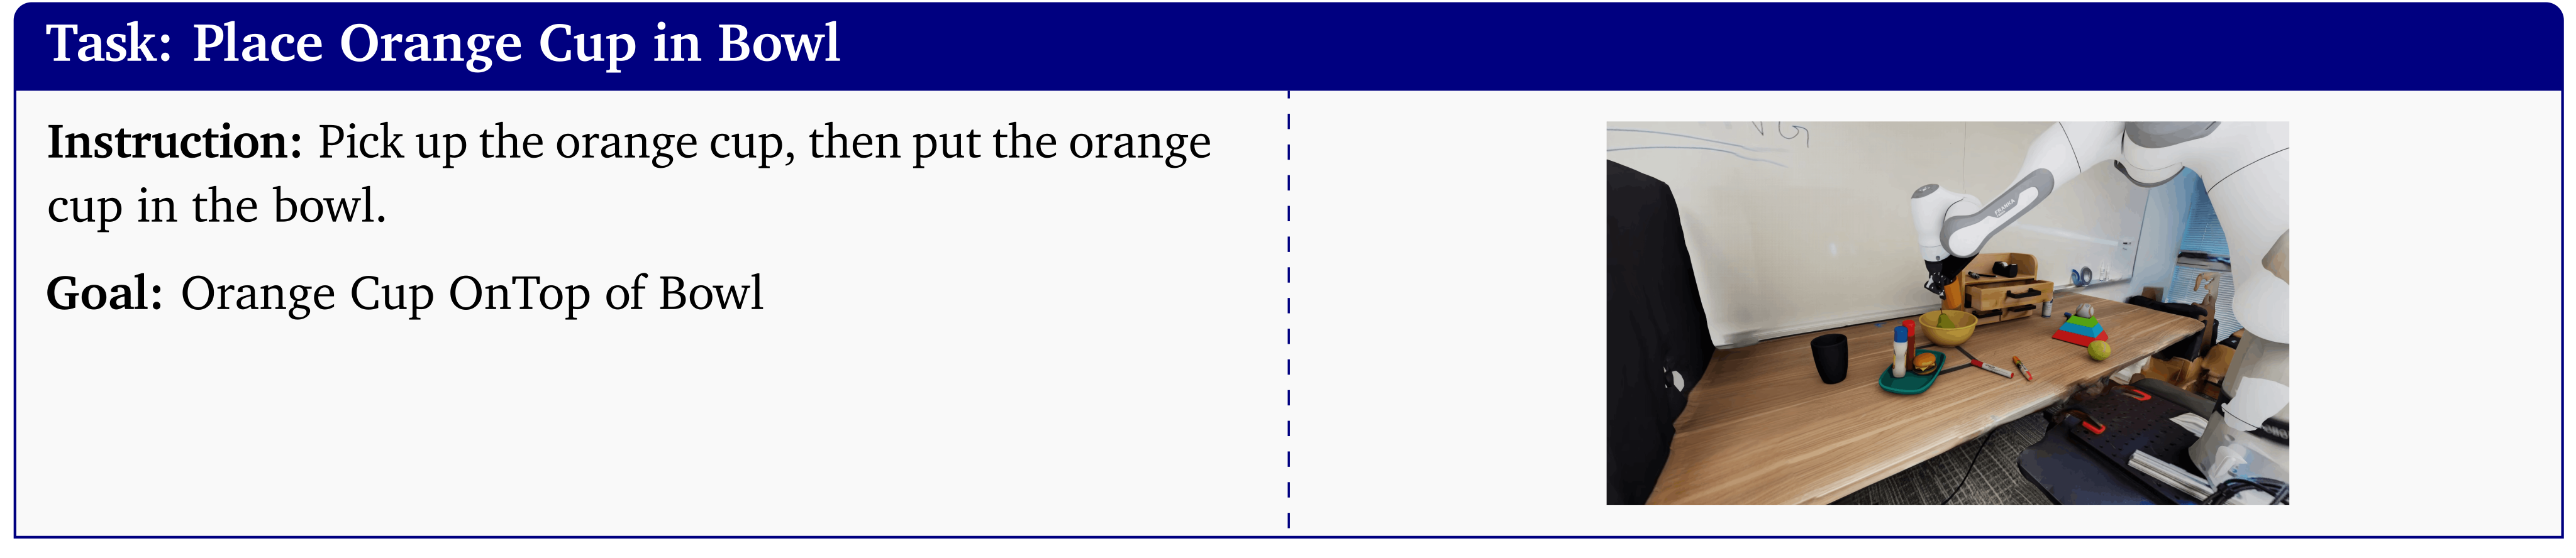
Selectable original task instruction and goal
Task: Place Orange Cup in Bowl Instruction: Pick up the orange cup, then put the orange cup in the bowl. Goal: Orange Cup OnTop of Bowl
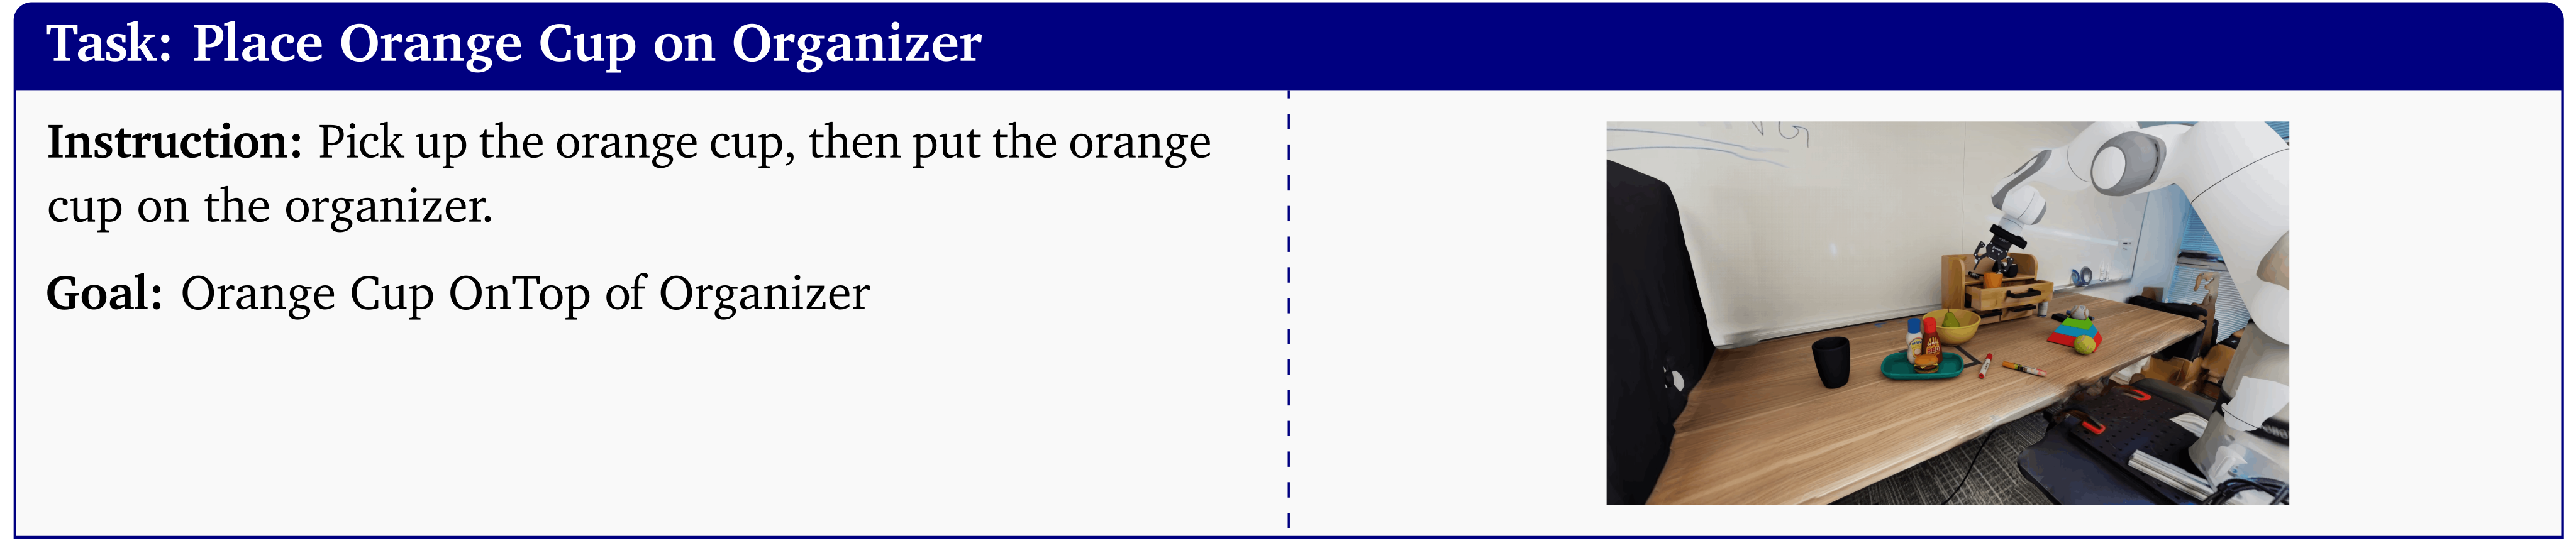
Selectable original task instruction and goal
Task: Place Orange Cup on Organizer Instruction: Pick up the orange cup, then put the orange cup on the organizer. Goal: Orange Cup OnTop of Organizer
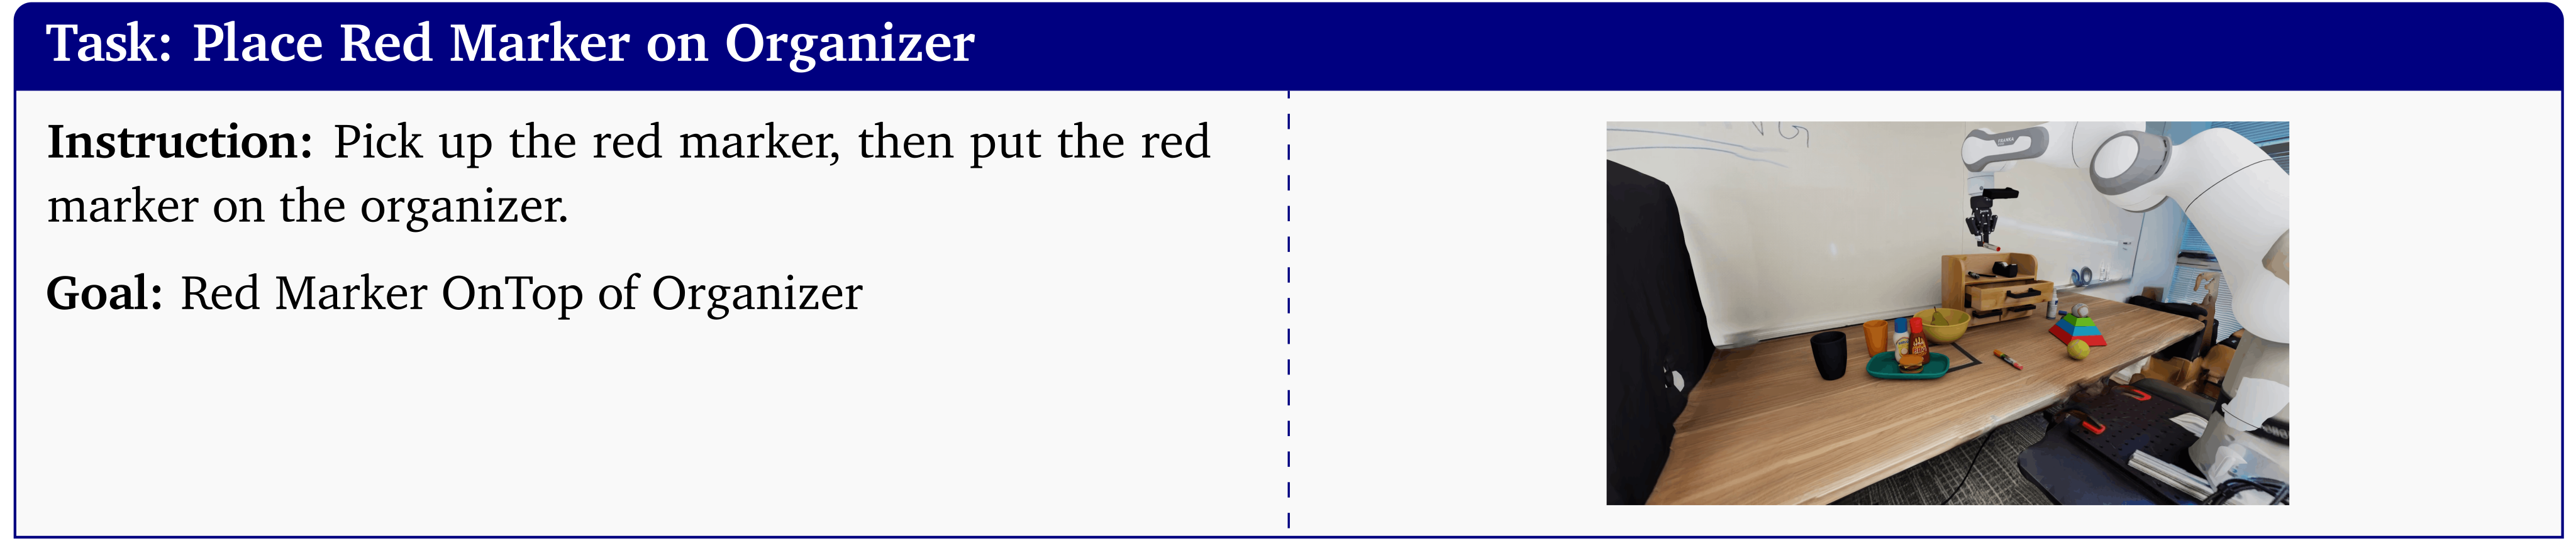
Selectable original task instruction and goal
Task: Place Red Marker on Organizer Instruction: Pick up the red marker, then put the red marker on the organizer. Goal: Red Marker OnTop of Organizer
Appendix G Detailed Experiment Results
The full tables and plots retain individual policy/task outcomes, correlation metrics, object/layout/task ablations and combined real/simulation training results.
G.1 Detailed Results for Real-to-Sim Policy Evaluation
Tables G.1–G.2 report the same real-world scores alongside each simulator’s outcomes. SimFoundry better preserves policy rankings in these settings; many PolaRiS policies perform poorly, especially task-finetuned ones. Unevaluated cells remain distinct from zero.
| GR00T N1.6 | GR00T N1.7 | DreamZero | RealSim agreement | |||||||||
| Task | Real | Sim | Real | Sim | Real | Sim | Real | Sim | Real | Sim | Pearson | MMRV |
| Stack Dishware | 100 | 34 | 100 | 64 | 40 | 0 | – | – | – | – | 0.883 | 0.000 |
| Store Marker | 48 | 4 | 60 | 20 | 32 | 0 | – | – | – | – | 0.915 | 0.000 |
| Throw Away Trash | 20 | 0 | 48 | 4 | 0 | 0 | – | – | – | – | 0.910 | 0.067 |
| Serve Fruits | 0 | 4 | 72 | 80 | 4 | 20 | 40 | 32 | 8 | 12 | 0.960 | 0.016 |
| Cup in Bowl | 88 | 56 | 100 | 92 | 68 | 40 | 92 | 92 | 100 | 92 | 0.907 | 0.016 |
| Marker in Cup | 40 | 40 | 92 | 88 | 28 | 28 | 88 | 88 | 88 | 80 | 0.995 | 0.008 |
| Clear Table | 0 | 12 | 40 | 36 | 0 | 0 | 8 | 28 | 16 | 28 | 0.810 | 0.016 |
| GR00T N1.6 | GR00T N1.7 | DreamZero | RealSim agreement | |||||||||
| Task | Real | Sim | Real | Sim | Real | Sim | Real | Sim | Real | Sim | Pearson | MMRV |
| Stack Dishware | 100 | 0 | 100 | 8 | 40 | 0 | – | – | – | – | 0.500 | 0.200 |
| Store Marker | 48 | 0 | 60 | 4 | 32 | 0 | – | – | – | – | 0.822 | 0.053 |
| Throw Away Trash | 20 | 0 | 48 | 0 | 0 | 0 | – | – | – | – | – | 0.253 |
| Serve Fruits | 0 | 4 | 72 | 28 | 4 | 24 | 40 | 4 | 8 | 4 | 0.480 | 0.288 |
| Cup in Bowl | 88 | 20 | 100 | 36 | 68 | 76 | 92 | 48 | 100 | 68 | -0.396 | 0.280 |
| Marker in Cup | 40 | 0 | 92 | 4 | 28 | 4 | 88 | 12 | 88 | 4 | 0.512 | 0.176 |
| Clear Table | 0 | 0 | 40 | 0 | 0 | 4 | 8 | 0 | 16 | 12 | -0.037 | 0.352 |
G.1.1 Sub-Task Evaluations improve Real-to-Sim Correlations
A separate residual-task protocol examines behavior after some initial steps have already succeeded.
Sub-task Evaluation Protocol.
Simulation resets to states with early subtasks completed, such as an already-open drawer for Store Marker. The remaining-task success is compared with full end-to-end real success, which changes the simulated initial-state distribution and task burden.
Sub-task evals improve correlations and provide insights into failure modes.
Across three finetuned tasks, this protocol increases mean correlation from .902 to .951. Once the drawer is open, π0.5 usually finishes the remaining Store Marker steps. This diagnoses bottlenecks but does not replace the original end-to-end results.
| GR00T N1.6 | RealSim agreement | |||||||
| Task | Real | Sim | Real | Sim | Real | Sim | Pearson | MMRV |
| Stack Dishware | 100 | 64 | 100 | 80 | 40 | 24 | 0.961 | 0.000 |
| Store Marker | 48 | 52 | 60 | 76 | 32 | 36 | 0.981 | 0.000 |
| Throw Away Trash | 20 | 0 | 48 | 8 | 0 | 0 | 0.910 | 0.067 |
G.2 Detailed Results for Sim-to-Real Experiments
Training compares the twin alone with the twin plus nine object cousins. Evaluation separates original simulated objects, held-out simulated cousins, original physical objects and held-out physical cousins, so instance generalization is not conflated with transfer on reconstructed objects.
Ablation of Object, Scene and Task Cousins.
The plots report average gains near seventeen points for object cousins and forty for task cousins; scene gains differ for twin and cousin layouts. Their measurement domains differ: the scene/task-cousin ablations in the retained tables are simulated evaluations, whereas object studies include physical transfer. Co-training usually helps but is not uniformly beneficial.
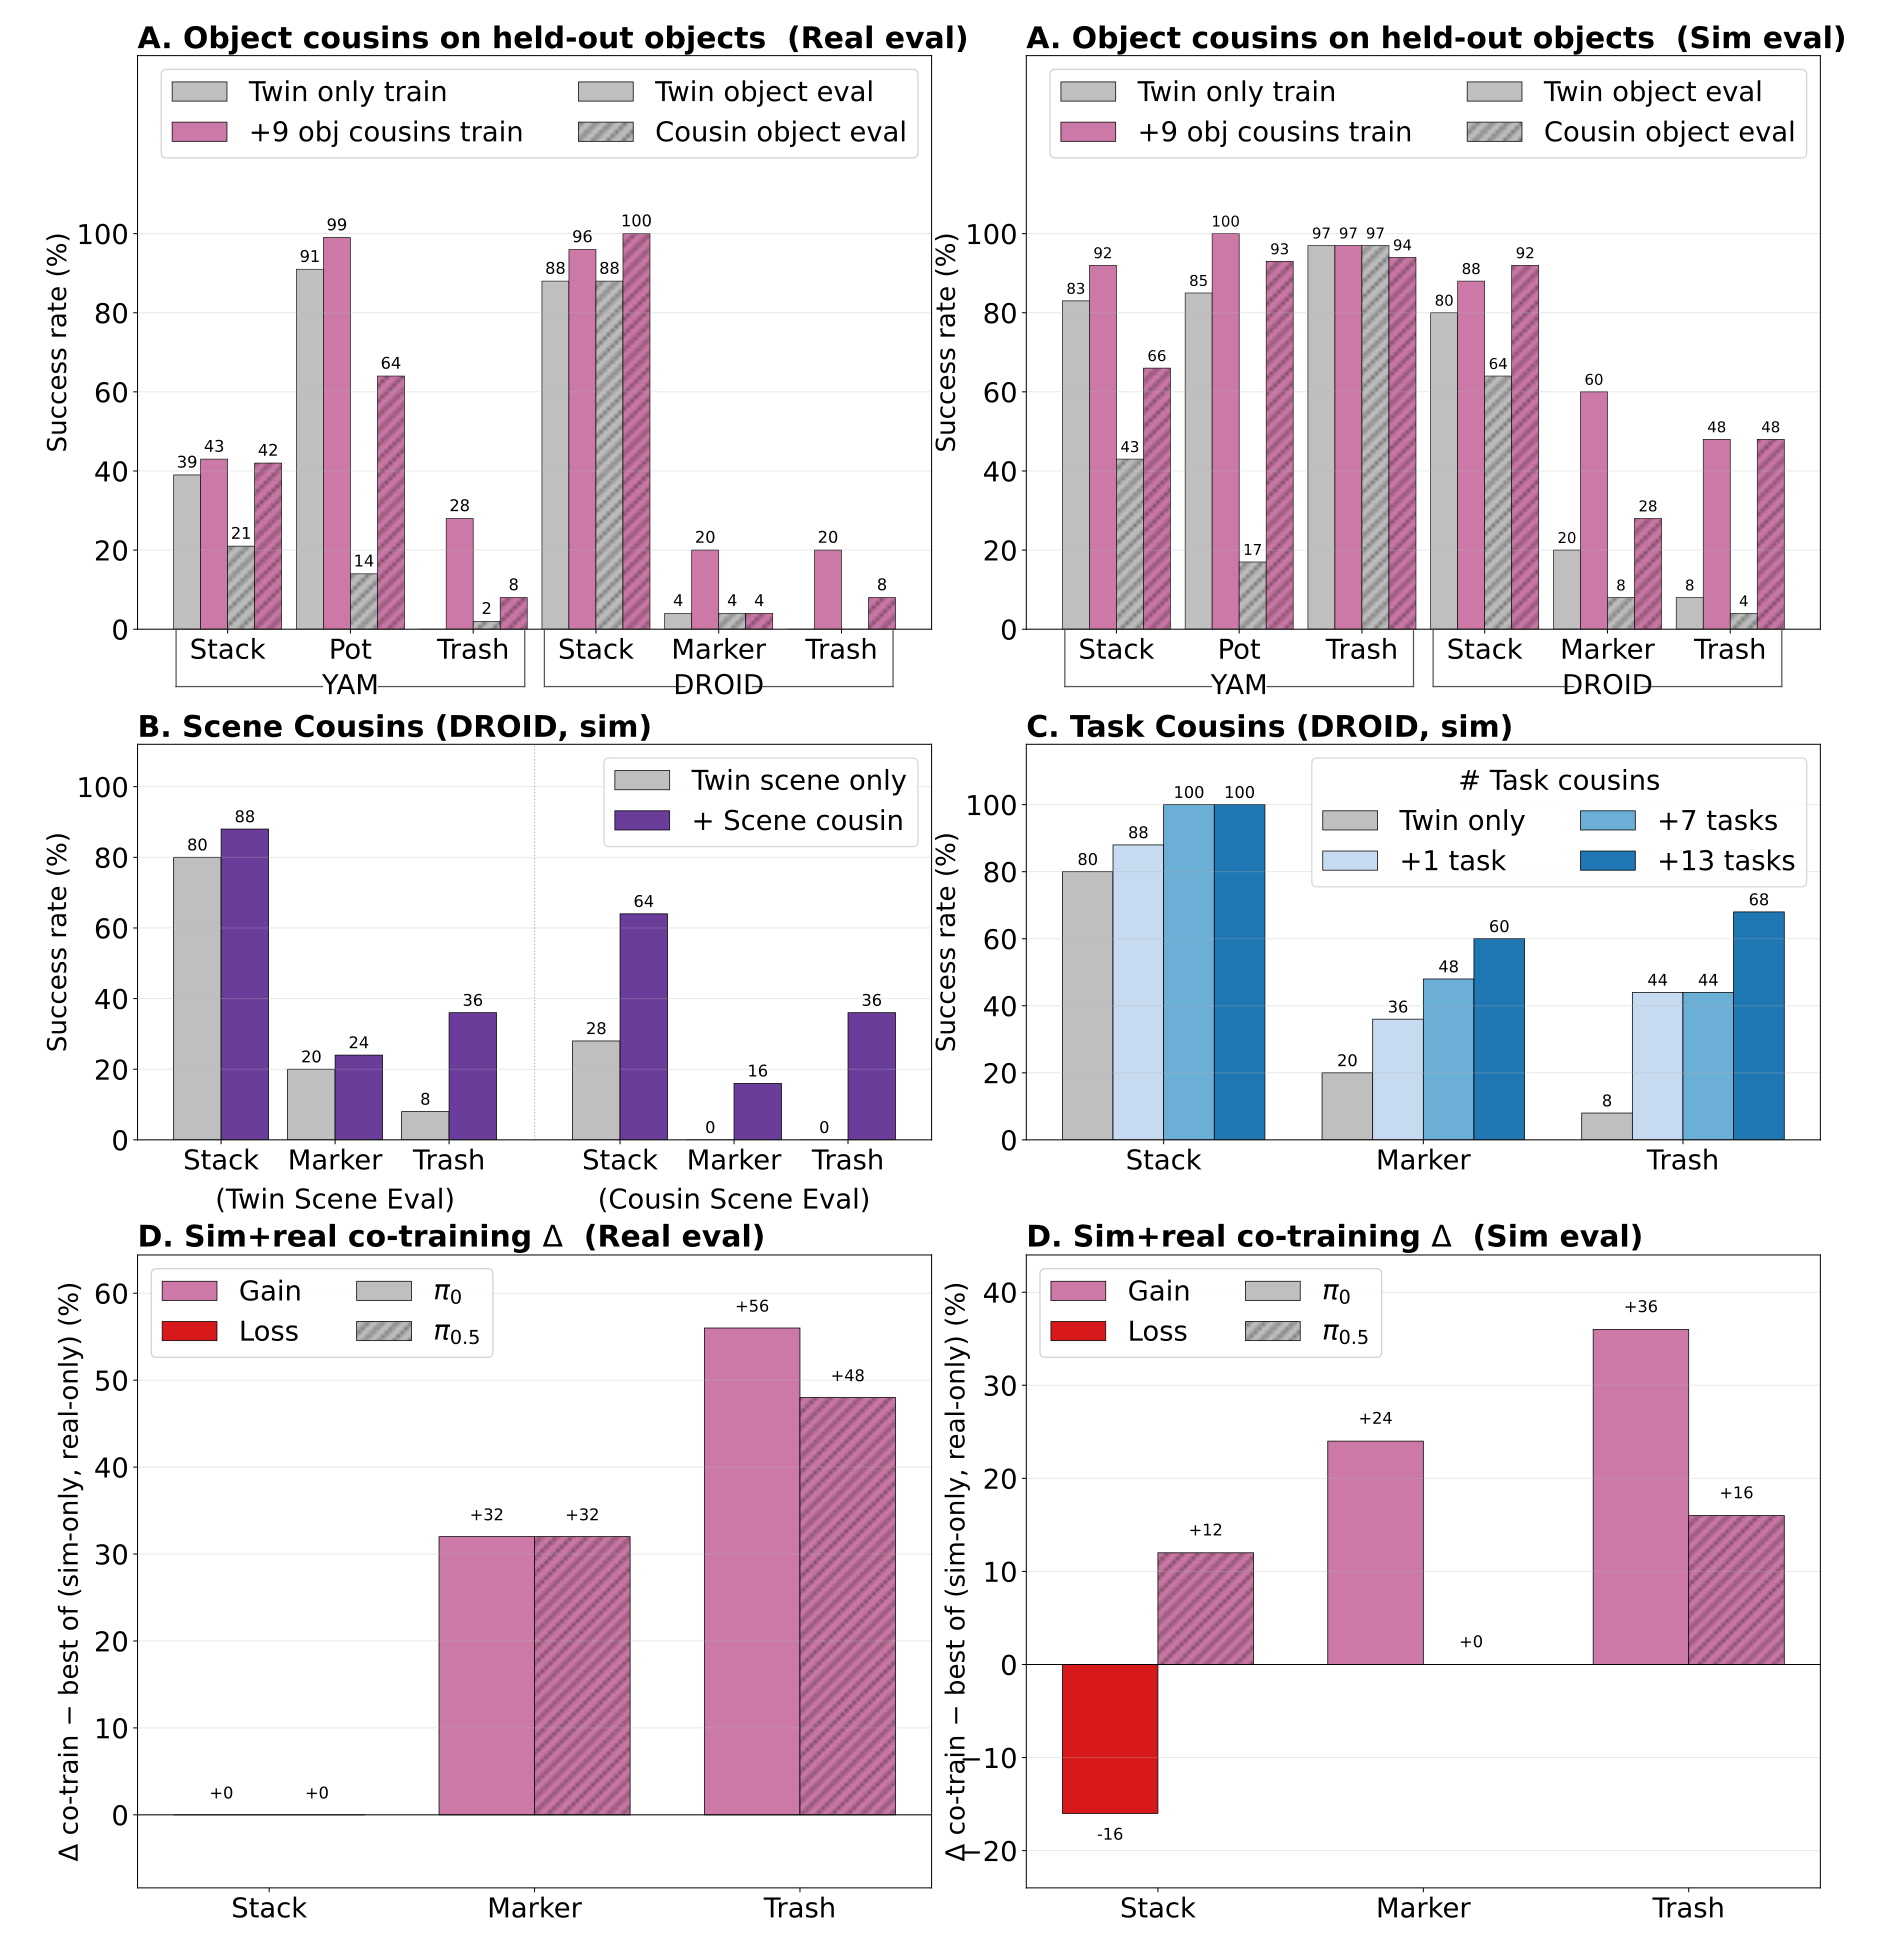
|
Twin
|
9 Cousins
| ||
|
Stack
Dishware
|
Sim Twin | 83 | 92 |
| Sim Cousins | 43 | 66 | |
| Real Twin | 39 | 43 | |
| Real Cousins | 21 | 42 | |
|
Pot On
Stove
|
Sim Twin | 85 | 100 |
| Sim Cousins | 17 | 93 | |
| Real Twin | 91 | 99 | |
| Real Cousins | 14 | 64 | |
|
Throw Away
Trash
|
Sim Twin | 97 | 97 |
| Sim Cousins | 97 | 94 | |
| Real Twin | 0 | 28 | |
| Real Cousins | 2 | 8 |
|
Twin
|
9 Cousins
| ||
|
Stack
Dishware
|
Sim Twin | 80 | 88 |
| Sim Cousins | 64 | 92 | |
| Real Twin | 88 | 96 | |
| Real Cousins | 88 | 100 | |
|
Store
Marker
|
Sim Twin | 20 | 60 |
| Sim Cousins | 8 | 28 | |
| Real Twin | 4 | 20 | |
| Real Cousins | 4 | 4 | |
|
Throw Away
Trash
|
Sim Twin | 8 | 48 |
| Sim Cousins | 4 | 48 | |
| Real Twin | 0 | 20 | |
| Real Cousins | 0 | 8 |
| twin only | + scene cousin | |
| Stack Dishware | 80 | 88 |
| Stack Dishware- cousin | 28 | 64 |
| Store Marker | 20 | 24 |
| Store Marker- cousin | 0 | 16 |
| Throw Away Trash | 8 | 36 |
| Throw Away Trash- cousin | 0 | 36 |
| twin only | +1 task | +7 tasks | +13 tasks | |
| Stack Dishware | 80 | 88 | 100 | 100 |
| Store Marker | 20 | 36 | 48 | 60 |
| Throw Away Trash | 8 | 44 | 44 | 68 |
| -S | -R | -co-train | -S | -R | -co-train | |
| Stack Dishware- Sim | 92 | 34 | 76 | 88 | 64 | 100 |
| Stack Dishware- Real | 96 | 100 | 100 | 96 | 100 | 100 |
| Store Marker- Sim | 16 | 4 | 40 | 60 | 20 | 60 |
| Store Marker- Real | 4 | 48 | 80 | 20 | 60 | 92 |
| Throw Away Trash- Sim | 0 | 0 | 36 | 48 | 4 | 60 |
| Throw Away Trash- Real | 0 | 20 | 76 | 20 | 48 | 96 |
G.3 Detailed Object Cousin Ablation
A bimanual ablation fixes the budget at one thousand demonstrations and splits it evenly across the twin plus zero, one, three or nine cousins. Results aggregate twenty-five trials with paired sampled initializations in sim and reality. More cousins generally improve robustness, but Table G.8 includes nonmonotonic task/setting outcomes.
|
Twin
|
1 Cousin
|
3 Cousins
|
9 Cousins
| ||
|
Stack
Dishware
|
Sim Twin | 83 | 89 | 100 | 92 |
| Sim Cousins | 43 | 44 | 65 | 66 | |
| Real Twin | 39 | 41 | 37 | 43 | |
| Real Cousins | 21 | 32 | 27 | 42 | |
|
Pot On
Stove
|
Sim Twin | 85 | 100 | 93 | 100 |
| Sim Cousins | 17 | 27 | 35 | 93 | |
| Real Twin | 91 | 100 | 94 | 99 | |
| Real Cousins | 14 | 38 | 16 | 64 | |
|
Throw Away
Trash
|
Sim Twin | 97 | 98 | 98 | 97 |
| Sim Cousins | 97 | 100 | 97 | 94 | |
| Real Twin | 0 | 9 | 45 | 28 | |
| Real Cousins | 2 | 17 | 14 | 8 |
Appendix H Policy Details
Policy construction combines human seed demonstrations, trajectory augmentation, domain randomization and simulator-based checkpoint selection.
H.1 Data Generation Details
Approximately ten to fifteen human demonstrations seed MimicGen augmentation. Randomization covers materials and camera poses, plus table height in DROID. The thirteen-task example instead specifies ten seeds and one hundred generated demonstrations per task.
H.2 Policy Training Details
DROID joint-position π0/π0.5 checkpoints are finetuned for 10,000 steps with batch 256 and learning rate 10⁻⁵, evaluated in simulation every thousand steps; the best simulated checkpoint is tested in reality. YAM flow-matching policies train for 40,000 steps using proprioception and top/wrist RGB, with joint-position and gripper actions and analogous checkpoint selection.
Real-to-Sim Policy Details and Selection.
The harder real-to-sim tasks finetune π0, π0.5 and GR00T N1.6; the four simpler tasks also include unadapted GR00T N1.7 and DreamZero. All output joint/gripper positions. Simulation-based checkpoint selection precedes the reported physical evaluation.
Appendix I Robot Platform and Task Details
This appendix specifies the two robot platforms and every original language instruction and completion criterion.
I.1 Robot Embodiments.
DROID combines a Franka Panda, two external ZED-2 views and a wrist ZED-Mini on a portable desk, with Oculus teleoperation. Joint-position control is used in both domains, but simulator gains are increased to reduce tracking error. YAM has two arms, wrist RealSense D405 cameras, an external top-down view, JoyLo teleoperation and joint-position control.
I.2 Task Rubric
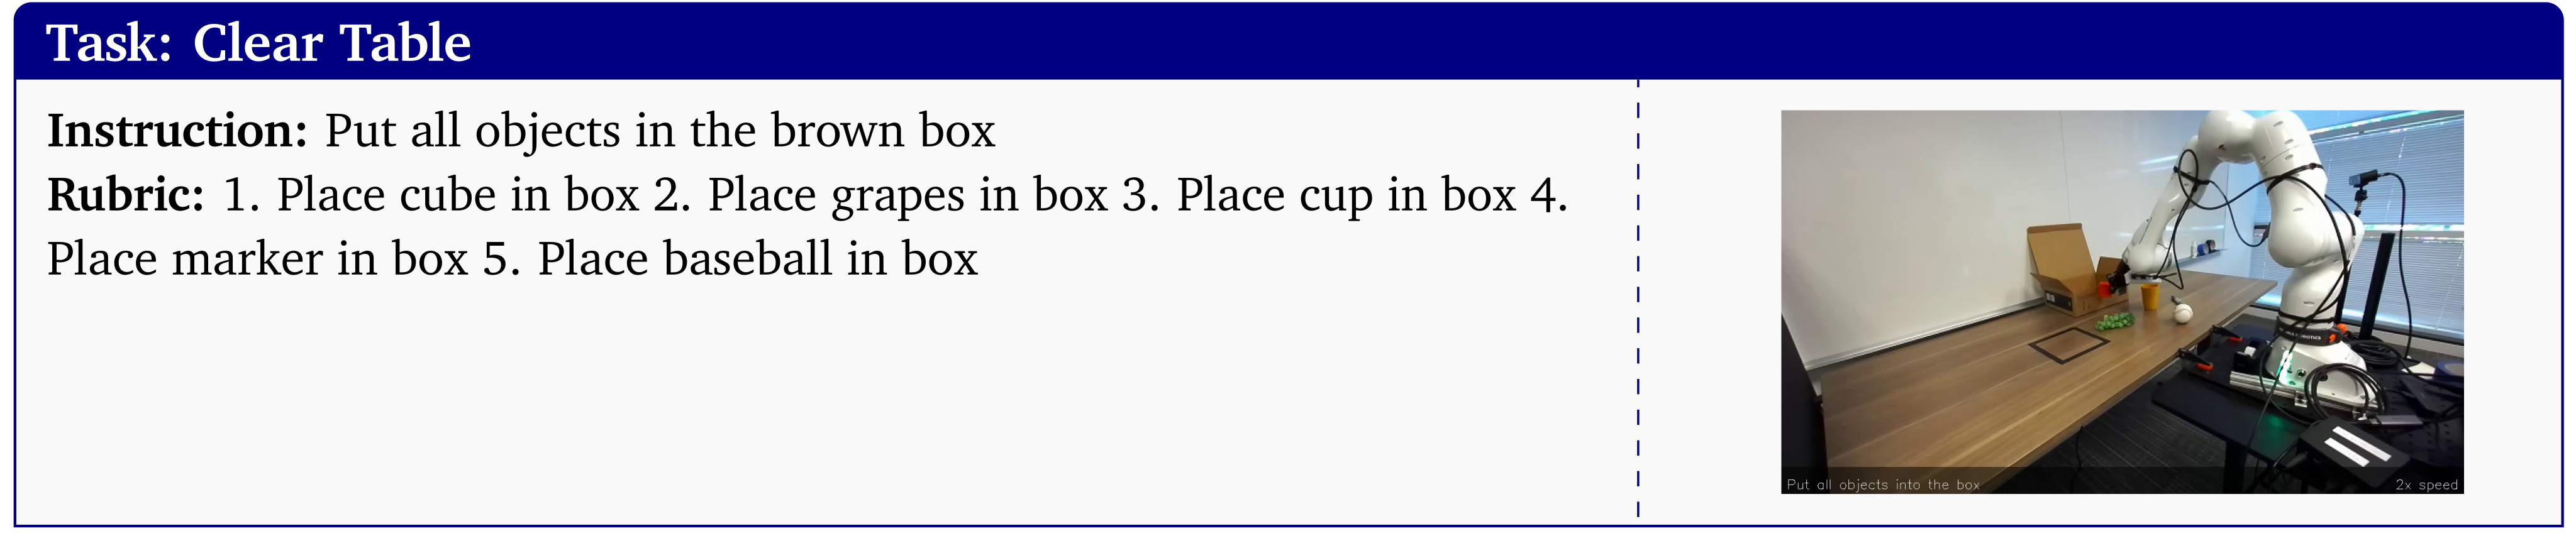
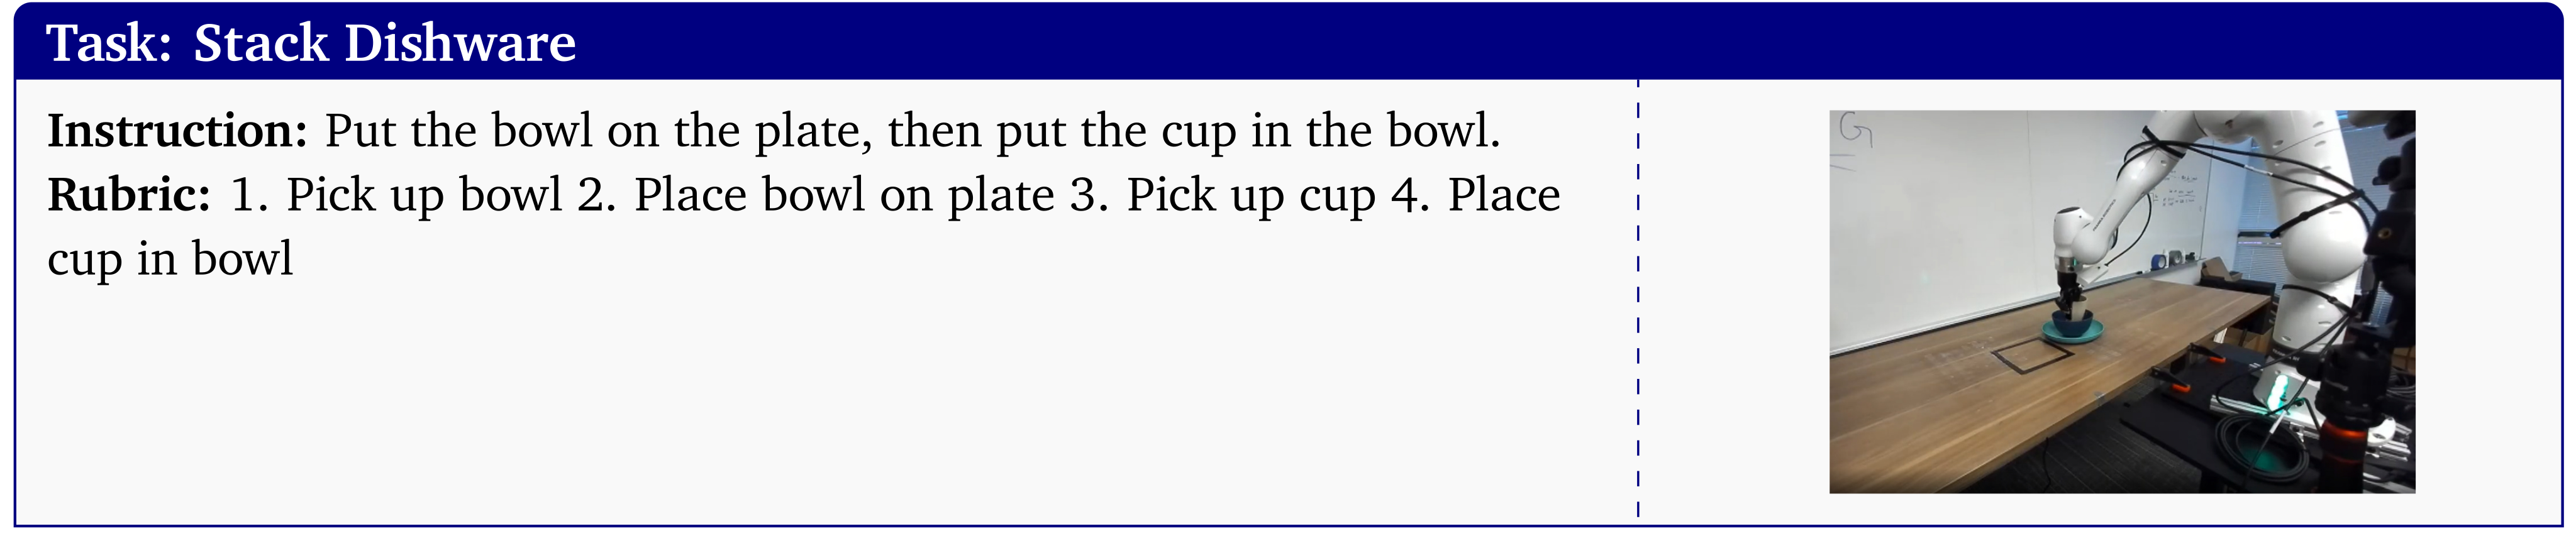
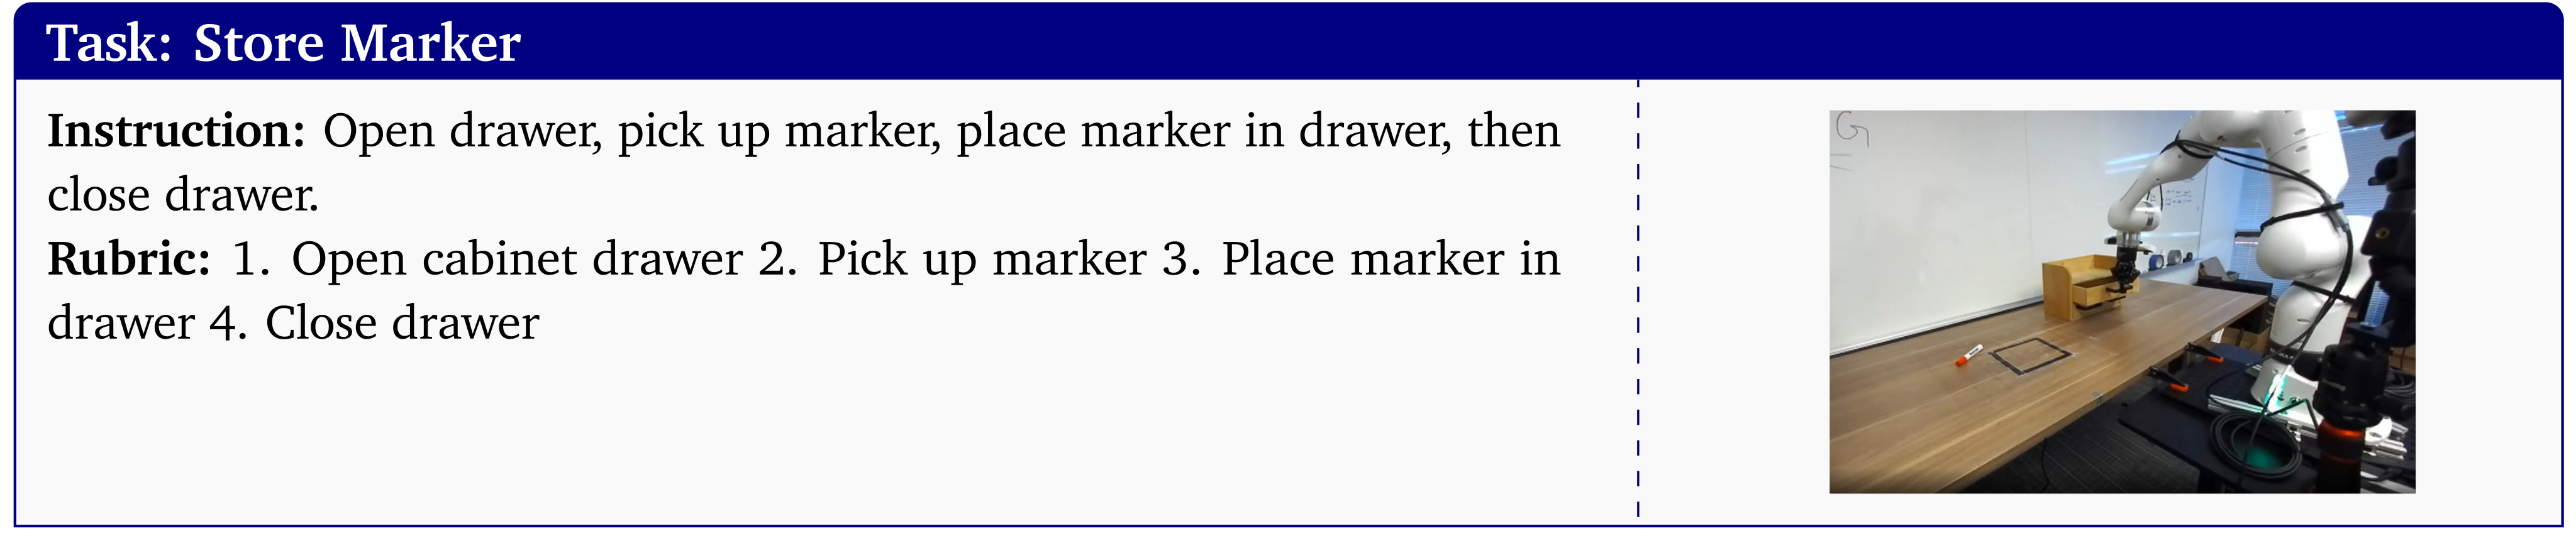
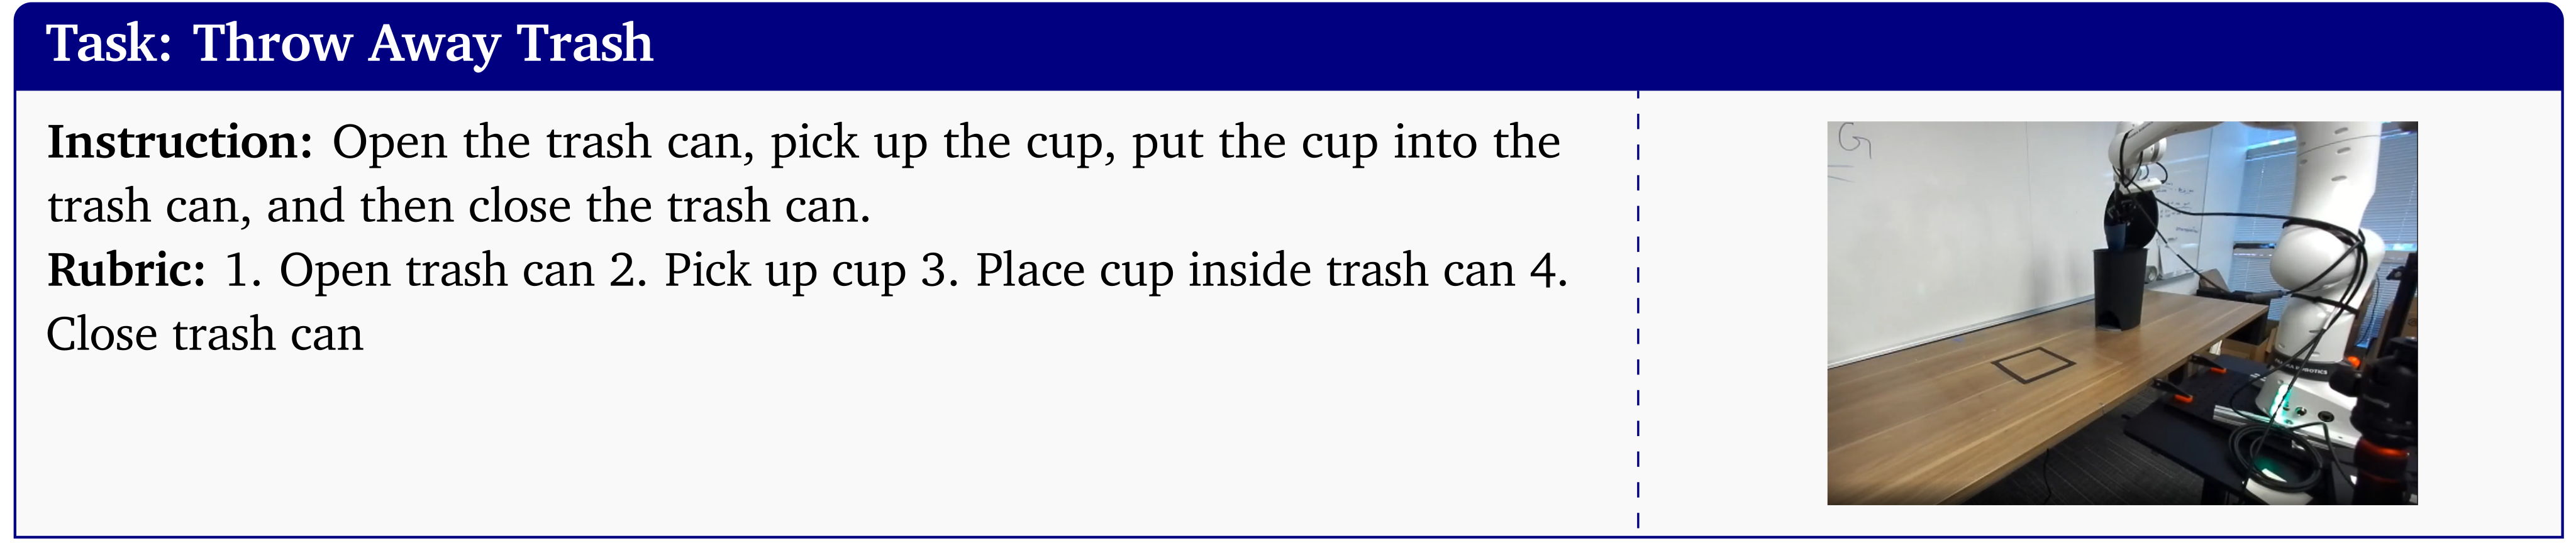
The eight original illustrated task rubrics are retained below. Main success requires every listed subtask; only the explicitly separate subtask-evaluation study starts from partially completed states. Tasks cover placement, multi-object cleanup, stacking, opening/filling/closing receptacles and bimanual pot transfer.
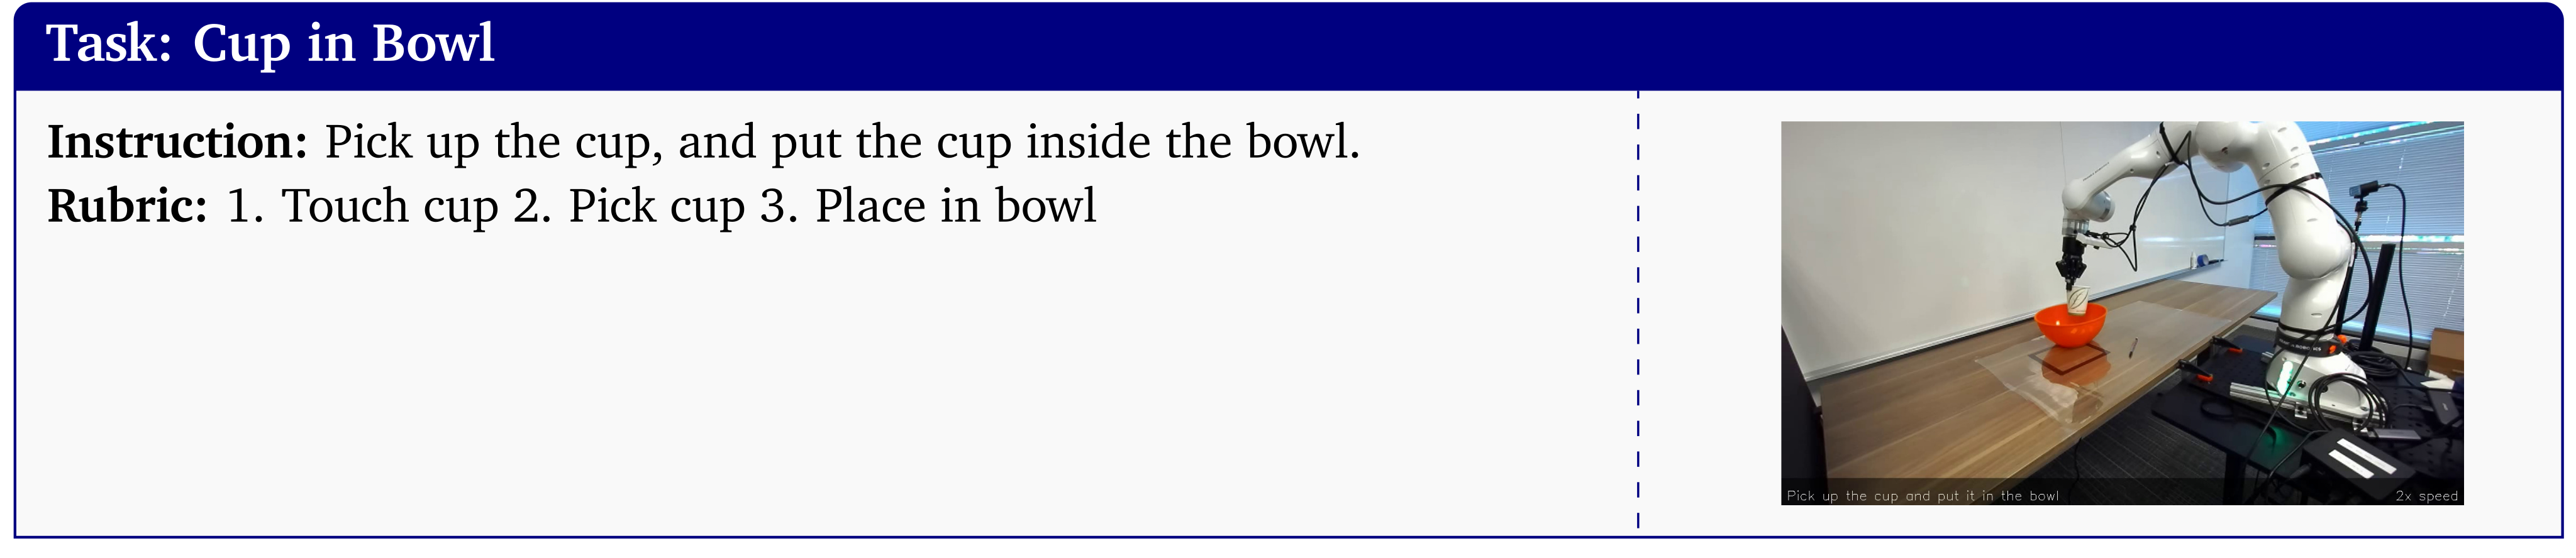
Selectable original task instruction and goal
Task: Cup in Bowl Instruction: Pick up the cup, and put the cup inside the bowl. Rubric: 1. Touch cup 2. Pick cup 3. Place in bowl
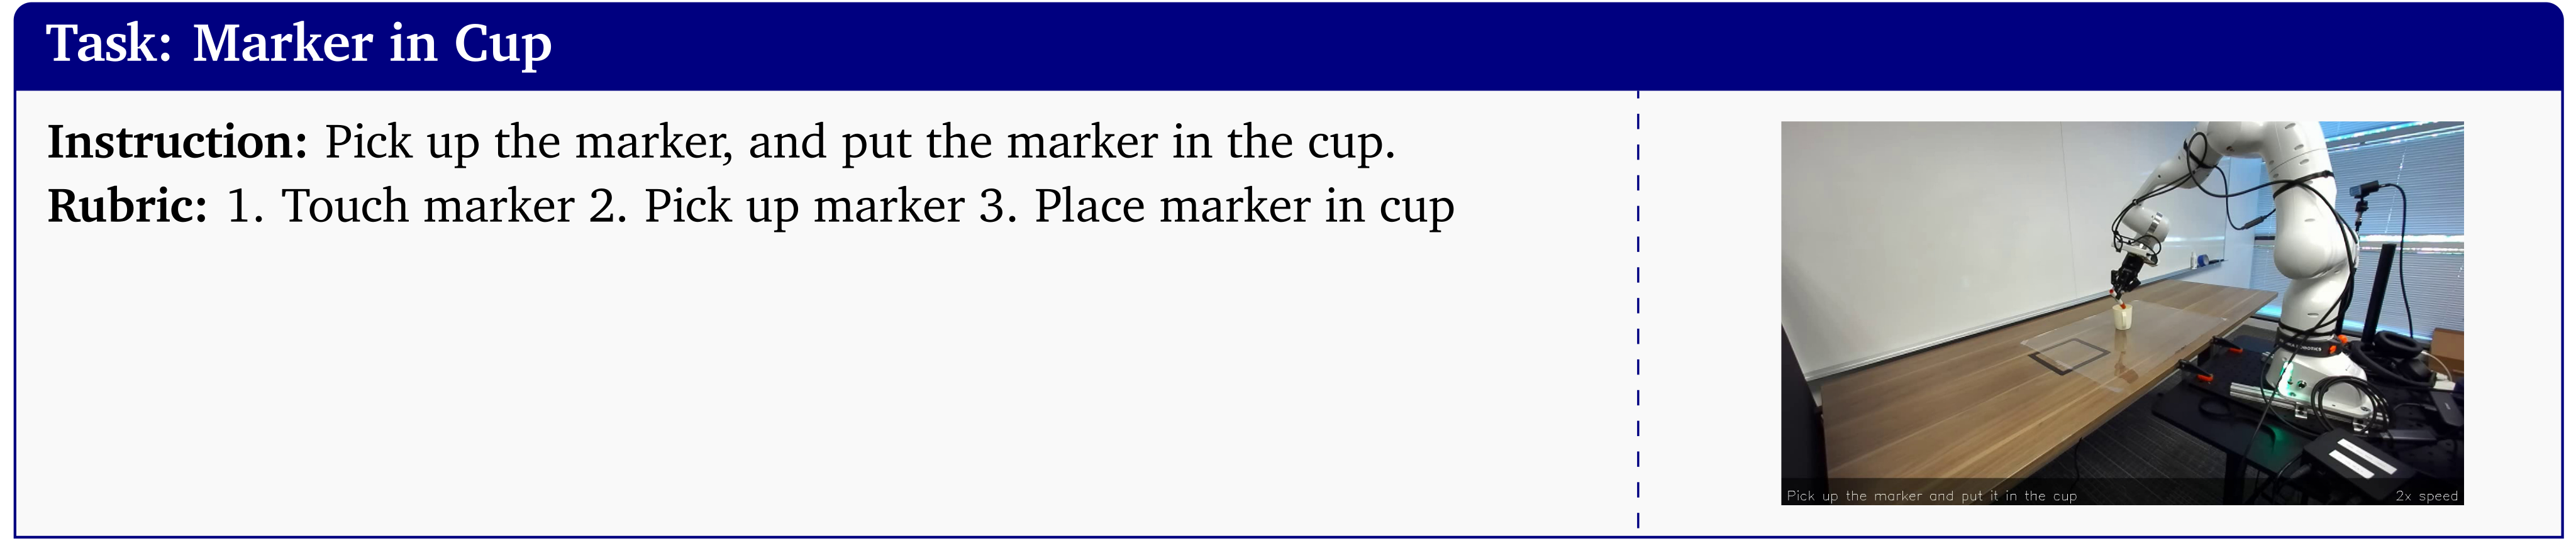
Selectable original task instruction and goal
Task: Marker in Cup Instruction: Pick up the marker, and put the marker in the cup. Rubric: 1. Touch marker 2. Pick up marker 3. Place marker in cup
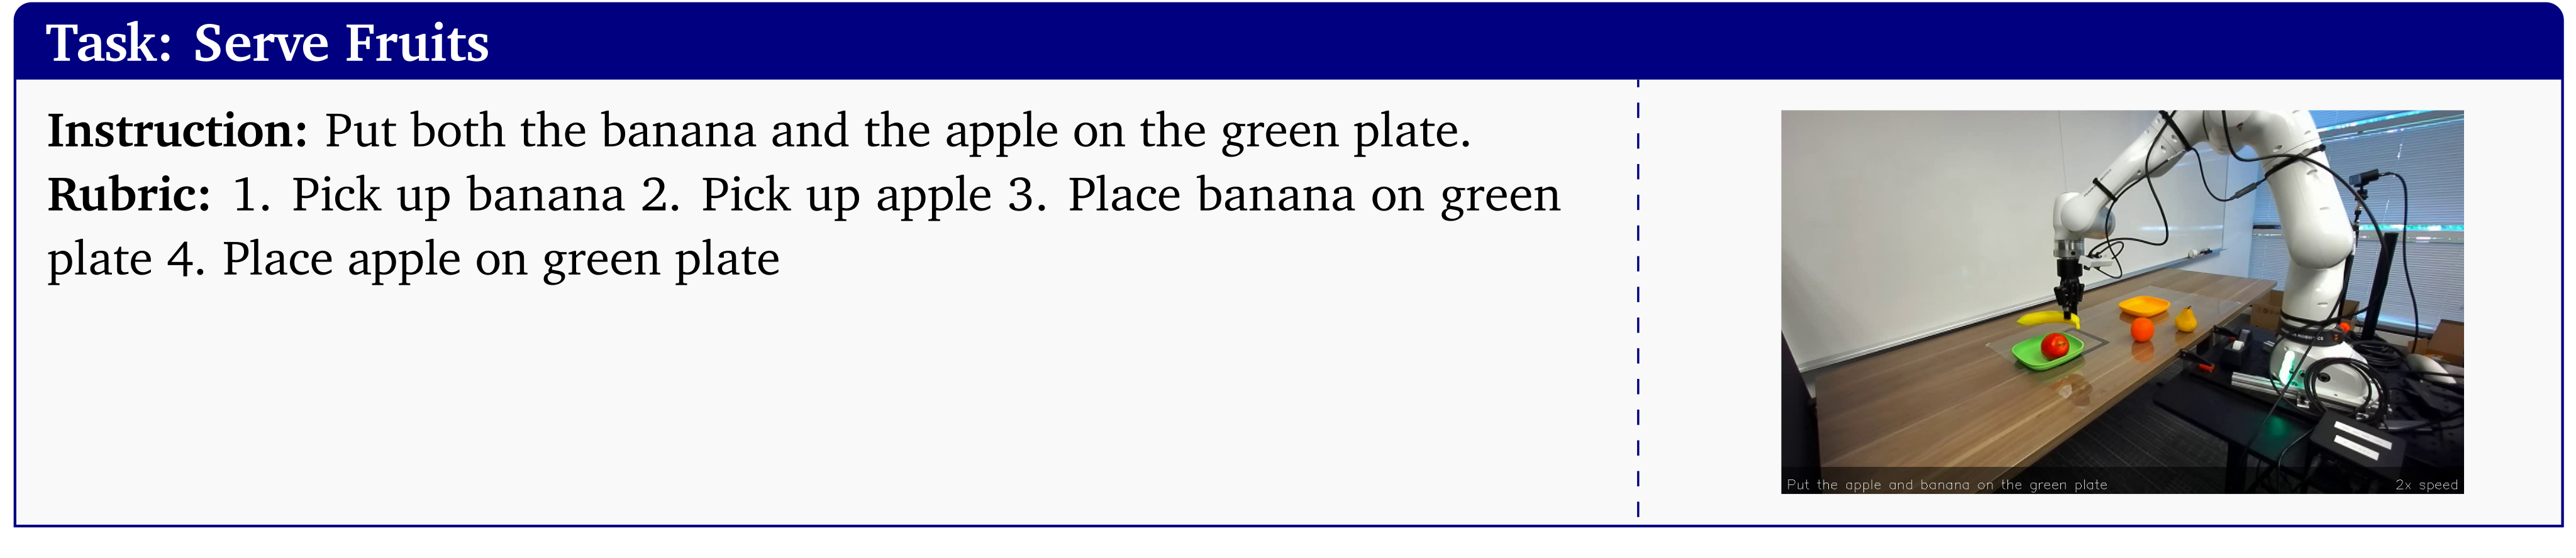
Selectable original task instruction and goal
Task: Serve Fruits Instruction: Put both the banana and the apple on the green plate. Rubric: 1. Pick up banana 2. Pick up apple 3. Place banana on green plate 4. Place apple on green plate
Selectable original task instruction and goal
Task: Clear Table Instruction: Put all objects in the brown box Rubric: 1. Place cube in box 2. Place grapes in box 3. Place cup in box 4. Place marker in box 5. Place baseball in box
Selectable original task instruction and goal
Task: Stack Dishware Instruction: Put the bowl on the plate, then put the cup in the bowl. Rubric: 1. Pick up bowl 2. Place bowl on plate 3. Pick up cup 4. Place cup in bowl
Selectable original task instruction and goal
Task: Store Marker Instruction: Open drawer, pick up marker, place marker in drawer, then close drawer. Rubric: 1. Open cabinet drawer 2. Pick up marker 3. Place marker in drawer 4. Close drawer
Selectable original task instruction and goal
Task: Throw Away Trash Instruction: Open the trash can, pick up the cup, put the cup into the trash can, and then close the trash can. Rubric: 1. Open trash can 2. Pick up cup 3. Place cup inside trash can 4. Close trash can
Selectable original task instruction and goal
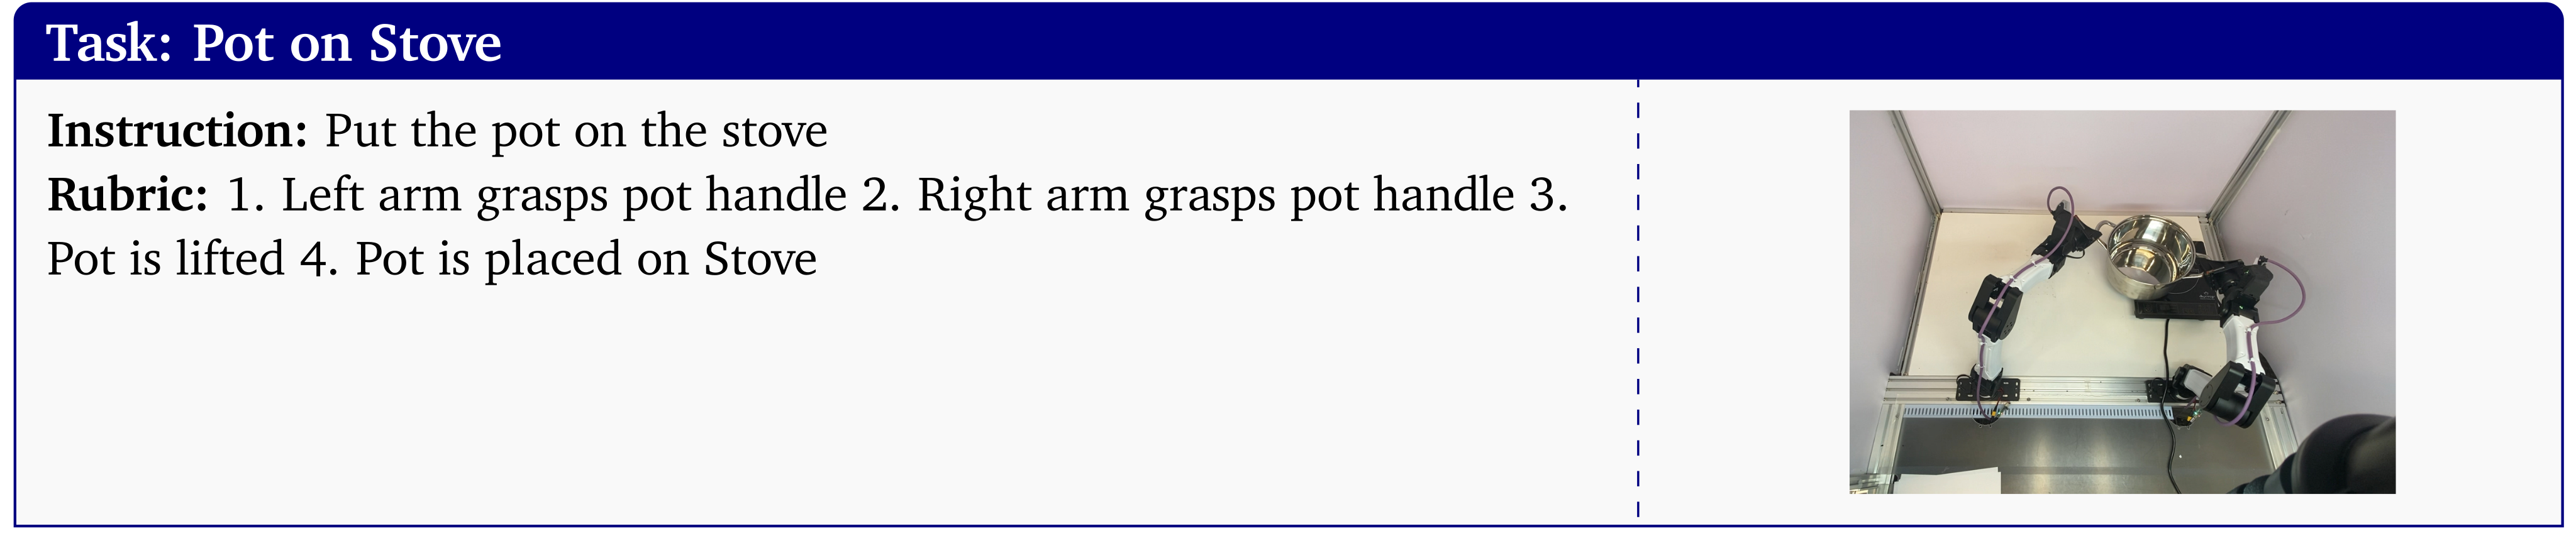
Task: Pot on Stove Instruction: Put the pot on the stove Rubric: 1. Left arm grasps pot handle 2. Right arm grasps pot handle 3. Pot is lifted 4. Pot is placed on Stove
Appendix J Real-to-Sim Policy Evaluations
The evaluation protocol controls reset distributions, action interfaces and checkpoint identity while documenting simulator-specific reconstruction choices.
J.1 Evaluation Protocol
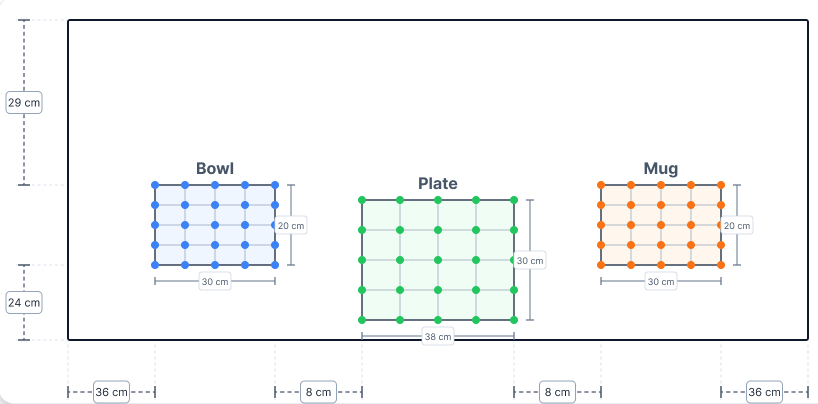
Each task uses twenty-five rollouts. Each object’s reset range is divided into a five-by-five grid; positions are sampled independently without replacement, with sampled rotations held fixed across checkpoints. Real/sim ranges match, but exact positions need not coincide, intentionally testing distributional rather than state-identical correspondence.
J.2 Metrics
Main scores are binary complete-task successes. Pearson correlation and mean maximum rank violation summarize their cross-policy relationship between reality and simulation.
Real-to-Sim evaluation metrics.
Pearson measures centered linear score agreement, while MMRV averages the largest real-score gap involved in a simulator-induced ranking inversion for each policy. Both exact formulas remain below. High correlation need not imply calibrated absolute success, and the finite set of evaluated policies defines the reported statistic.
Equations 1–2
| (1) |
| (2) |
J.3 PolaRiS Real-to-Sim Experiment Details
PolaRiS supplies a DROID-centered scene composer and Isaac Sim evaluation workflow. The comparison recreates the same tasks and tests existing policies without simulator-specific finetuning.
J.3.1 PolaRiS Custom Environment Creation
Background video is processed with COLMAP and 2D Gaussian Splatting to create a splat/mesh. Some reconstructed scenes reuse SimFoundry object assets, which are manually positioned in PolaRiS to match real initial conditions.
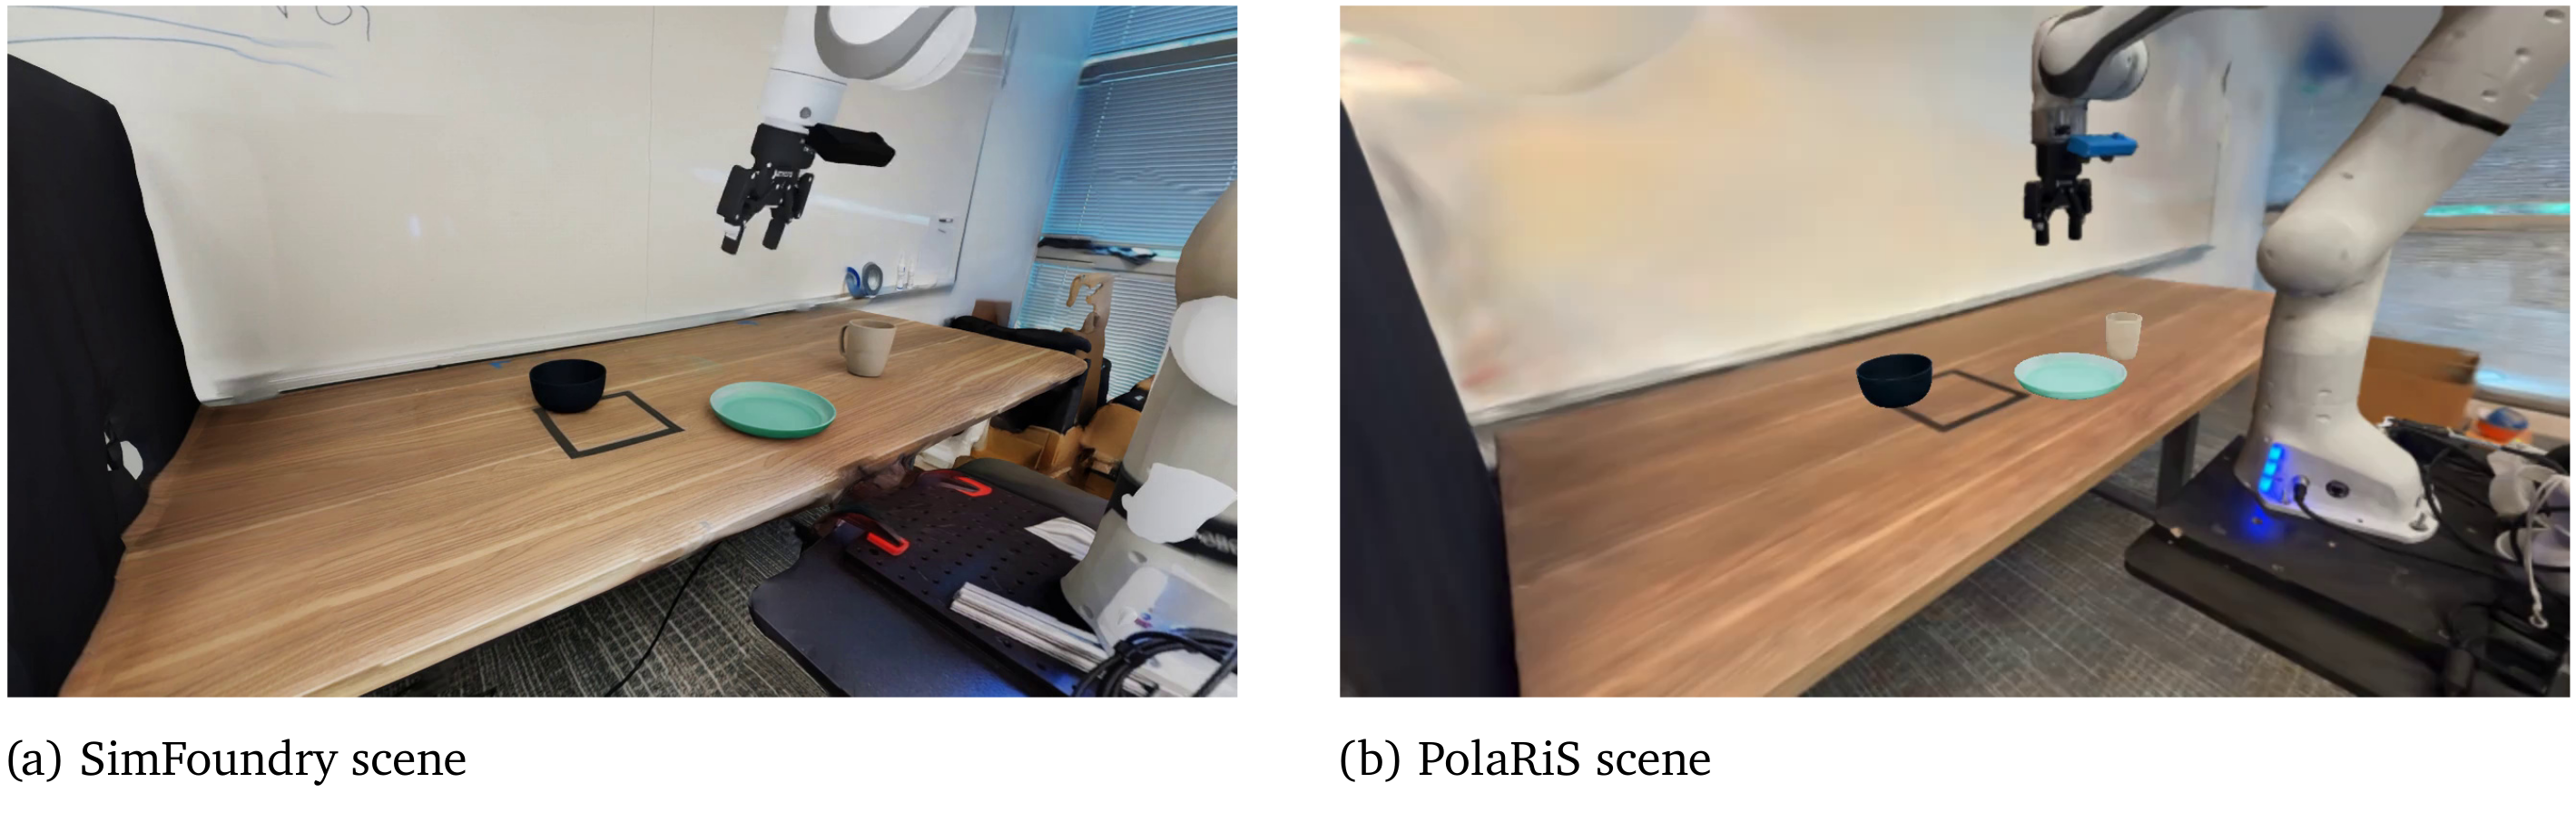
Selectable original panel labels
(a) SimFoundry scene
(b) PolaRiS scene
J.3.2 PolaRiS Modification
The implementation is modified to load textures/poses correctly, adds an invisible tabletop collider to prevent objects rolling on an uneven mesh, and manually matches the external policy camera orientation.
J.3.3 Real-to-Sim Policy Evaluations in PolaRiS
PolaRiS runs the same task initializations, checkpoint families and rollout protocol, including difficult-task finetuned models. The comparison therefore evaluates these specific reconstructed/customized environments.
J.3.4 PolaRiS Results Analysis
PolaRiS underpredicts success in the tested scenes. Its released π0.5 checkpoint shallowly adapted with ten-percent simulation/ninety-percent DROID data performs better, but is excluded because the main comparison prohibits simulator-specific policy adaptation.
Appendix K Human Interaction
Optional human tools expose intermediate outputs for targeted corrections and scene refinement.
K.1 Human Intervention Details
The GUI permits object-extraction constraints and quick mesh pose/scale edits. Automation is a supported mode, while these corrections were used in the reported robotics workflow.
K.2 Interactive Pose Refinement
Pose refinement adjusts a similarity transform: three translations, three rotations and one isotropic scale.
Initialization from the automatic estimate.
Editing starts from the automatic estimate with the same depth/inpainted-image point cloud used for initial pose matching. Each object can be accepted unchanged or refined separately.
Overlay visualization.
The mesh overlays the scene cloud; toggling or thinning the displayed cloud exposes alignment errors without changing the estimated geometry.
Manual Adjustment
Keyboard commands change pose/scale with adjustable translation/rotation steps. Saving serializes the replacement transform for future runs.
Iterative refinement across sessions.
Each refinement pass writes a new output, preserving automatic and earlier manual versions for comparisons or rollback. The workflow supports repeated editing sessions rather than destructive replacement.
Use Cases.
Manual refinement is used primarily for real-to-sim evaluation alignment. The authors find it less useful for sim-to-real data generation when randomized object ranges already cover physical test conditions.
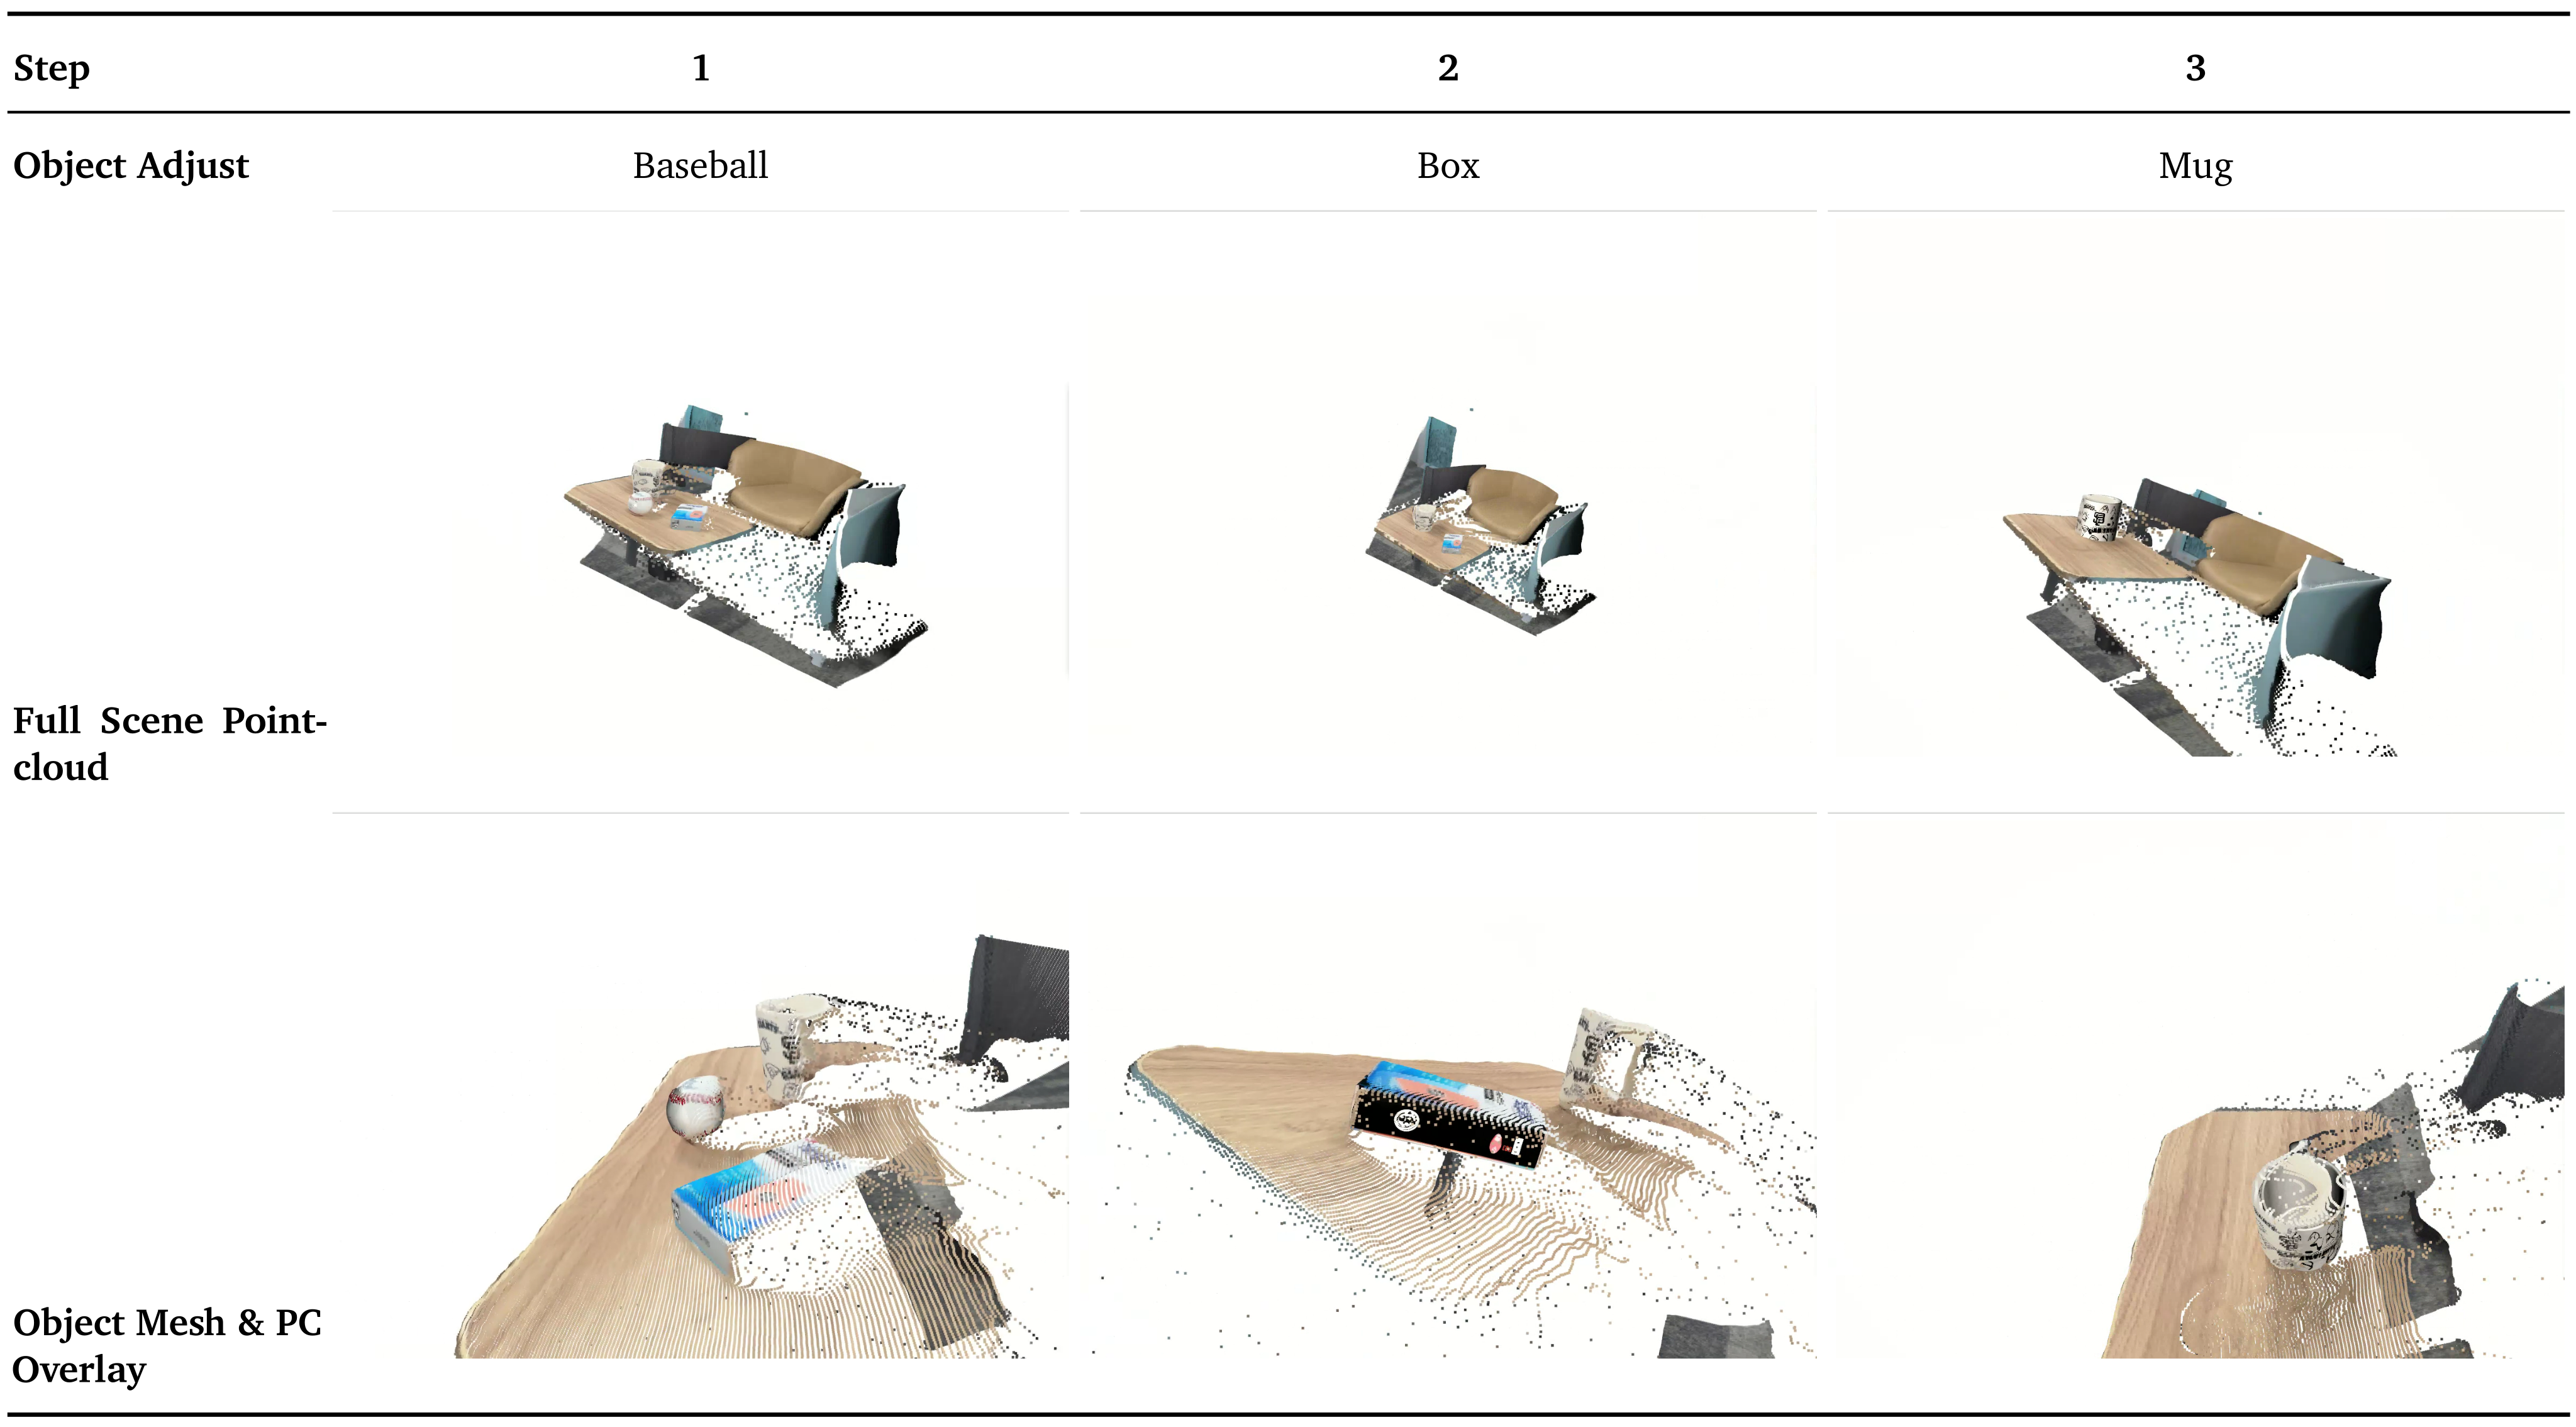
Selectable original table labels and values
| Step | 1 | 2 | 3 |
| Object Adjust | Baseball | Box | Mug |
| Full Scene Pointcloud | |||
| Object Mesh & PC Overlay |
Appendix L System Analysis
System analysis separates foreground reconstruction, human refinement, throughput and background registration/fidelity.
L.1 3D Reconstruction Evaluation Details
Twelve YCB tabletop scenes are grouped by occlusion difficulty. Geometry is evaluated against staged quasi-ground truth, with SAM3D transformed into a shared frame and scale.
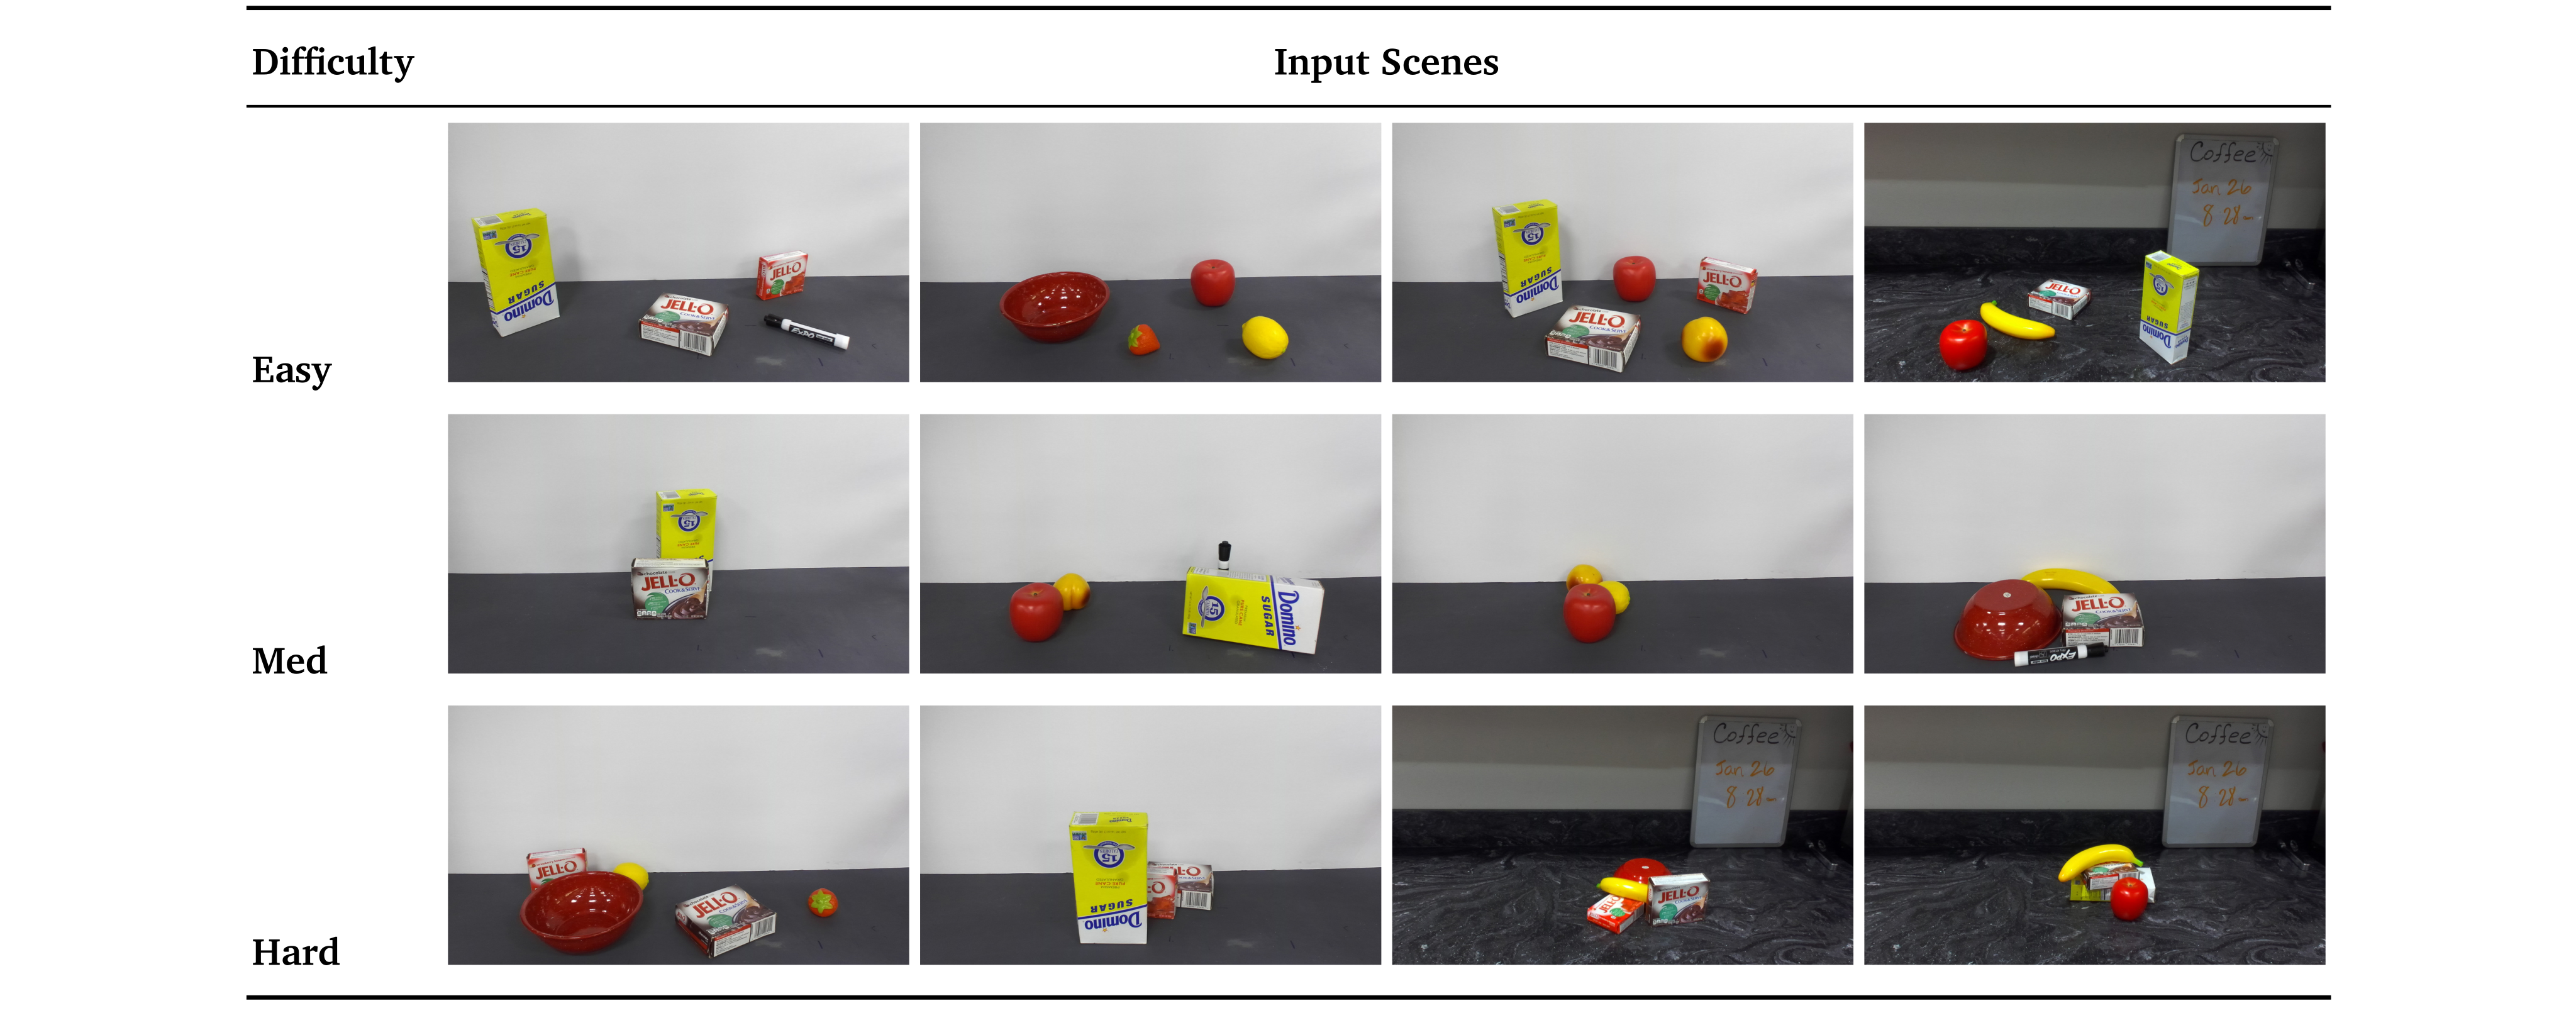
Selectable original table labels and values
| Difficulty | Input Scenes | |||
| Easy | ||||
| Med | ||||
| Hard | ||||
L.1.1 Quasi-Ground-Truth Scene Reconstruction
Objects are placed incrementally from back to front. FoundationPose estimates each pose while it is unoccluded using its known CAD mesh; these estimates become quasi-ground truth. Both reconstruction methods later see only the final occluded scene. The benchmark reference is itself estimated rather than independent precision metrology.
L.1.2 SAM3D Reconstruction Pipeline
SAM3D geometry/relative poses are converted to the camera convention and common world transform. A single scene-level scale is chosen by minimizing Chamfer distance against the ground-truth cloud. This resolves scale ambiguity using reference information rather than testing SAM3D’s raw metric-scale prediction.
L.1.3 Quantitative Reconstruction Results
Table L.2 reports Chamfer distance, F1 at a one-centimeter threshold and object bounding-box position error, with means and standard deviations. Automatic SimFoundry generally improves the aligned SAM3D baseline, although hard-scene Chamfer distance is slightly worse (.0091 versus .0088 meters); three-minute-per-object manual refinement improves its geometry further.
| Difficulty | Metric | SAM3D Zero Shot | SimFoundry Zero Shot | SimFoundry Tuned (3min/Obj) |
| Easy | Chamfer Dist (m) | |||
| F1 Score | ||||
| Pos Error (m) | ||||
| Medium | Chamfer Dist (m) | |||
| F1 Score | ||||
| Pos Error (m) | ||||
| Hard | Chamfer Dist (m) | |||
| F1 Score | ||||
| Pos Error (m) |
L.1.4 Qualitative Reconstruction Results
Table L.3 preserves all twelve real, SAM3D, automatic SimFoundry and manually refined reconstruction comparisons across easy, medium and hard occlusion.
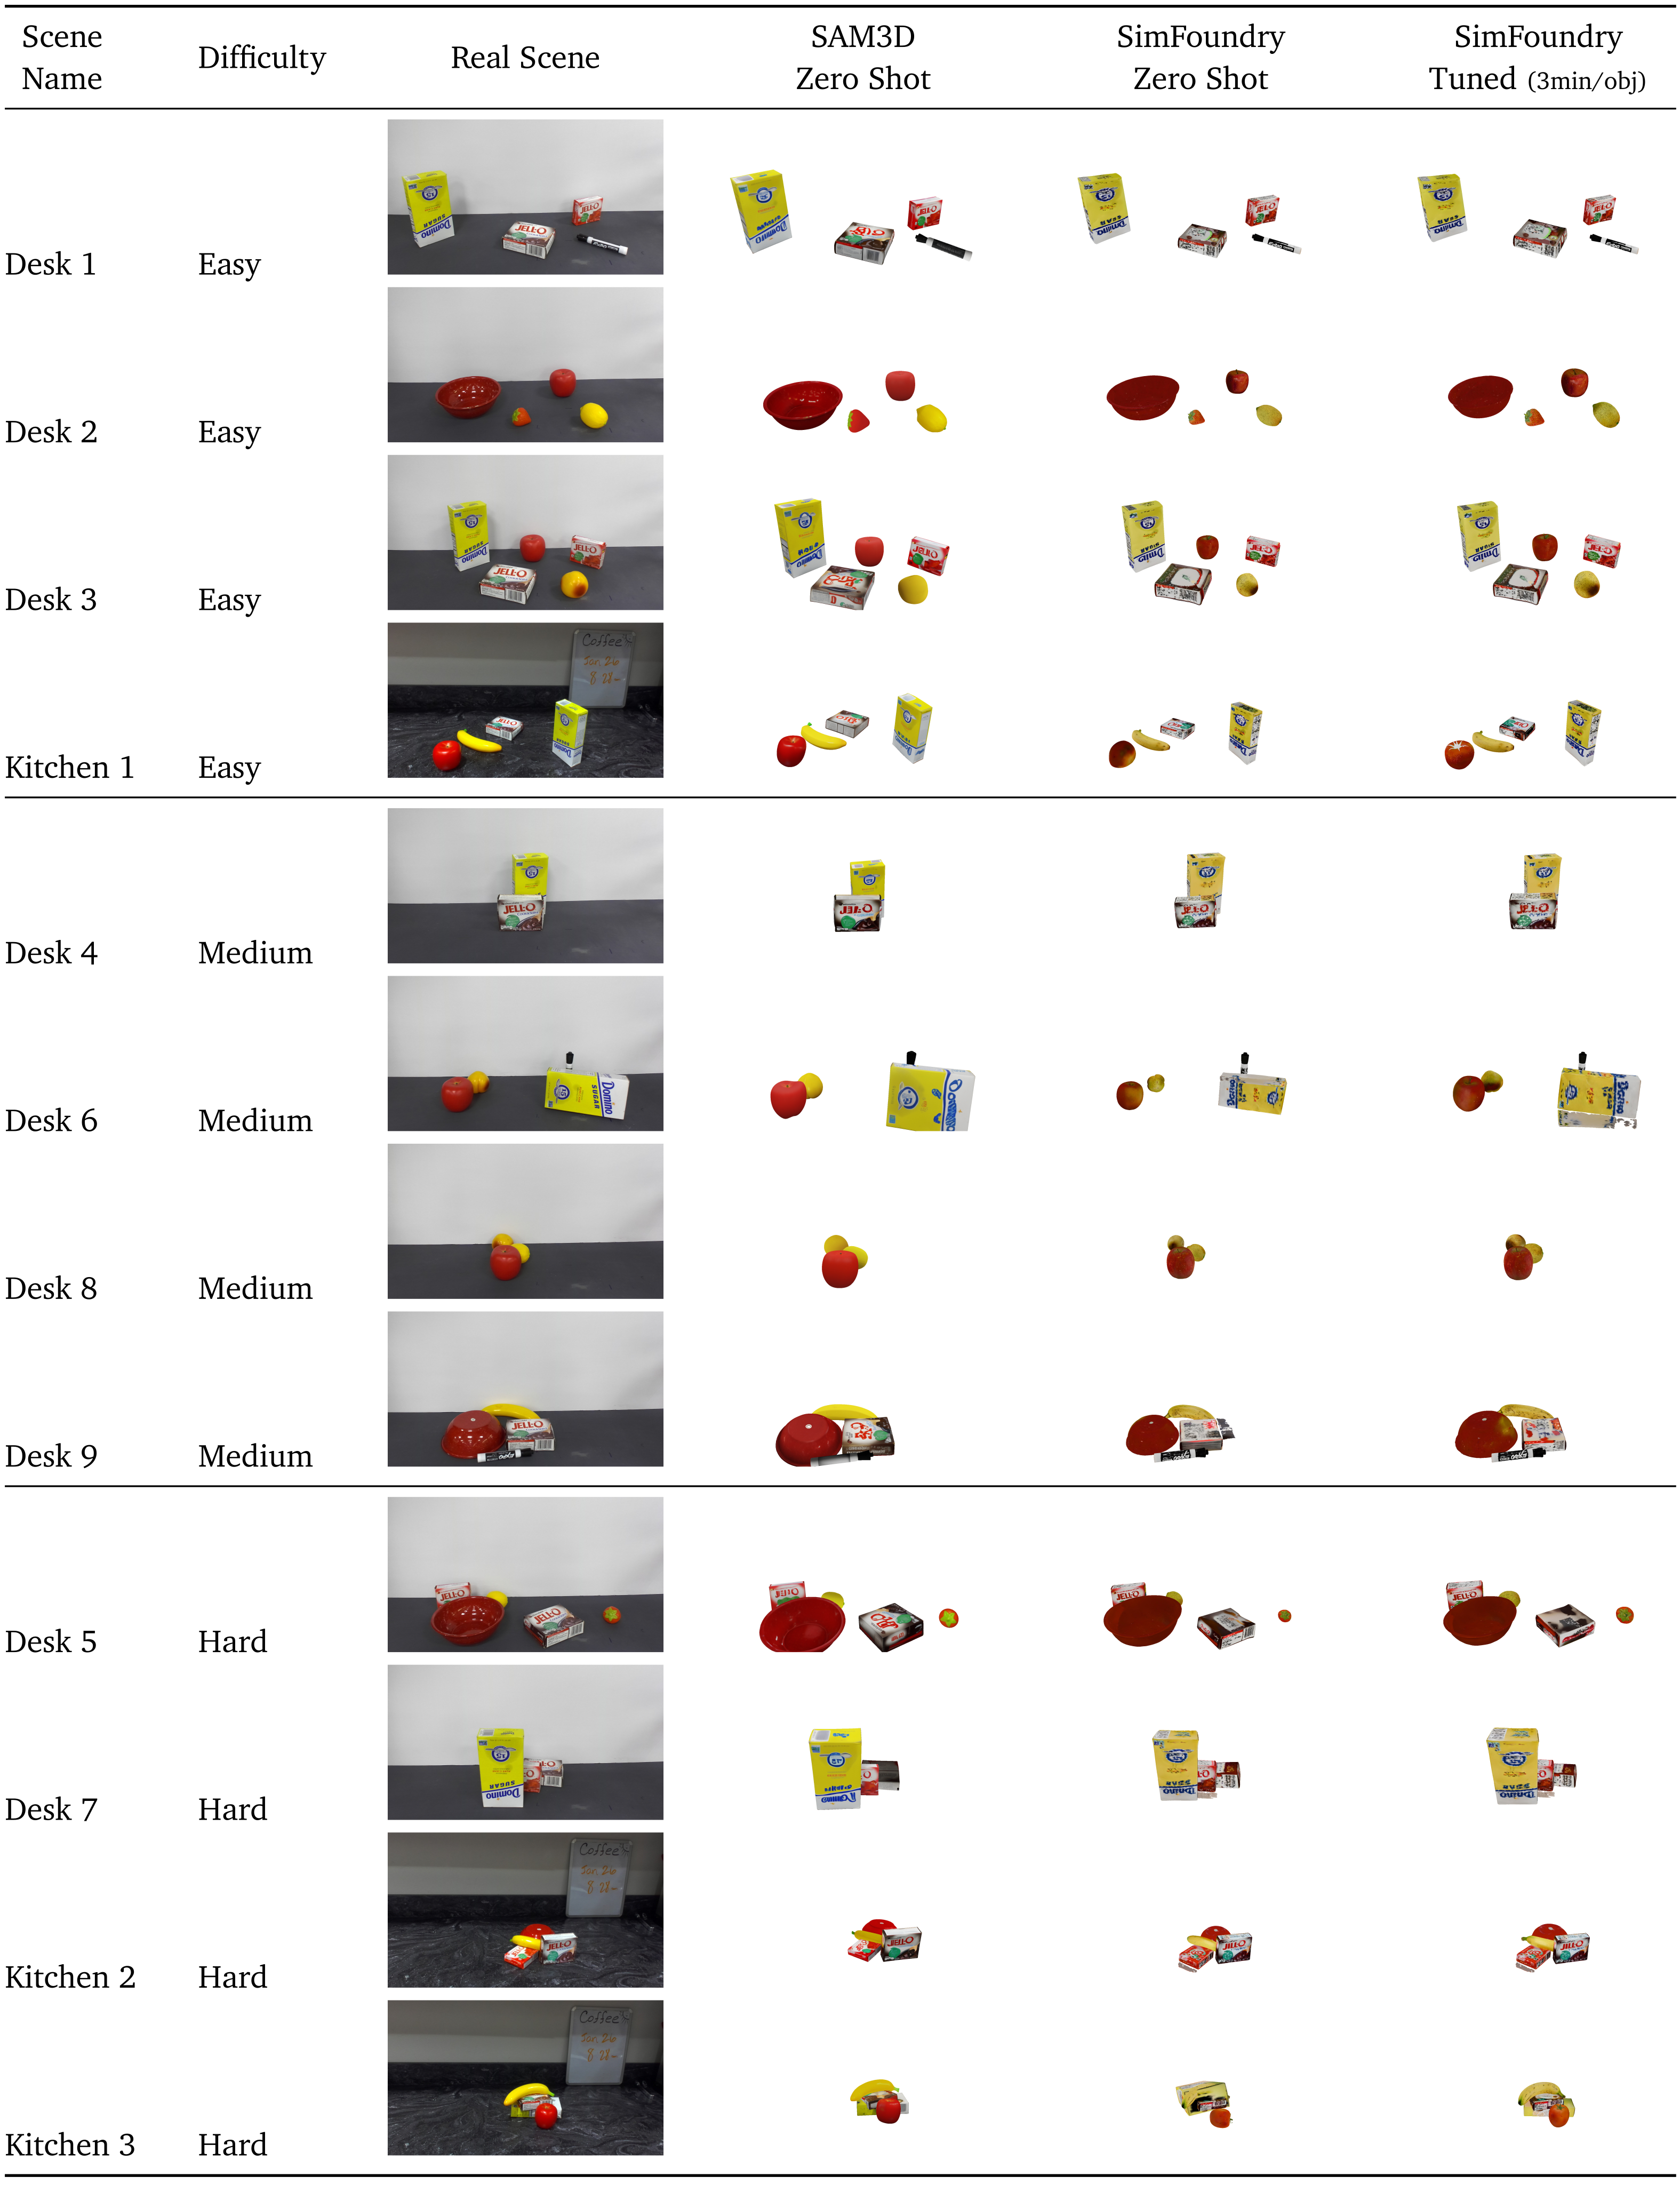
Selectable original table labels and values
|
Scene
Name
|
Difficulty
|
Real Scene
|
Zero Shot
|
SimFoundry
Zero Shot
|
SimFoundry
Tuned (3min/obj)
|
| Desk 1 | Easy | ||||
| Desk 2 | Easy | ||||
| Desk 3 | Easy | ||||
| Kitchen 1 | Easy | ||||
| Desk 4 | Medium | ||||
| Desk 6 | Medium | ||||
| Desk 8 | Medium | ||||
| Desk 9 | Medium | ||||
| Desk 5 | Hard | ||||
| Desk 7 | Hard | ||||
| Kitchen 2 | Hard | ||||
| Kitchen 3 | Hard |
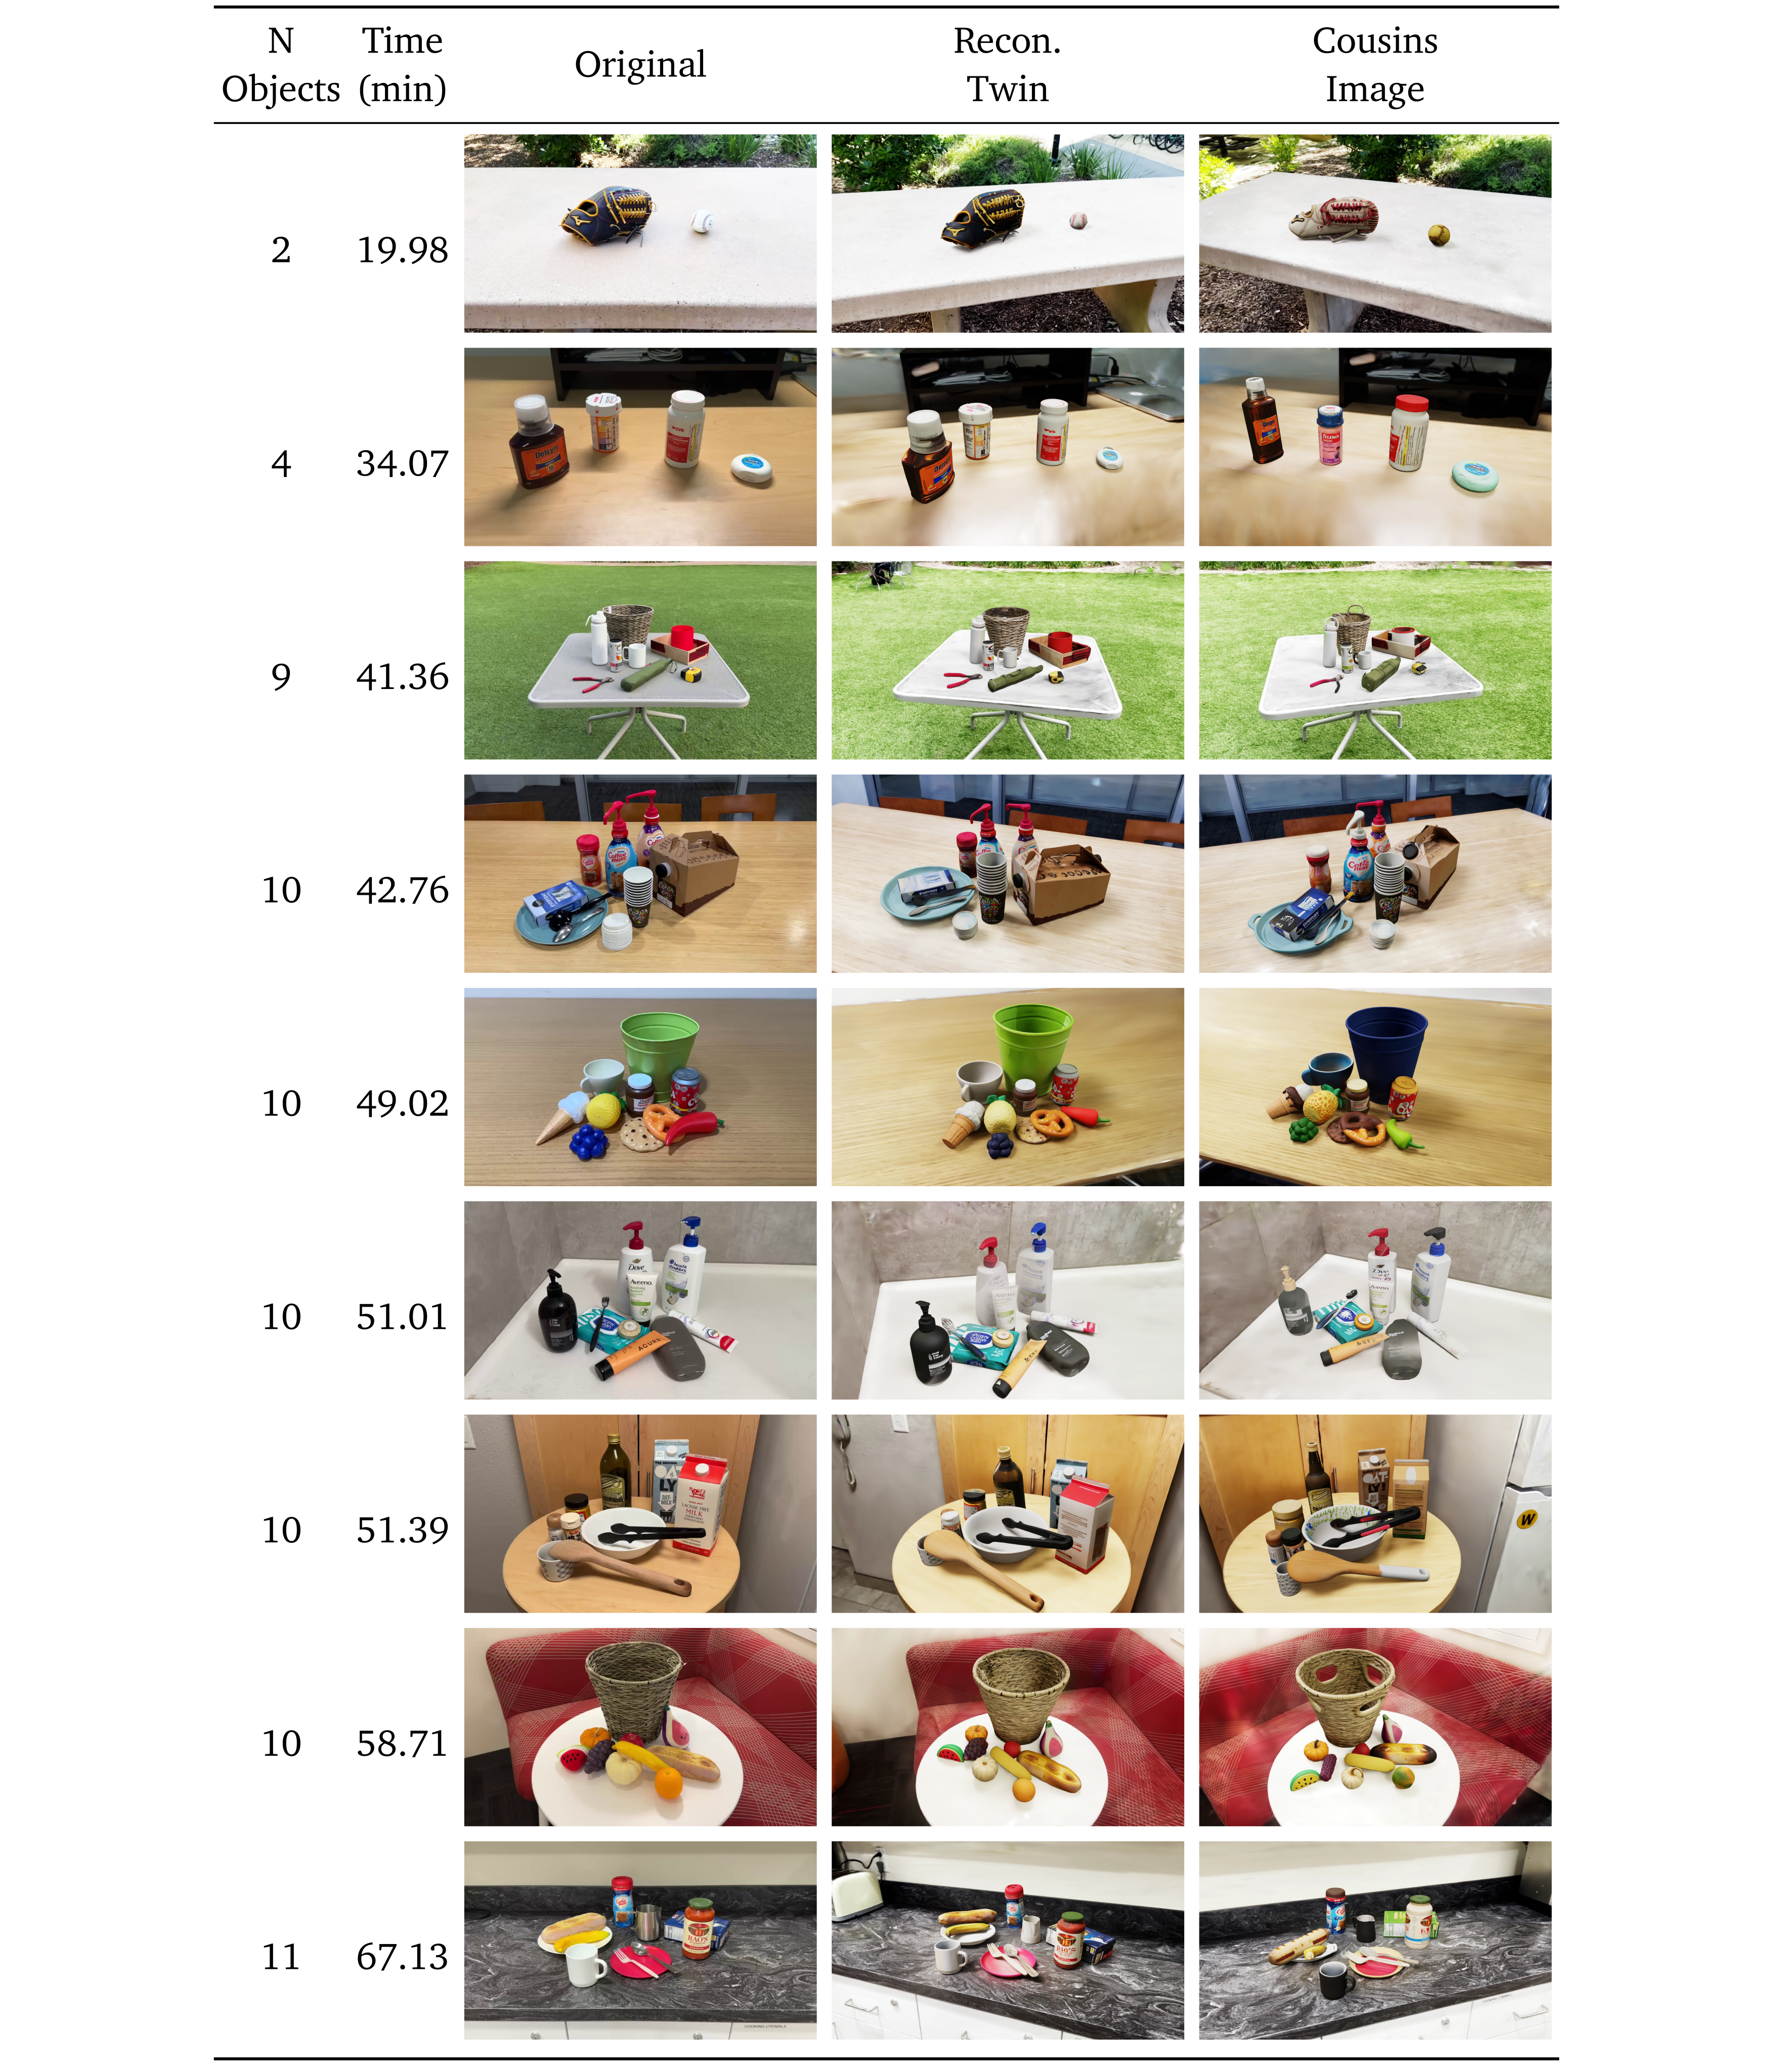
Selectable original table labels and values
|
N
Objects
|
Time
(min)
|
Original |
Recon.
Twin
|
Cousins
Image
|
| 2 | 19.98 | |||
| 4 | 34.07 | |||
| 9 | 41.36 | |||
| 10 | 42.76 | |||
| 10 | 49.02 | |||
| 10 | 51.01 | |||
| 10 | 51.39 | |||
| 10 | 58.71 | |||
| 11 | 67.13 |
L.2 Comparison between Manual and Automatic Background Pipeline
Five scenes compare backgrounds from automatic inpainting/registration with manually captured and aligned clean backgrounds.
L.2.1 Qualitative Reconstruction Results
The full visual comparison shows occasional automatic-pipeline floaters near support surfaces that occlude foreground objects. Inpainting may hallucinate hidden content even when overall registration metrics improve.
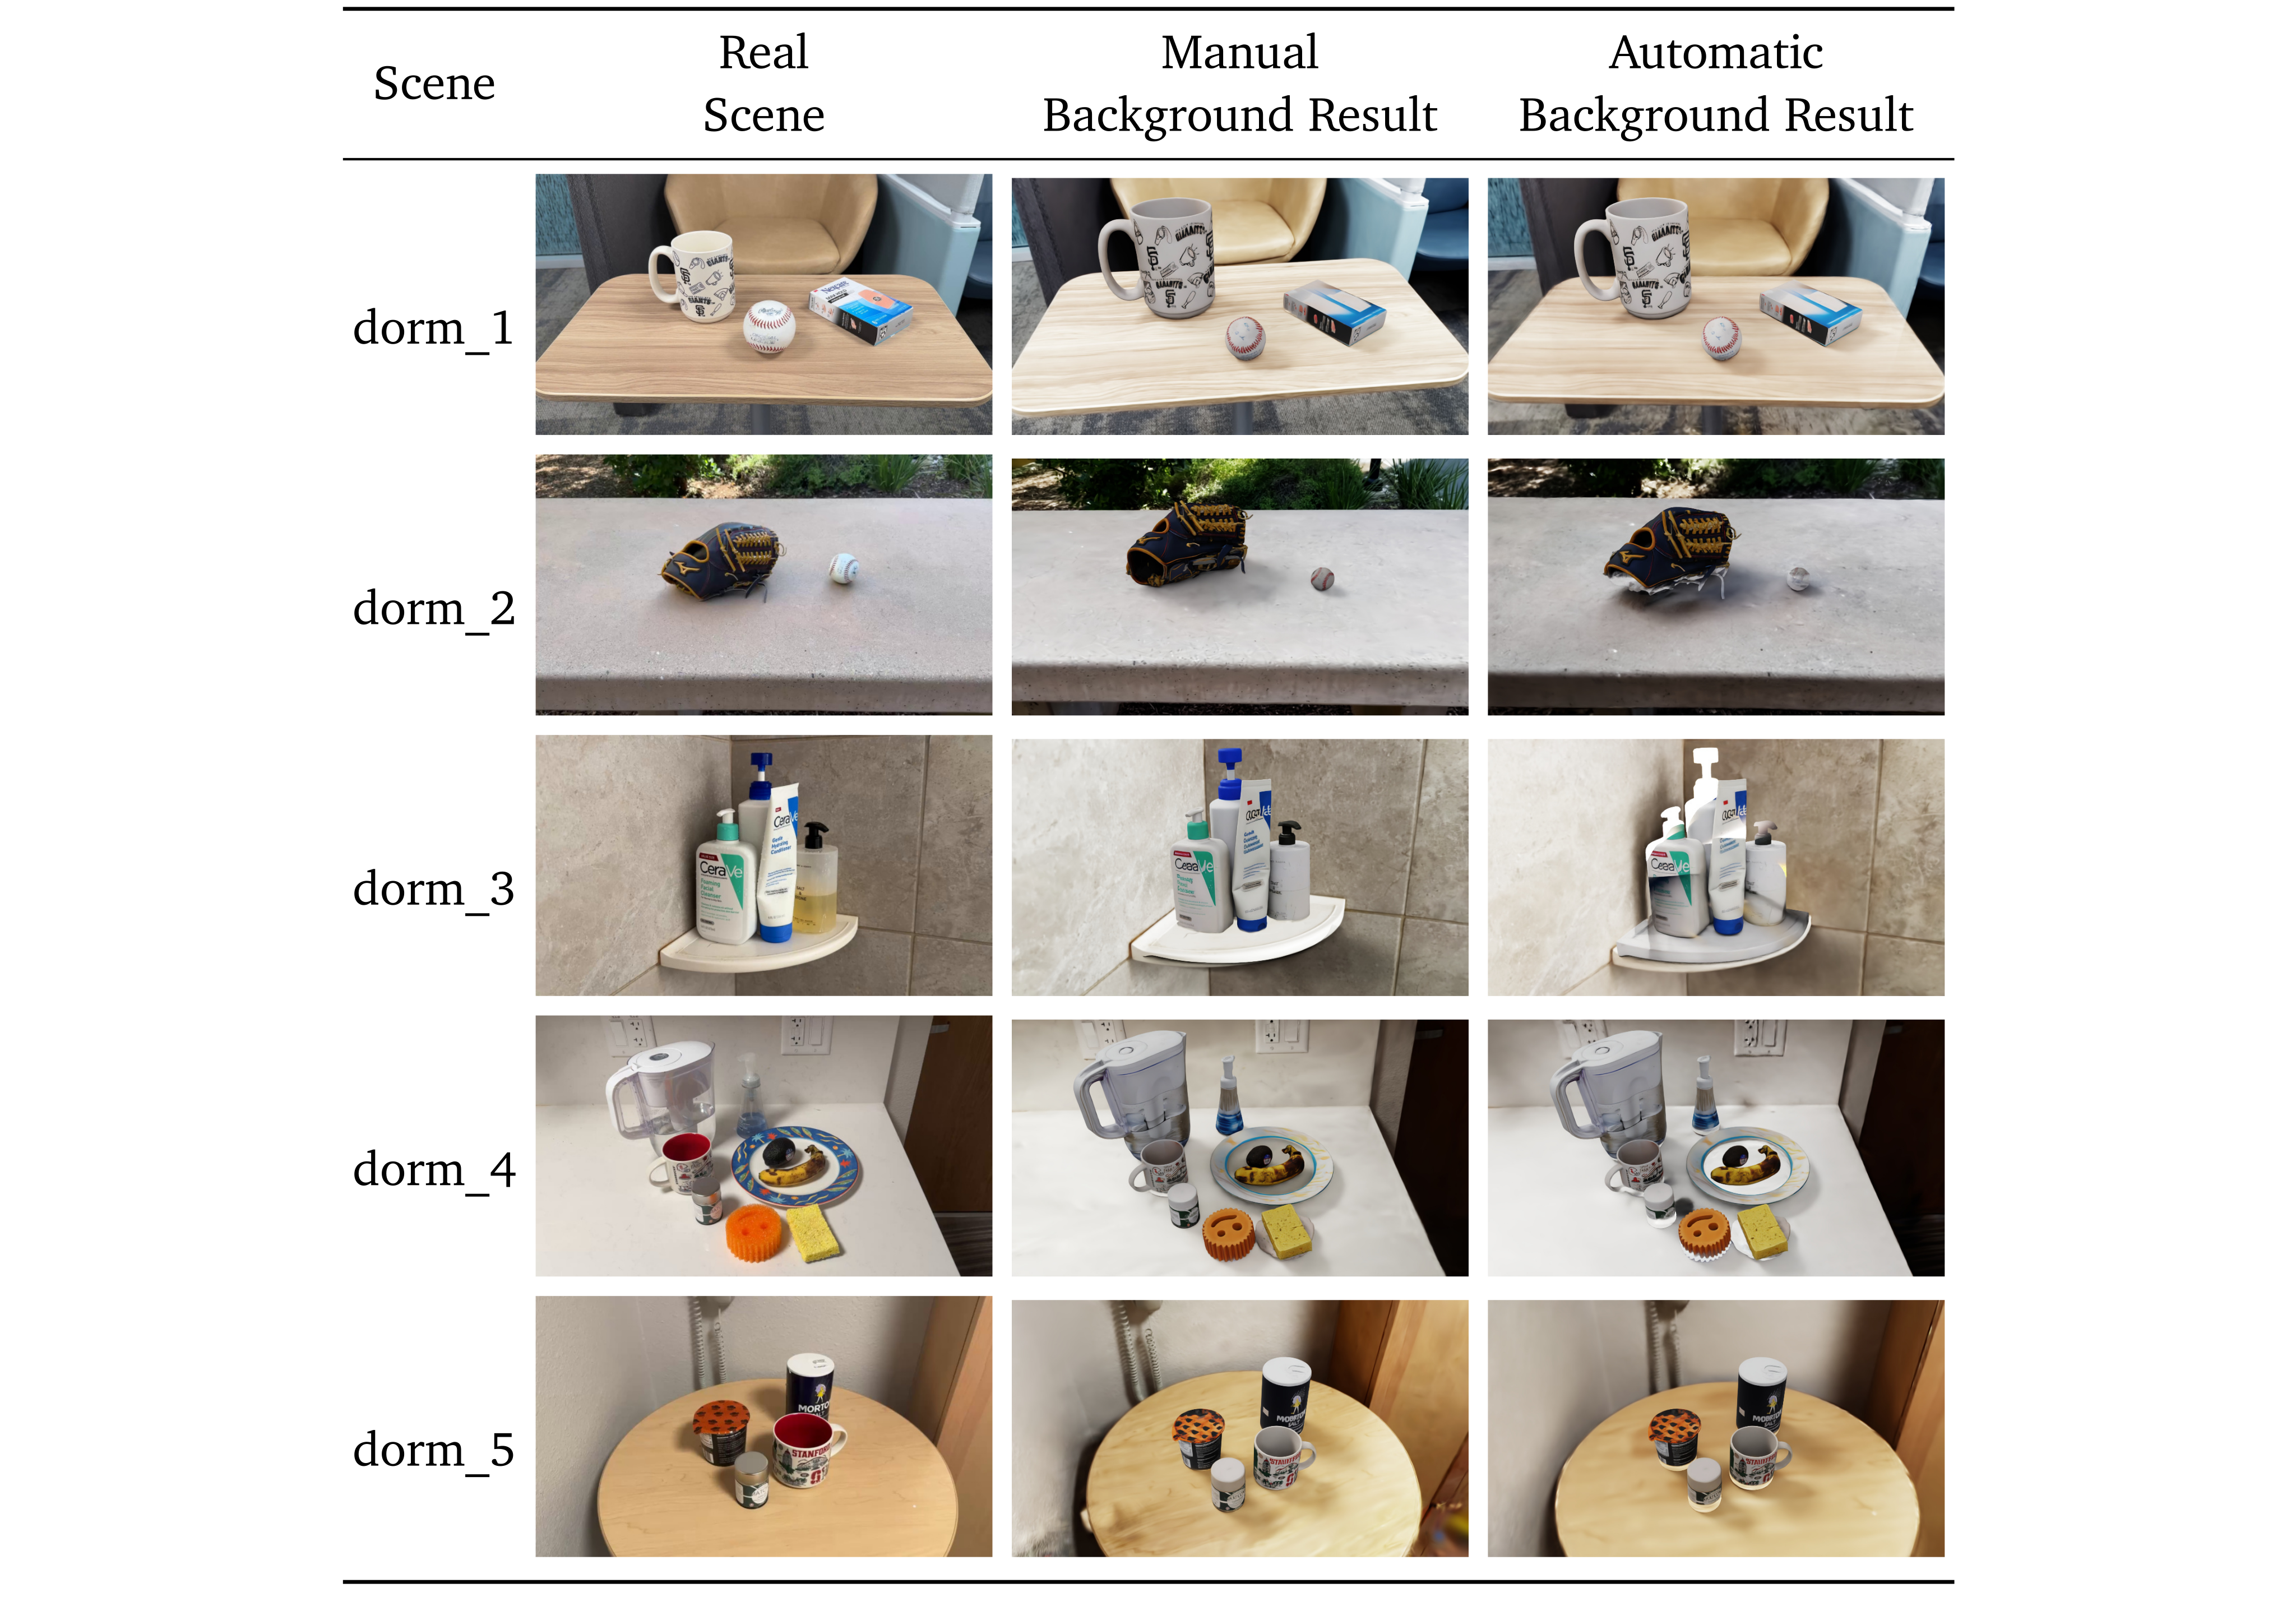
Selectable original table labels and values
| Scene |
Real
Scene
|
Manual
Background Result
|
Automatic
Background Result
|
| dorm_1 | |||
| dorm_2 | |||
| dorm_3 | |||
| dorm_4 | |||
| dorm_5 |
L.2.2 Quantitative Reconstruction Results
Seven image-space metrics are averaged over fifty uniformly sampled frames per scene and then across five scenes. The automatic path improves PSNR, SSIM, MAE, RMSE, normalized cross-correlation, CIE76 color difference and Sobel-edge MAE. Its shared-pose registration can explain much of the advantage over manual alignment; these metrics assess rendered-view agreement and do not isolate geometric surface accuracy from alignment. Every original metric value remains in Table L.6.
| Variant | PSNR | SSIM | MAE | RMSE | NCC | EdgeMAE | |
| Manual Pipeline | 12.91 | 0.497 | 0.1712 | 0.2294 | 0.549 | 20.13 | 0.0283 |
| Automatic Pipeline | 15.29 | 0.605 | 0.1275 | 0.1758 | 0.749 | 15.23 | 0.0248 |