Overview
SidewalkBench provides controlled sidewalk-navigation tests spanning static geometry, specified pedestrian responses, and long routes. Its appendices document simulation interfaces, data ablations, complete benchmark results, and the small physical-transfer experiment.
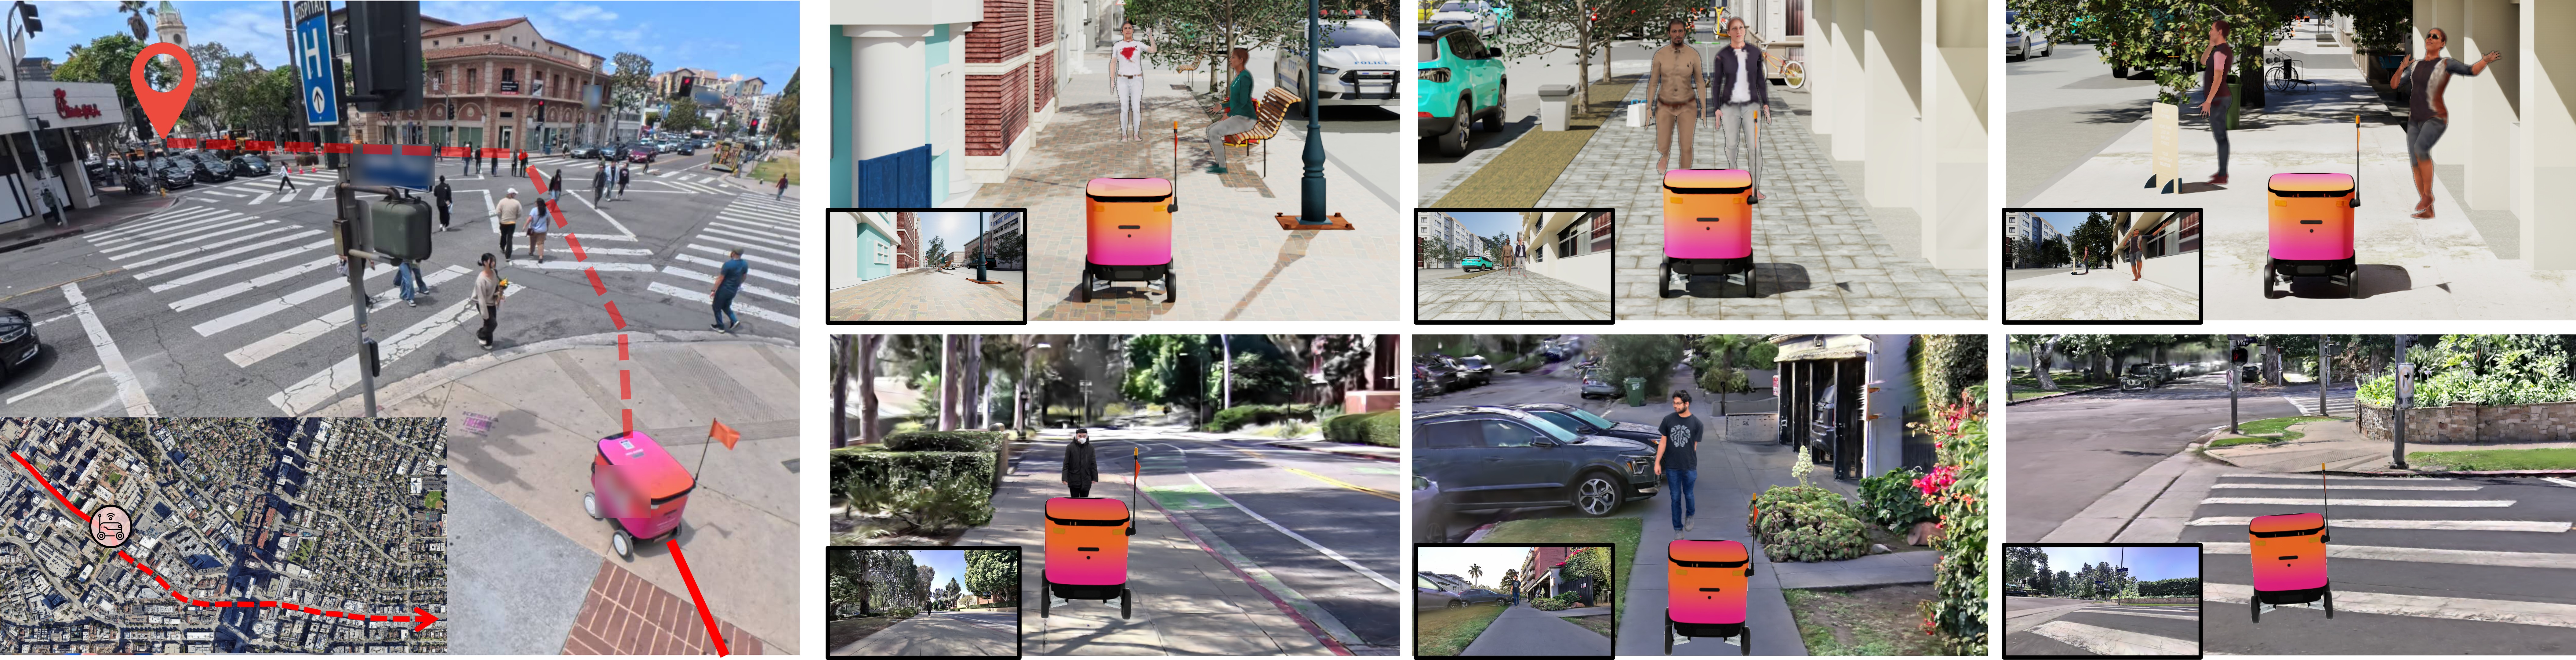
At a glance
The benchmark combines procedural urban environments, scanned streets, and event-triggered pedestrians in Isaac Sim. Nine visual-navigation policies are evaluated on 330 basic-layout tests, 800 pedestrian-reactive tests, and 105 long routes. Sidewalk-specific training markedly improves navigation, yet pedestrian interaction and sustained operation remain difficult. Synthetic-data finetuning improves two targeted behaviors in simulation and a small physical study; this is a benchmark and initial transfer result, not a deployment-safety certification.
1 Introduction
Short, separately designed evaluations obscure how models fail on curved sidewalks, crossings, social groups, and extended travel. SidewalkBench standardizes those challenges while exposing data-domain effects and failure categories. The central observation is that sidewalk-specific data helps more than model size alone in the tested comparisons. The protocol, environment assumptions, and targeted ablations limit how broadly that ranking should be generalized.
2 Related Work
The work connects navigation foundation models, social-navigation benchmarks, and urban simulation. Its contribution is a common sidewalk-focused evaluation with both static-layout and controlled pedestrian challenges.
Visual Navigation Foundation Models
Prior policies use regression, diffusion, world models, reinforcement learning, or language-conditioned action generation. Their training domains and interfaces vary substantially. The benchmark compares these families under a common sidewalk-following setup rather than evaluating every model’s full original goal-conditioned capability.
Simulation Benchmarks for Visual Navigation
Indoor benchmarks, short reconstructed outdoor routes, and existing social-navigation simulators cover different subsets of the problem. SidewalkBench combines larger outdoor layouts, scanned appearance/geometry, and dynamic pedestrians, enabling controlled comparisons without claiming simulated humans capture every real interaction.
Urban Simulators for Embodied AI
Isaac Sim and Isaac Lab supply physics and parallel camera rendering. A separate pedestrian pipeline reduces animation overhead and allows more varied motions than fixed walking/standing assets. Rendering throughput is a component measurement, distinct from end-to-end policy latency.
3 SidewalkBench Design
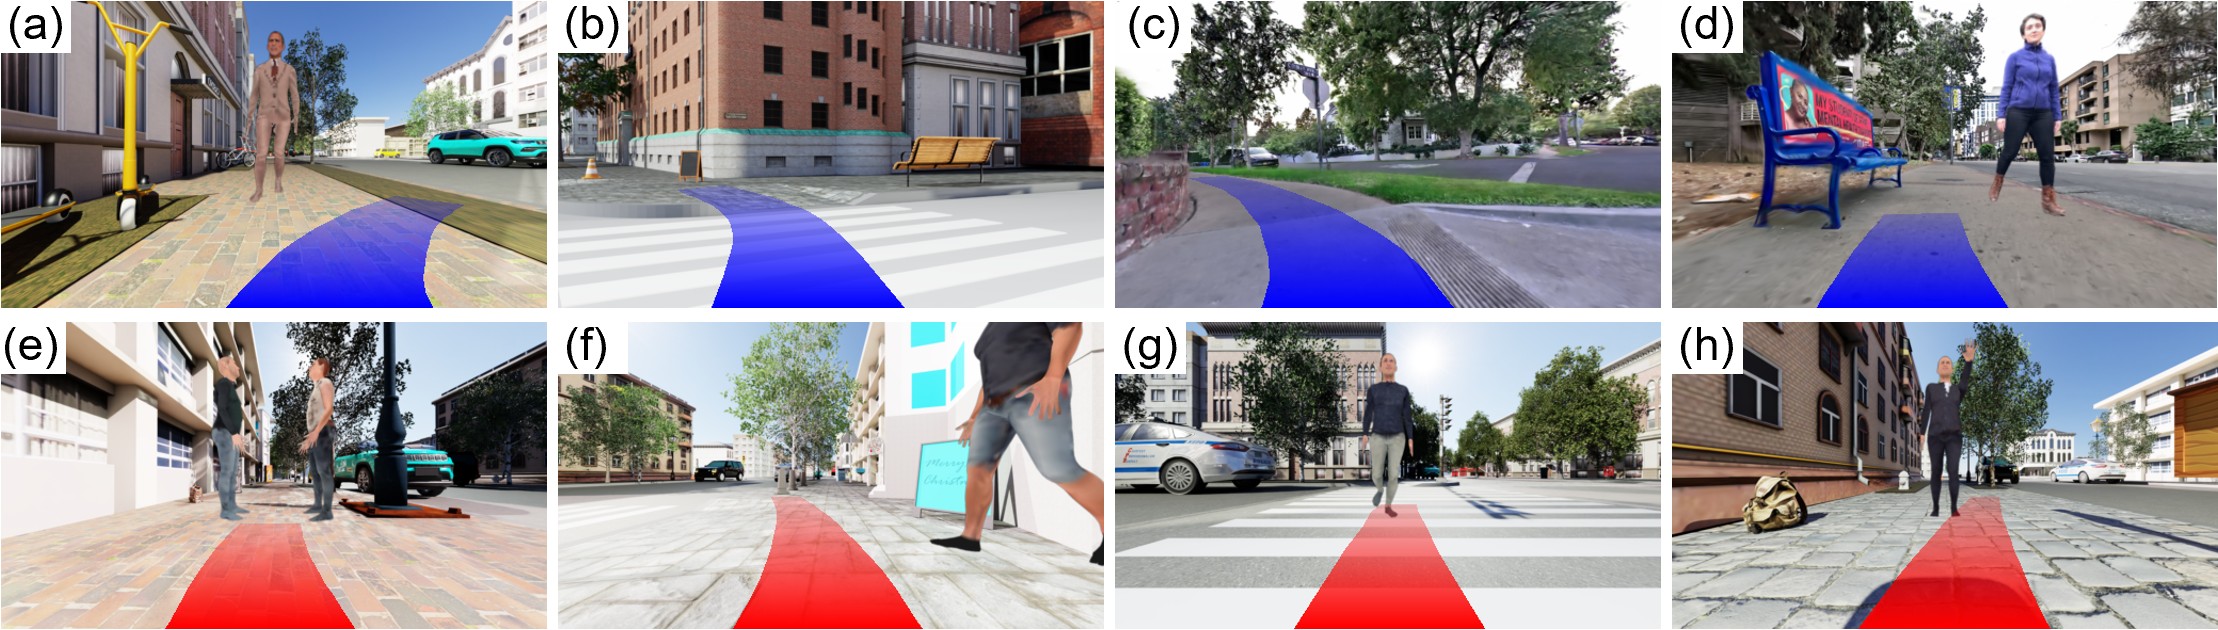
The benchmark separates scene construction, pedestrian behavior/animation, and scenario definitions. Procedural scenes favor controlled variation; scans favor visual and geometric realism. Both remain simulated evaluations.
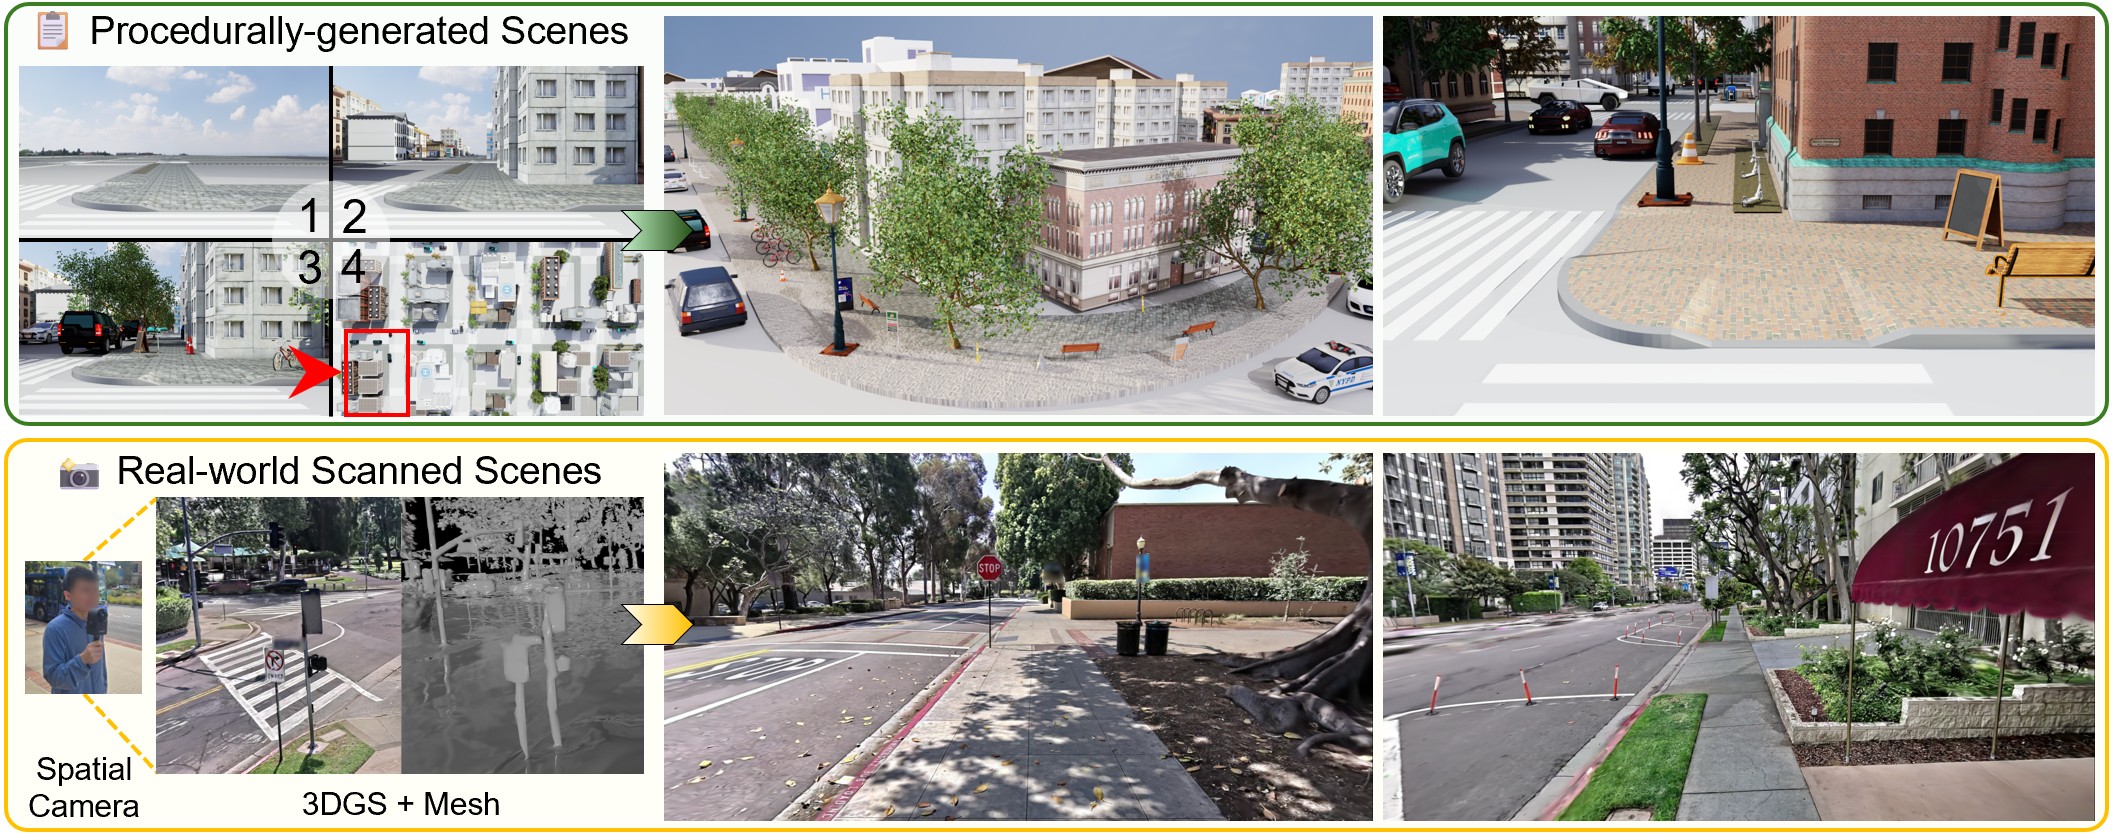
3.1 Scene Types
Procedural and scanned environments provide complementary tests. Agreement in rankings across them is useful evidence about those scene distributions, but is not by itself validation on physical streets.
Procedurally Generated Scenes
Seven primitive block types are joined into urban topologies. Five lateral functional zones separate roads, sidewalks, curbs/gutters, verges, and frontage; textures, sky maps, objects, and placements vary using UrbanVerse-100K assets. The resulting one hundred environments each span two by two kilometres. These scene dimensions are not the distance actually evaluated.
Real-world Scanned Scenes
An XGRIDS device with LiDAR and four cameras supplies scans. Gaussian splats render appearance while scanned meshes provide geometry and physics, followed by sidewalk/crosswalk annotation. Eleven reconstructed scenes average 150 by 150 metres. Scanning improves realism but does not remove simulator, camera, or control differences.
3.2 Pedestrian Simulation
A high-level state machine selects behavior; a separate low-level motion/rendering pipeline animates it. Controlled event tests and reciprocal long-route pedestrians serve different purposes and should not be treated as the same crowd model.
Event-based High-level Behaviors
Behavior graphs connect walking, waiting, object interaction, and social interaction. Relative robot position triggers eight scenarios: obstruction, conversation, queueing, frontal/lateral approach, overtaking, crossing, and a stopping gesture. Handwritten trajectories and speeds force relevant encounters, making them reproducible stress tests rather than samples of natural encounter frequency.
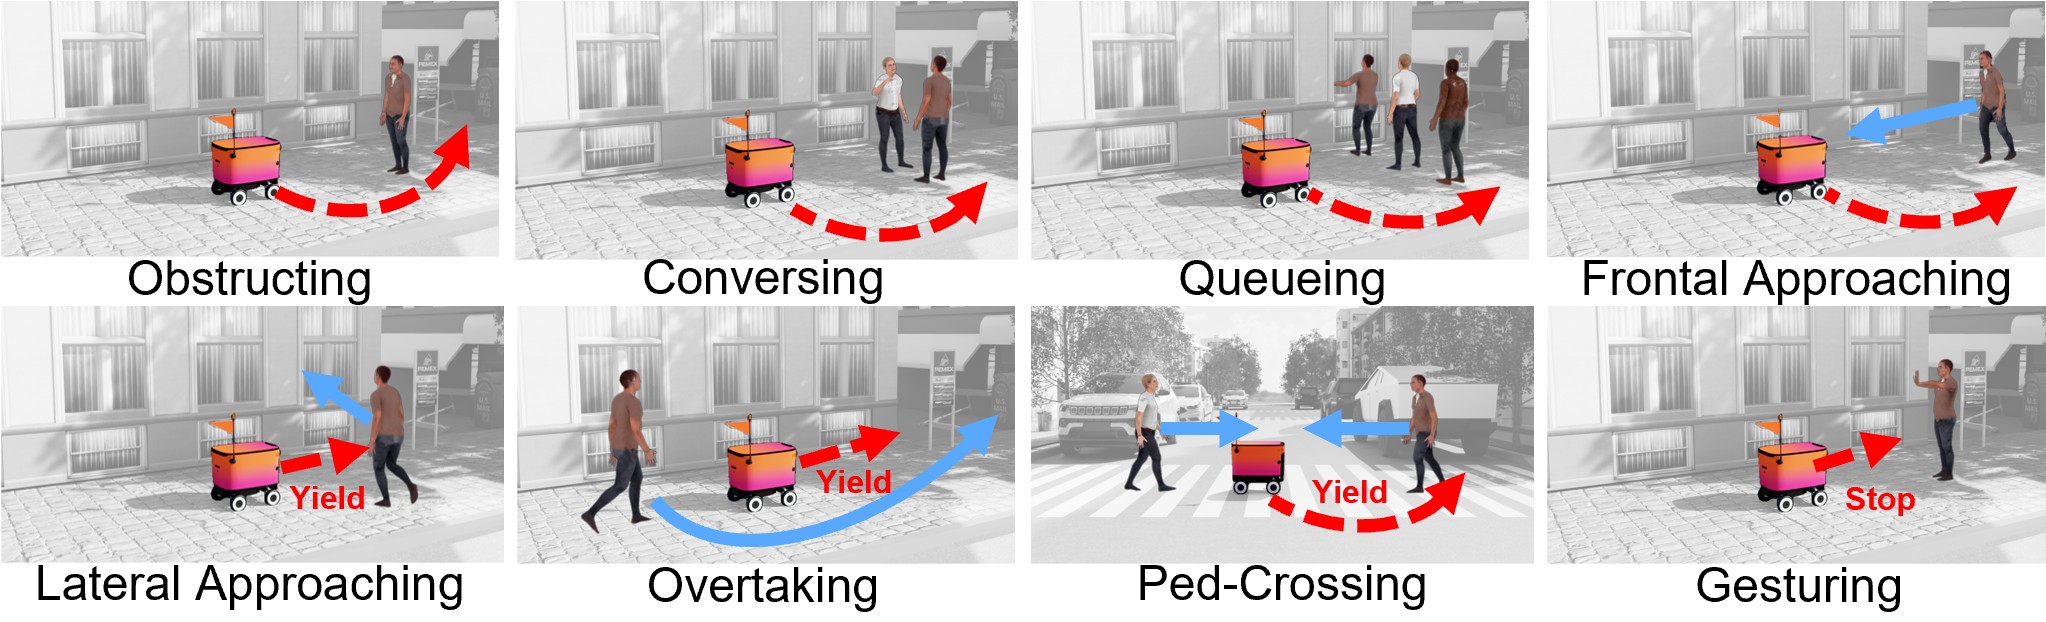
Flexible and Efficient Low-level Animation
SMPL poses drive textured meshes or Gaussian human avatars, drawing motion from generators and datasets. Nvdiffrast pedestrian rendering is composited with simulator backgrounds. The headline roughly sixty-fold improvement concerns mesh-animation/rendering versus Isaac’s native character module, not full simulation or every avatar representation.
3.3 Scenarios
The 330 static tests cover straight, curved, and crossing blocks over ten to twenty metres: one hundred procedural and ten scanned examples per type. Reaching the goal within sixty seconds succeeds; obstacle contact or leaving the sidewalk fails. Eight hundred pedestrian tests add one hundred cases per behavior, entirely in procedural scenes; crossing uses crosswalks and the other behaviors use straight sidewalks.
The 105 long routes exceed one hundred metres and total 36.5 km, with one hundred procedural and five scanned cases. Alternative routes are blocked to leave a single path. After failure, the robot resets to the closest waypoint and continues, so the metric measures interventions along reset-assisted travel rather than autonomous end-to-end completion.
Evaluation Metrics
Static tests emphasize route completion; pedestrian tests use task success. Long routes count collisions, out-of-lane events, and freezing per one hundred metres, together with average speed. Appendix metrics add success-weighted path length, pedestrian collisions, and minimum distance conditioned on successful trials. Those quantities answer different questions and are not interchangeable.
4 Experiments
Evaluation spans nine pretrained or adapted navigation models and three scenario families, followed by data ablations and a narrow synthetic-to-physical finetuning experiment. Full original tables retain five-run standard deviations where reported.
4.1 Navigation Models
General models are ViNT, NoMaD, MBRA, CityWalker, and InternVLA-N1; sidewalk models are MIMIC, S2E, FlowPilot, and OpenPilot. The last is a reimplementation retrained on sidewalk data, not the unchanged public driving checkpoint. It has eight million parameters and twenty-hertz observations; InternVLA has seven billion and five-hertz inputs. Architecture, data, resolution, and input frequency all differ, so the main cross-model ranking alone cannot isolate their causal effects.
| Method | Data (# Hours) | Goal | Encoder | Decoder | Resolution | FPS | Model Size |
|---|---|---|---|---|---|---|---|
| ViNT [50] | General | Image | CNN | Regression | 8564 | 4 | 24 M |
| NoMaD [51] | General | Image / None | CNN | Diffusion | 9696 | 4 | 16 M |
| MBRA [26] | General | Point | CNN | Regression | 9696 | 5 | 63 M |
| CityWalker [39] | General | Point | ViT | Regression | 630350 | 1 | 201 M |
| InternVLA-N1 [55] | General | Language | VLM | Diffusion | 384384 | 5 | 7 B |
| MIMIC [24] | Sidewalk (50) | None | ViT | Reg. + Cls. | 256256 | 5 | 79 M |
| S2E [25] | Sidewalk (100) | Point | ViT | Reg. + Cls. | 256256 | 5 | 95 M |
| FlowPilot [23] | Sidewalk (300) | Point / None | ViT | FM. + Cls. | 512288 | 5 | 230 M |
| OpenPilot [10] | Sidewalk (1000) | None | ViT | Regression | 352128 | 20 | 8 M |
4.2 Unit-test Scenarios
Sidewalk-trained MIMIC obtains straight-route completion of 77.9% in procedural and 97.1% in scanned scenes, versus ViNT’s 15.4% and 20.8%. OpenPilot performs strongly with one thousand training hours. The main prose calls 86.5% and 89.8% its averages, but Tables 6–7 identify those as curved-block results; Table 5 gives 91.1% average procedural completion. The notes use the tabulated metric labels. Scanned-scene results remain simulated, and completion is not success without a final failure.
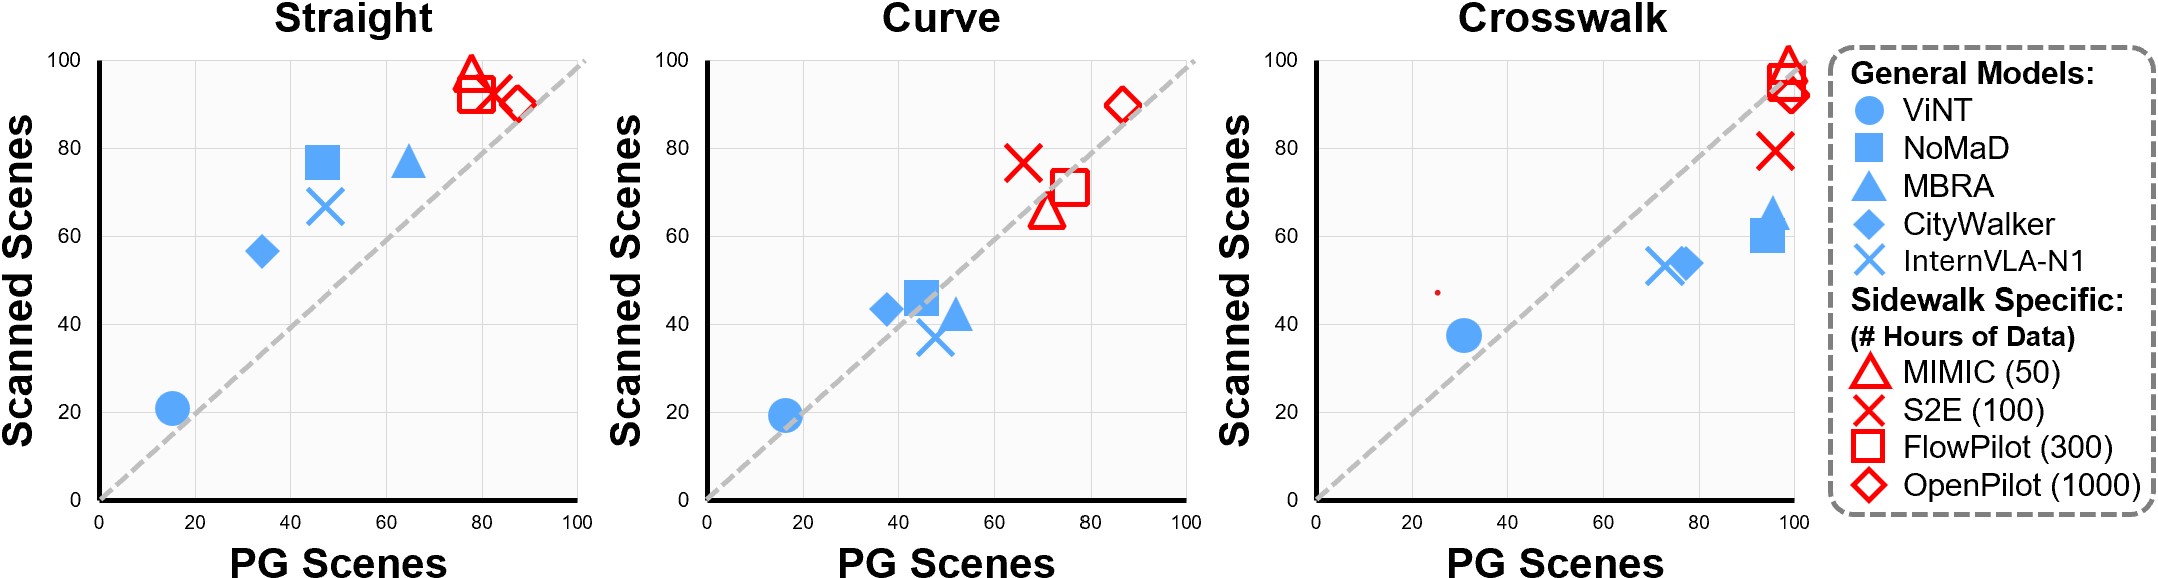
4.3 Pedestrian-reactive Scenarios
Table 2’s across-model means fall from 38.5% without pedestrians to 32.3% with a stationary obstruction, 17.2% for conversing groups, and 12.3% for queues. Frontal/lateral approach average 17.4%/19.8%; overtaking reaches 43.2%. Crossing and gesturing remain especially weak at 3.8% and 1.7%. Several narrative averages differ slightly from the table, which is retained unchanged. OpenPilot can lead static tests yet score zero crossing success; broad lane-following competence does not imply these interaction skills.
| Method | Static | Obstructing | Conversing | Queueing | Frontal | Lateral | Overtaking | Ped-Crossing | Gesturing |
|---|---|---|---|---|---|---|---|---|---|
| ViNT [50] | |||||||||
| NoMaD [51] | |||||||||
| MBRA [26] | |||||||||
| CityWalker [39] | |||||||||
| InternVLA-DualVLN [55] | |||||||||
| MIMIC [24] | |||||||||
| S2E [25] | |||||||||
| FlowPilot [23] | |||||||||
| OpenPilot [10] | |||||||||
| Avg |
| Scenario | Before | After |
|---|---|---|
| Ped-Crossing (Sim) | 13.6 | 69.0 |
| Ped-Crossing (Real) | 0.0 | 40.0 |
| Gesturing (Sim) | 0.0 | 49.0 |
| Gesturing (Real) | 0.0 | 50.0 |
4.4 Long-horizon Scenarios
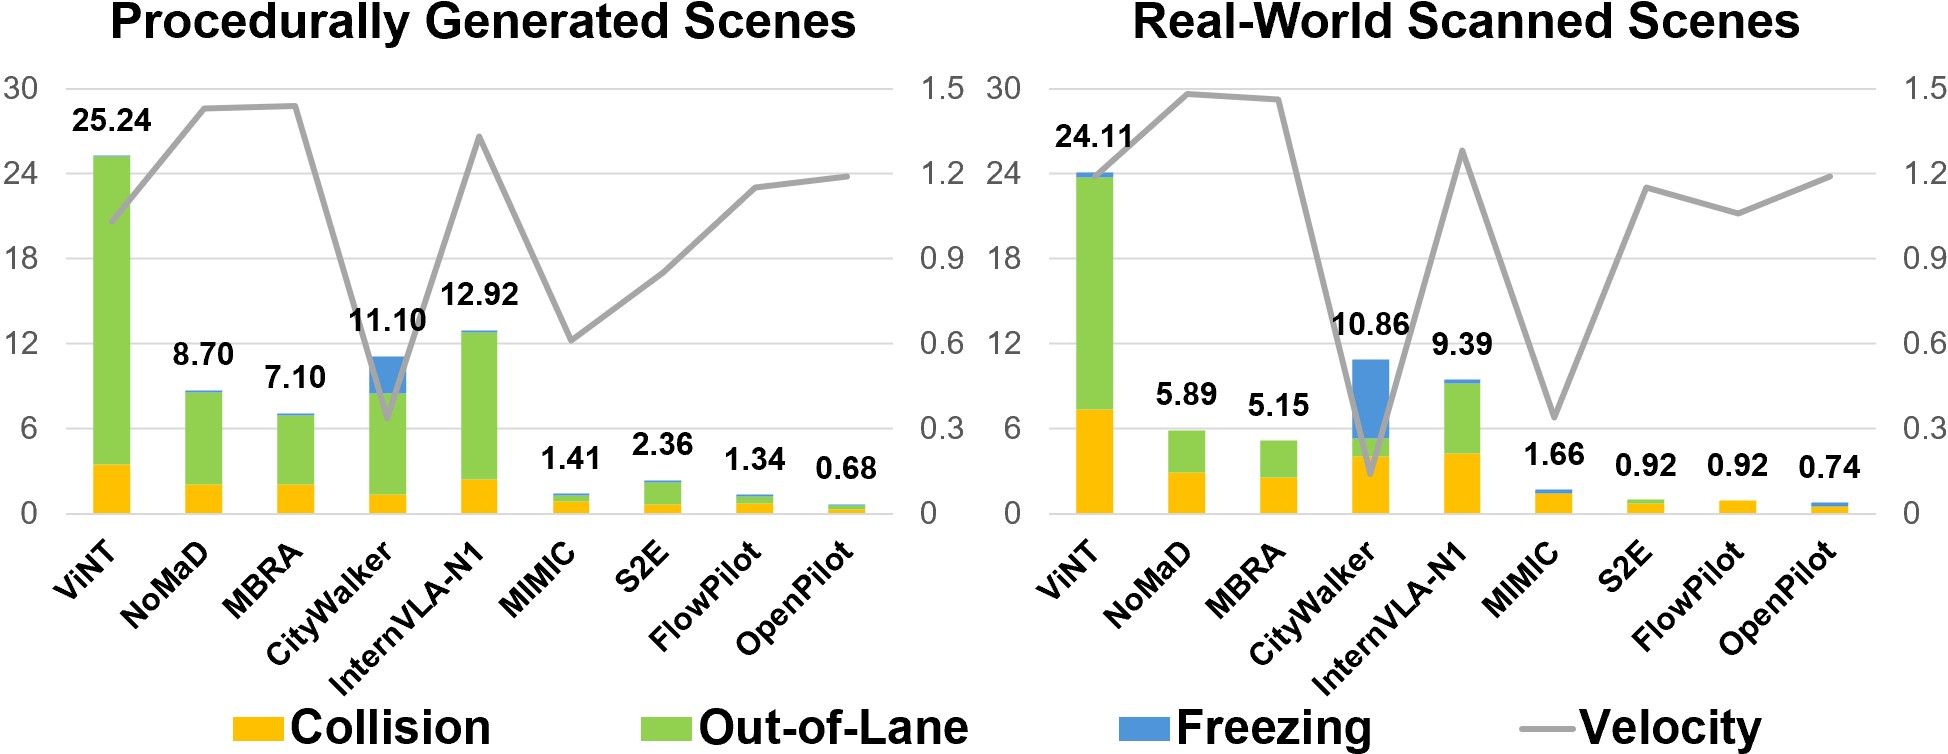
OpenPilot has 0.68 failures per hundred metres at 1.19 m/s procedurally, and 0.74 in scanned scenes. These are reset-assisted simulated counts. Extrapolating 0.68 to a two-kilometre delivery gives 13.6 interventions, but the paper’s stated 32.6 interventions/hour is inconsistent with 0.68 and 1.19 m/s, which imply about 29.1. Neither is a measured physical takeover rate.
Scanned scenes generally increase collision rates and reduce out-of-lane events relative to procedural scenes, showing that failure composition changes with geometry and rendering. Low total counts alone should not obscure a model’s collision behavior.

4.5 Synthetic Training Data Generation
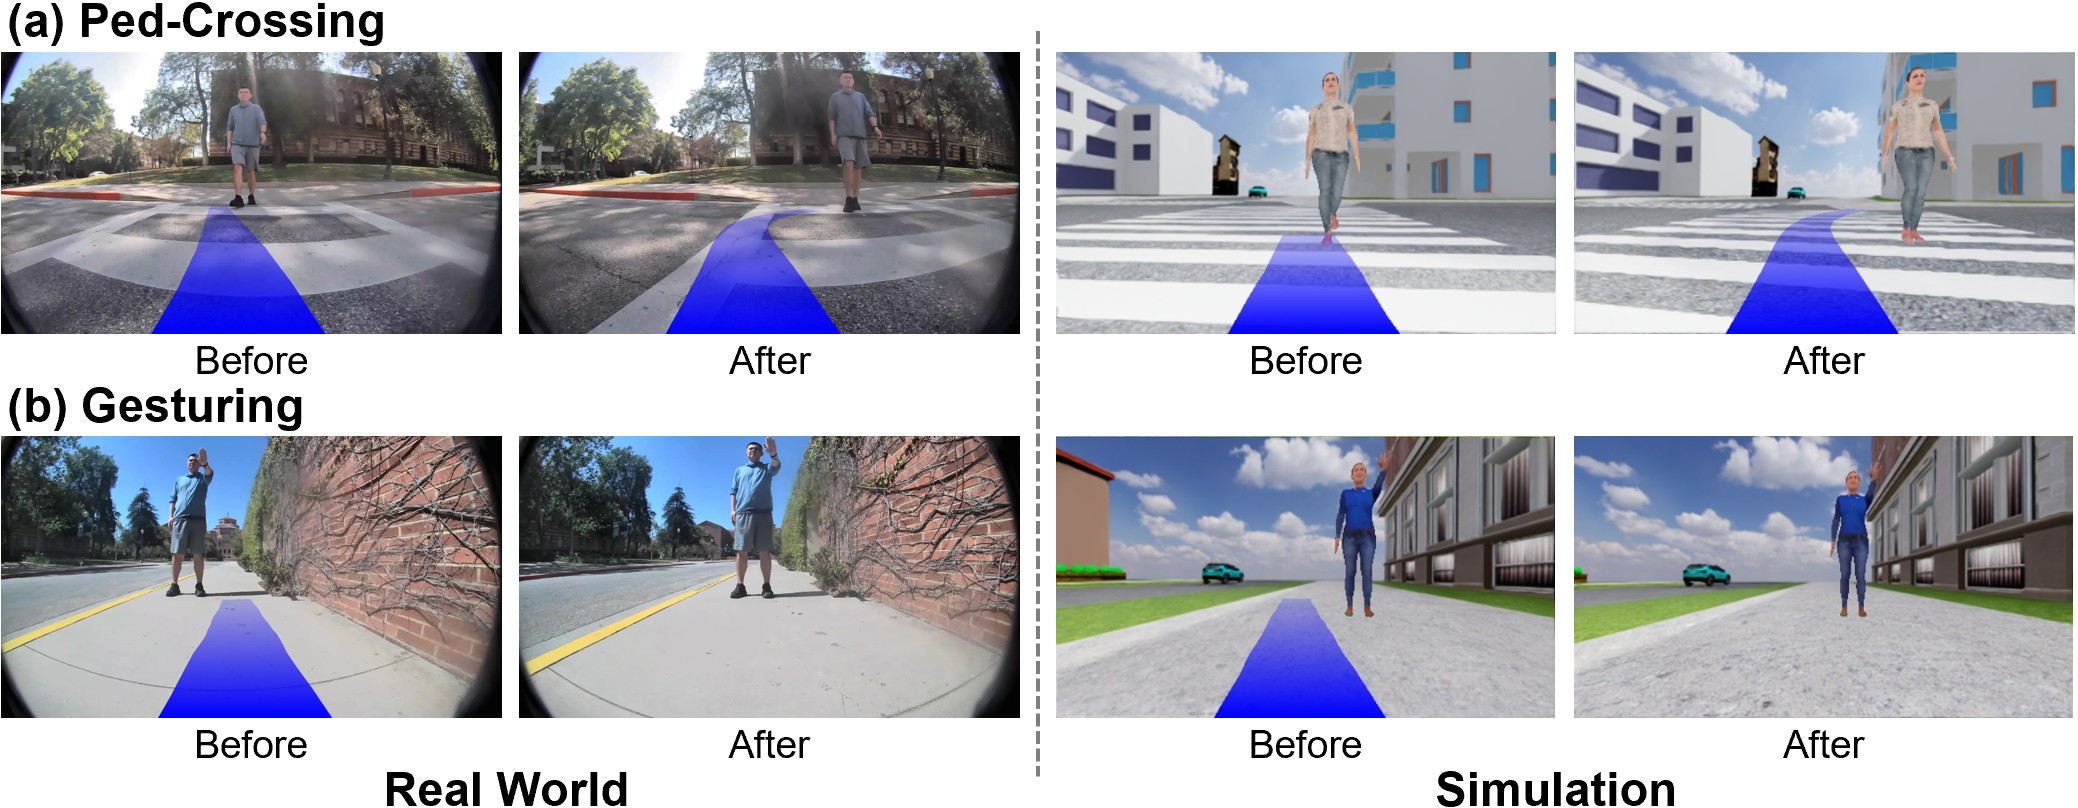
Targeted synthetic finetuning of FlowPilot improves crossing success from 13.6% to 69% in simulation and 0% to 40% physically. Gesture stopping rises from 0% to 49% and 50%, respectively. The physical study uses ten trials per scenario across two locations; it does not establish broad urban transfer, long-route gains, or robust generalization to arbitrary pedestrian gestures.
5 Conclusion
The benchmark reveals a large gap between useful sidewalk-following policies and sustained, socially competent navigation. Domain-specific data and targeted synthetic demonstrations help in the tested settings. Reproducible simulation supports diagnosis and iteration while requiring additional physical and model-specific validation.
6 Limitations
Rule-based events omit subtle natural pedestrian responses, procedural rendering can introduce artifacts, and the benchmark does not explain model internals. Outcomes may depend on textures and low-level controllers. Synchronized testing ignores inference latency, limiting deployment interpretation. Physical finetuning evidence is small; these limits preclude a broad claim that high simulator scores guarantee safe street operation.
Acknowledgment
The work acknowledges Office of Naval Research and National Science Foundation grants plus NVIDIA Academic Grant Program hardware support.
Appendix A Implementation Details
Implementation details specify pedestrian rules, collision proxies, robot limits, synchronization, and model input adaptation. These choices define what the reported benchmark measures.
Pedestrian Simulation
Reactive tests handcraft pedestrian speed and direction, while long routes use ORCA reciprocal avoidance with walking speeds from 1.1 to 1.65 m/s. Motion-LCM generates common movements and Motion-X supplies uncommon gestures. Pedestrians use radius-0.3-metre cylinders for separate collision checking, so detailed body-contact physics is not modeled.
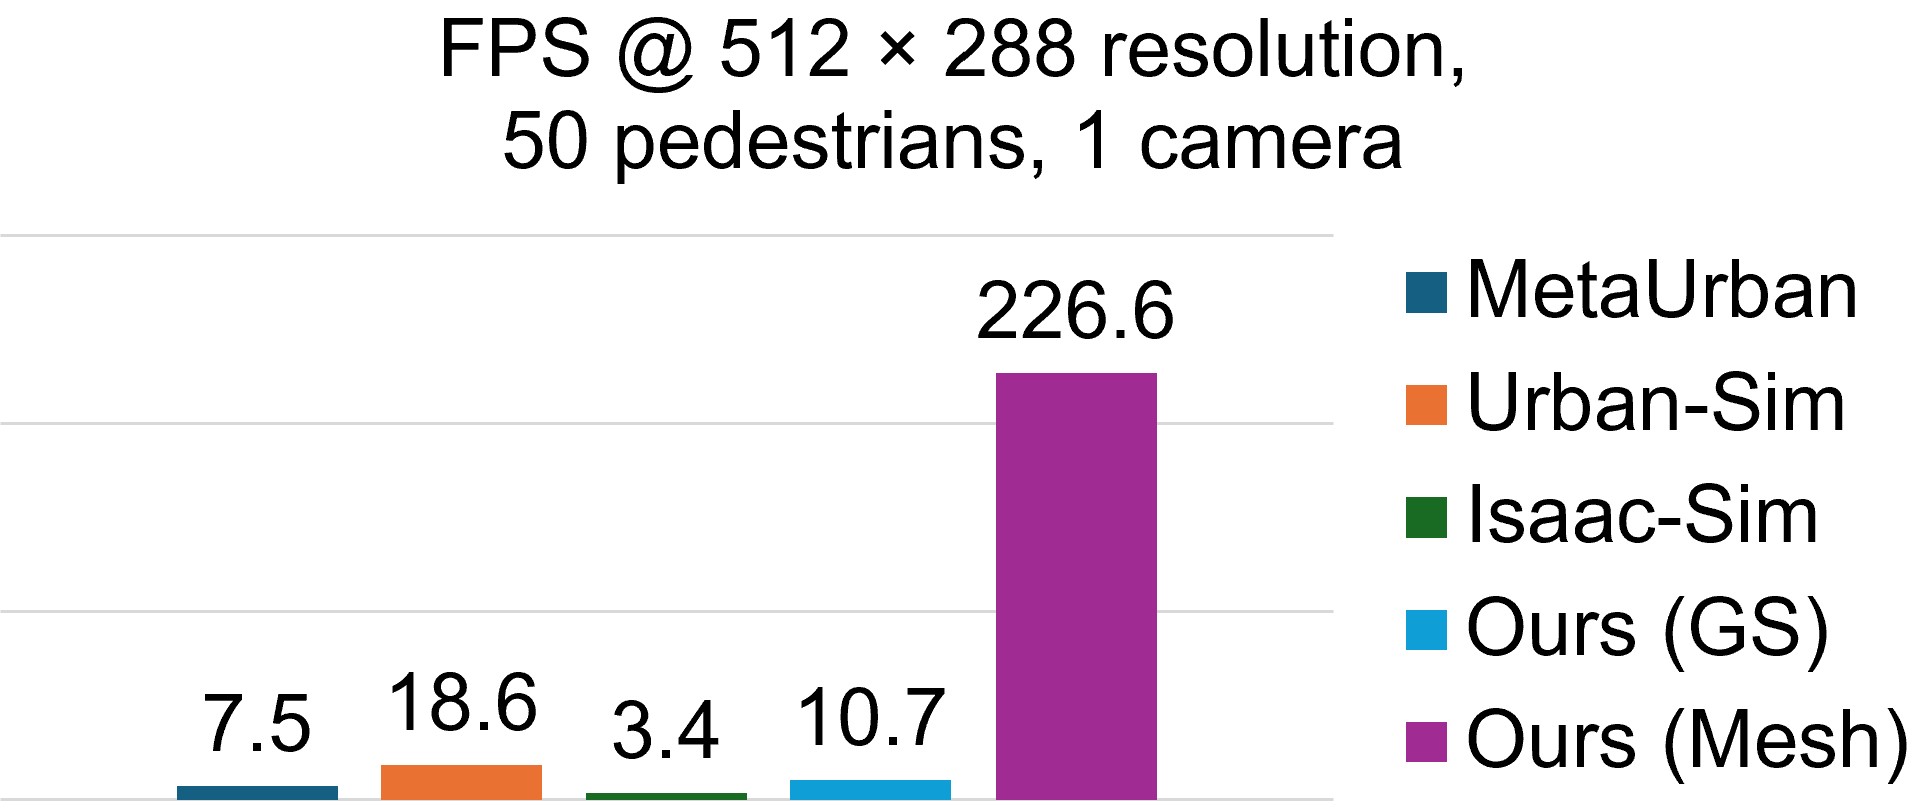
For fifty pedestrians in one environment, the mesh pipeline renders at 226.6 frames/s versus native Isaac’s 3.4. Gaussian avatars reach 10.7, compared with MetaUrban’s 7.5. These amortized measurements include motion generation, rigging, skinning, and pedestrian rendering; they do not establish the same speedup for the complete closed-loop system. Original Figures 9–10 show throughput and qualitative alternate embodiments.
| Scenario | Description | Triggering Condition |
|---|---|---|
| Obstructing | A stationary pedestrian stands at the center of the sidewalk looking around. | Within 10m ahead of the robot |
| Conversing | Multiple pedestrians stand facing each other at the center of the path, forming a social group. | Within 10m ahead of the robot |
| Queueing | Pedestrians form a structured line starting from one side of the sidewalk with tight spacing. | Within 10m ahead of the robot |
| Frontal Approaching | A pedestrian walks directly toward the current position of the robot from the opposite direction. | Within 20m ahead of the robot |
| Lateral Approaching | A pedestrian crosses the robot’s projected path laterally, requiring the robot to yield. | Within 4m ahead of the robot |
| Overtaking | A pedestrian approaches and passes the robot from behind with a faster speed. | Within 1m behind the robot |
| Ped-Crossing | One or more pedestrians crossing from front and behind across a designated crosswalk. | Robot enters the crosswalk zone |
| Gesturing | A pedestrian continuously faces the robot while executing a distinct stopping gesture. | Within 10m ahead of the robot |
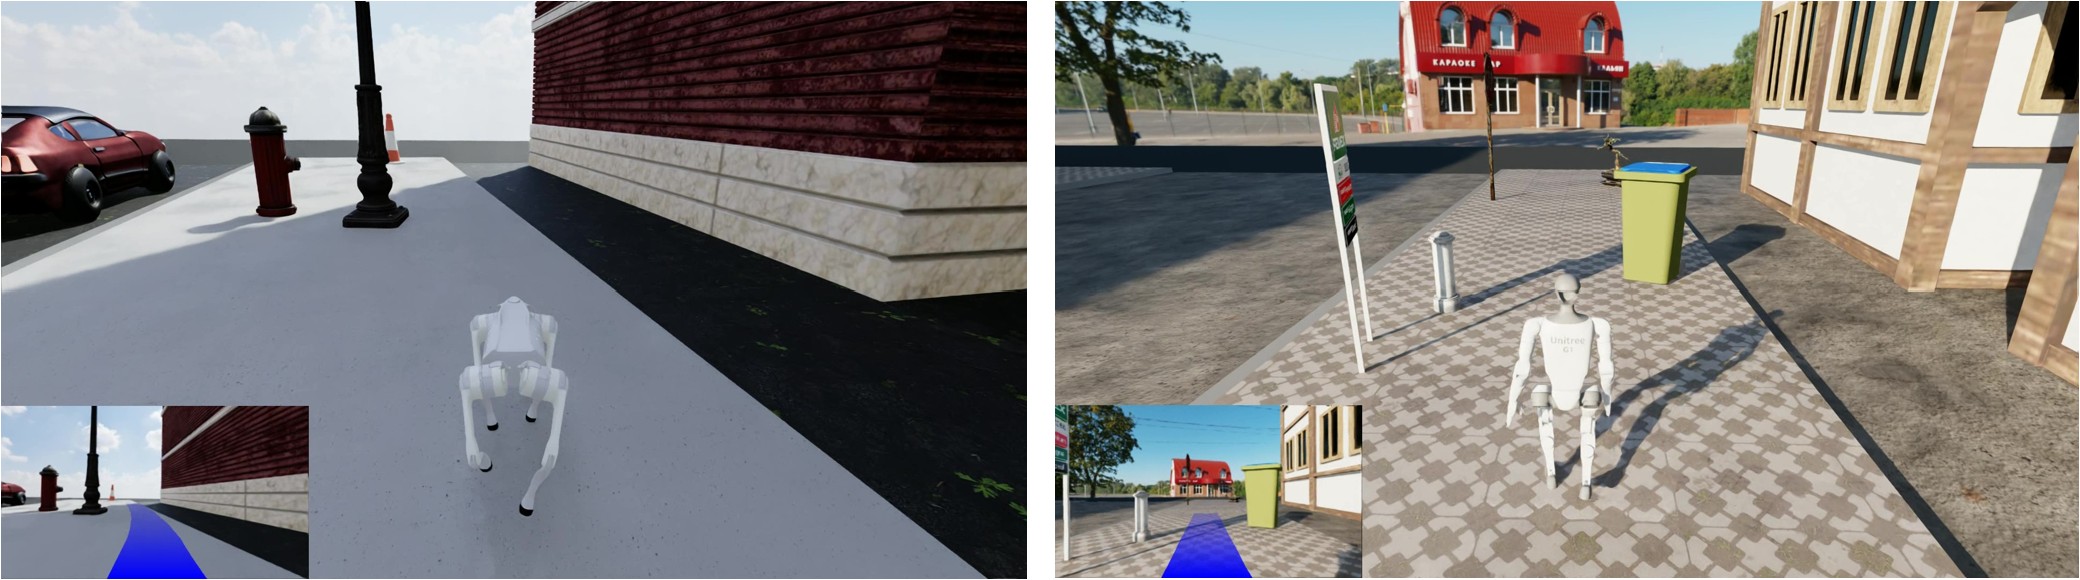
Testing Scenario Configurations
The primary four-wheel delivery robot is limited to 1.5 m/s and 0.65 rad/s. A common PD controller converts predicted waypoints into velocities. Ten parallel environments run on one L40S with 0.005-second physics steps. The simulator waits for each policy command, excluding computation latency even while matching model observation frequency. Gesture success means stopping within three metres in front of the person; conversation/queue success requires going around the entire group, not between its members.
Models
Privileged route information is removed: image-goal models run exploration modes, point-goal models receive random forward points two to ten metres away with lateral offsets within ±2 metres, and language models get “Follow the sidewalk.” This standardizes the intended sidewalk-following task but changes goal-conditioned models’ normal use. Route-consistent goals are supported separately by the code. OpenPilot is retrained on one thousand sidewalk hours and uses two recent images plus recurrent context.
Appendix B Ablation on Sidewalk Training Data
Retraining ViNT on three hundred sidewalk hours increases average procedural completion from 20.9% to 85.9% and reduces long-route failures from 25.24 to 1.24 per hundred metres. OpenPilot improves from 73.7%/7.57 with ten hours to 91.1%/0.68 with one thousand. At matched three hundred hours, ViNT obtains 85.9%/1.24 versus OpenPilot’s 84.8%/1.80. Domain and scale are influential here; the comparison does not prove architecture never matters, and individual block scores are not monotonically improved at every data scale.
| Row | Model | Data (# Hours) | Straight | Curve | Crosswalk | Average | Long-horizon |
|---|---|---|---|---|---|---|---|
| 1 | ViNT [50] | General | 15.4 | 16.5 | 30.9 | 20.9 | 25.24 |
| 2 | ViNT [50] | Sidewalk (300) | 72.6 | 85.8 | 99.4 | 85.9 | 1.24 |
| 3 | OpenPilot [10] | Sidewalk (10) | 68.2 | 53.2 | 99.8 | 73.7 | 7.57 |
| 4 | OpenPilot [10] | Sidewalk (100) | 78.0 | 72.3 | 95.4 | 81.9 | 2.59 |
| 5 | OpenPilot [10] | Sidewalk (300) | 81.1 | 78.0 | 95.2 | 84.8 | 1.80 |
| 6 | OpenPilot [10] | Sidewalk (1000) | 87.6 | 86.5 | 99.3 | 91.1 | 0.68 |
Appendix C More Results of Unit-test Scenarios
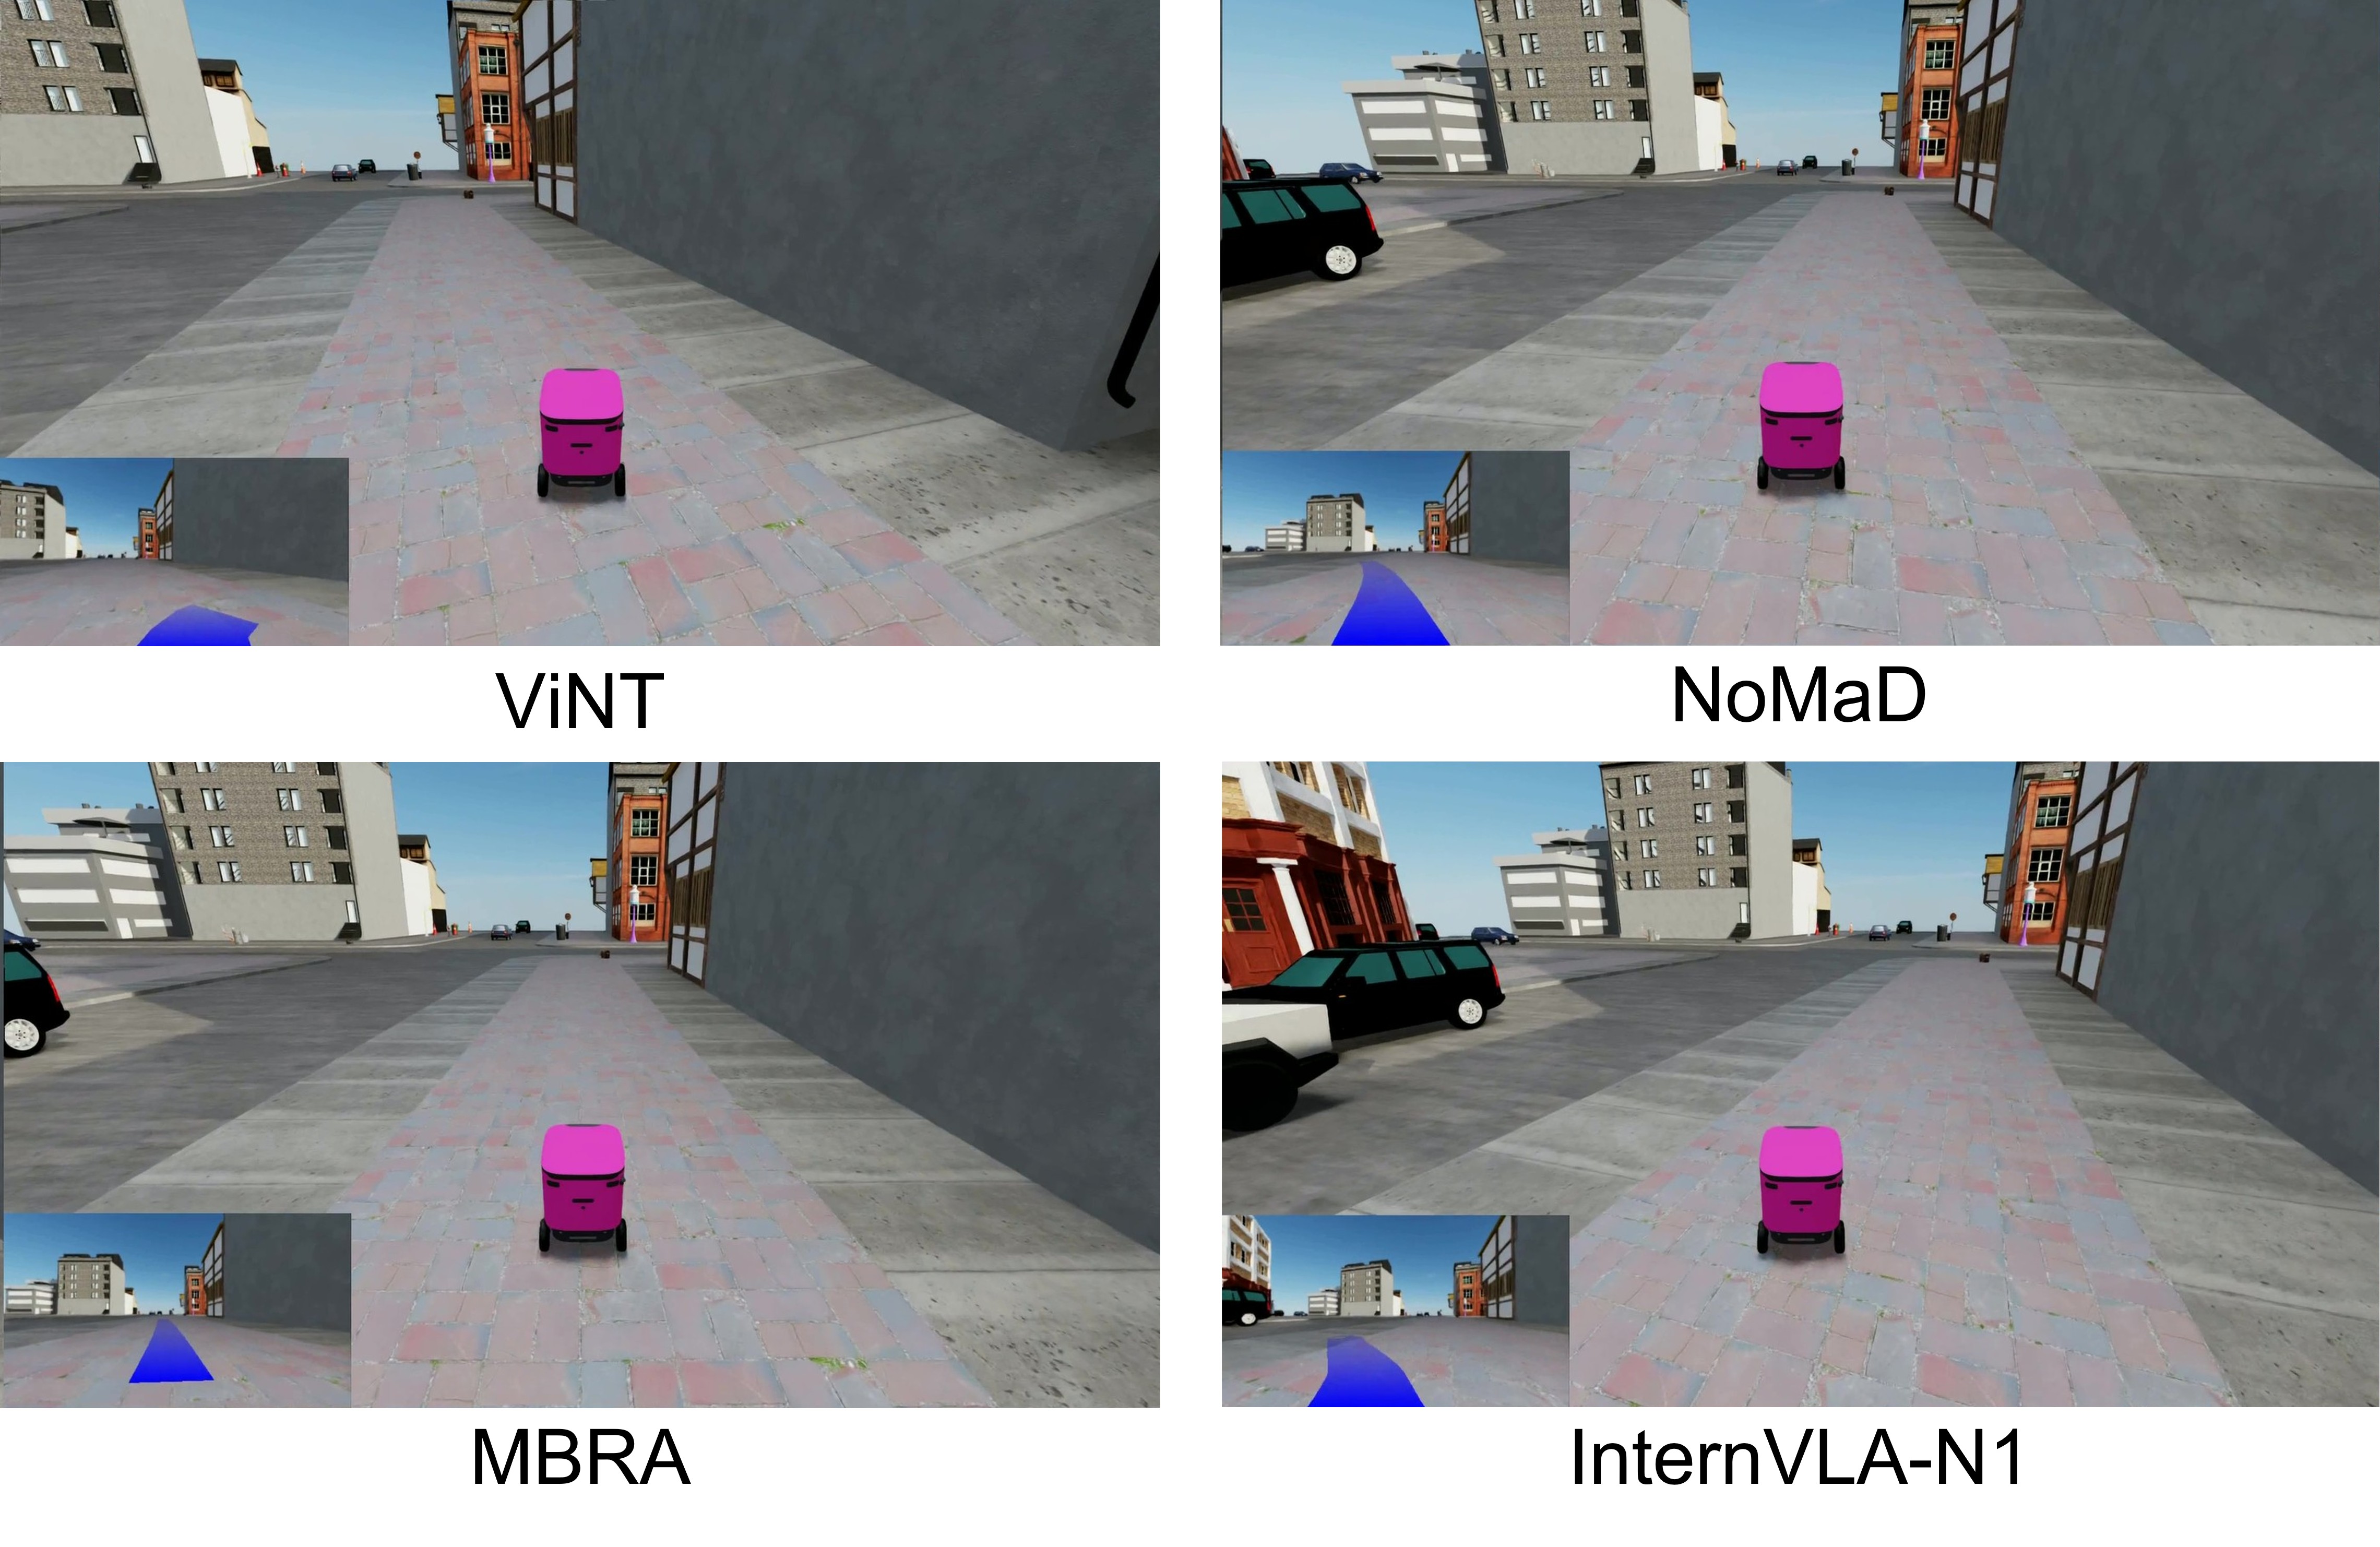
Tables 6–7 report five-run success, success-weighted path length, and completion. ViNT’s poor general-data performance improves after the separate domain retraining, so it should not be interpreted as an immutable architectural limitation. Curves and final crosswalk ramps are difficult: S2E’s procedural crossing completion is 95.9% but success only 63.2%. Small gaps between success and path-weighted success indicate efficient successful routes, not that unsuccessful episodes are satisfactory.
| Procedurally Generated Scenes | |||||||||
| Straight | Curve | Crosswalk | |||||||
| Method | SR% | SPL% | RC% | SR% | SPL% | RC% | SR% | SPL% | RC% |
| ViNT [50] | |||||||||
| NoMaD [51] | |||||||||
| MBRA [26] | |||||||||
| CityWalker [39] | |||||||||
| InternVLA-DualVLN [55] | |||||||||
| MIMIC [24] | |||||||||
| S2E [25] | |||||||||
| FlowPilot [23] | |||||||||
| OpenPilot [10] | |||||||||
| Real-World Scanned Scenes | |||||||||
| Straight | Curve | Crosswalk | |||||||
| Method | SR% | SPL% | RC% | SR% | SPL% | RC% | SR% | SPL% | RC% |
| ViNT [50] | |||||||||
| NoMaD [51] | |||||||||
| MBRA [26] | |||||||||
| CityWalker [39] | |||||||||
| InternVLA-N1 [55] | |||||||||
| MIMIC [24] | |||||||||
| S2E [25] | |||||||||
| FlowPilot [23] | |||||||||
| OpenPilot [10] | |||||||||
Appendix D More Results of Pedestrian-reactive Scenarios
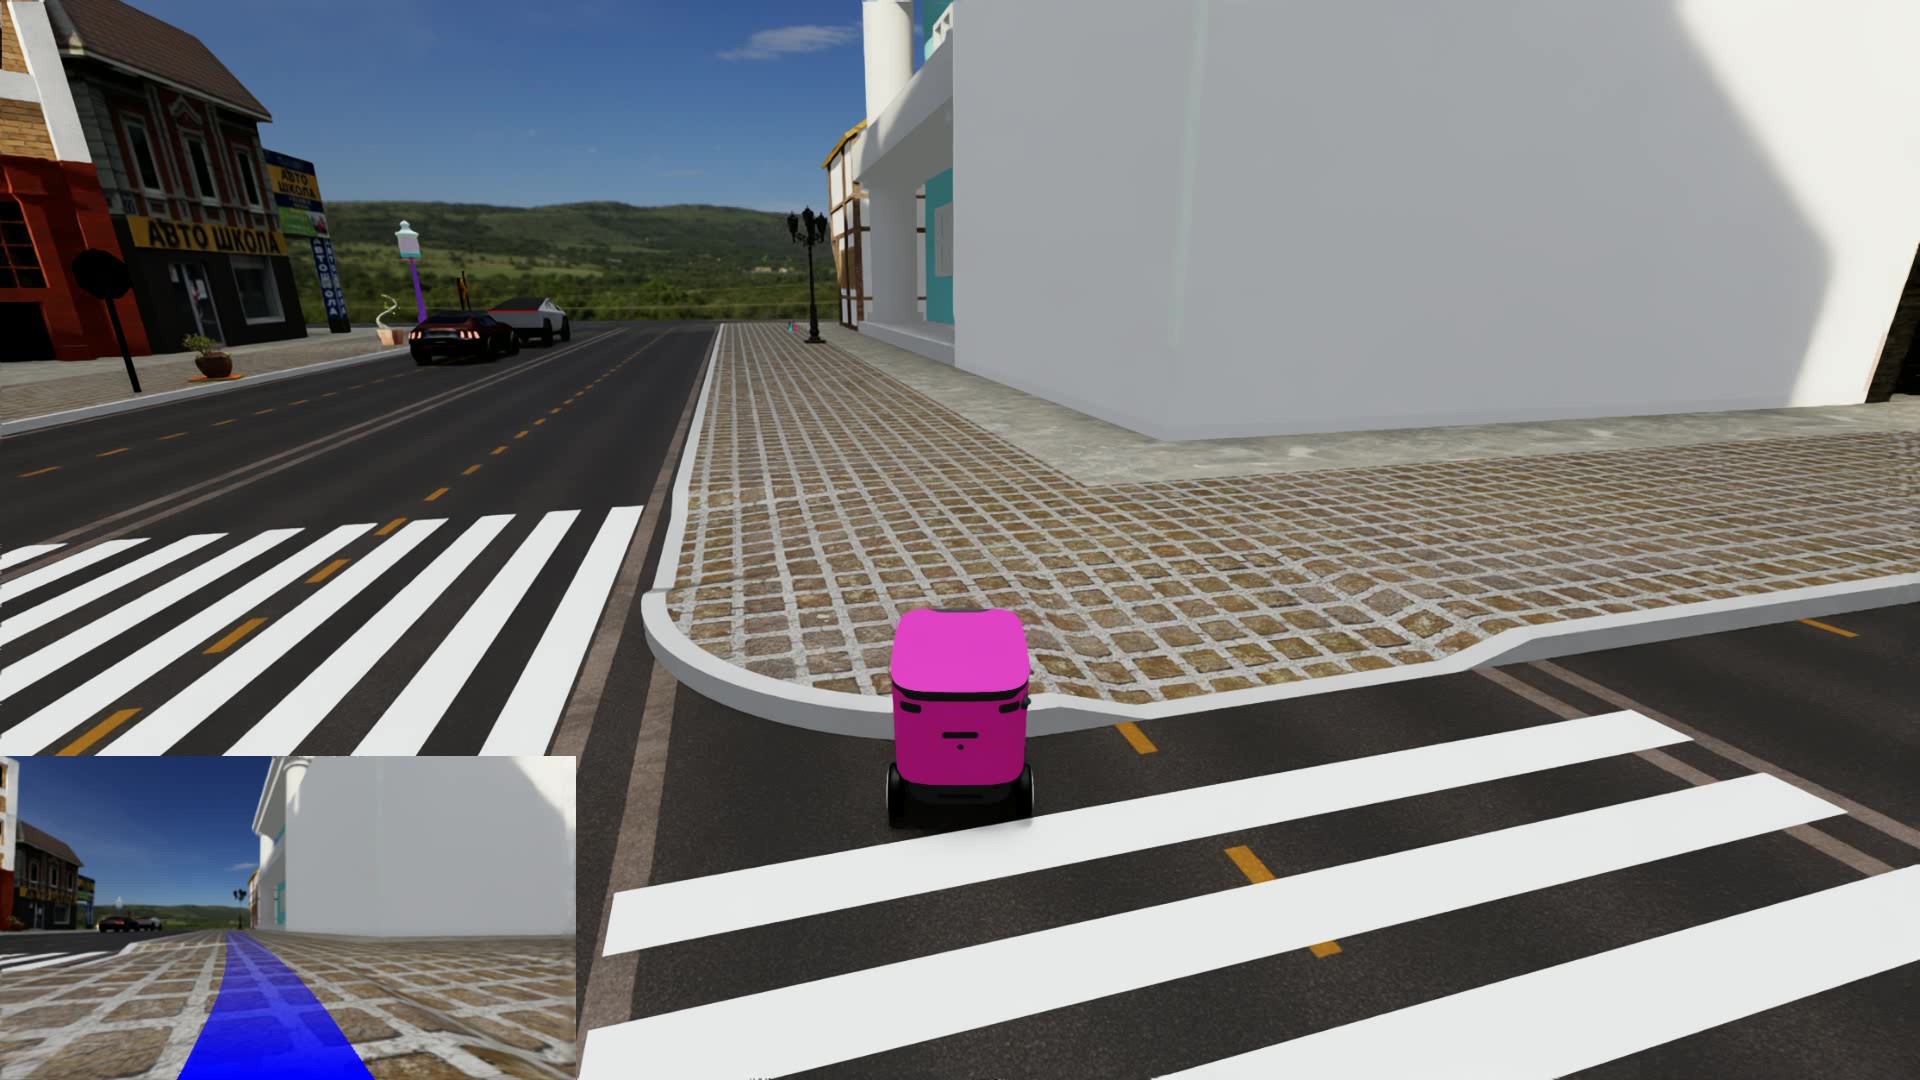
InternVLA’s frontal-approach success is only 18.8%, yet its pedestrian collision rate is 8.4% versus S2E’s 45.6%. Minimum distance on successful trials is 1.35 m versus 0.86 m. This supports considering social clearance separately from progress, but conditioning distance on successful trials and allowing freezing prevents interpreting low collision rates as complete social competence. The proposed combination of large-model reasoning and lightweight control remains future work rather than a tested hybrid.
| Metric | Method | Obstructing | Conversing | Queueing | Frontal | Lateral | Overtaking | Ped-Crossing | Gesturing |
|---|---|---|---|---|---|---|---|---|---|
| Pedestrian Collision Rate (%) | ViNT [50] | ||||||||
| NoMaD [51] | |||||||||
| MBRA [26] | |||||||||
| CityWalker [39] | |||||||||
| InternVLA-DualVLN [55] | |||||||||
| MIMIC [24] | |||||||||
| S2E [25] | |||||||||
| FlowPilot [23] | |||||||||
| OpenPilot [10] | |||||||||
| Avg | |||||||||
| Minimum Pedestrian Distance (m) | ViNT [50] | – | – | – | |||||
| NoMaD [51] | – | ||||||||
| MBRA [26] | – | ||||||||
| CityWalker [39] | |||||||||
| InternVLA-DualVLN [55] | – | ||||||||
| MIMIC [24] | – | ||||||||
| S2E [25] | |||||||||
| FlowPilot [23] | – | ||||||||
| OpenPilot [10] | – | ||||||||
| Avg |
Appendix E More Results of Long-horizon Scenarios
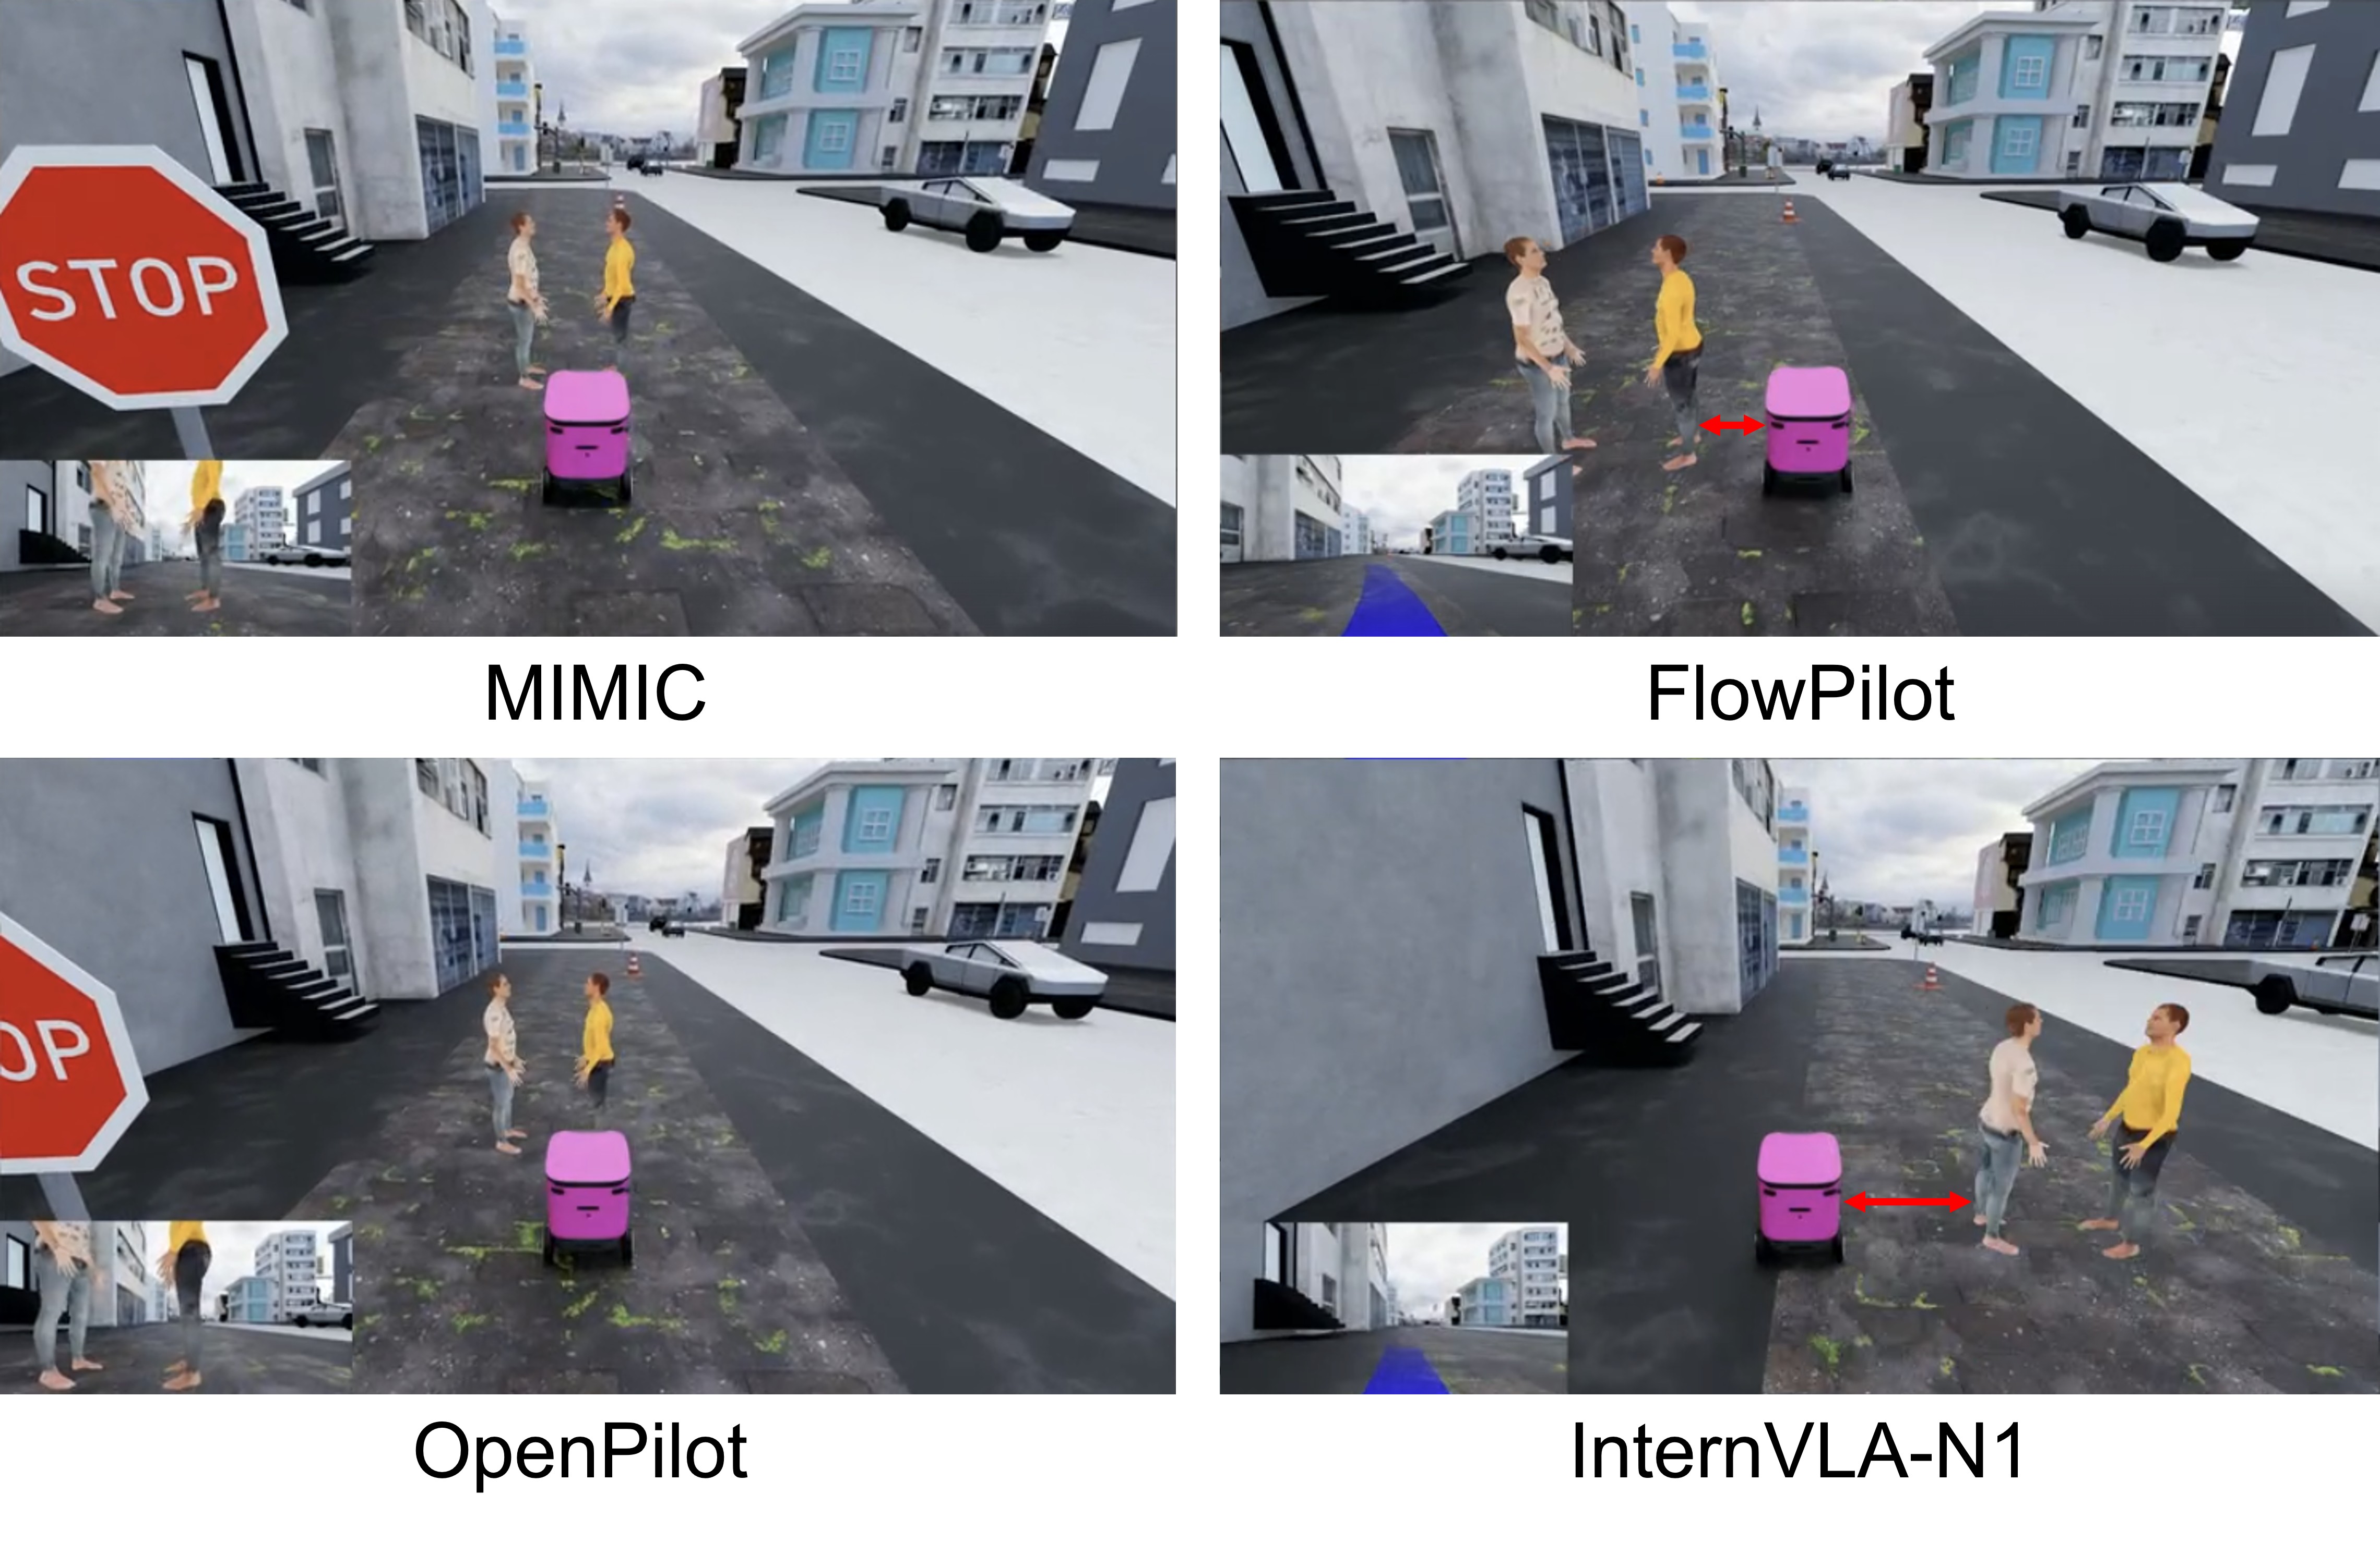
Table 9 decomposes long-route failures. OpenPilot’s procedural 0.68 comprises 0.32 collisions, 0.24 out-of-lane, and 0.12 freezing events per hundred metres; scanned scenes report 0.74 total with 0.55 collisions. MIMIC and FlowPilot are competitive in total procedural counts but differ in speed and collision frequency. Long-route aggregate scores are reported without the five-run deviations provided for the shorter tests.
| Procedurally Generated Scenes | Real-World Scanned Scenes | |||||||||
| Method | FC | C | OL | F | FC | C | OL | F | ||
| ViNT [50] | 25.24 | 3.48 | 21.71 | 0.05 | 1.03 | 24.11 | 7.36 | 16.38 | 0.37 | 1.19 |
| NoMaD [51] | 8.70 | 2.08 | 6.50 | 0.13 | 1.43 | 5.89 | 2.94 | 2.94 | 0.00 | 1.48 |
| MBRA [26] | 7.10 | 2.10 | 4.84 | 0.16 | 1.44 | 5.15 | 2.58 | 2.58 | 0.00 | 1.46 |
| CityWalker [39] | 11.10 | 1.39 | 7.10 | 2.62 | 0.34 | 10.86 | 4.05 | 1.29 | 5.52 | 0.14 |
| InternVLA-N1 [55] | 12.92 | 2.43 | 10.33 | 0.15 | 1.33 | 9.39 | 4.23 | 4.97 | 0.18 | 1.28 |
| MIMIC [24] | 1.41 | 0.85 | 0.48 | 0.08 | 0.61 | 1.66 | 1.47 | 0.00 | 0.18 | 0.34 |
| S2E [25] | 2.36 | 0.69 | 1.53 | 0.14 | 0.85 | 0.92 | 0.74 | 0.18 | 0.00 | 1.15 |
| FlowPilot [23] | 1.34 | 0.71 | 0.55 | 0.08 | 1.15 | 0.92 | 0.92 | 0.00 | 0.00 | 1.06 |
| OpenPilot [10] | 0.68 | 0.32 | 0.24 | 0.12 | 1.19 | 0.74 | 0.55 | 0.00 | 0.18 | 1.19 |
Appendix F Details of Synthetic Training Data Generation
Five hundred successful demonstration episodes are collected for each of crossing and gesturing using ORCA reference trajectories in the policy’s observation/action format. Finetuning freezes the visual backbone and updates lightweight action/adaptation modules for fifty epochs with AdamW, learning rate 5×10⁻⁶ decaying to 10⁻⁶ and gradient norm capped at one. The physical evaluation uses ten trials per scenario across two locations under the same task rules. A small targeted study demonstrates promise while leaving wider behavior and route coverage untested.