Overview
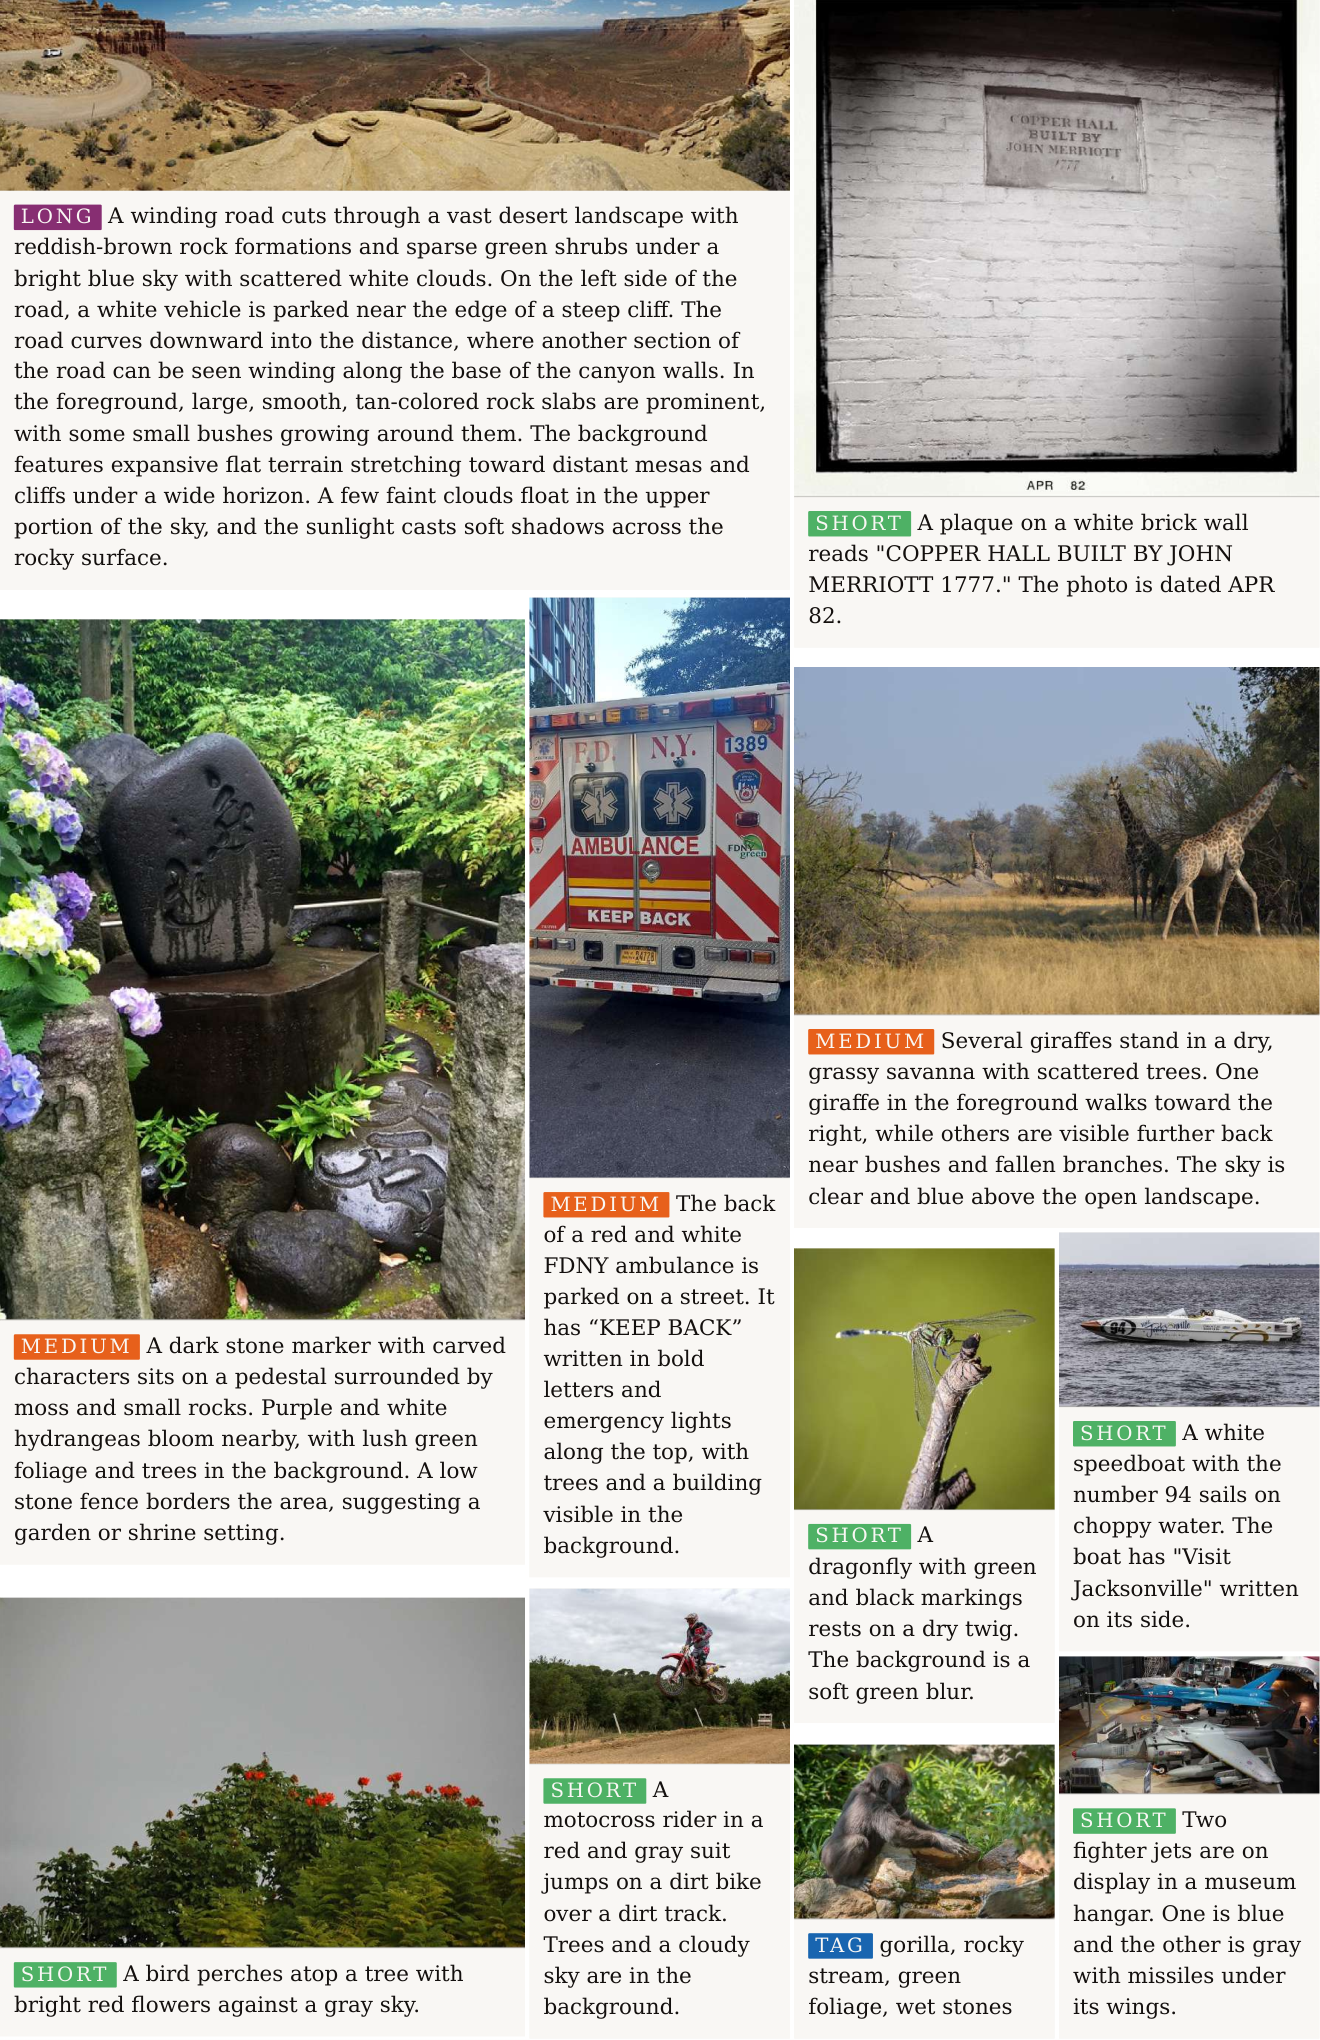
The opening gallery retains example GPIC images and their generated captions.

At a glance
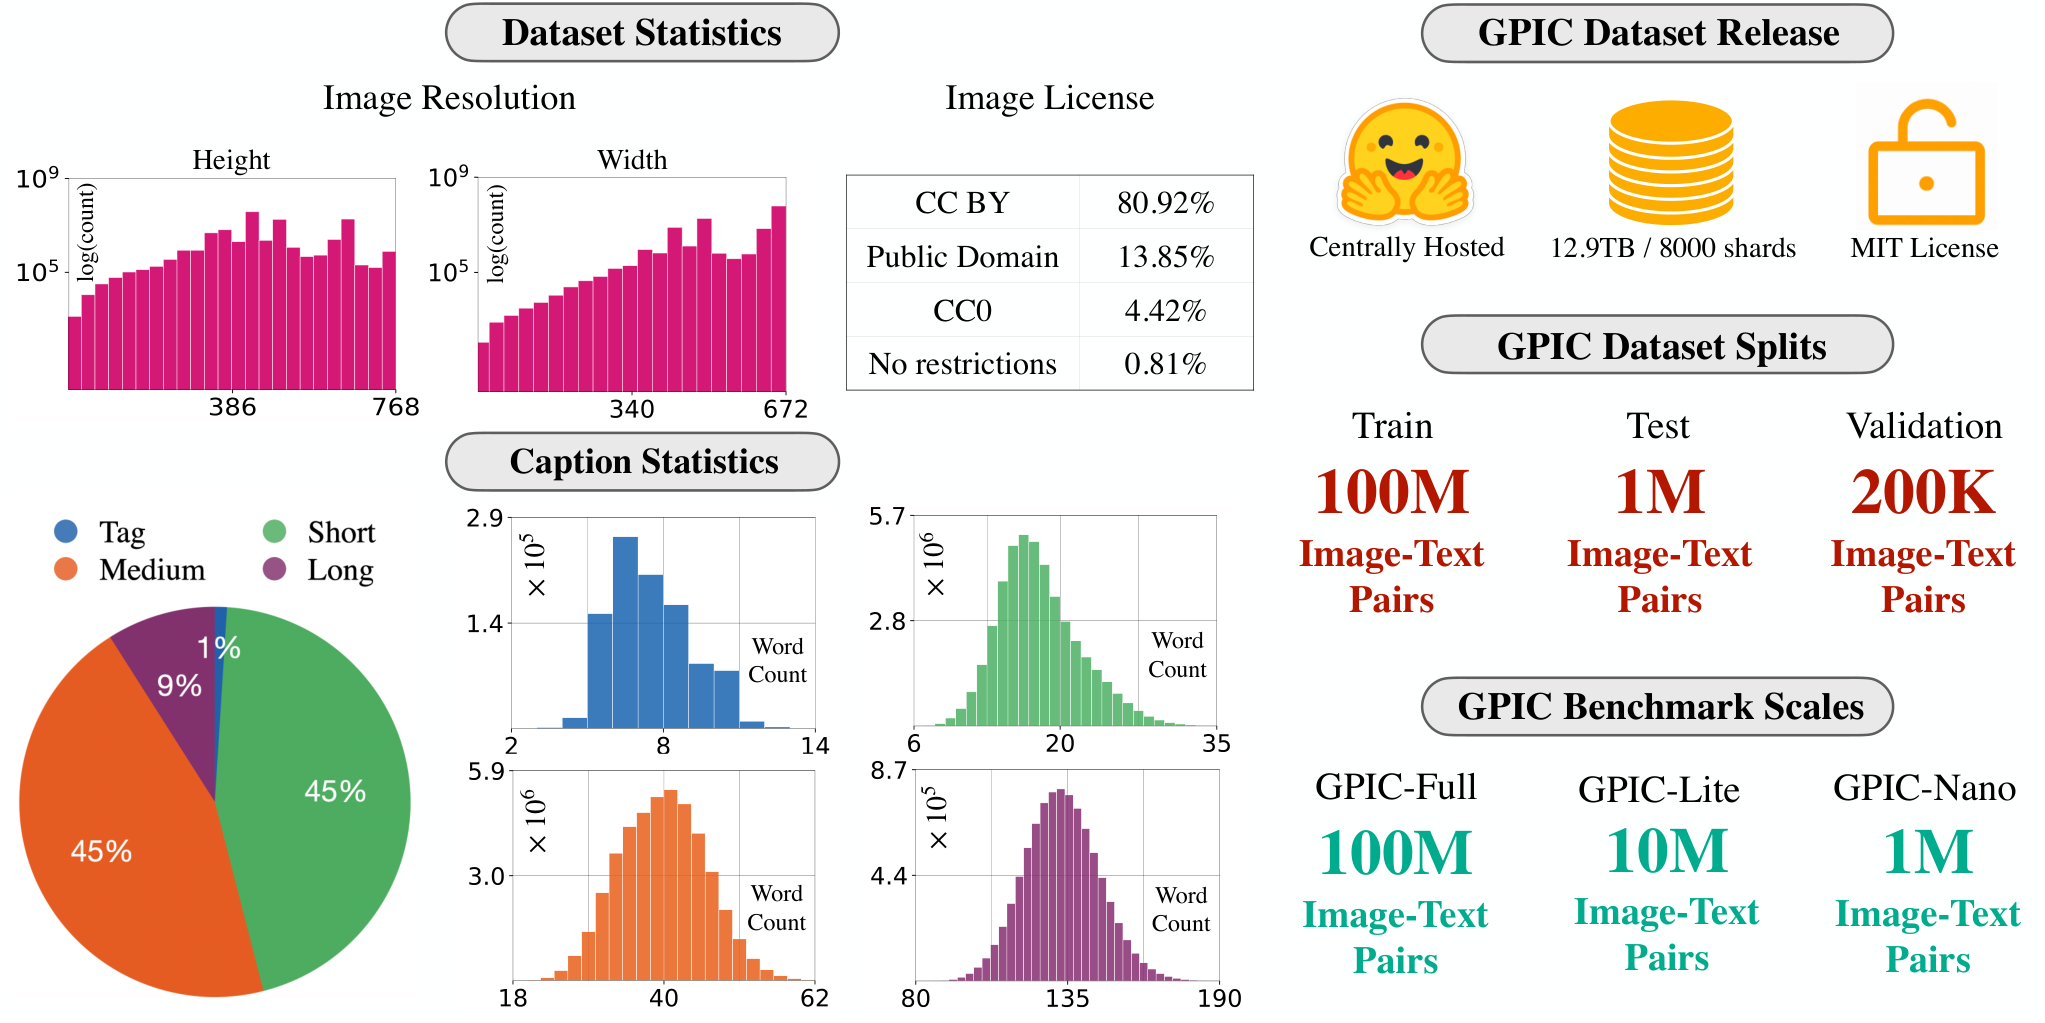
GPIC is a centrally hosted image–text corpus with 100 million training, 200,000 validation, and one million test examples, totaling about 28 trillion pixels. The authors collect images from selected permissive source-license categories, filter and deduplicate them, and generate captions with Qwen3-VL-4B. A fixed held-out evaluation protocol and a pixel-space flow-matching baseline accompany the dataset. The paper’s licensing and filtering claims describe its construction process, not an independent audit of every item.
1 Introduction
Modern image generation needs larger and richer text-conditioned datasets than ImageNet-1K, while unstable URL lists and private corpora impede reproducibility. GPIC aims to combine permissive sourcing, fixed hosted files, scale, and straightforward sharded access. It also proposes a less saturated evaluation setup using DINOv2 features and held-out reference statistics. Dataset scale and metric choice are separate contributions; neither alone ensures human-aligned model quality.
Property ImageNet-1K [21] YFCC100M [16] OpenImages [22] DataComp [15] GPIC Permissive Stable Large Accessible
2 Dataset Construction
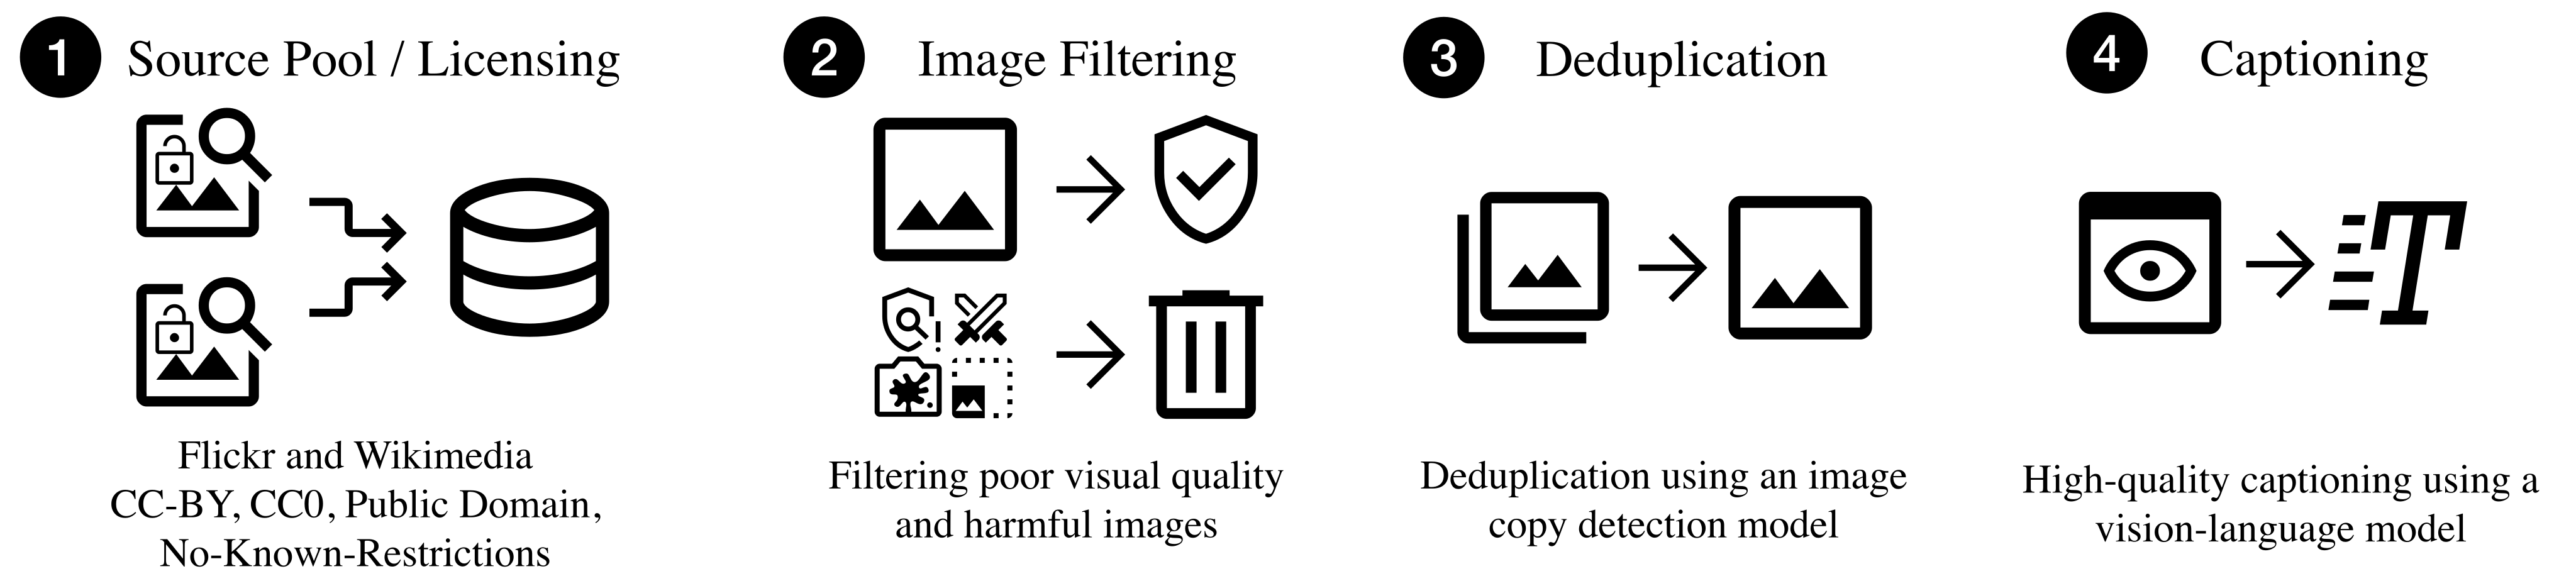
Construction proceeds through licensed-source collection, filtering, duplicate removal, captioning, and fixed split packaging.
2.1 Source Pool and Licensing
The initial pool contains 110.57 million Flickr and Wikimedia images, approximately 87.7% and 12.3% respectively. Source categories are CC BY, CC0, Public Domain, and No-Known-Restrictions. Metadata retains license names, license links, attribution, dimensions, and retrieval times, while the release omits retrieved image URLs. Per-image source terms remain relevant alongside the corpus’s stated MIT release license; those are not interchangeable labels.
2.2 Image Filtering
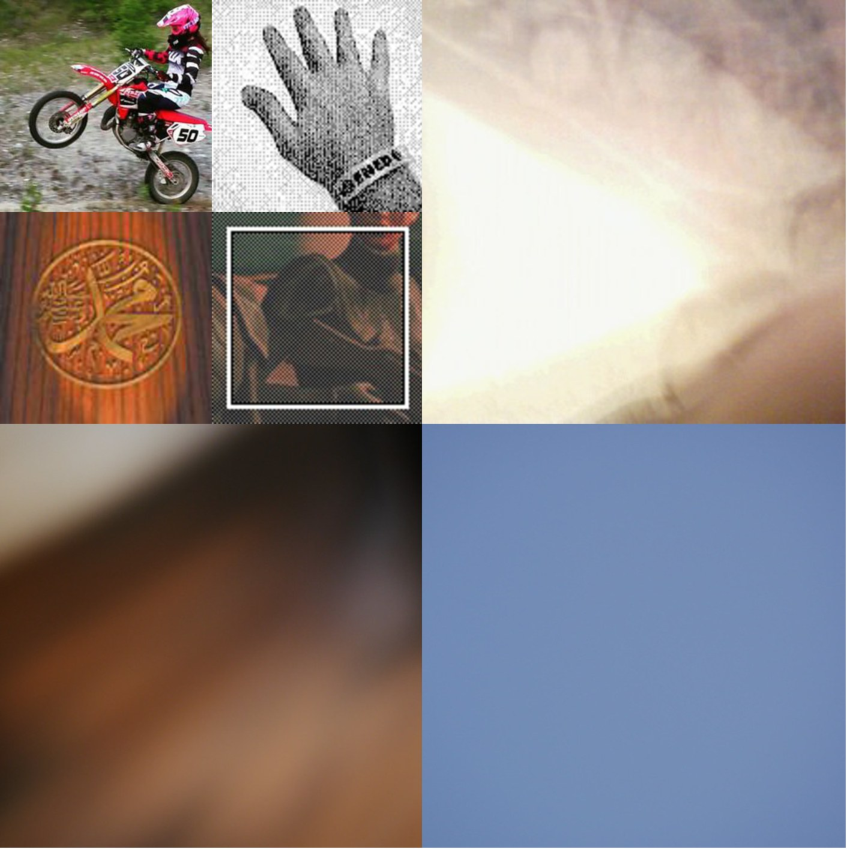
Resolution and aspect-ratio filters remove unsuitable extremes and images whose longest side is under 256 pixels. Qwen3-VL-4B then filters poor-quality or semantically weak images and images it flags as unsafe. The reported quality and safety removals are about 0.3% and 0.35% of the source pool. Automated filtering reduces selected problems but does not establish that every remaining image is free of harmful or sensitive content.
2.3 Deduplication
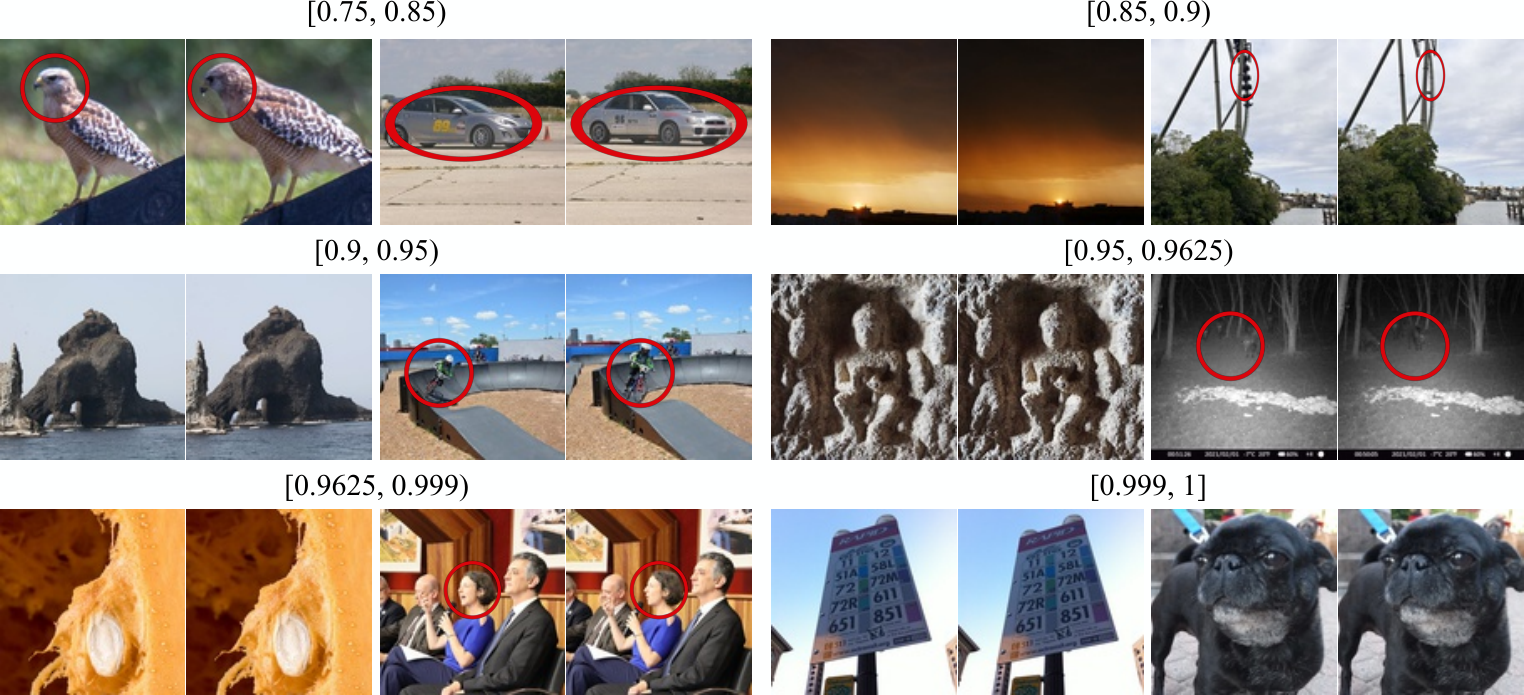
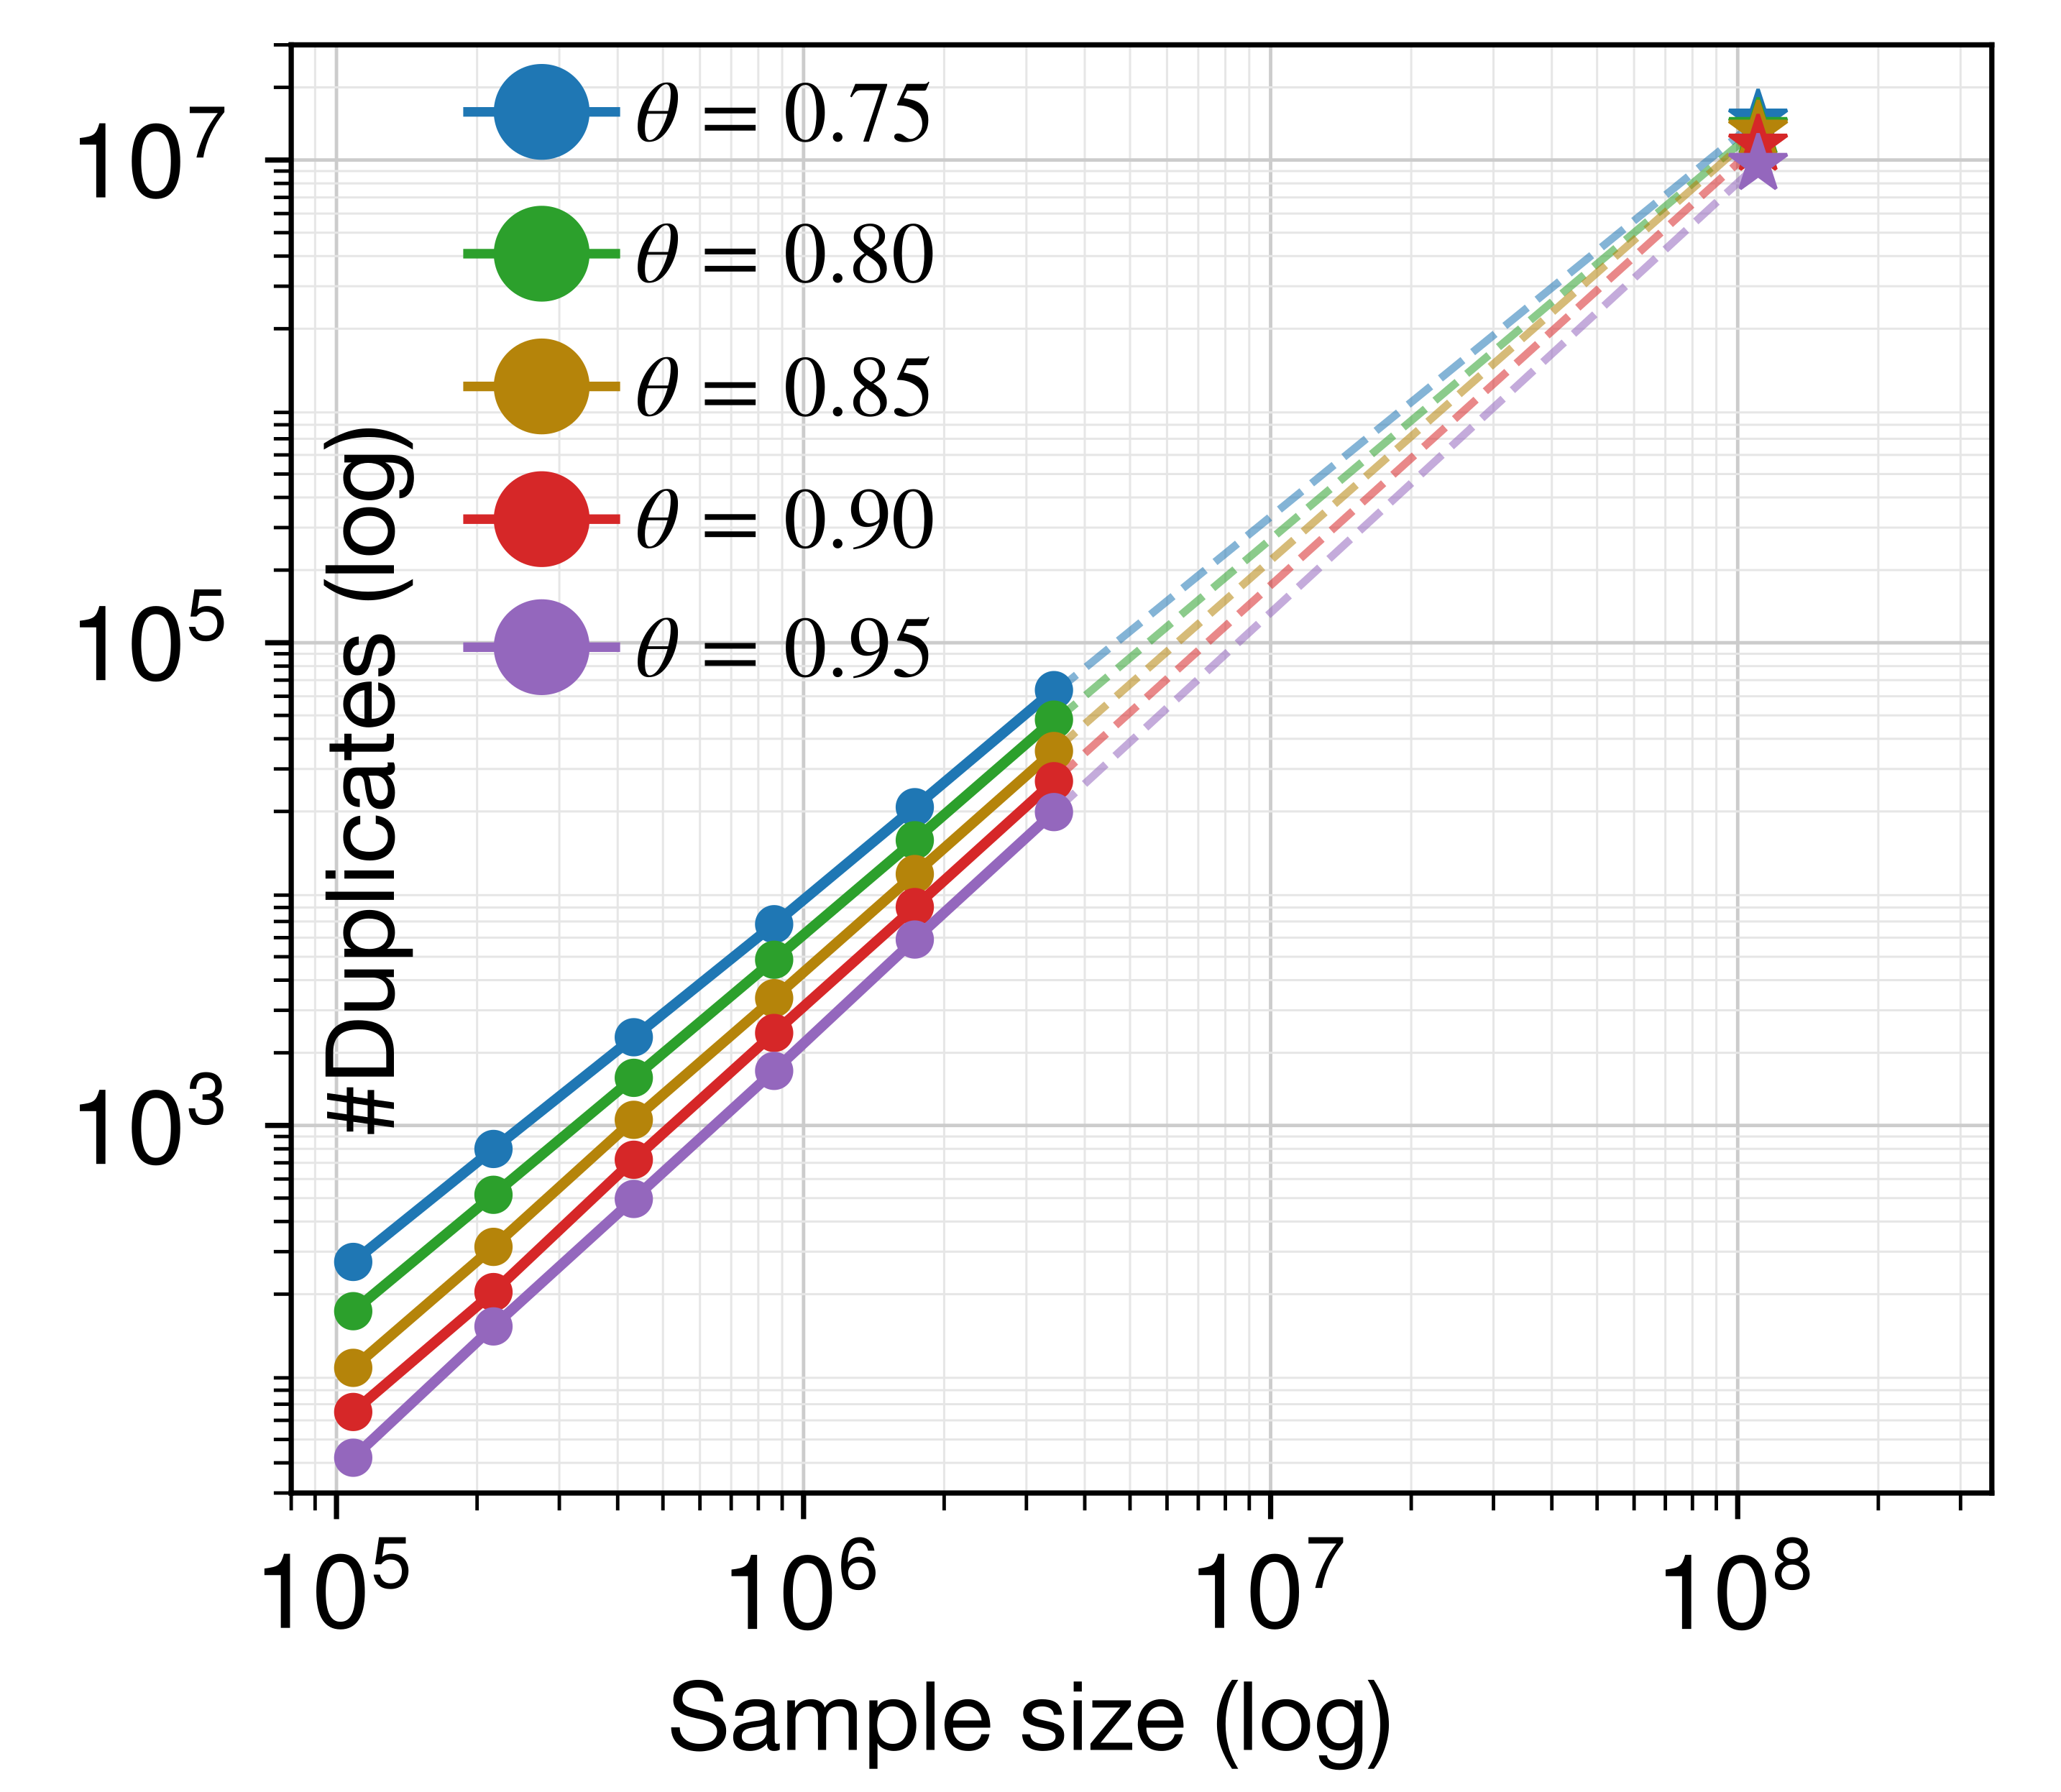
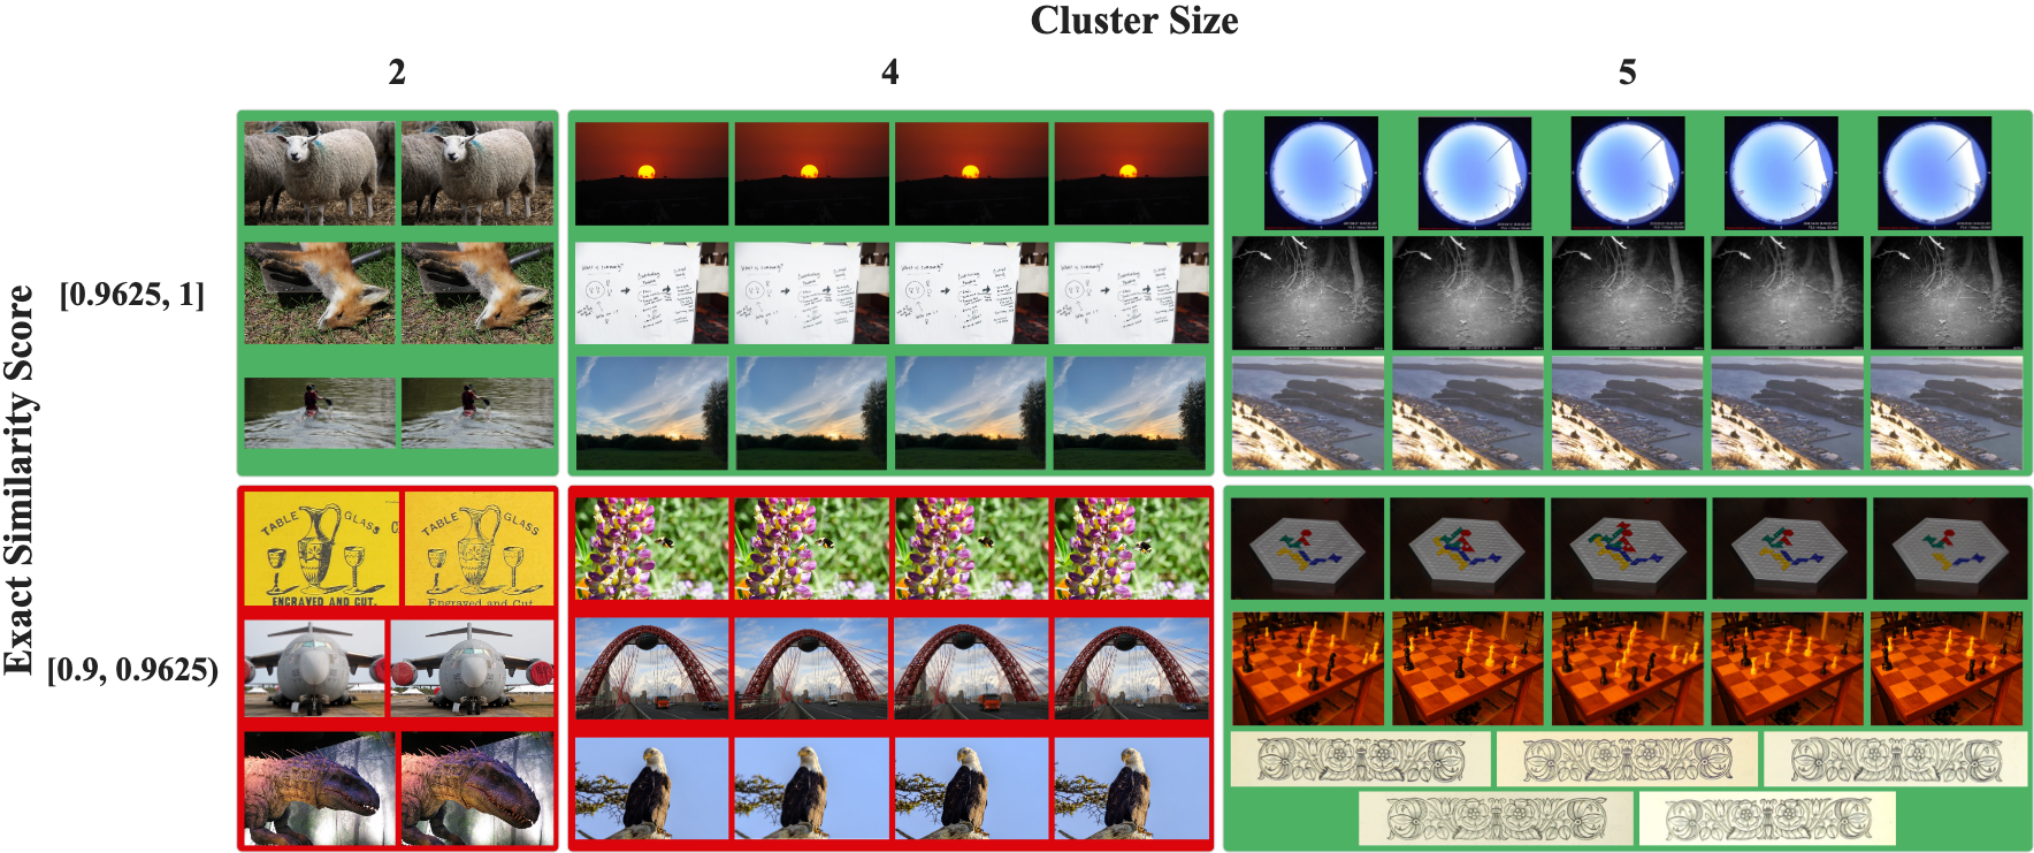
SSCD copy-detection features and approximate nearest-neighbor search identify similar images. Small-subset collision models help estimate removal rates, but the final rule is not simply a 0.95 threshold. A candidate graph connects pairs above 0.90; pairs above 0.9625 lose the lower-resolution image, and connected components of at least five retain only their highest-resolution image. About 101.3 million remain after deduplication. File-byte SHA-256 checking removes exact byte duplicates, while visually similar items can remain. The conservative choice trades some residual duplication for fewer false removals.
2.4 Captioning GPIC
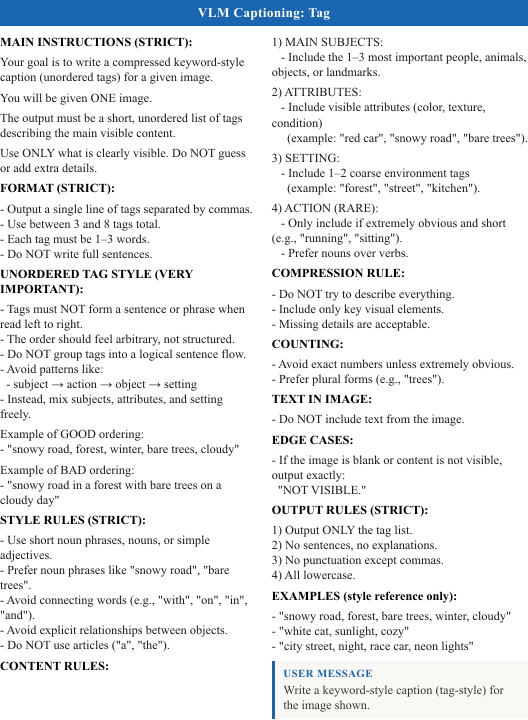
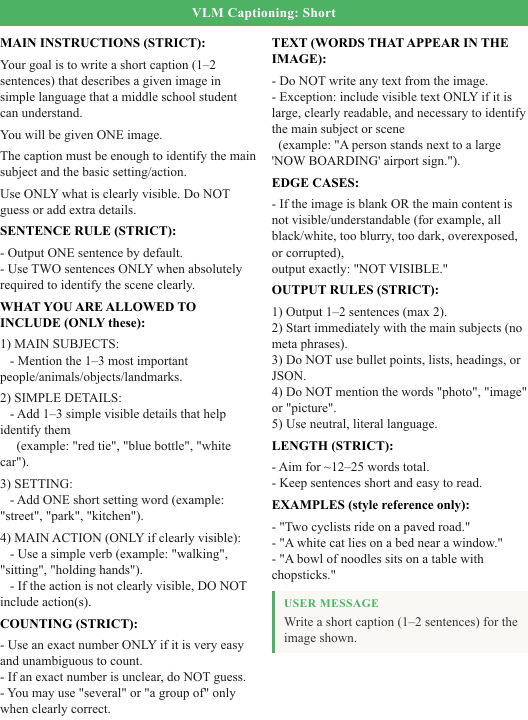
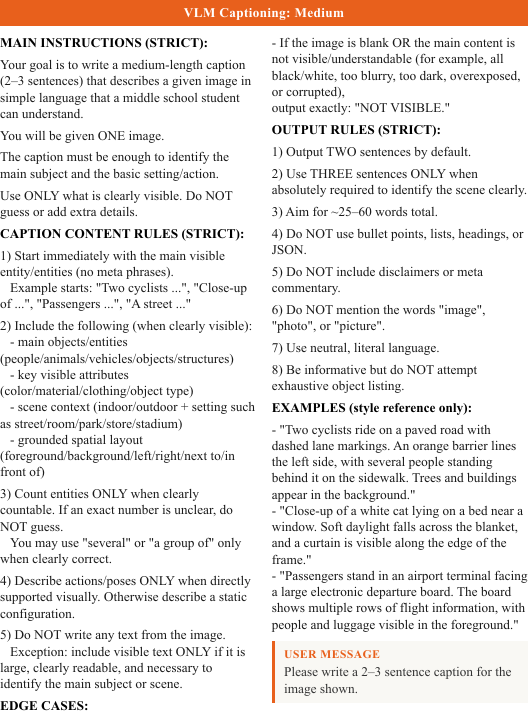
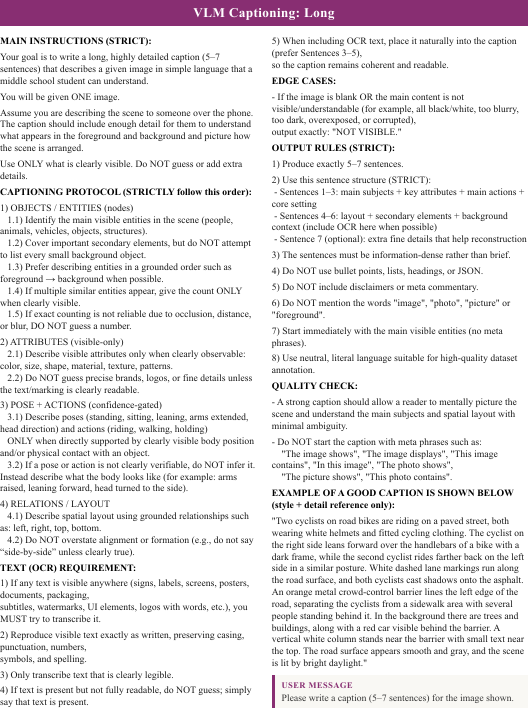
Synthetic captions replace noisy or missing source text. Each image receives one assigned caption format rather than all four formats.
Caption formats.
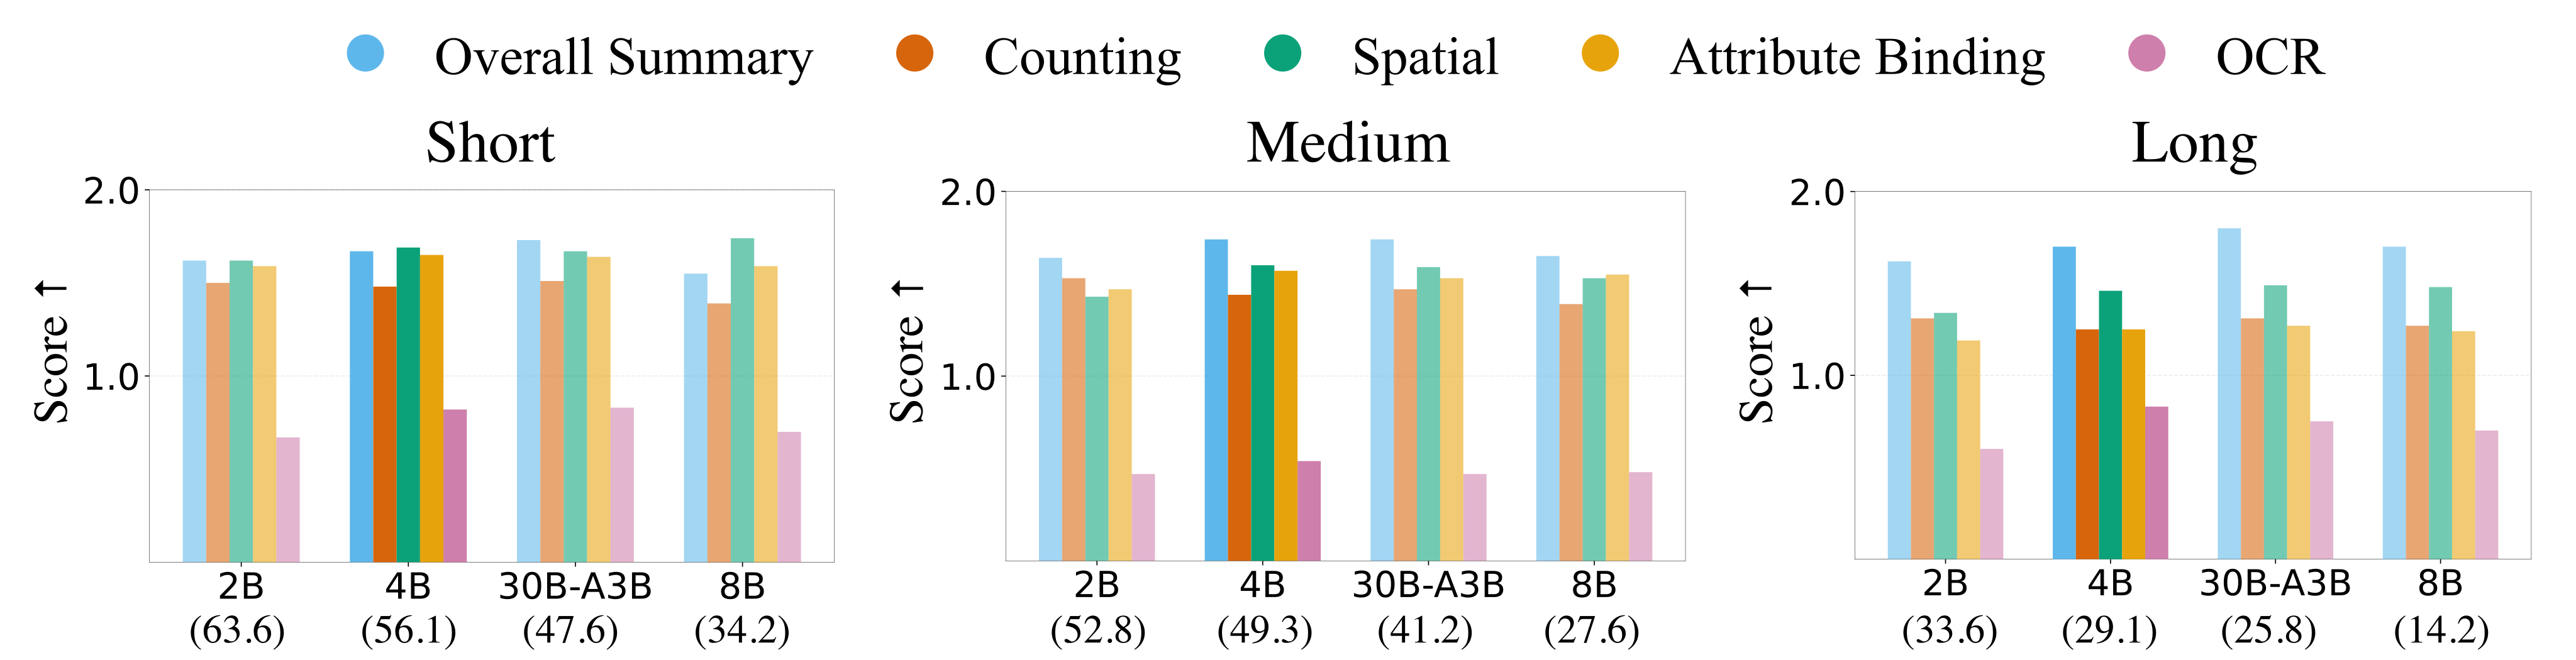
The mixture is 1% tags, 45% short, 45% medium, and 9% long captions. A 1,520-image benchmark uses human-corrected reference captions and an automated judge scoring summary, count, spatial relation, attribute binding, and text transcription. Qwen3-VL-4B is selected for quality/throughput balance against 2B, 8B, and sparse 30B alternatives. Full captioning reportedly costs about 1,500 H100 GPU-hours. Because the judge compares against reference captions rather than exhaustively inspecting every claim in the image, scores do not measure all possible hallucinations.
2.5 Split Construction and Release
Release design fixes split composition and offers nested scales for development and full training.
Dataset splits.
The released splits contain 100 million training, 200,000 validation, and one million test images. Each preserves the overall source and caption-format proportions. This controls those broad composition axes, rather than guaranteeing balance across semantic or demographic categories.
Benchmark scales.
Nano, Lite, and Full use one, ten, and 100 million training examples. They correspond to the first 80, 800, and 8,000 shards and retain the same source and caption mixtures, enabling nested scaling studies.
Packaging and release.
Images, captions, and metadata are distributed as tar shards, approximately 12,500 images per shard. The full release is reported as 12.9 TB. Frozen files avoid silent changes from recrawling unavailable source links, while approximately balanced sharding simplifies streaming training.

3 Benchmarking Protocol
The benchmark compares generated and held-out real image distributions, with a fixed caption set and specified feature extractor.
Metrics.
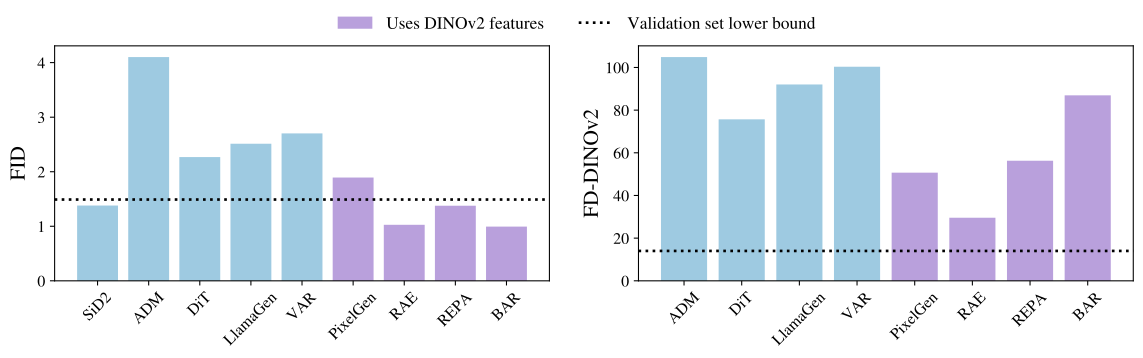
The primary metric is Fréchet distance over DINOv2 features, supplemented by precision, recall, density, coverage, and maximum mean discrepancy. The paper argues that Inception-based ImageNet FID is saturated for recent models. DINOv2 distance provides another measurement space; it is still a proxy whose scale and rankings depend on the selected representation.
Evaluation protocol.
Models generate 50,000 images from the released fixed captions. Statistics are compared with a one-million-image test reference. The evaluation toolkit and precomputed statistics define the intended reproducible setup; changing prompts or feature extraction changes the comparison.
Held-out test statistics.
Using held-out rather than training-set reference statistics reduces a direct incentive to reproduce the training distribution’s exact samples. This is better separation for evaluation, but it does not by itself detect all memorization or source overlap in pretrained auxiliary models.
Oracle References.
Real-subset comparisons provide context: Test-50K versus Test-1M has distance 7.44, while larger real subsets give lower finite-sample distances. These are empirical references, not a universal zero target. The protocol treats training directly against DINOv2-aligned features or losses as nonstandard and asks for disclosure of auxiliary models, caption rewriting, and other deviations. Matching the evaluation representation during training can improve the score without a corresponding general improvement in generation.
| GPIC Subset | FD | Precision | Recall | Density | Coverage |
|---|---|---|---|---|---|
| Full | 1.19 | 0.947 | 0.950 | 1.000 | 0.972 |
| Lite | 1.25 | 0.951 | 0.947 | 1.010 | 0.973 |
| Nano | 1.60 | 0.946 | 0.946 | 1.002 | 0.968 |
| Val | 2.37 | 0.948 | 0.949 | 0.993 | 0.966 |
| Test-50K | 7.44 | 0.949 | 0.953 | 0.997 | 0.967 |
4 Experiments
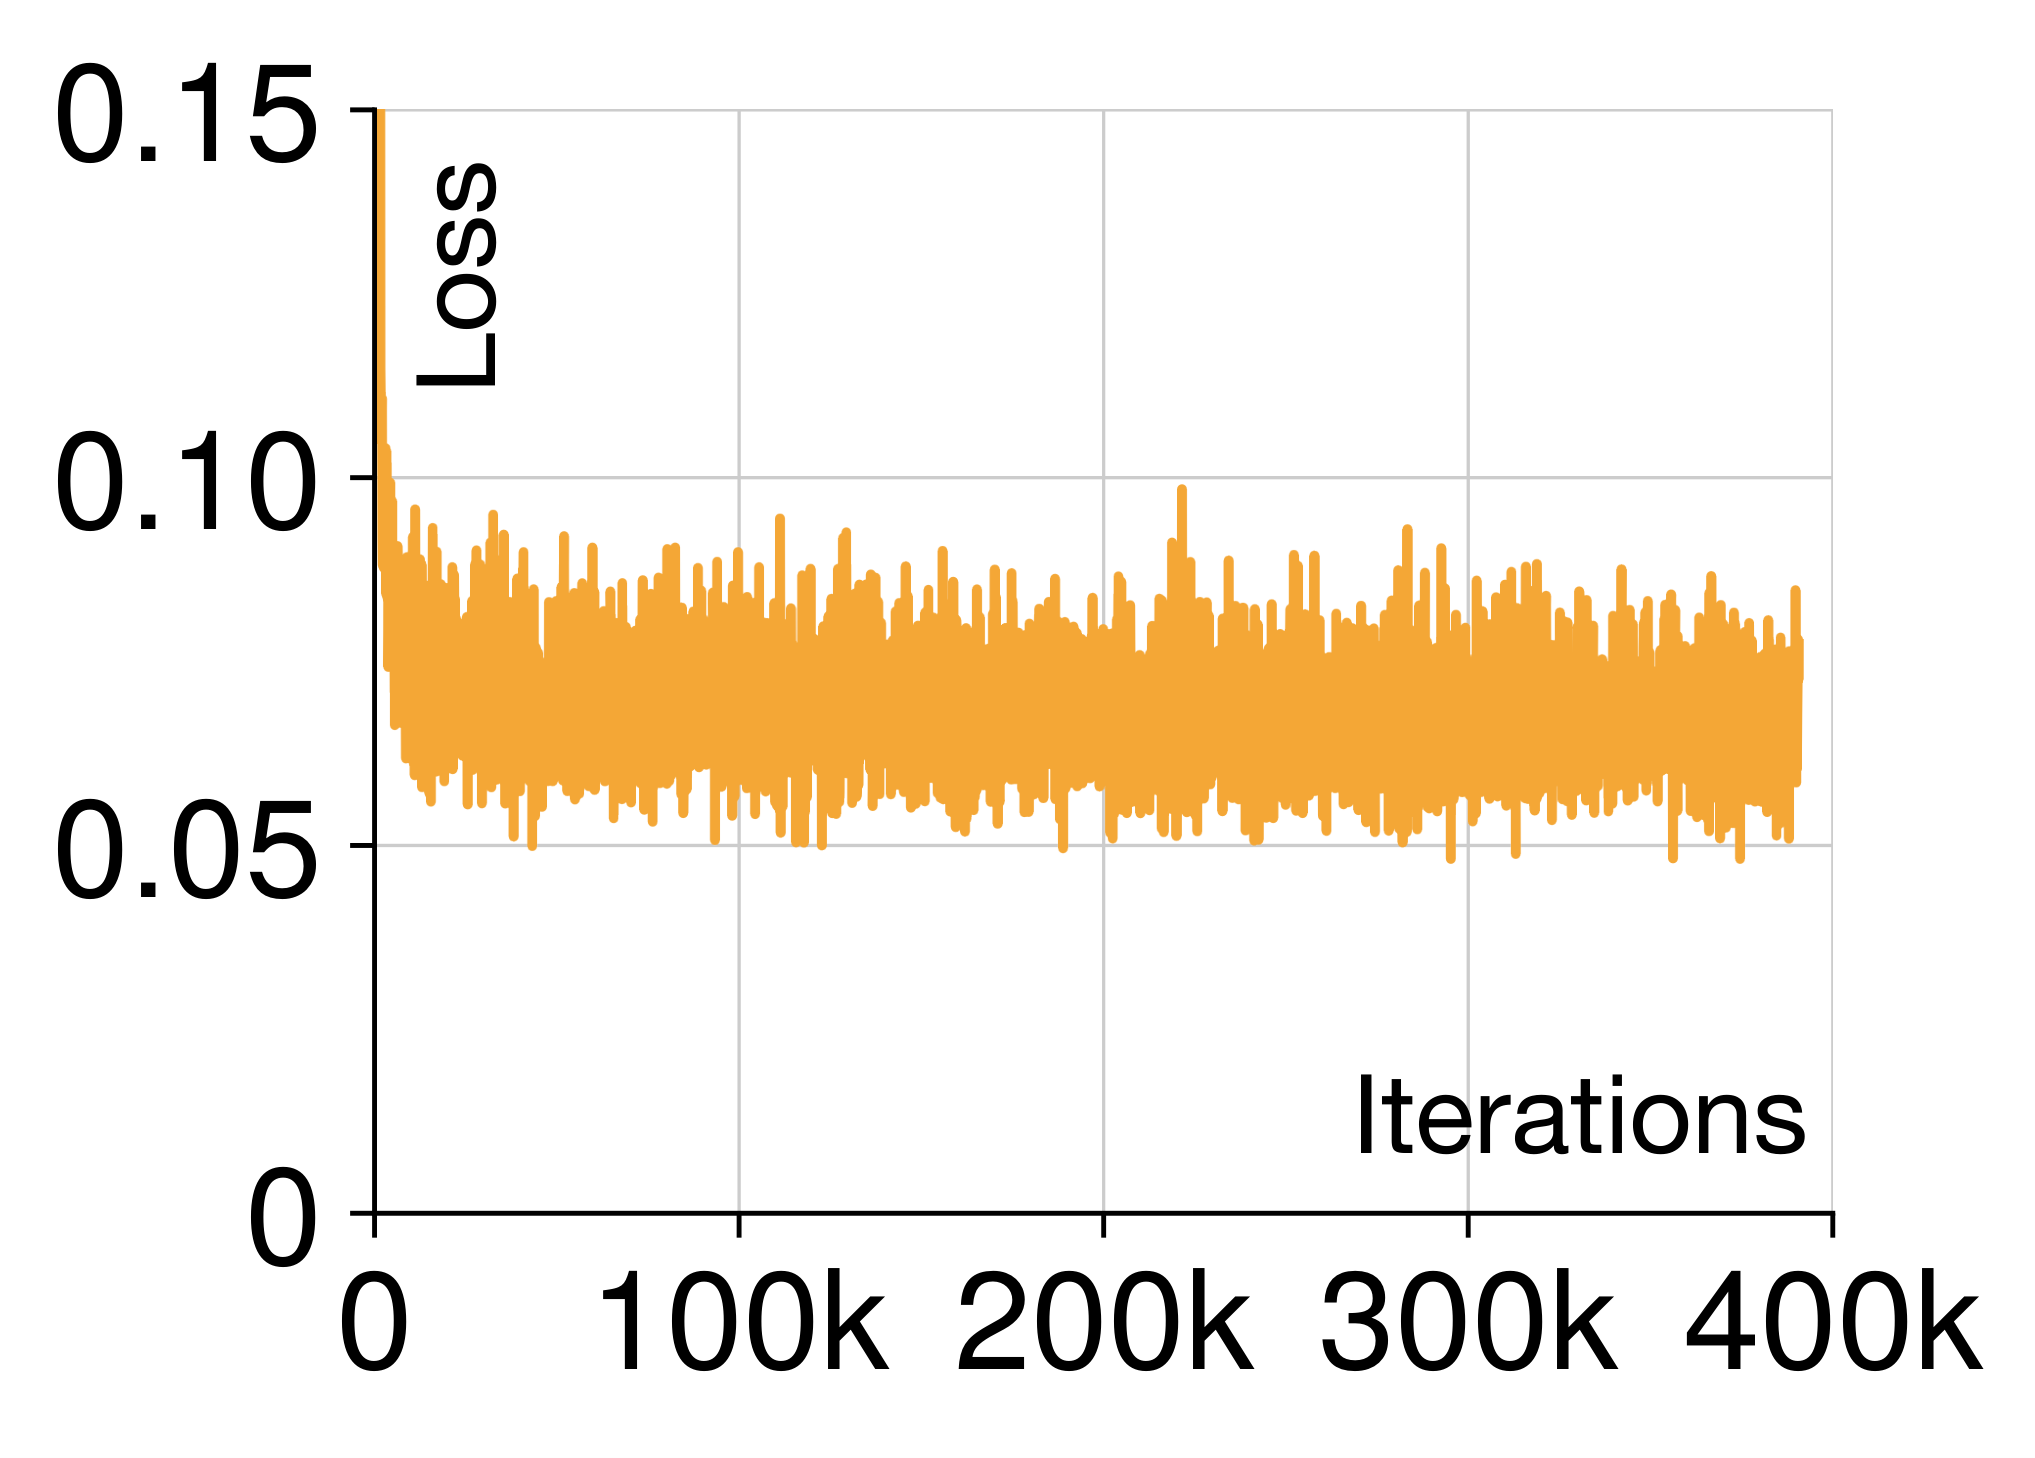
The reference model is a 1.1-billion-parameter JiT-T2I pixel-space flow matcher conditioned by Qwen3-1.7B. It trains for one epoch at 256×256 with batch size 256, AdamW, and about 40 hours on eight H100 GPUs; streaming errors repeat a small number of samples. Evaluation uses 50 Euler steps. Guidance scales 1.75, 4.0, and 6.25 yield distances 204.01, 87.80, and 76.25; the highest tested scale also improves recall and coverage. This is a reproducible starting point rather than an optimized state-of-the-art model.
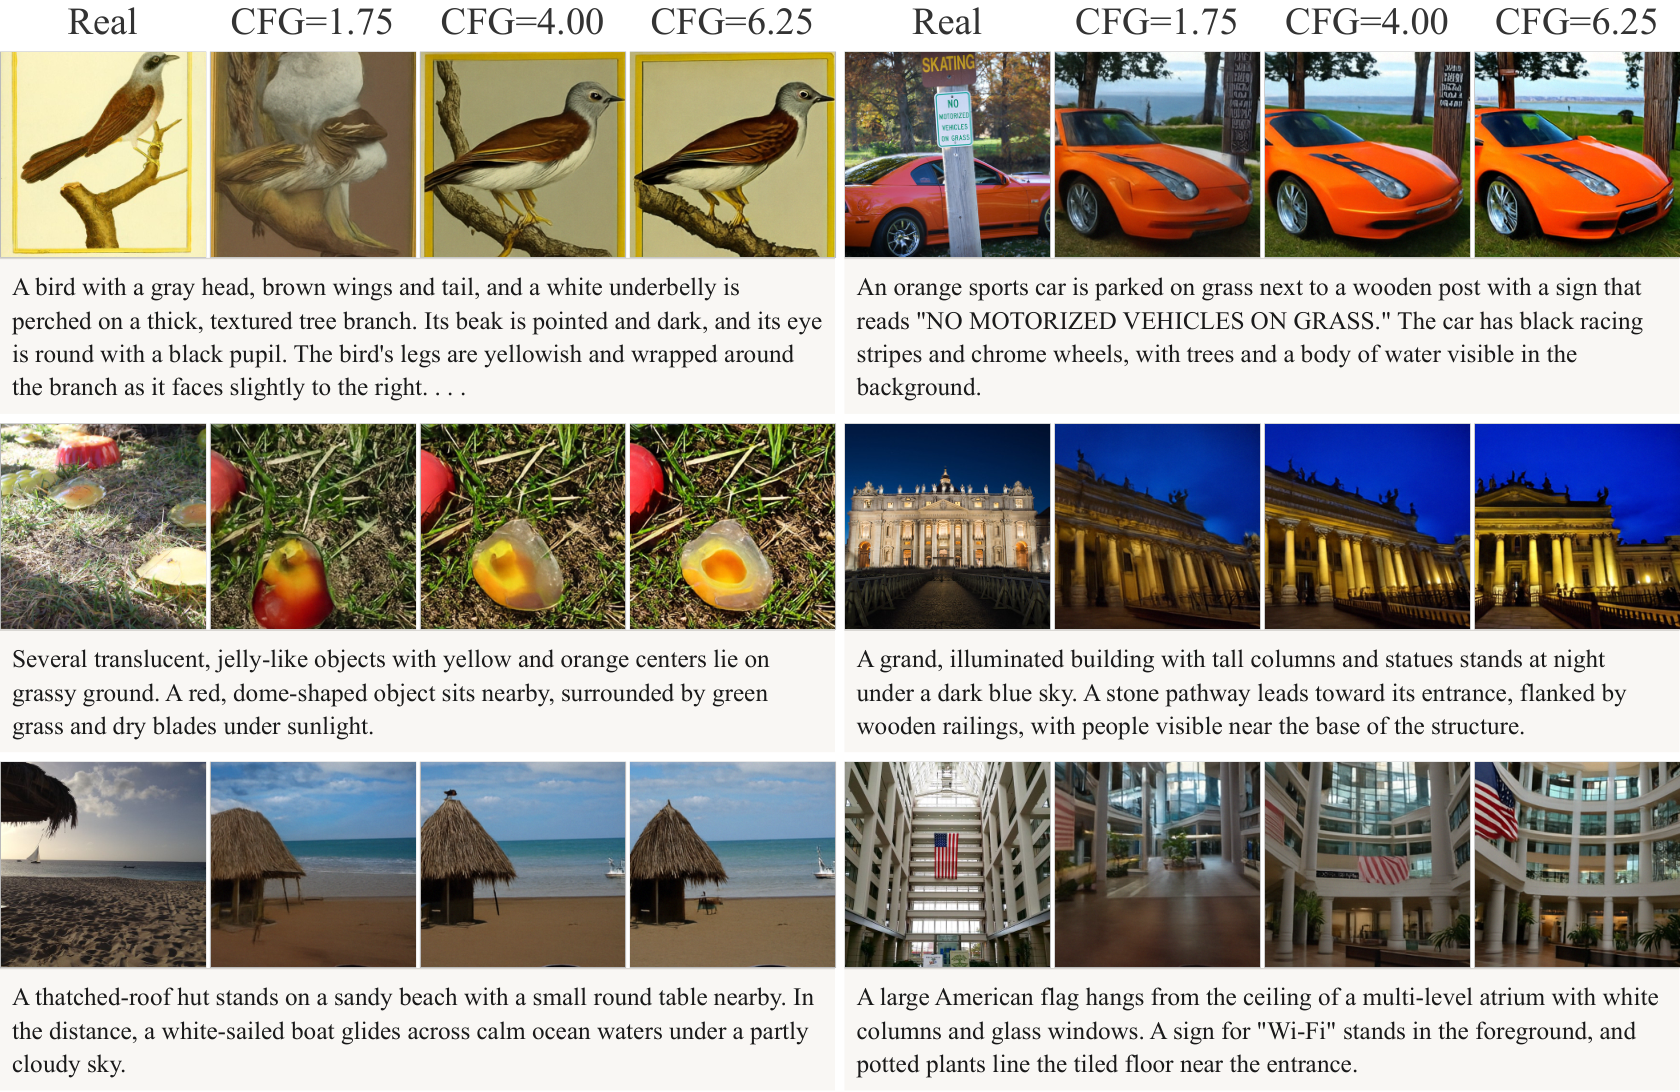
CFG FD Precision Recall Density Coverage 1.75 204.01 0.917 0.530 1.034 0.806 4.00 87.80 0.933 0.765 1.012 0.906 6.25 76.25 0.942 0.792 1.014 0.908
5 Conclusion
GPIC offers a large hosted corpus and explicit evaluation protocol for open visual-generation research. Remaining limitations include source-platform biases, possible harmful use, memorization, automated-caption errors, residual near-duplicates, and imperfect filtering. Source license metadata improves traceability but does not establish that all potential downstream concerns are resolved. The fixed release and synthetic captions address specific reproducibility and source-text issues, not every privacy or content risk.
Acknowledgments
The authors acknowledge compute support from Radical Numerics and World Labs, and feedback from collaborators and Stanford research groups.
Appendix
The appendices retain additional image–caption examples, evaluation details, filtering and deduplication galleries, caption-correction examples, and all five exact prompt figures.
Appendix B Evaluation
Supplementary evaluation specifies preprocessing, real-data reference metrics, and the effect of feature-extractor variants.
B.1 Construction of Imagenet-256 and GPIC-256
Reference images are center-cropped to a square and bicubically resized to 256×256 using Pillow. Interpolation implementations differ across libraries, so matching this detail matters for comparable feature statistics.
B.2 Additional Oracle Reference Metrics
Tables B.1 and B.2 retain Inception-based reference metrics and the mean/covariance contributions to Fréchet distance. The covariance term dominates these real-subset comparisons. Density can legitimately exceed one, so it should not be interpreted as a bounded percentage.
| GPIC Subset | FD | Precision | Recall | Density | Coverage |
|---|---|---|---|---|---|
| Full | 0.07 | 0.757 | 0.762 | 0.973 | 0.966 |
| Lite | 0.07 | 0.762 | 0.768 | 1.041 | 0.973 |
| Nano | 0.11 | 0.756 | 0.769 | 1.000 | 0.973 |
| Val | 0.21 | 0.760 | 0.758 | 1.007 | 0.971 |
| Test-50K | 0.68 | 0.7688 | 0.763 | 0.979 | 0.964 |
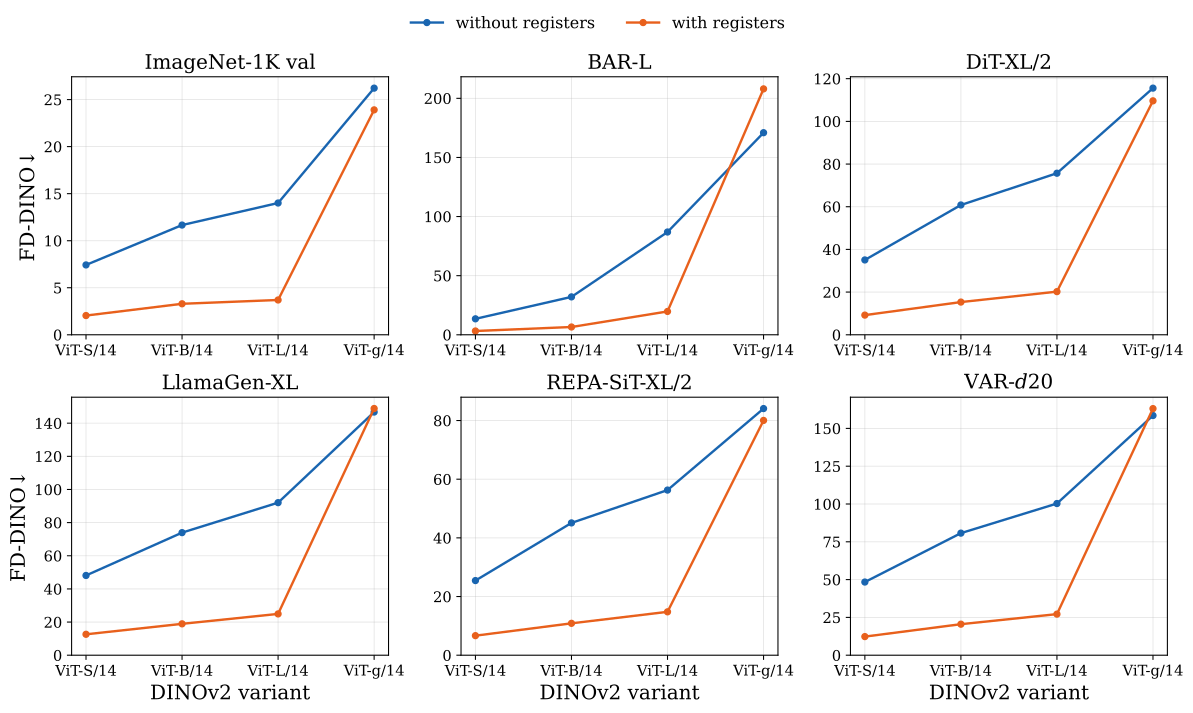
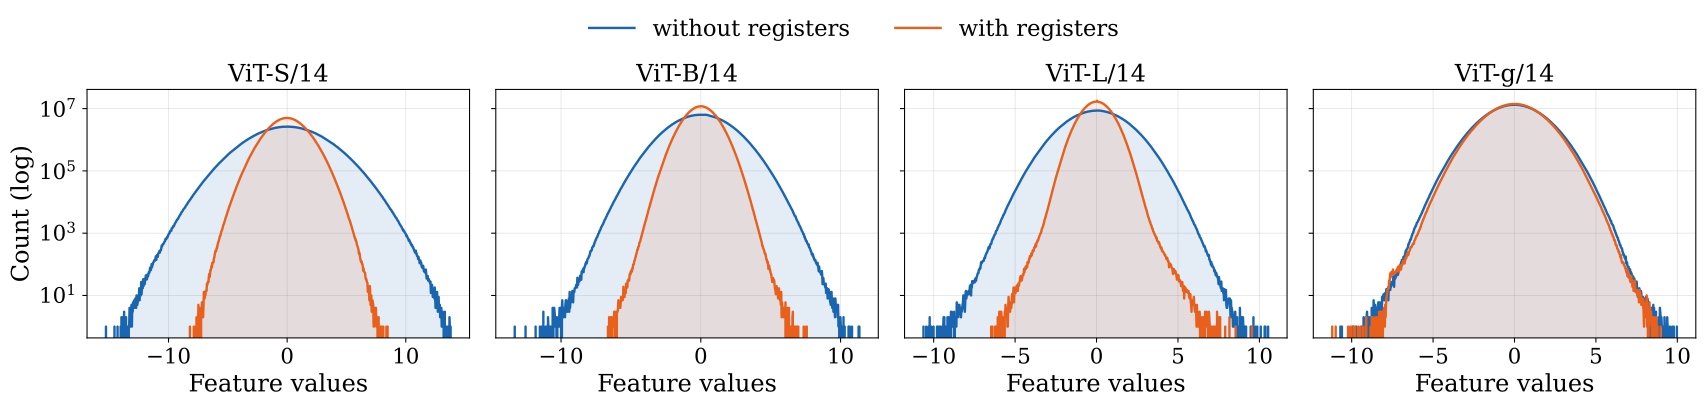
B.3 Effect of DINOv2 Backbone Size and Register Tokens on FD
DINOv2 backbone size and register tokens change feature magnitude and therefore the numeric distance scale. Registers lower distances for small, base, and large variants, while giant variants are closer. Across the tested configurations, reported mean Pearson correlation is 0.847 and Kendall concordance 0.795, supporting substantial but imperfect ranking agreement. The default remains non-register ViT-L/14; a dedicated human-alignment comparison is future work.
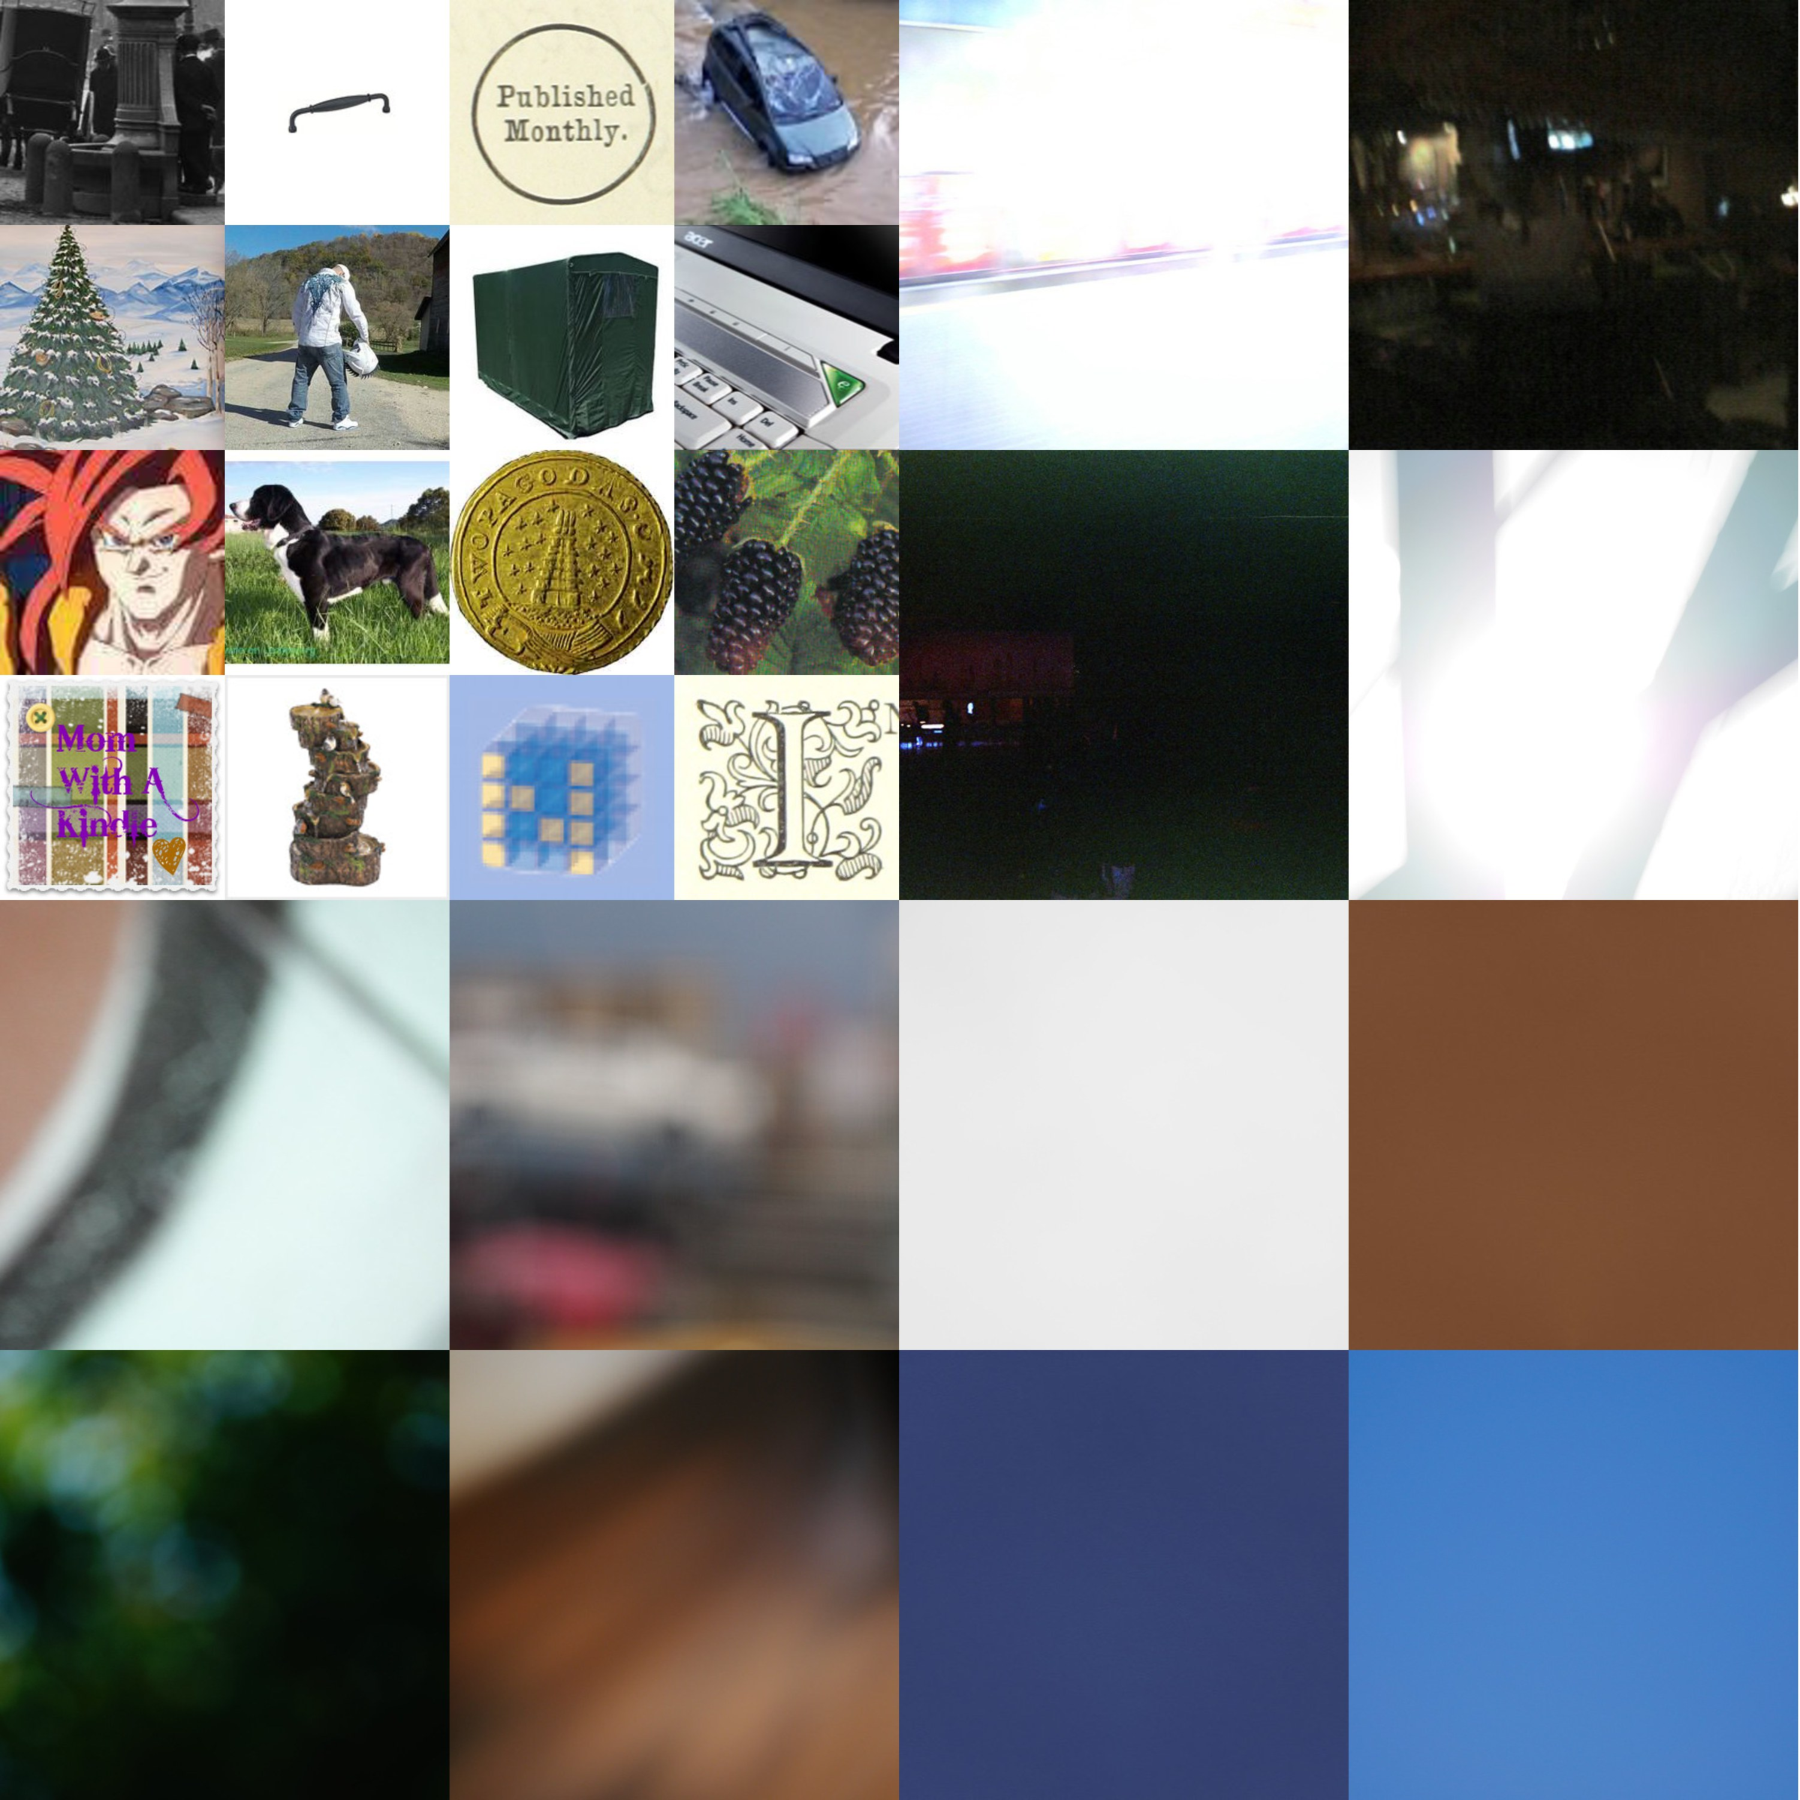
Appendix C Image Filtering
The additional gallery preserves examples removed for low resolution or poor visual quality. Examples illustrate the filter criteria rather than estimating its error rate.
Appendix D Deduplication
The deduplication gallery preserves image pairs and clusters across similarity tiers. The operational rule retains the highest-resolution representative of qualifying duplicates or large clusters; visually related but distinct images are intentionally kept in ambiguous cases.
Appendix E Microbenchmark
Humans correct initial captions for 1,520 sampled images, especially counting, spatial relations, and fine details. Those revised captions become references for the model judge. The comparison figure preserves original and corrected text, showing why caption-generator errors remain relevant even with a strong pretrained model.
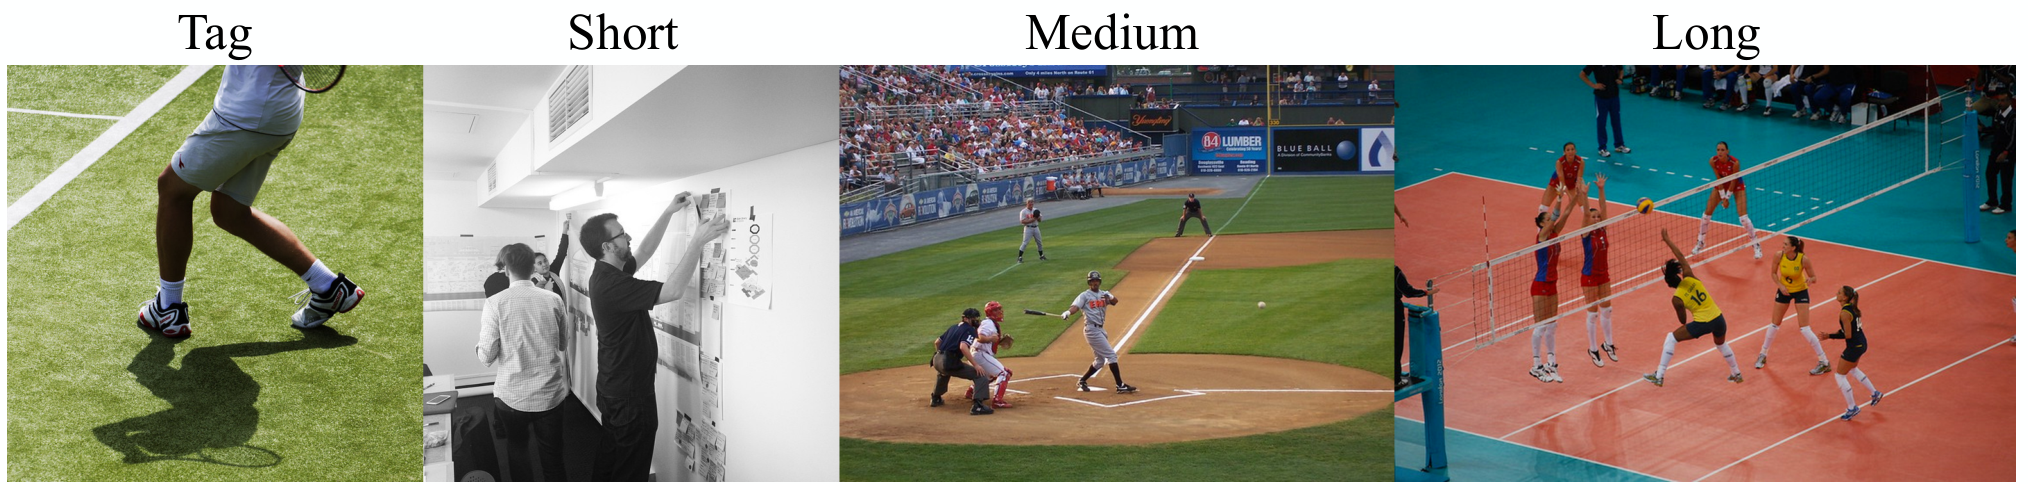
Tag:
Model: tennis court, athletic shoes, grass, shadow, player.
Human: tennis court, athletic shoes, grass, shadow, lower body.
Short:
Model: A group of people looks at papers on a wall in an office.
Human: A group of people pins papers and sticky notes to an office wall.
Medium:
Model: A baseball batter in a gray uniform stands at home plate after swinging, with the ball traveling across the field to the right. A catcher in red gear and an umpire crouch behind him, while another player stands near the first-base line and fans fill the stadium seats in the background.
Human: A baseball batter in a gray uniform stands at home plate after swinging, with the ball traveling across the field to the right. A catcher in red gear and an umpire crouch behind him, while another player stands near the third-base line and fans fill the stadium seats in the background.
Long:
Model: Five female volleyball players are positioned on a red and teal court, engaged in a match. Three players in red and blue uniforms are on the left side of the net, with two raising their arms to block a yellow volleyball that is mid-air near the net. One player in a yellow jersey with the number 16 is in a low crouch, facing the net, and another player in a yellow jersey is standing to the right, near the sideline with arms extended. A fifth player in a black and yellow uniform is positioned further right, standing with her feet apart and looking toward the ball. The net is stretched across the center of the court, and a blue vertical post with the words “Olympic Games” visible is on the right side of the net. In the background, spectators are seated on benches along the sidelines, and a blue umpire’s chair is visible on the far left. The court surface is marked with white lines, and the net has a white top band with vertical markings.
Human: Seven female volleyball players are positioned on a red and teal court, engaged in a match. Four players in red and blue uniforms are on the left side of the net, with two raising their arms to block a yellow volleyball that is mid-air near the net. One player in a yellow jersey with the number 16 is in a low crouch, facing the net, and another player in a yellow jersey is standing to the right. A fifth player in a black and yellow uniform is positioned further right, standing with her feet apart and looking toward the ball. The net is stretched across the center of the court, and a blue vertical post with “London 2012” visible is on the right side of the net. In the background, spectators are seated on benches along the sidelines, and a blue umpire’s chair is visible on the far left. The court surface is marked with white lines, and the net has a white top band with vertical markings.
Appendix F Prompts
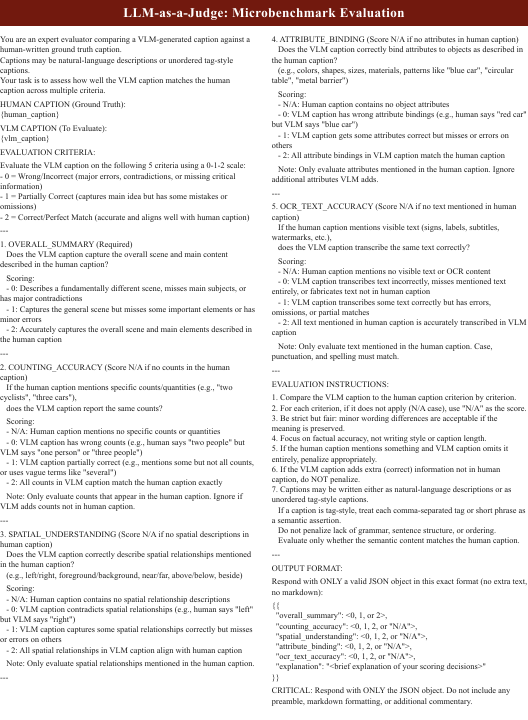
All exact caption and judge prompts are retained as original figures. Tags request three to eight short phrases; short captions target roughly 12–25 words; medium captions target two or three sentences and 25–60 words; long captions request five to seven sentences and more visible-text transcription. The judge scores five reference-based axes from zero to two, marking inapplicable axes separately. Several criteria explicitly ignore claims absent from the human reference, which limits their ability to detect extra unsupported details.