Overview
This edition covers the complete thirty-page arXiv v1, dated 23 May 2026, including all architecture, ablation, statistical and robustness appendices. All original figures, tables, equations and takeaway text are retained. Where broad claims conflict with reported p-values, the notes distinguish the two.
At a glance
This controlled study combines GR00T-N1.5 with VGGT using early fusion, late fusion or training-time spatial alignment. Depth/normal probes decode substantially more geometric information from fused features, but better probing does not automatically improve task success.
Ordinary task finetuning yields no significant aggregate manipulation gain in the reported comparisons. Early fusion improves real-robot approach and single-camera success; mid-training raises average success, although its printed aggregate p-values do not support the paper’s stronger significance wording.
1 Introduction
Geometric foundation models can reconstruct geometry from the same RGB images already used by VLAs, avoiding new depth-sensor collection. The paper asks what geometry is decodable, where geometric tokens should enter a policy, and when geometry changes manipulation outcomes.
The experiments hold a specific pair—GR00T-N1.5 and VGGT—fixed while varying fusion, data and cameras. Results concern these prototype implementations; they are not a ranking of every published geometric VLA.
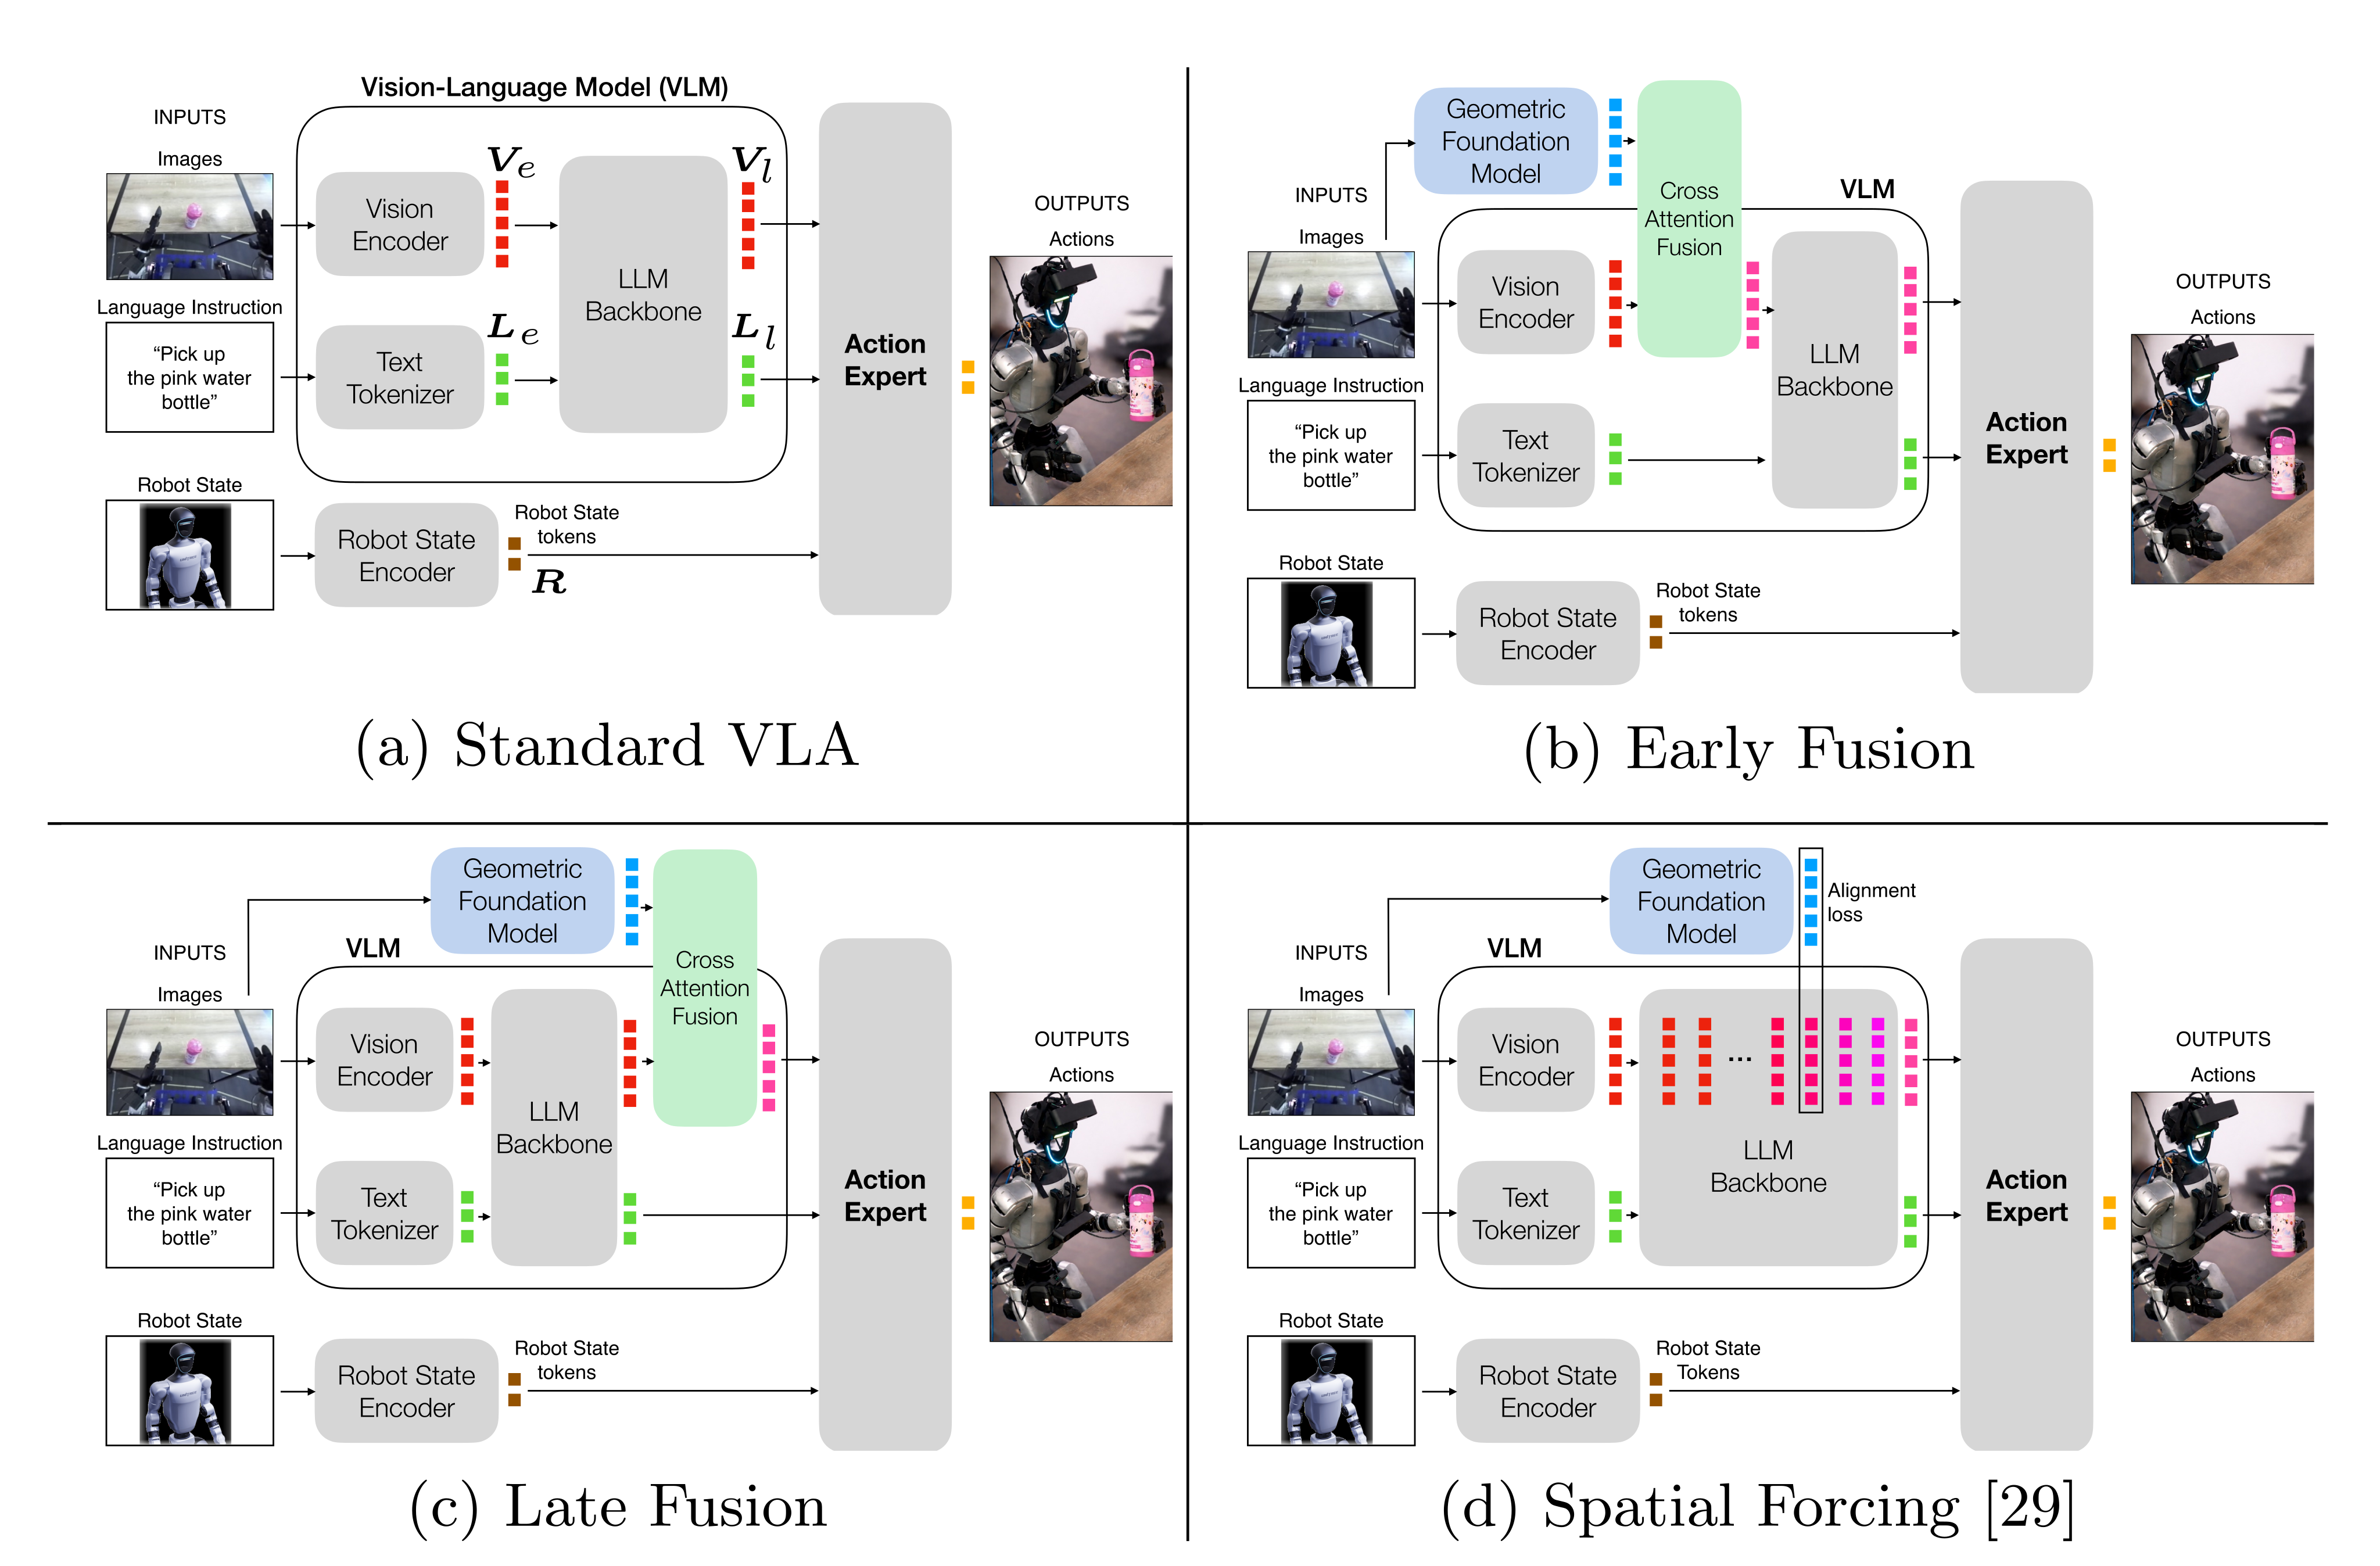
Selectable original diagram symbols
Original label notation: {\bm{V}}_{e}; {\bm{L}}_{e}; {\bm{V}}_{l}; {\bm{L}}_{l}; {\bm{R}}
2 Related Work
VLAs combine vision/language representations with an action expert. Earlier geometric policies use measured depth, point clouds or learned spatial features; feed-forward reconstruction models provide an RGB-only alternative.
Evo-0-style early fusion injects geometry before the language backbone, late fusion enriches its output, and Spatial Forcing aligns internal representations during training. Reimplementing all three on one backbone reduces some implementation confounds while leaving architectural and training differences.
3 Bridging VLAs and Geometric Foundation Models
A baseline encodes camera images, language and robot state, then predicts action chunks with a flow-matching action expert. The two fusion variants add geometric tokens while preserving the shape of the original visual-token stream.
3.1 VLA Architecture and Key Strategies to Inject Geometry
Early fusion combines visual-encoder tokens with VGGT features before the frozen LLM. Late fusion instead combines VGGT features with visual tokens after the LLM, immediately before the action expert. Both use the same gated cross-attention design.
Spatial Forcing adds a cosine-alignment loss to internal LLM tokens at training time, leaving the original inference architecture. The study adapts that method to GR00T rather than running its original OpenVLA/π₀ implementations.
Equations 1–2 retain the paper’s action/noise interpolation and flow objective. Training learns a denoising field conditioned on image, language and state tokens; inference integrates that field. All notation and original formulas remain exact.
Equations 1–2
| (1) |
| (2) |
3.2 Cross-Attention Fusion
Project VLA queries and VGGT keys/values into a shared width, compute scaled softmax cross-attention, then project back to the VLA feature width. Add the result as an elementwise-gated residual, preserving the original token count and dimensions.
Initialize the gate near zero to avoid abruptly shifting a pretrained policy’s inputs. Learned modality-specific positional embeddings retain image-patch layout; rank-eight LoRA parameterizes the projections. The appendix tests gate and positional alternatives.
Equations 3–6
| (3) |
| (4) |
| (5) |
| (6) |
4 Probing Geometric Understanding in VLAs
Train probes for ten epochs on 24,000 NYU Depth V2 image/depth pairs with 645 validation pairs, using SILog loss. Evaluate depth RMSE in meters and δ₁, the fraction within the stated 25% depth tolerance.
Vision-encoder/VLM/VGGT probes yield RMSE .92/.73/.41 and δ₁ .51/.63/.89. Early/late fusion yield .44/.45 and .88/.87 while keeping the pretrained backbone frozen. Fusion modules are trained together with their probes, so those rows do not test unchanged pretrained fused features.
The paper calls these linear probes but describes MLPs; the vision probe has hidden width 1024 while VLM/VGGT probes use 2048. This capacity difference limits layer-to-layer interpretation. Better decodability under these probes is evidence of accessible geometry, not proof that a baseline contains no geometry or that the policy uses it causally.
Original paper takeaway
Key Takeaway. GR00T-N1.5 is not able to retain depth information, which is already lost before the output of the VLM. Late fusion, as expected, can inject depth understanding. Surprisingly, even Early Fusion can inject depth understanding, without requiring finetuning of GR00T’s VLM.
| RMSE [m] () | () | |
|---|---|---|
| GR00T - vision encoder probe | 0.92 | 0.51 |
| GR00T - VLM probe | 0.73 | 0.63 |
| VGGT probe | 0.41 | 0.89 |
| Early Fusion probe | 0.44 | 0.88 |
| Late Fusion probe | 0.45 | 0.87 |
5 Impact of Key Design Choices
Manipulation experiments vary fusion, multi-task mid-training, camera count and reconstruction quality. Pairing the same trial conditions supports within-study comparisons; reported tables and uncertainty must be read together.
5.1 Experimental Protocol
RoboCasa evaluation uses eight pick-and-place tasks, five kitchen/object episodes each and fifteen appearance-randomized trials per episode: 75 trials per task, 600 total, with left/right/wrist cameras. Task finetuning uses about 300 demonstrations per task.
LIBERO uses primary/wrist cameras. The main protocol states 500 trials per task; the appendix omits LIBERO-GOAL because of a cited GR00T issue. Unitree G1 evaluation uses ninety matched single-object placements across bottle, ball and box classes, with varied instances, grid positions and orientations.
Compare the best success rate among fifteen listed checkpoints from epoch 1 through 100. Seed 42 and action-expert noise are fixed for repeatability. Two-sided McNemar tests compare paired outcomes, including pooled task outcomes for aggregate p-values.
Baseline finetuning updates the action expert; fusion variants update the fusion module and action expert with other components frozen. Spatial Forcing aligns LLM layer 9 of 13 and finetunes the vision-to-LLM projection. Experiments use an A100 cluster with 320 GB total GPU memory; finetuning takes two to three days.
5.2 Impact of Fusion Strategy
On RoboCasa, baseline/early/late/spatial-forcing averages are 71.7/69.7/71.0/68.3%, with aggregate p=.399/.806/.154 against baseline. Individual tasks can improve or worsen, but these tests do not establish an overall gain. The first seven Table 2 baseline rows come from other papers and are not the matched reruns.
For G1, overall success is 22.22/27.78/25.56% for baseline/early/late, with p=.511/.710 for the two gains. Early fusion improves approach from 57.78 to 84.44% with the entry printed as p¡0.001; later stages do not show comparable significance.
The stage values behave as conditional progression rates: their products match overall success, rather than independent percentages of all ninety trials. Early fusion’s placement rate falls from 86.96 to 65.85%, so better approach does not assure completed manipulation. The proposed explanation about LLM flexibility versus action-expert rigidity remains a hypothesis.
Original paper takeaway
Key Takeaway. Task-level finetuning of geometric VLAs combining GR00T-N1.5 and VGGT does not lead to a statistically significant increase in the success rate. The Early Fusion geometric VLA appears to be more promising in real world experiments.
| CabToCtr | CtrToCab | CtrToMicrowave | CtrToSink | CtrToStove | MicrowaveToCtr | SinkToCtr | StoveToCtr | Average | |
| DP3[50] | 4.0 | 2.0 | 6.0 | 0.0 | 0.0 | 6.0 | 0.0 | 0.0 | 2.3 |
| Pi0[6] | 28.0 | 18.0 | 36.0 | 70.0 | 36.0 | 22.0 | 16.0 | 44.0 | 33.8 |
| Pi0-Fast[36] | 30.0 | 48.0 | 20.0 | 56.0 | 64.0 | 46.0 | 62.0 | 60.0 | 48.3 |
| RS-CL[26] | 60.0 | 68.0 | 40.0 | 68.0 | 72.0 | 48.0 | 68.0 | 54.0 | 59.0 |
| DP-VLA[18] | 10.0 | 32.0 | 56.0 | 30.0 | 22.0 | 18.0 | 56.0 | 62.0 | 35.8 |
| GR00T N1 [4] | 20.0 | 36.0 | 13.0 | 10.0 | 24.0 | 16.0 | 33.0 | 29.0 | 22.6 |
| Video Policy[22] | 48.0 | 52.0 | 22.0 | 48.0 | 54.0 | 28.0 | 56.0 | 70.0 | 47.3 |
| GR00T-N1.5 | 42.7 | 74.7 | 73.3 | 93.3 | 77.3 | 58.7 | 65.3 | 88.0 | 71.7 |
| Early Fusion | 32.0 (p=0.186) | 69.3 (p=0.289) | 65.3 (p=0.377) | 88.0 (p=0.388) | 73.3 (p=0.664) | 62.7 (p=0.742) | 80.0 (p=0.019) | 86.7 (p=1.000) | 69.7 (p=0.399) |
| Late Fusion | 46.7 (p=0.710) | 72.0 (p=0.625) | 74.7 (p=1.000) | 85.3 (p=0.146) | 69.3 (p=0.307) | 69.3 (p=0.115) | 69.3 (p=0.689) | 81.3 (p=0.267) | 71.0 (p=0.806) |
| Spatial Forcing | 29.3 (p=0.123) | 68.0 (p=0.227) | 66.7 (p=0.499) | 76.0 (p¡0.001) | 72.0 (p=0.454) | 60.0 (p=1.000) | 84 (p=0.007) | 90.7 (p=0.804) | 68.3 (p=0.154) |
| Early Fusion (mid-trained) | 52.0 (p=0.281) | 72.0 (p=0.727) | 69.3 (p=0.700) | 94.7 (p=1.000) | 80.0 (p=0.815) | 68.0 (p=0.189) | 81.3 (p=0.023) | 84.0 (p=0.607) | 75.2 (p=0.104) |
| Approach | Grasp | Lift | Placement | Overall | |
|---|---|---|---|---|---|
| GR00T-N1.5 | 57.78 | 51.92 | 85.19 | 86.96 | 22.22 |
| Early Fusion | 84.44 (p¡0.001) | 60.53 (p=0.824) | 89.13 (p=1.000) | 65.85 (p=0.180) | 27.78 (p=0.511) |
| Late Fusion | 57.78 (p=0.855) | 59.62 (p=1.000) | 93.55 (p=1.000) | 79.31 (p=0.625) | 25.56 (p=0.710) |
5.3 Impact of Training Data Scaling
Mid-train early fusion on all eight RoboCasa tasks, then finetune per task. Its average rises to 75.2%, versus 71.7% for the original baseline; the reported aggregate p is .104.
The original takeaway calls this statistically significant, but .104 exceeds the .05–.1 range discussed in the paper. The matched-mid-training comparison also has a higher average but p=.168. These results suggest a useful direction without establishing the claimed overall significance; selected individual tasks do have smaller p-values.
Original paper takeaway
Key Takeaway. Early Fusion’s performance largely improves and becomes better than baseline (in a statistically significant manner) after training it on a larger amount of data before finetuning on the specific task.
5.4 Impact of the Number of Cameras
With only the left camera and no mid-training, early fusion reaches 21.5% versus baseline 17.2%, a 4.3-point gain with aggregate p=.030. Both are far below their three-camera results, showing that geometric priors do not replace the missing views.
This is the clearest reported aggregate gain for early fusion. Task-level changes remain mixed, including worse CounterToSink performance. The experiment supports this sensor-constrained configuration, not general camera independence.
Original paper takeaway
Key Takeaway. Even without mid-training, Early Fusion’s performance becomes statistically better than baseline when using a single-camera setup.
| Method | CabToCtr | CtrToCab | CtrToMicrowave | CtrToSink | CtrToStove | MicrowaveToCtr | SinkToCtr | StoveToCtr | Average |
|---|---|---|---|---|---|---|---|---|---|
| GR00T-N1.5 | 12.0 | 8.0 | 33.3 | 28.0 | 13.3 | 12.0 | 26.7 | 4.0 | 17.2 |
| Early Fusion | 10.7 (p=1.000) | 9.3 (p=1.000) | 38.7 (p=0.503) | 17.3 (p=0.115) | 29.3 (p=0.008) | 18.7 (p=0.302) | 34.7 (p=0.307) | 13.3 (p=0.039) | 21.5 (p=0.030) |
5.5 Impact of VGGT Performance
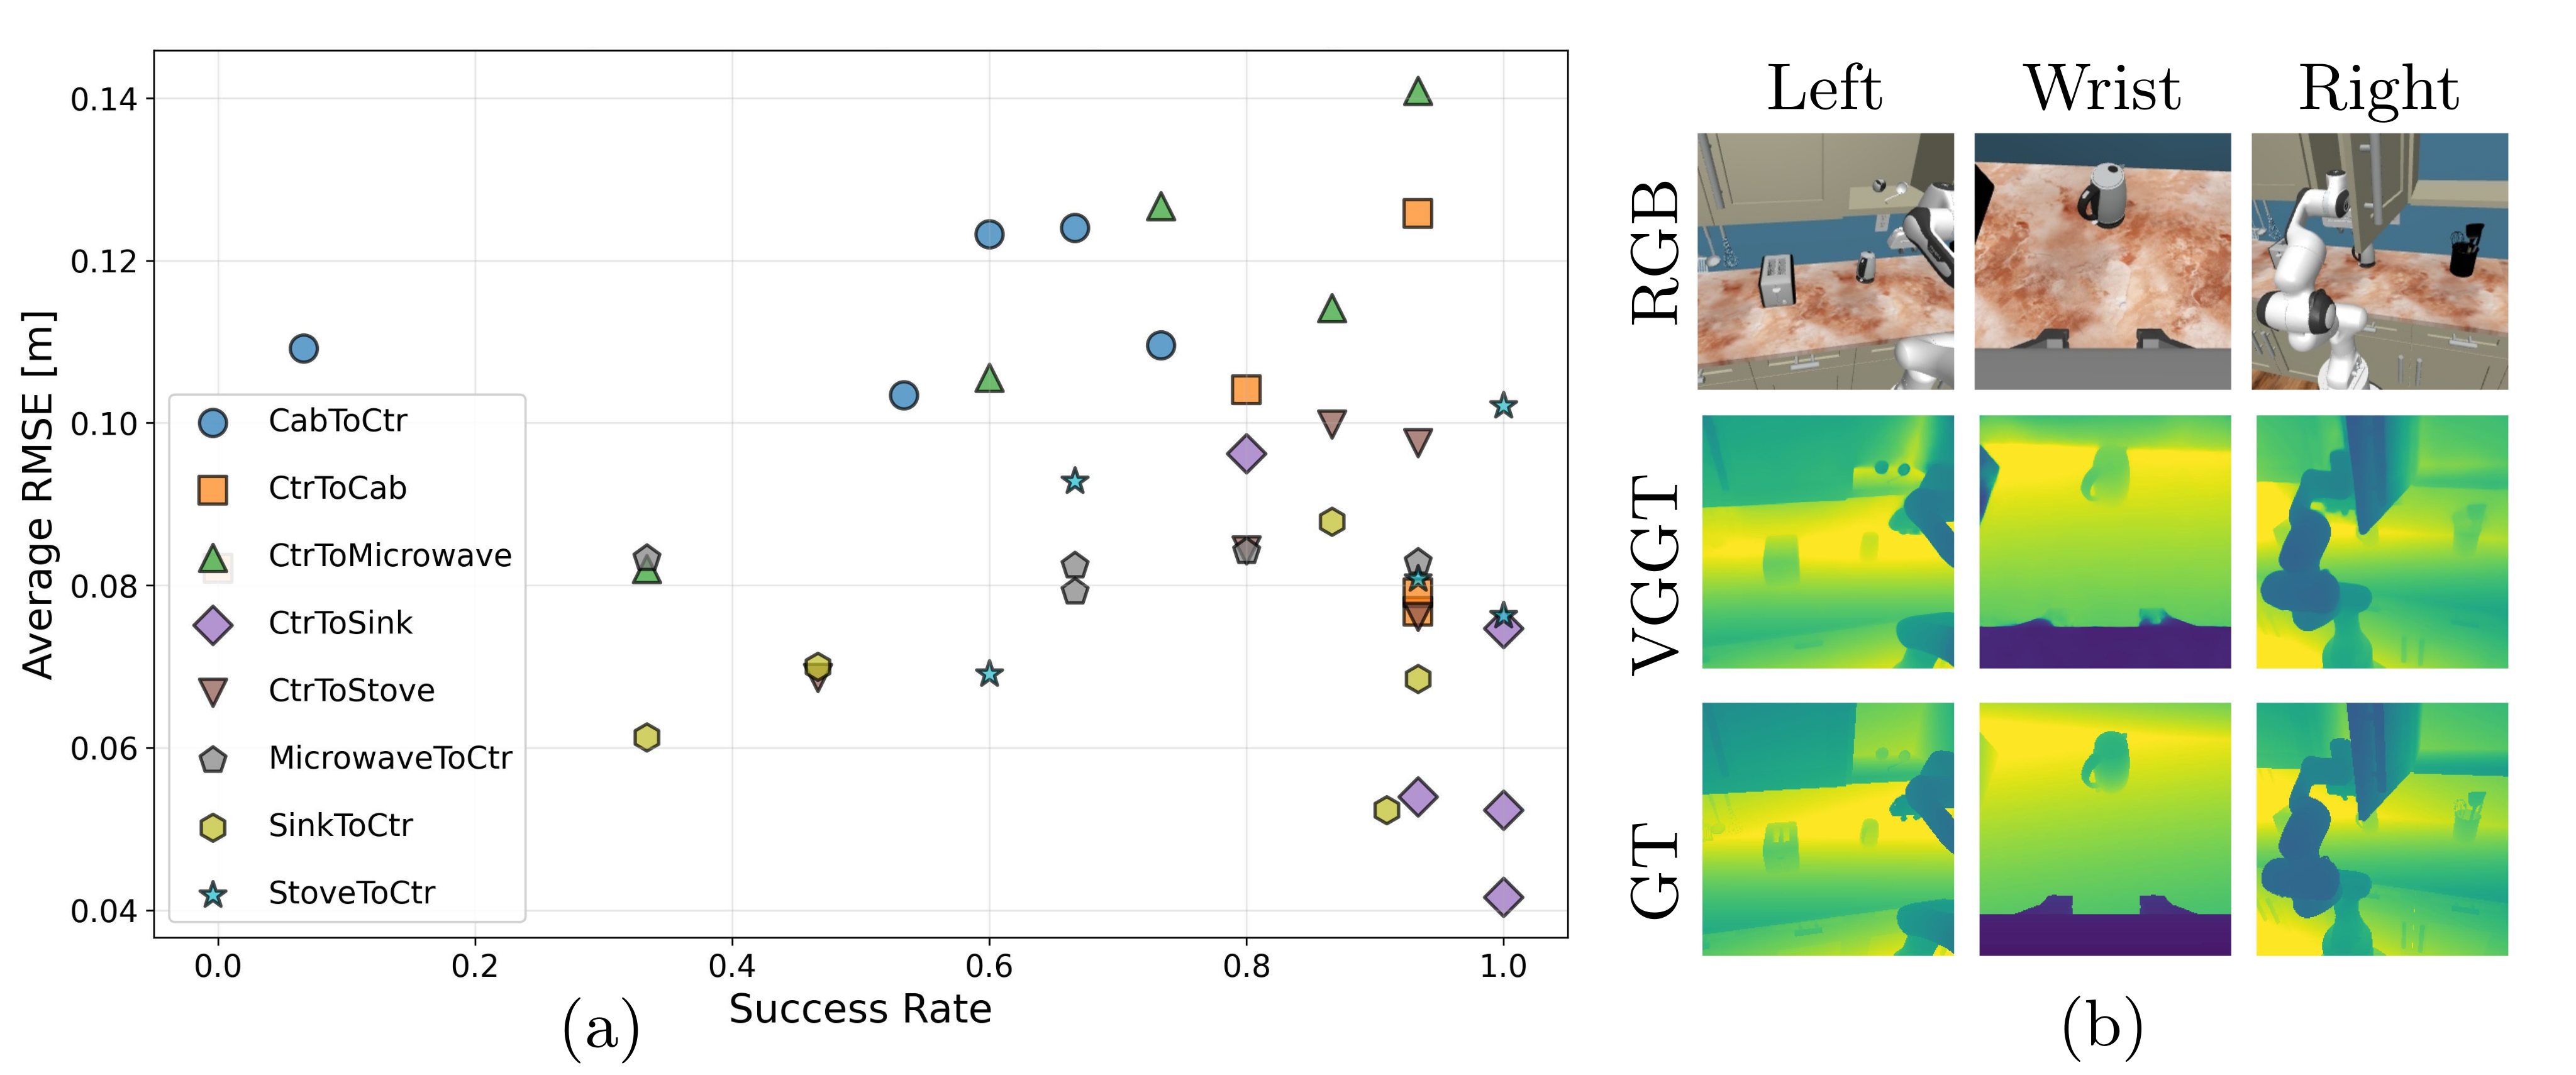
Across forty task/episode combinations, compare success with VGGT depth RMSE averaged over images and cameras. Spearman ρ=−.202 indicates a mild negative association; task difficulty and other factors also affect success.
Figure 3 preserves both the scatter and the three-camera qualitative depth grid. No uncertainty or significance test for the correlation is reported. Fine-tuning VGGT to improve control is proposed, not evaluated, and the association does not establish causality.
Original paper takeaway
Key Takeaway. While the Early Fusion model’s success rate is largely task dependent, the success rate is also correlated with VGGT’s performance (i.e., smaller depth errors in VGGT correlate with highest success rates).
6 Limitations
Conclusions are restricted to GR00T-N1.5 with VGGT and the selected fusion implementations. Most evidence is simulated, some suites approach saturation, and the real evaluation covers simple single-object pick-and-place.
The study does not exhaust alignment-layer choice, alternative fusion designs, inference cost or large-scale pretraining. Best-checkpoint selection and many task/design comparisons are reported without an independent selection protocol or multiple-comparison correction; fixed evaluation noise does not establish robustness over training seeds.
7 Conclusions
Geometry can become more decodable through early or late fusion even with a frozen language backbone. Manipulation gains depend on data and sensing, and the strongest supported results are narrower than a universal benefit of geometric augmentation.
The paper’s practical contribution is a shared comparison framework with paired evaluation and explicit stochasticity analysis. Preserve the separation between feature-probe performance, individual-stage success and statistically supported full-task gains.
Appendix 0.A Appendix: Details about Architectures
Fuse only GR00T visual tokens and VGGT image tokens, discarding VGGT register tokens. Their patch counts and preprocessing differ, so cross-attention does not require one-to-one token correspondence. Add separate learned 2D/3D positional embeddings.
All four projections use LoRA rank eight. A near-zero elementwise gate controls residual injection; an input-dependent sigmoid-style gate is also tested without consistent benefit. Equations 7–9 preserve the exact update and gate definitions.
Use Adam, learning rate 10⁻⁴ and batch twelve; LLM-finetuned Spatial Forcing uses batch six for memory. Ordinary finetuning runs 100 epochs. Mid-training runs ten epochs across tasks followed by fifty task-specific epochs, taking about one week. Layer nine is chosen by analogy to roughly 70% backbone depth, not a layer sweep.
Equations 7–9
| (7) |
| (8) |
| (9) |
Appendix 0.B Appendix: Ablations
The ablations test gradual geometric injection, checkpoint sensitivity and the effect of unfreezing the language backbone. All curves and per-task outcomes are retained.
0.B.1 Ablation of Early Fusion Architecture
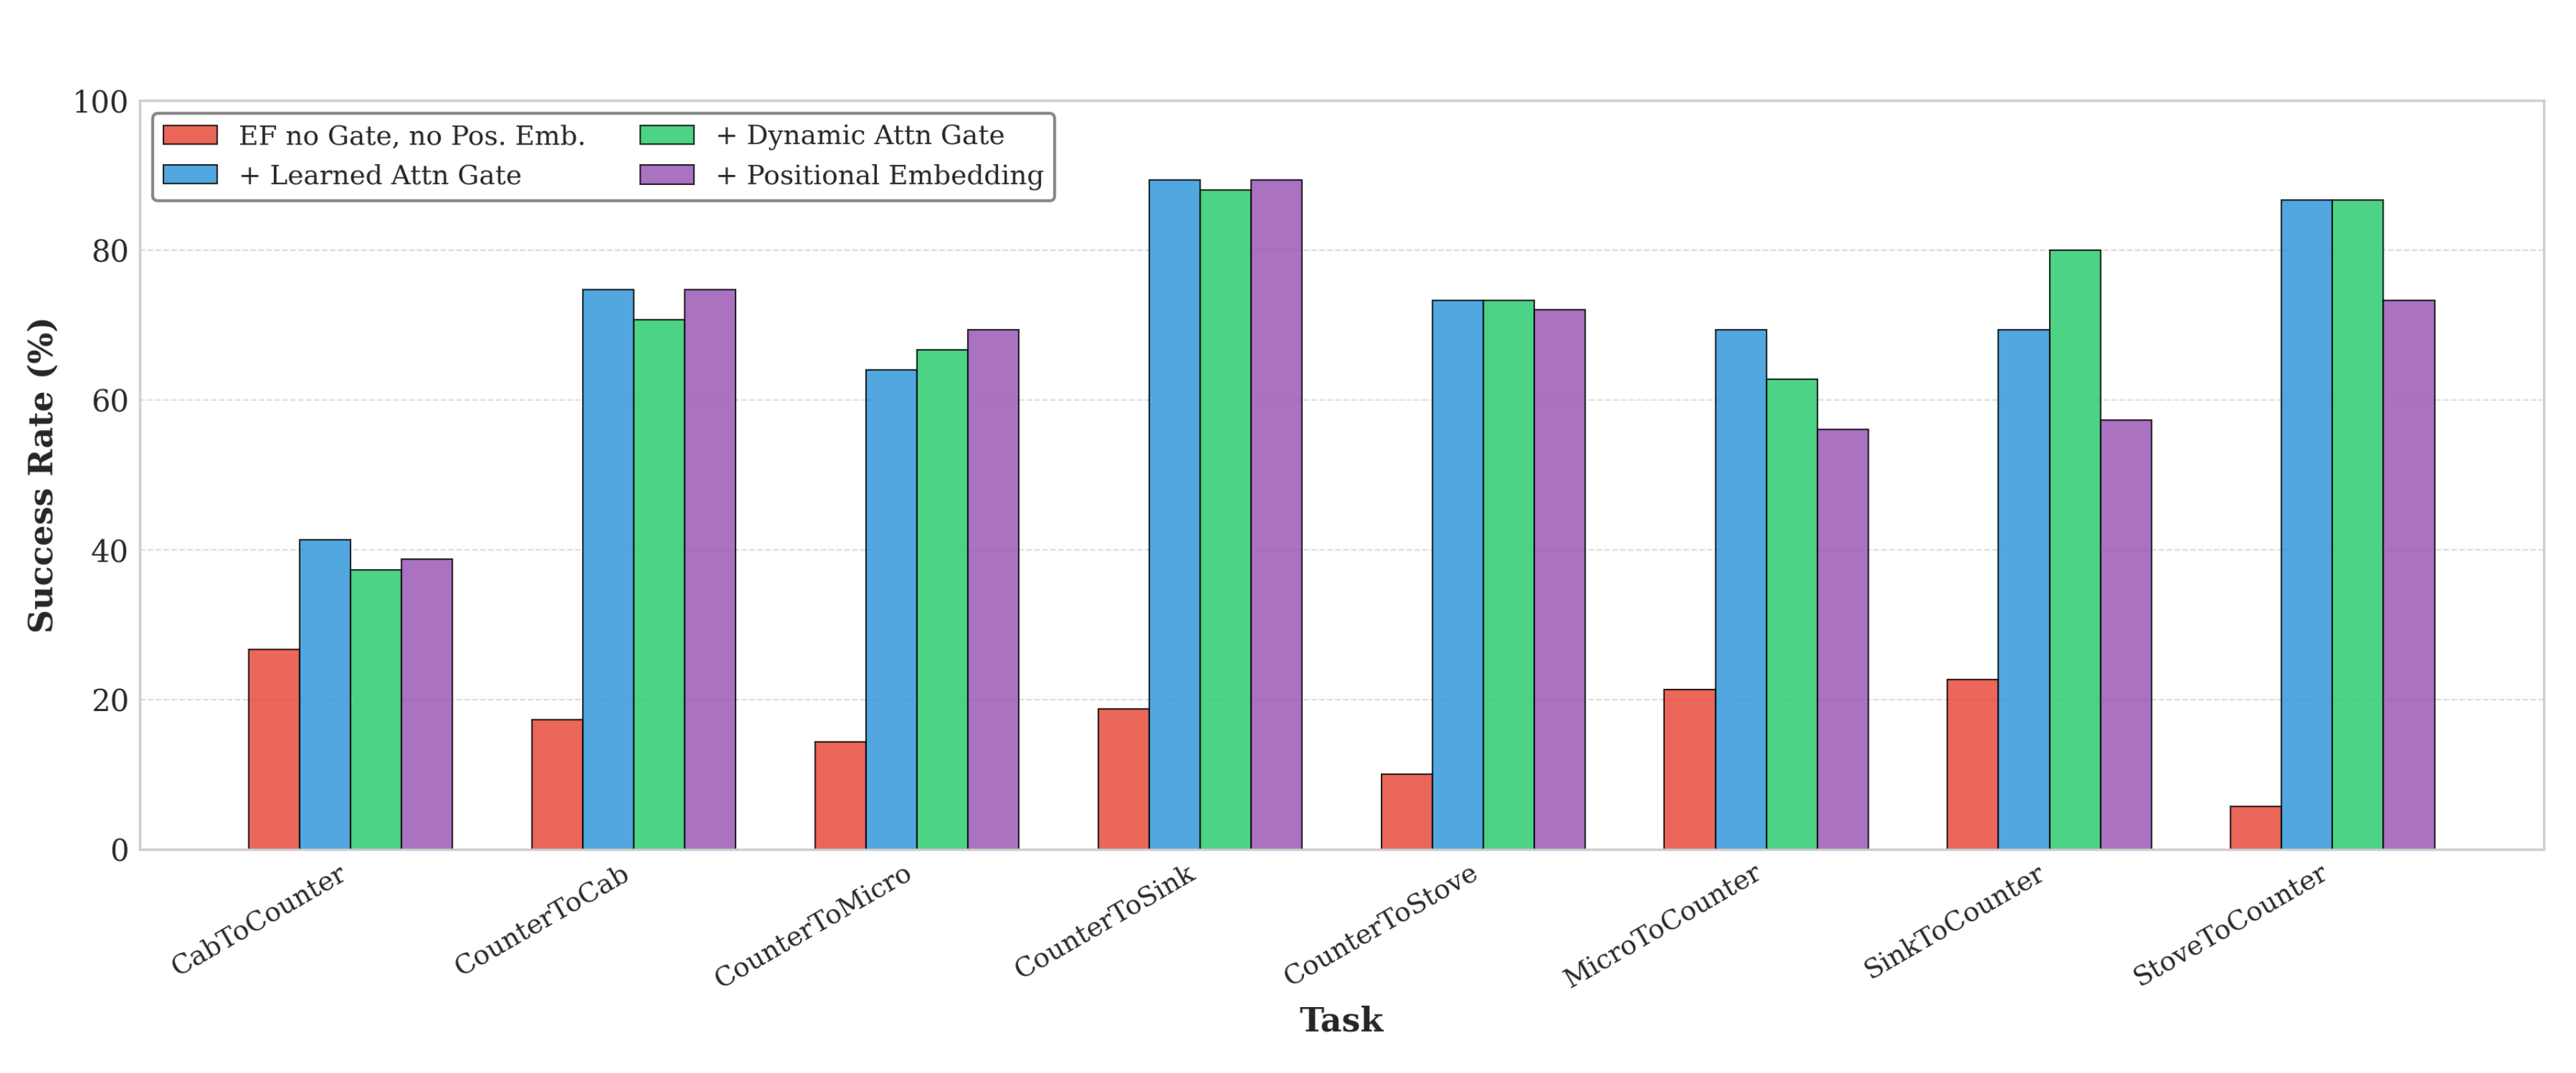
Without gating or positional embeddings, early fusion reaches only about 5–27% across tasks. Adding a learned gate substantially improves most tasks, to roughly 64–89%, supporting gradual adaptation of the pretrained policy.
Dynamic gating does not consistently help. Positional embeddings improve some tasks and worsen others; their benefit is not uniform. Figure A.1 contains every variant and task.
0.B.2 Best Checkpoint Analysis for Early Fusion Approach
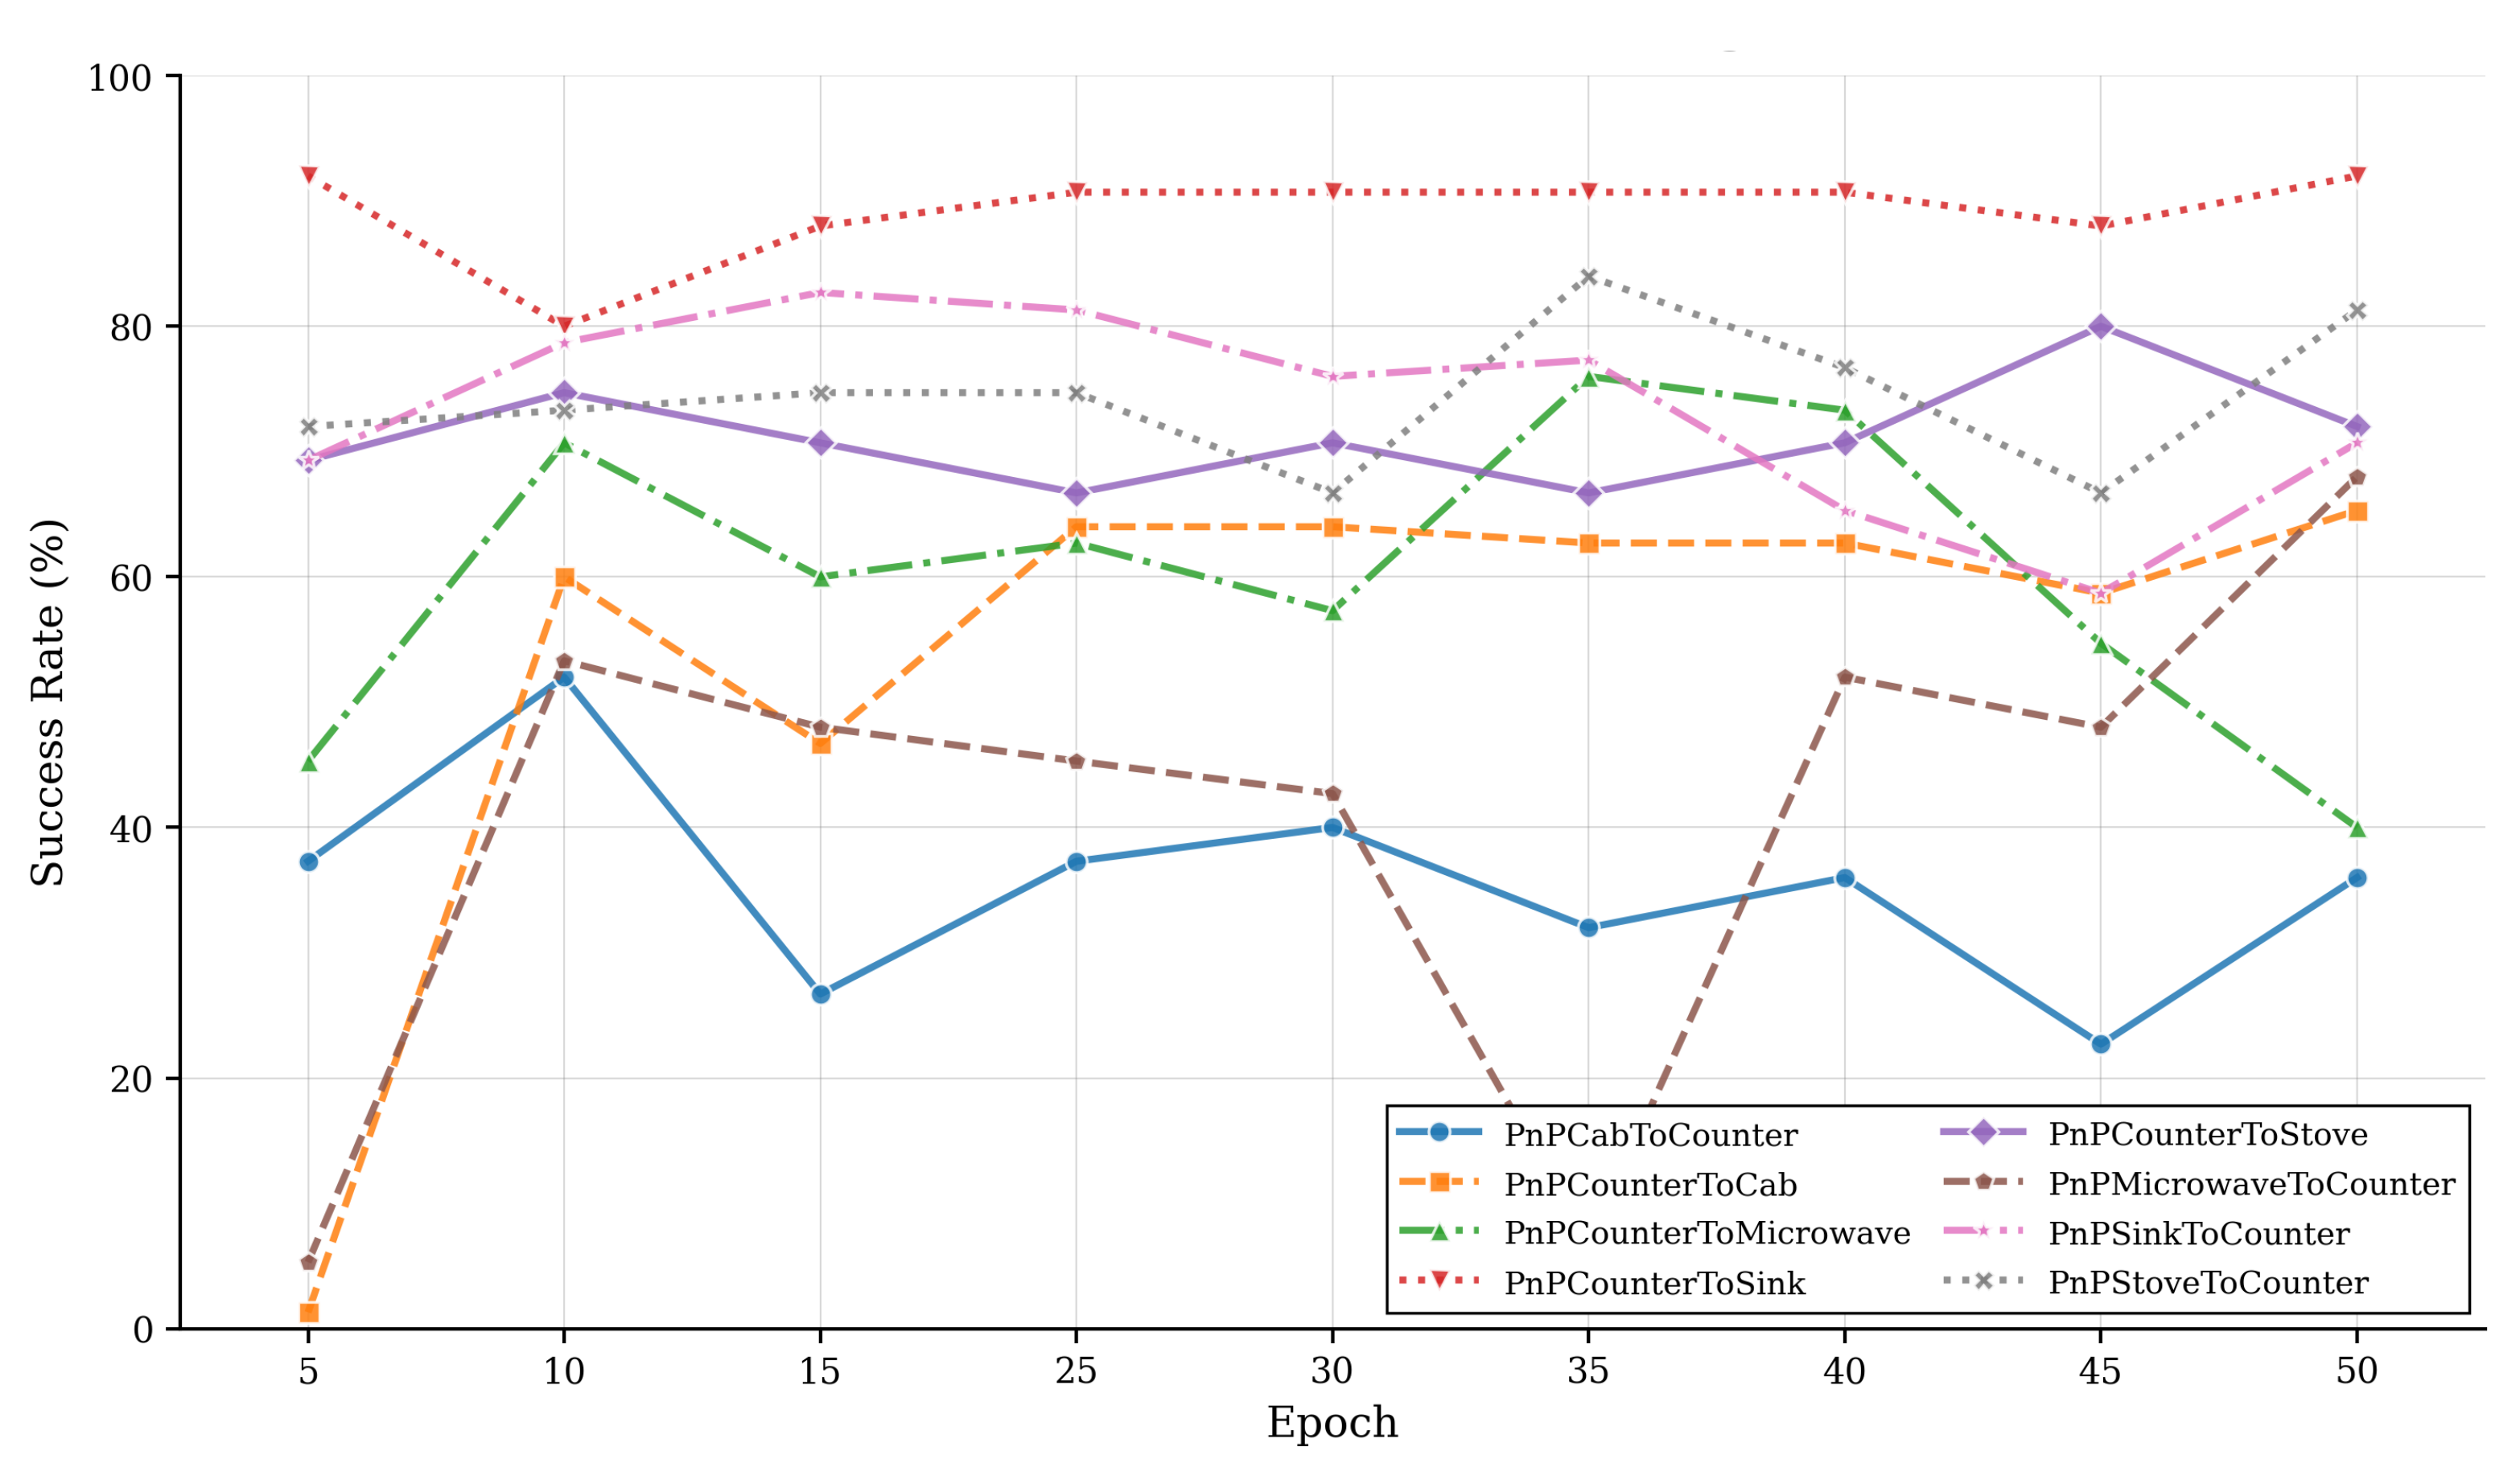
Checkpoint curves differ sharply by task: CounterToSink reaches 92% at epoch five, while CounterToCab peaks at 65.3% around epoch fifty. CounterToMicrowave reaches 76% at epoch thirty-five then falls to 40% at fifty.
The authors interpret degradation as interference/possible forgetting, but these curves alone do not isolate its cause. Epoch thirty-five also lies outside the main text’s checkpoint list, a reporting inconsistency. Best-checkpoint results should not be read as monotonic learning or final-checkpoint performance.
0.B.3 Spatial Forcing: Finetuning LLM
With the same layer-nine alignment, additionally finetuning the LLM reduces average success from 68.3 to 31.2%, with the overall entry printed as p¡0.001. The larger trainable model may overfit, but overfitting is an interpretation rather than a separately measured mechanism.
The no-LLM-finetuning variant is numerically better on every task. Its CabToCounter difference has p=.123, however, so the prose claim of significance across the board is too strong. The smaller batch for the LLM-finetuned version is another experimental difference.
| Method | CabToCtr | CtrToCab | CtrToMicrowave | CtrToSink | CtrToStove | MicrowaveToCtr | SinkToCtr | StoveToCtr | Average |
|---|---|---|---|---|---|---|---|---|---|
| Spatial Forcing (no LLM ft.) | 29.3 | 68.0 | 66.7 | 76.0 | 72.0 | 60.0 | 84.0 | 90.7 | 68.3 |
| Spatial Forcing (LLM ft.) | 16.0 (p=0.123) | 24.0 (p¡0.001) | 26.7 (p¡0.001) | 13.3 (p¡0.001) | 38.7 (p¡0.001) | 22.7 (p¡0.001) | 53.3 (p¡0.001) | 54.7 (p¡0.001) | 31.2 (p¡0.001) |
Appendix 0.C Appendix: McNemar’s Statistical Test
McNemar’s test compares paired binary success/failure outcomes. The contingency table records joint successes/failures and the two discordant counts b and c. Use an exact two-sided binomial expression when b+c<25 and a continuity-corrected χ² approximation otherwise; return p=1 when no pairs disagree.
For an overall comparison, pool trial-level outcomes across tasks and recompute the test, rather than average task p-values. RoboCasa uses 75 paired trials per task and 600 pooled trials.
Equations 10–13 are preserved exactly. The printed doubled-binomial-tail expression does not explicitly cap p at one; implementation details are not supplied here. These tests quantify the reported paired trials, without automatically accounting for checkpoint selection, many comparisons or shared episode structure.
Several original tables print p¡0.001. The prose treats these as very small p-values, apparently intending a less-than sign; the original table glyph is preserved rather than silently corrected.
Equations 10–13
| (10) |
| (11) |
| (12) |
| (13) |
Appendix 0.D Appendix: Taming the Randomness
Fix the scene but vary diffusion-policy noise on CabToCounter. Evaluate epoch-twenty/eighty checkpoints with 10, 20, 30, 40, 50 or 100 trials per episode, repeating each experiment ten times.
At ten trials, success-rate standard deviation is 2.2 points for epoch twenty and 4.8 for epoch eighty; the latter ranges 12–28%. At 100 trials, standard deviations remain .8 and 1.0 points. The weaker late checkpoint stays near 20–22% mean success versus roughly 38–39% earlier.
More trials reduce observed variability but do not remove dependence on policy randomness. The main comparisons therefore fix scene/noise seeds and use paired tests. They still do not measure variation across independently trained seeds, and the appendix does not imply that repeated sampling can never estimate an expected rate accurately.
| Epoch 20 | Epoch 80 | |||||||||||
|---|---|---|---|---|---|---|---|---|---|---|---|---|
| Trials per episode | 10 | 20 | 30 | 40 | 50 | 100 | 10 | 20 | 30 | 40 | 50 | 100 |
| Mean | 38.2 | 38.5 | 39.1 | 38.6 | 39.0 | 38.4 | 20.6 | 20.8 | 21.7 | 19.9 | 20.0 | 21.2 |
| Std. Dev. | 2.2 | 1.2 | 1.0 | 1.1 | 0.8 | 0.8 | 4.8 | 2.6 | 2.1 | 1.9 | 1.7 | 1.0 |
| Min | 34 | 36 | 37.3 | 36.5 | 37.6 | 37 | 12 | 15 | 19.3 | 16 | 17.2 | 19.6 |
| Max | 42 | 40 | 40 | 40 | 40 | 39.6 | 28 | 25 | 25.3 | 22 | 23.2 | 22.6 |
Appendix 0.E Appendix: Additional Experiments
Additional results cover LIBERO, matched mid-training, attention visualization, normal probes and target-object appearance variation. All original values, p-values and color-coded winners are retained.
0.E.1 LIBERO Results
LIBERO averages are 87.9% baseline, 86.6% early fusion, 90.9% late fusion and 91.5% Spatial Forcing, with aggregate p=.138/.561/.295. None establishes a significant overall difference under the reported tests; this is not evidence of exact equivalence.
LIBERO-GOAL is excluded because of the cited software issue. The table labels the ten-task long-horizon subset LIBERO-10 and separately reports LIBERO-90.
| Spatial | Object | LIBERO-10 | LIBERO-90 | Average | |
|---|---|---|---|---|---|
| GR00T-N1.5 | 96.7 | 95.3 | 78.0 | 81.8 | 87.9 |
| Early Fusion | 94.0 (p=0.289) | 94.0 (p=0.804) | 76.0 (p=0.755) | 82.2 (p=0.307) | 86.6 (p=0.138) |
| Late Fusion | 93.3 (p=0.227) | 96.0 (p=1.000) | 83.3 (p=0.230) | 91.1 (p=0.804) | 90.9 (p=0.561) |
| Spatial Forcing | 95.3 (p=0.727) | 96.0 (p=1.000) | 84.7 (p=0.144) | 90.0 (p=1.000) | 91.5 (p=0.295) |
0.E.2 Impact of Training Data Scaling: Mid-training GR00T-N1.5
With both RoboCasa models mid-trained, early fusion averages 75.2% versus baseline 72.2%, but aggregate p=.168. StoveToCounter improves 65.3→84.0% with p=.004, while other task differences are mixed. This table does not support the prose claim of a more significant aggregate gain.
The same table retains every depth RMSE, δ₁ and MAE statistic; overall averages are .088 m, .877 and .054 m respectively. Task differences complicate interpretation of these depth/control associations.
On LIBERO, mid-trained early fusion reaches 87.7% versus baseline 87.9%, p=.440. It improves over the ordinary early-fusion average 86.6%, but not numerically over the displayed baseline. Table A.5 labels only early fusion as mid-trained, so it is not clearly a matched-mid-training comparison there.
| Method | CabToCtr | CtrToCab | CtrToMicrowave | CtrToSink | CtrToStove | MicrowaveToCtr | SinkToCtr | StoveToCtr | Average |
|---|---|---|---|---|---|---|---|---|---|
| GR00T (mid-trained) | 50.7 | 72.0 | 80.0 | 100.0 | 81.3 | 61.3 | 66.7 | 65.3 | 72.2 |
| Early Fusion (mid-trained) | 52.0 (p=1.000) | 72.0 (p=1.000) | 69.3 (p=0.134) | 94.7 (p=0.125) | 80.0 (p=1.000) | 68.0 (p=0.424) | 81.3 (p=0.063) | 84.0 (p=0.004) | 75.2 (p=0.168) |
| Depth RMSE | 0.114±0.035 | 0.094±0.025 | 0.114±0.041 | 0.064±0.026 | 0.085±0.038 | 0.082±0.011 | 0.069±0.024 | 0.084±0.035 | 0.088±0.035 |
| Depth | 0.830±0.062 | 0.869±0.041 | 0.829±0.060 | 0.927±0.021 | 0.894±0.061 | 0.869±0.034 | 0.925±0.033 | 0.873±0.062 | 0.877±0.060 |
| Depth MAE | 0.068±0.027 | 0.056±0.021 | 0.071±0.029 | 0.037±0.017 | 0.057±0.035 | 0.048±0.009 | 0.038±0.018 | 0.056±0.035 | 0.054±0.028 |
0.E.3 Inspecting the Attention Masks in Early Fusion
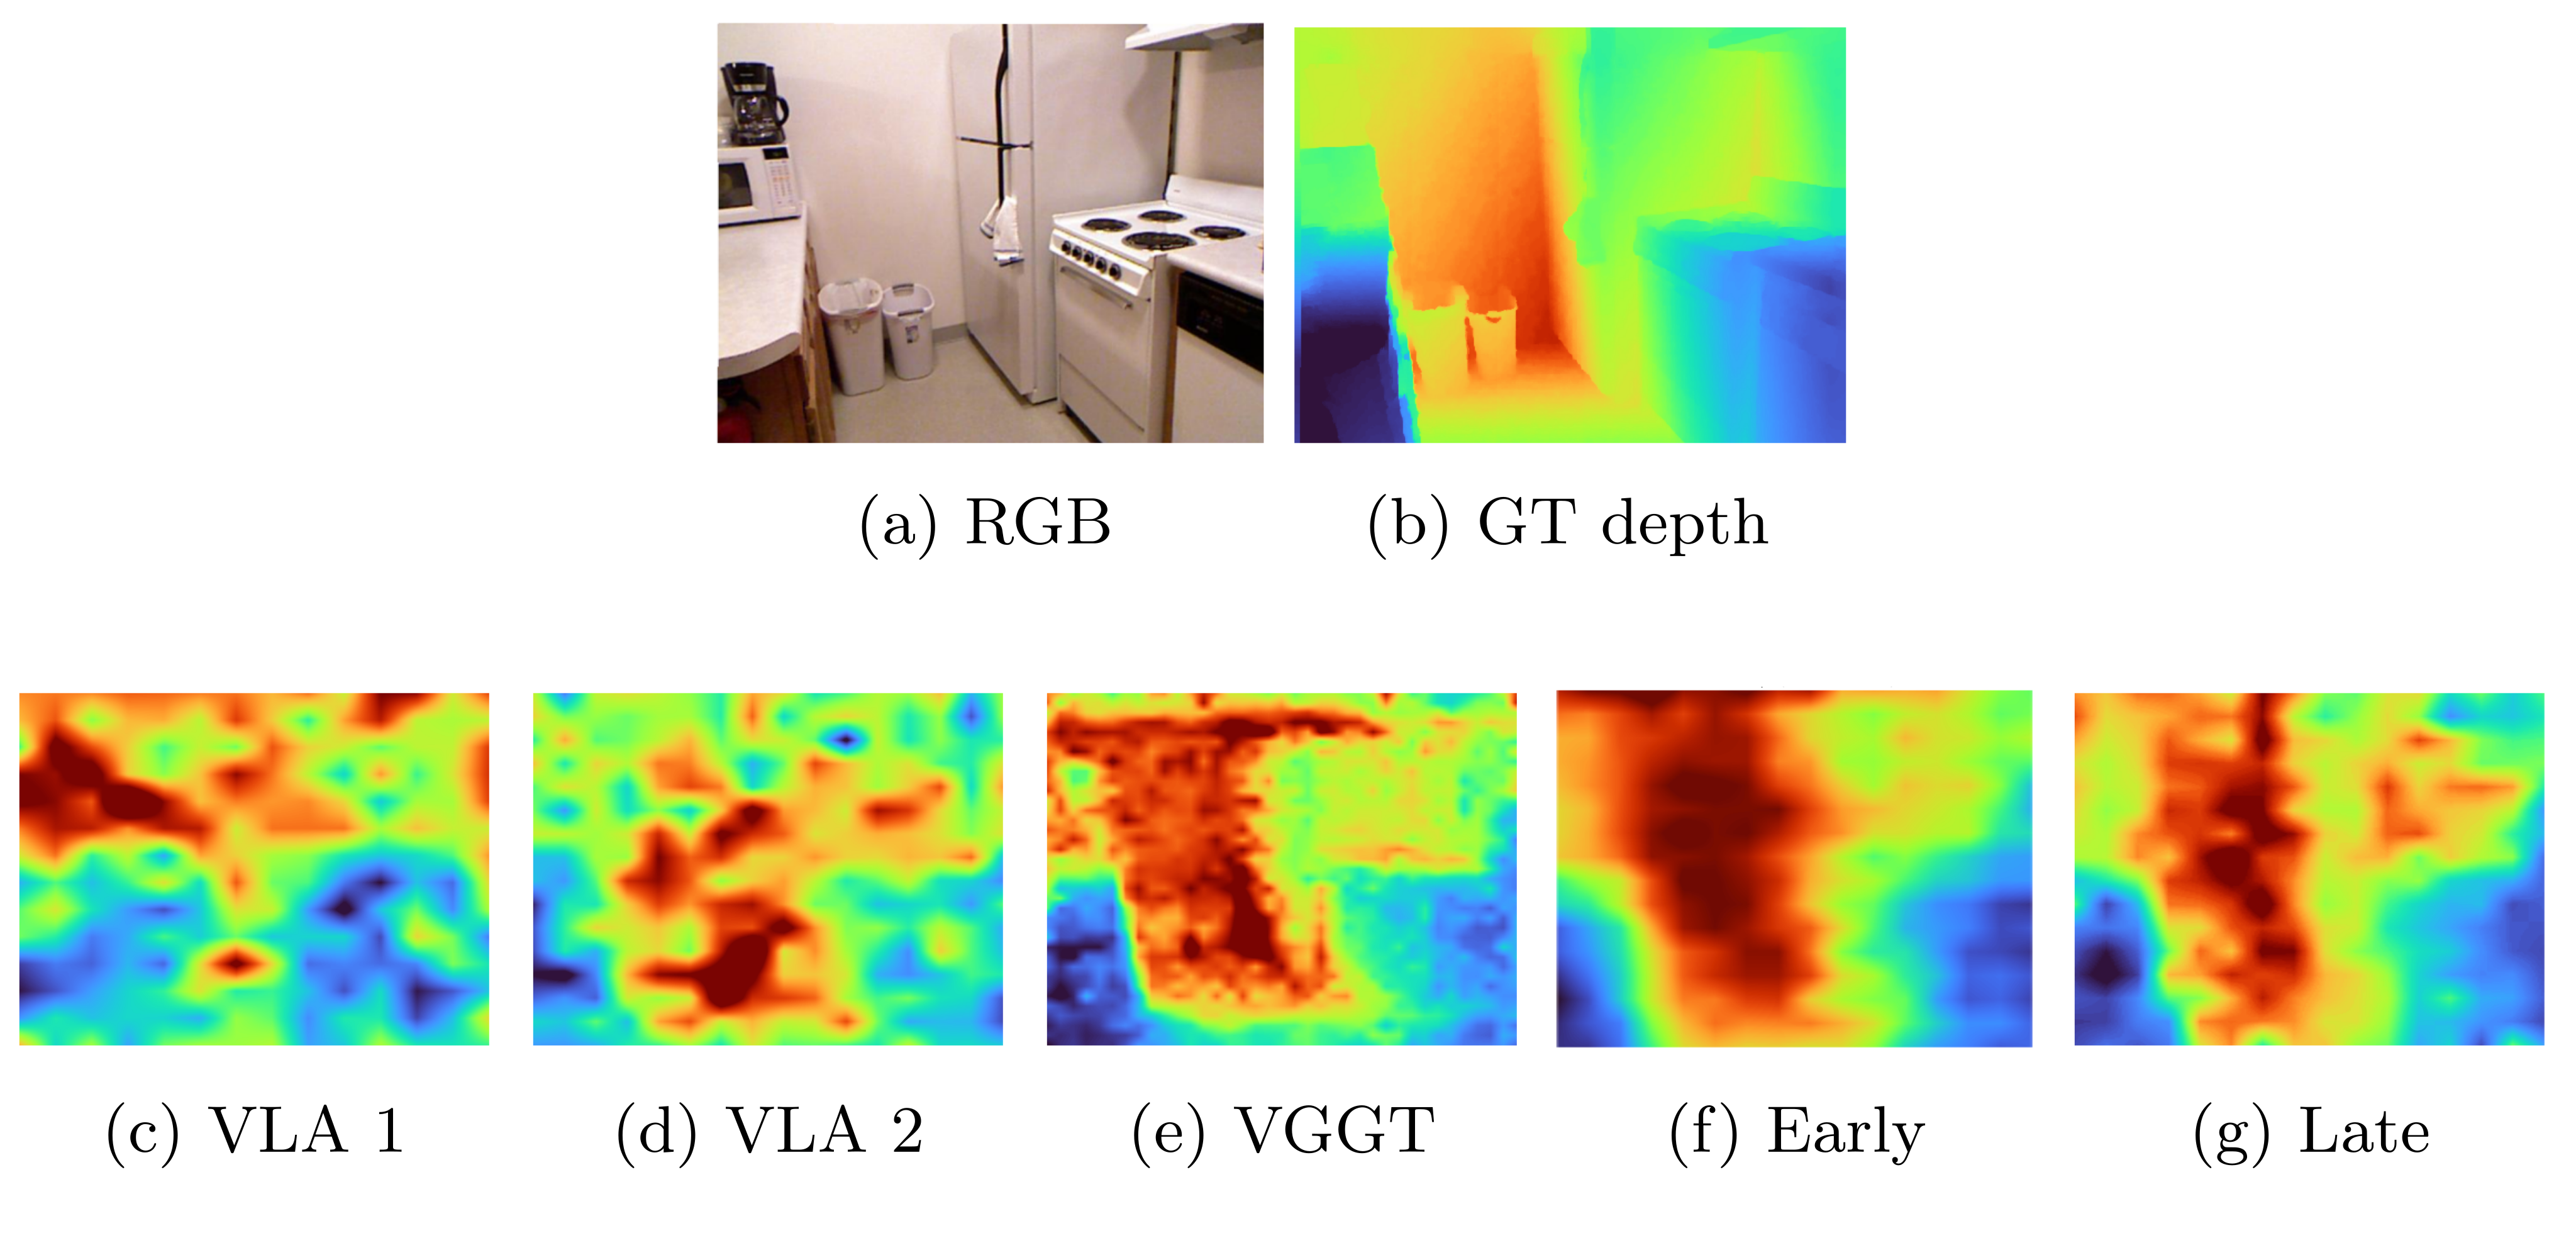
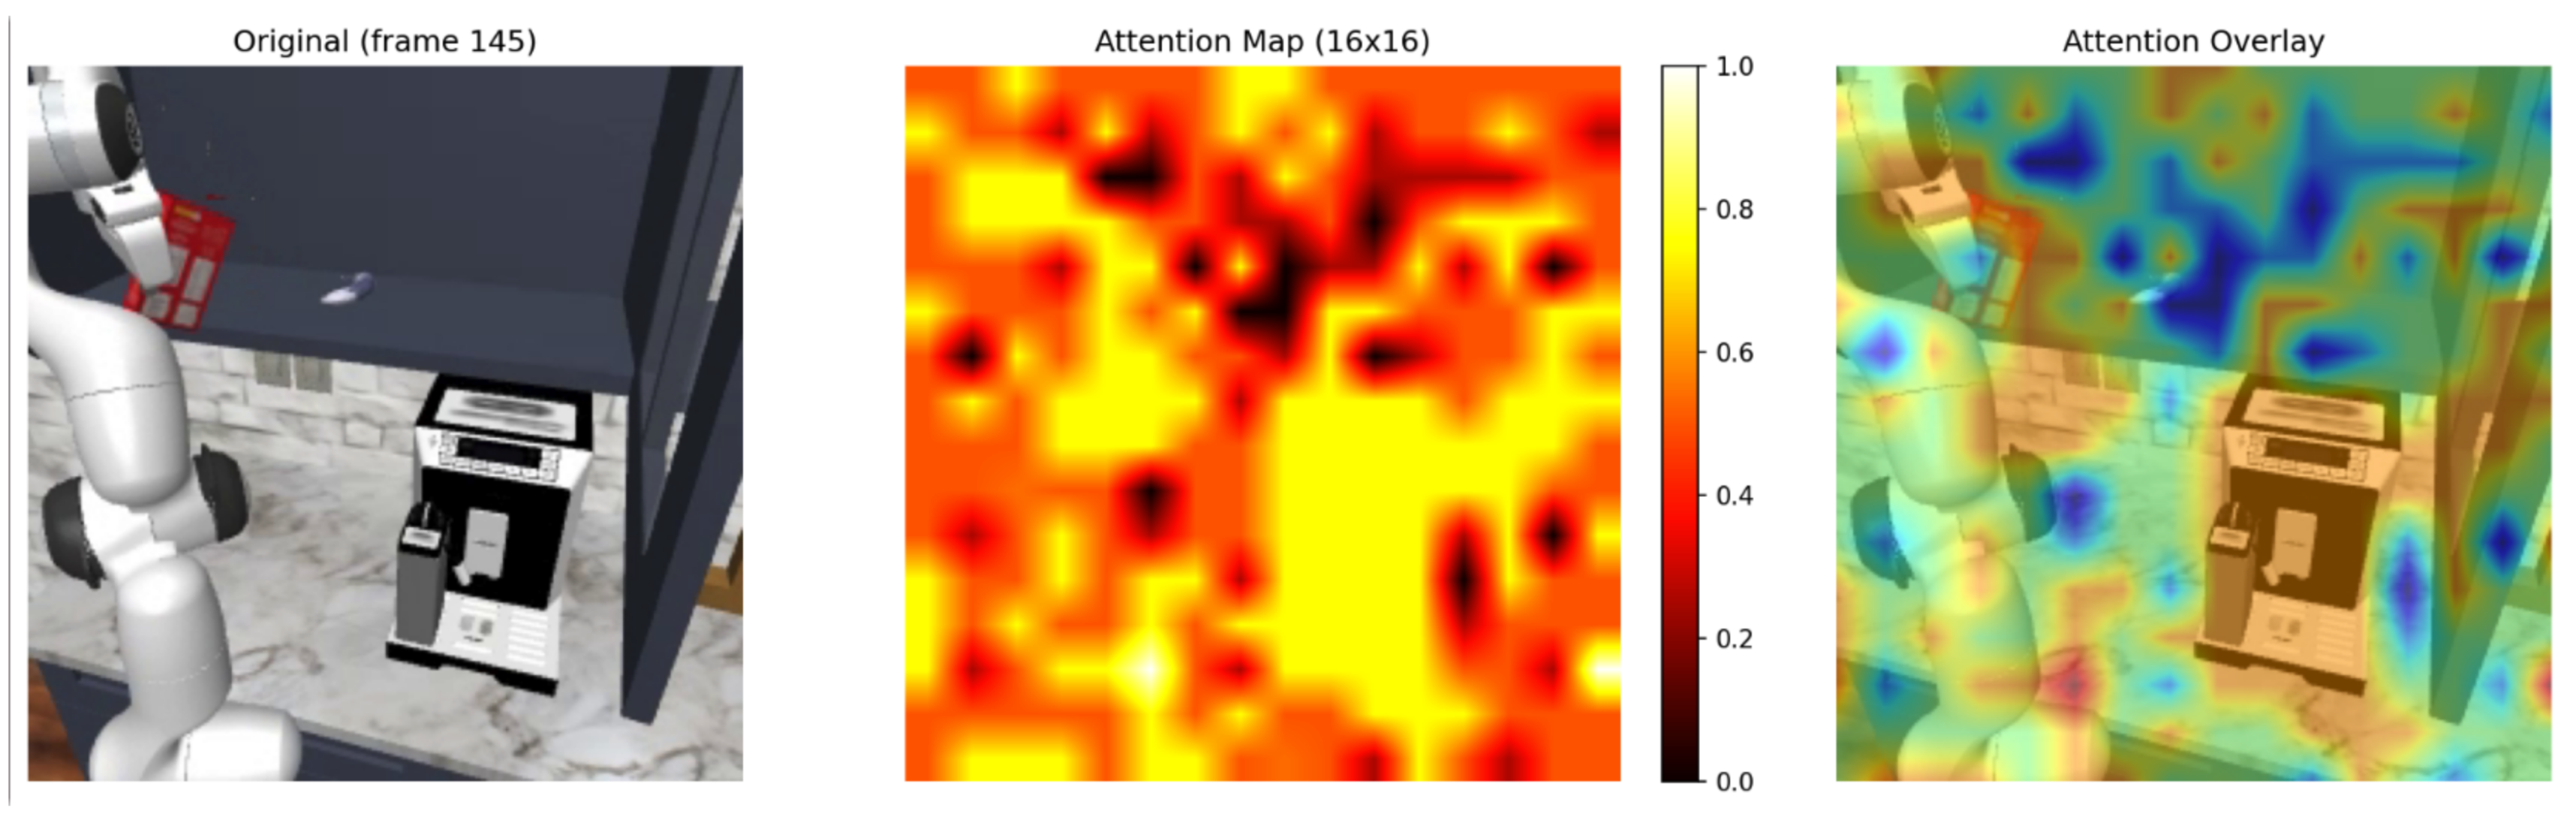
A selected attention-mask example places stronger values near the arm/end effector, though the map is noisy. Figure A.3 preserves RGB, mask and overlay. This qualitative illustration does not establish causal feature use or dataset-wide localization accuracy.
0.E.4 Linear Probing for Normals Estimation
Train normal-vector probes for ten epochs on NYU Depth V2 using cosine loss. Measure mean/median angular error and the fraction within 30°. Vision/VLM means are 44.97°/44.43°, VGGT 39.62°, early fusion 41.29° and late fusion 42.34°.
Early fusion’s within-threshold fraction .44 approaches VGGT .45, compared with .33/.34 for the baseline probes. This broadens the geometric-decoding evidence beyond depth, while retaining the same probe-capacity and frozen-backbone interpretation limits.
| Mean Error () | Median Error () | Within () | |
|---|---|---|---|
| GR00T - vision encoder probe | 44.97 | 45.26 | 0.33 |
| GR00T - VLM probe | 44.43 | 44.15 | 0.34 |
| VGGT probe | 39.62 | 33.86 | 0.45 |
| Early Fusion probe | 41.29 | 34.40 | 0.44 |
| Late Fusion probe | 42.34 | 38.96 | 0.39 |
Equation
0.E.5 Invariance to Object Appearance
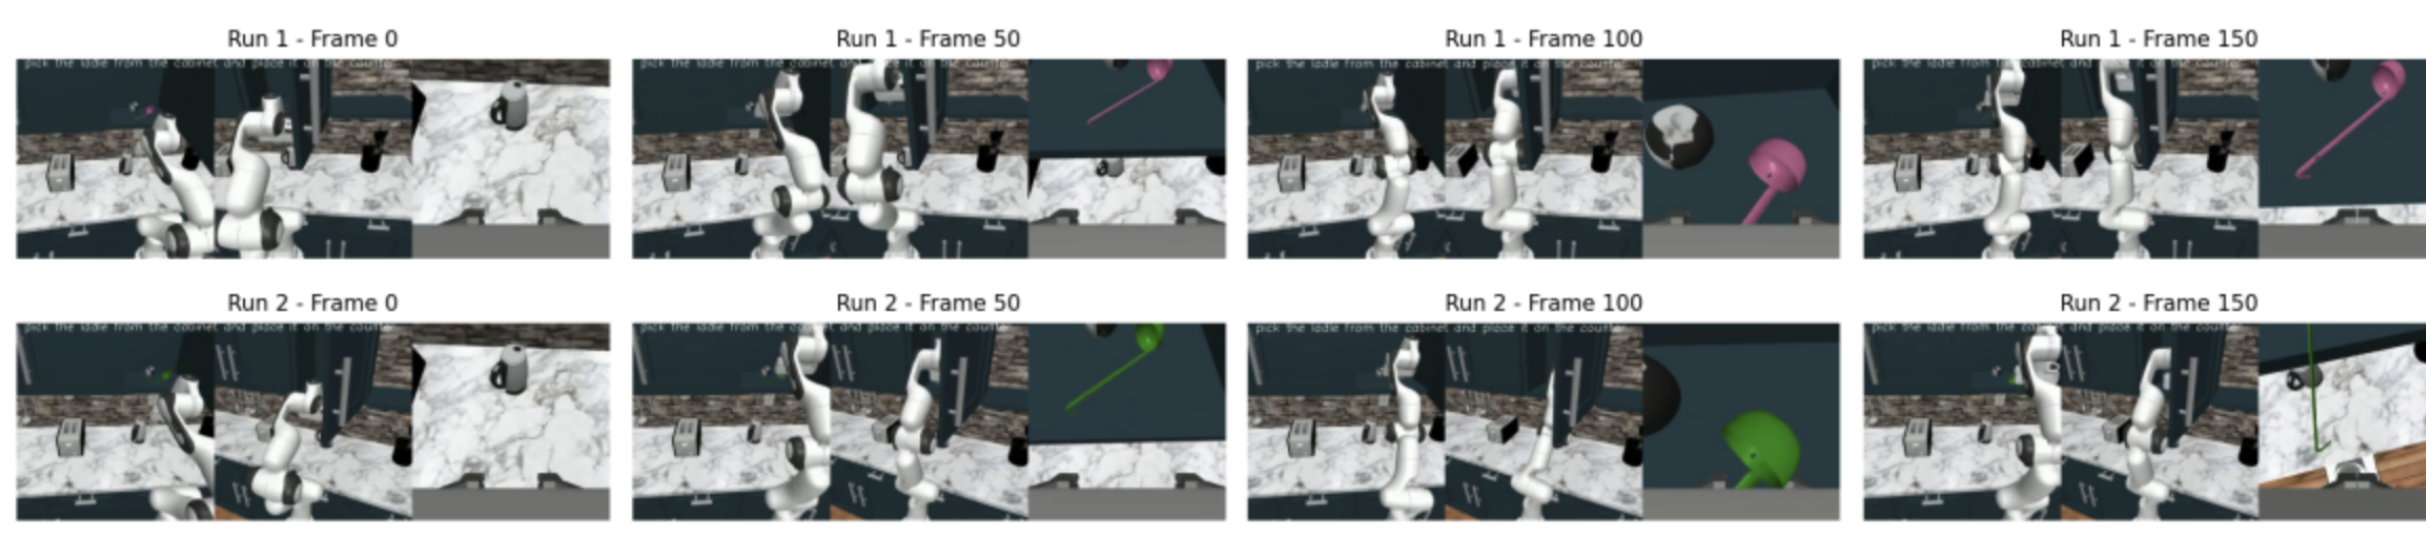
Hold geometry and all non-target assets fixed while randomizing only the target object’s appearance across fifteen trials. Figure A.4 retains all camera/time views of magenta and green ladle examples.
Mid-trained early fusion averages 76.7% versus baseline 74.3%, p=.279. It improves some tasks and worsens StoveToCounter 92.0→73.3% with the entry printed as p¡0.001. The aggregate result does not establish special appearance invariance.
These RoboCasa instructions identify objects semantically; color can still be task-relevant in other settings, such as selecting a specifically colored mug. The experiment does not generalize to all appearance-dependent instructions.
| Method | CabToCtr | CtrToCab | CtrToMicrowave | CtrToSink | CtrToStove | MicrowaveToCtr | SinkToCtr | StoveToCtr | Average |
|---|---|---|---|---|---|---|---|---|---|
| GR00T-N1.5 (mid-trained) | 29.3 | 78.7 | 89.3 | 97.3 | 82.7 | 65.3 | 60.0 | 92.0 | 74.3 |
| Early Fusion (mid-trained) | 48.0 (p=0.026) | 76.0 (p=0.625) | 88.0 (p=1.000) | 98.7 (p=1.000) | 89.3 (p=0.302) | 56.0 (p=0.210) | 84.0 (p=0.004) | 73.3 (p¡0.001) | 76.7 (p=0.279) |