Overview
This edition covers all twenty-three pages of arXiv v4, dated 6 October 2026, including the complete sensing, calibration, policy and experiment appendices. Zhixuan Xu and Yichen Li contributed equally; Lin Shao is the corresponding author. Author names are normalized to the paper’s printed order and spelling.
All figures, tables and formulas are retained. The HTML incorrectly labels the modality-results table as a figure; this edition follows the PDF’s thirteen figures and nine tables while preserving reference IDs.
At a glance
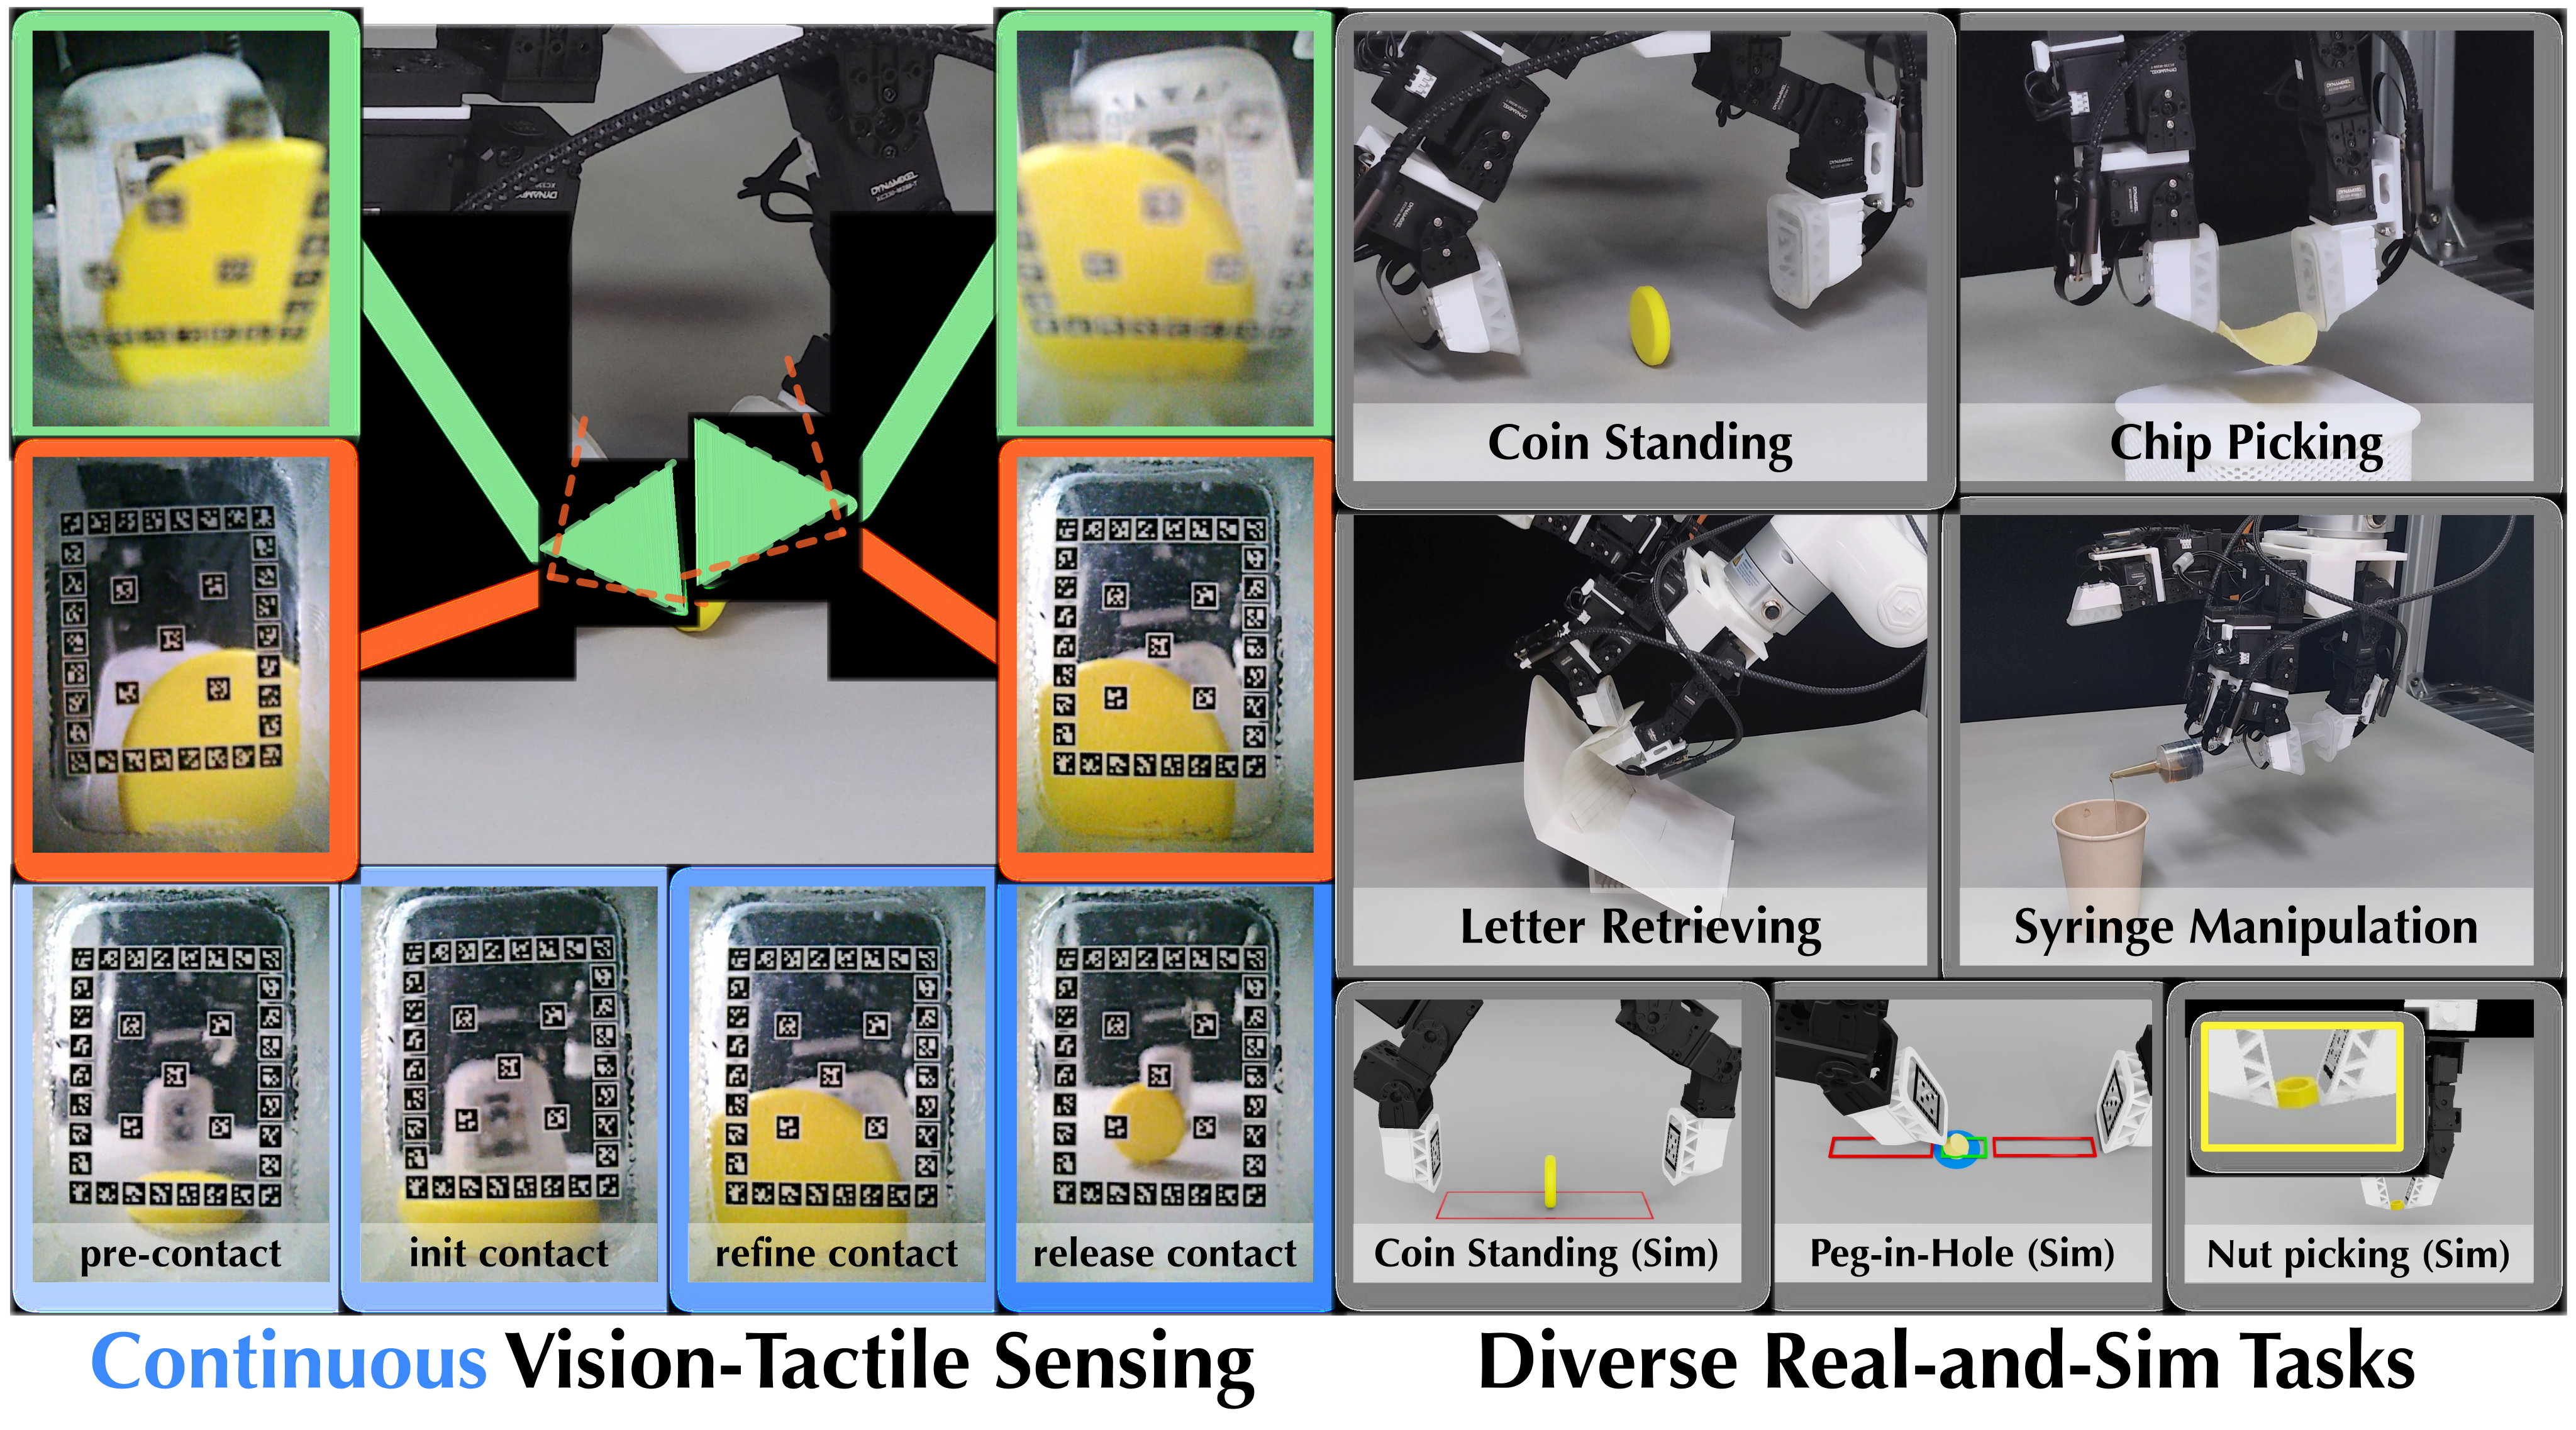
FingerEye combines two fingertip RGB cameras with a clear acrylic contact plate suspended by a compliant silicone ring. Cameras see local geometry before touch; contact moves the plate, whose AprilTag array provides a six-dimensional deformation proxy afterward.
A learned action-chunking policy separately encodes observation groups and gives each an independent decoder attention path. Across three simulation and four real task settings, binocular FingerEye raises mean success by 39.1 and 33.8 percentage points over wrist vision. Main policies use RGB and proprioception, not explicit estimated force or plate pose.
1 Introduction
Approach, first contact and subsequent force regulation require different information. External vision can miss occluded fingertip geometry, while conventional tactile sensing becomes informative only after touch. The sensor aims to observe that transition continuously.
Relative to existing see-through designs, FingerEye emphasizes clear passive RGB, robust identity-based marker tracking, a wedge that reaches thin edges, matched real/simulation infrastructure and a policy interface that keeps local feedback accessible. Its sensing stream is continuous, although learned actions are executed in chunks between replanning steps.
The paper reports hardware/software resources at its project site. This edition reviews the paper’s evidence and does not independently audit a complete external release.
2 Related work
GelSight and related vision-based tactile sensors provide rich contact information. FingerVision, Finger-STS and other see-through sensors combine proximity and touch, with differing optical, illumination and geometry trade-offs.
Multisensory policies and Sparsh-style representation learning address complementary learning problems. FingerEye instead studies how encoded fingertip, wrist and proprioceptive tokens reach action queries. Its comparisons do not establish superiority to every optimized tactile representation or matched see-through sensor.
3 FingerEye Sensing Interface
The sensing design keeps a clear visual path while transmitting contact-induced motion to a trackable rigid plate. Five design choices and four capability tests separate construction, pose sensing, wrench calibration and task utility.
3.1 Sensing Interface Design Highlights
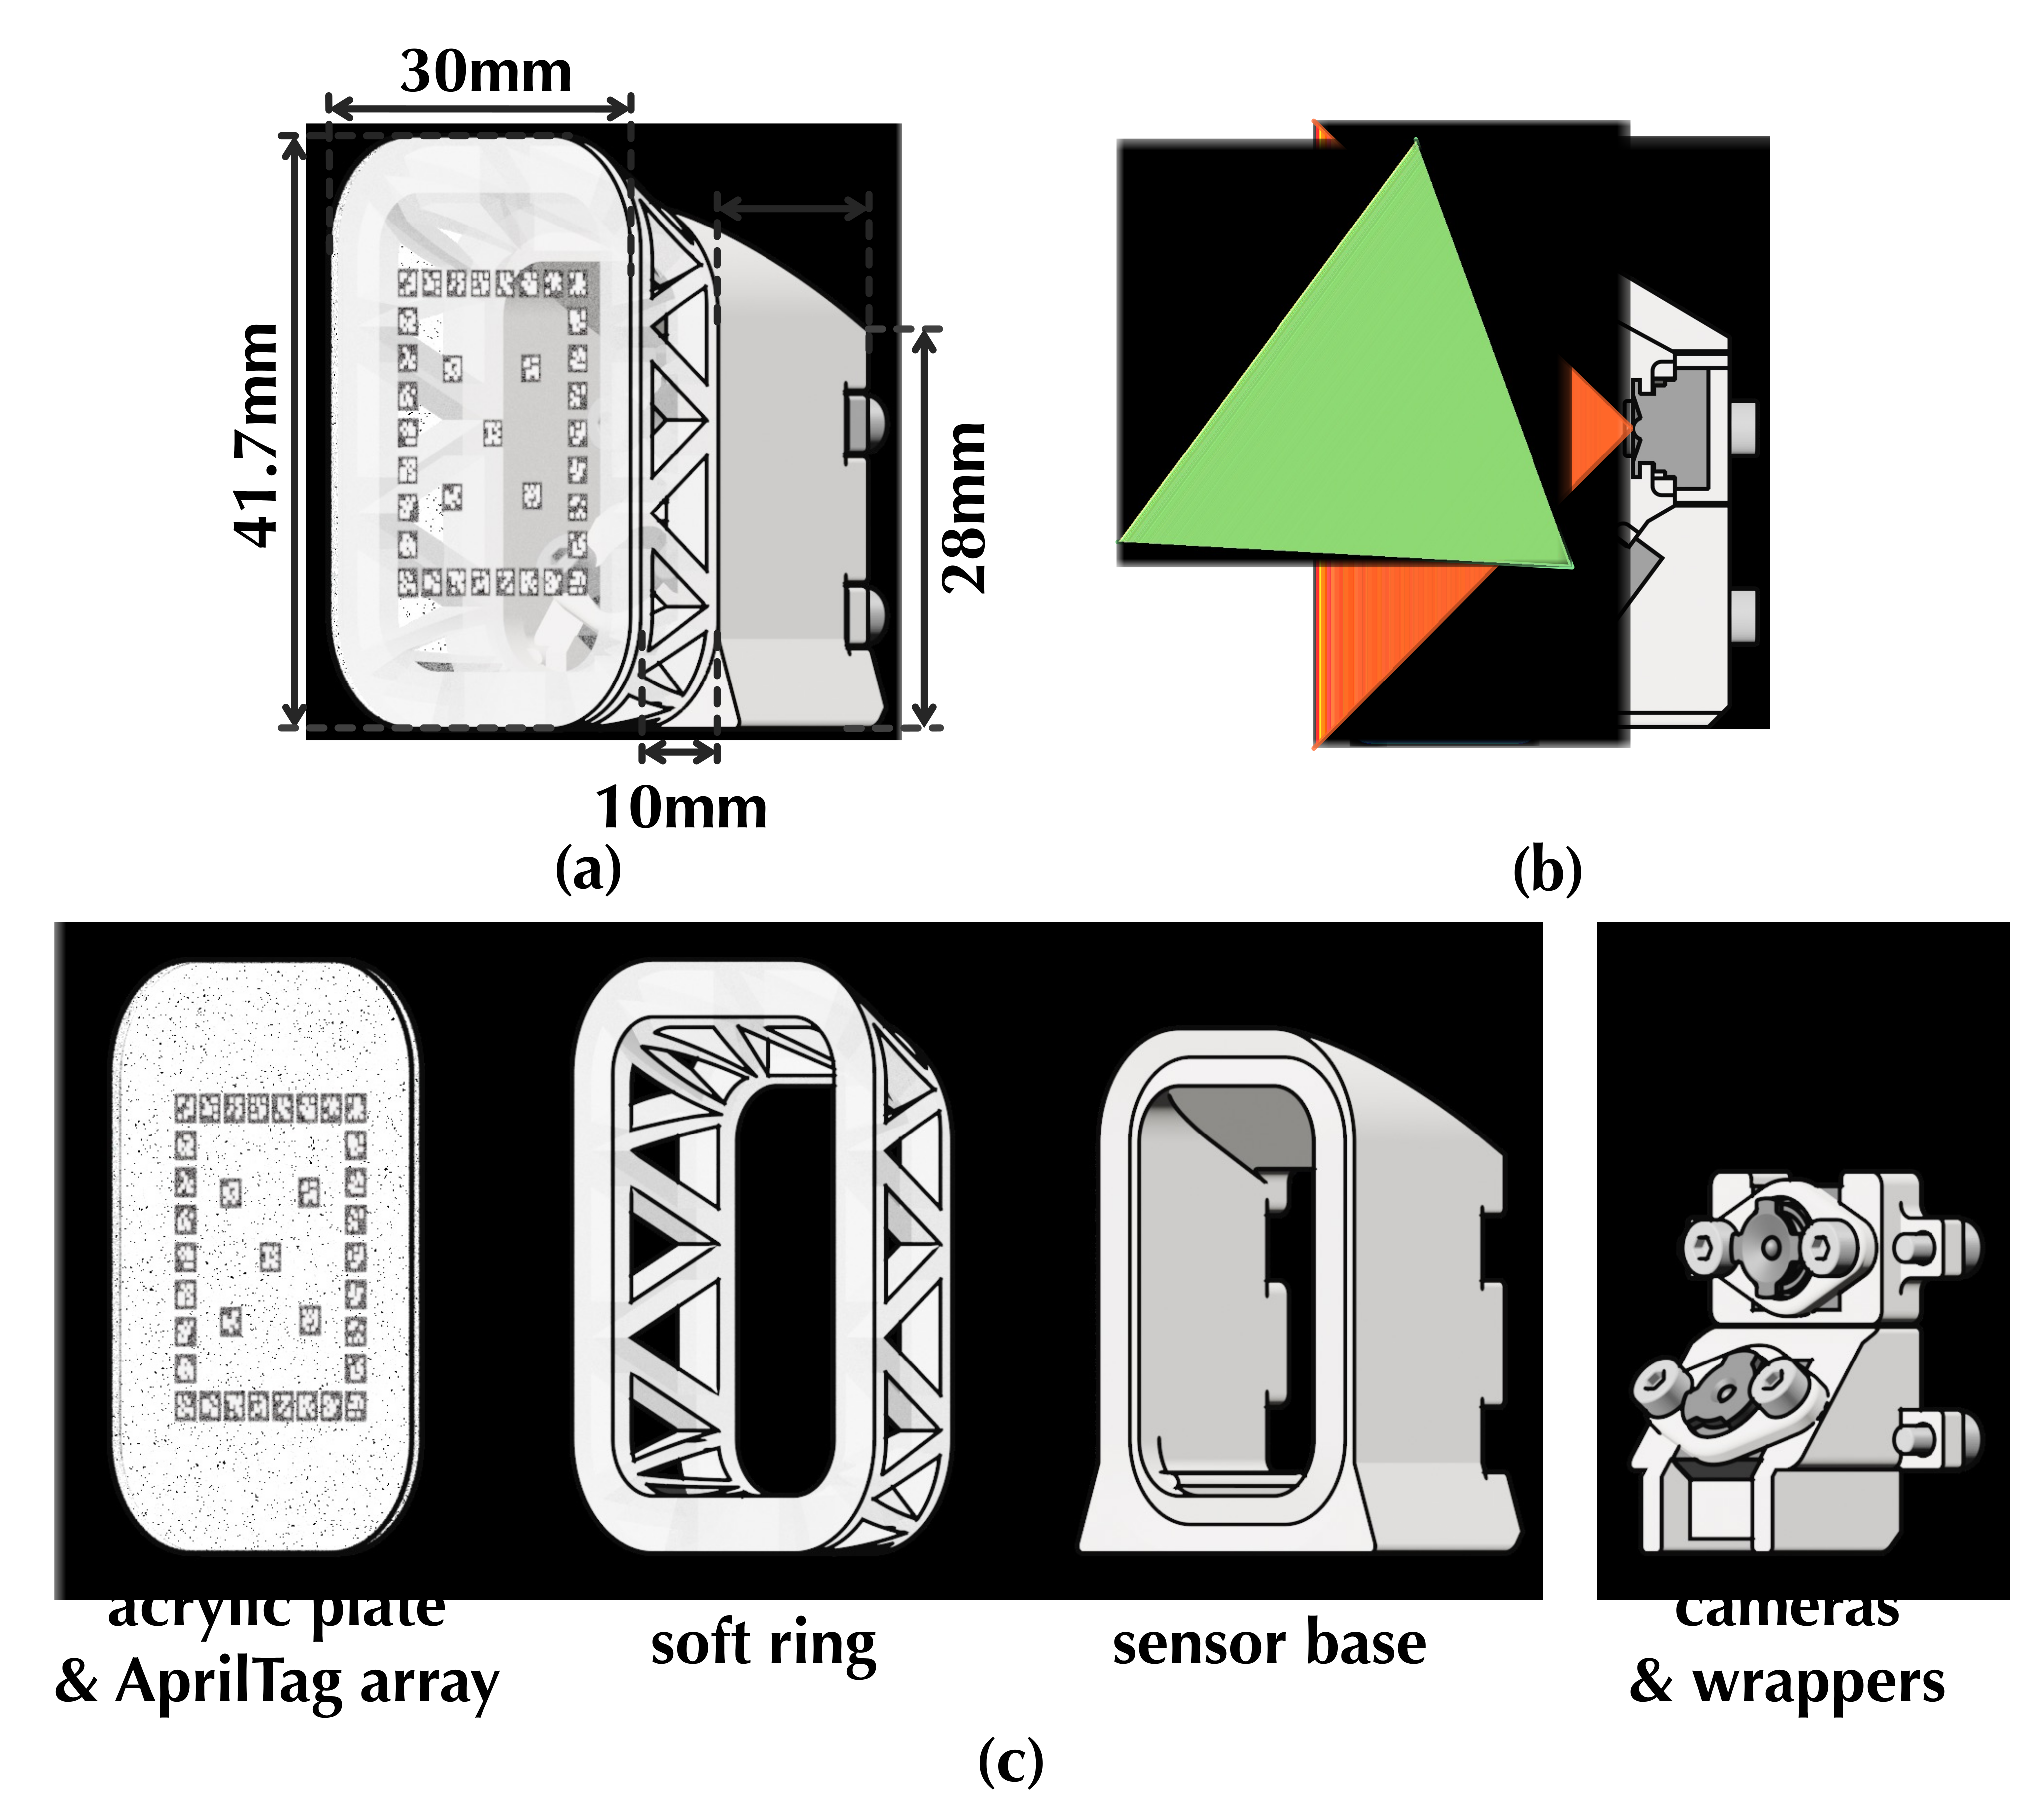
A tip camera focuses near the plate at about 10 mm; a tilted root camera preserves broader approach context. Their complementary RGB views supply implicit stereo cues without active illumination or mode switching. The system does not explicitly reconstruct dense stereo depth.
A compliant silicone ring surrounds a clear acrylic center. Frontal and peripheral loads change plate pose; thirty-five tags provide redundant corners for one joint PnP estimate. The wedge-shaped module is about 41.7×30.0×25.0 mm and costs approximately $60 in the reported bill of materials.
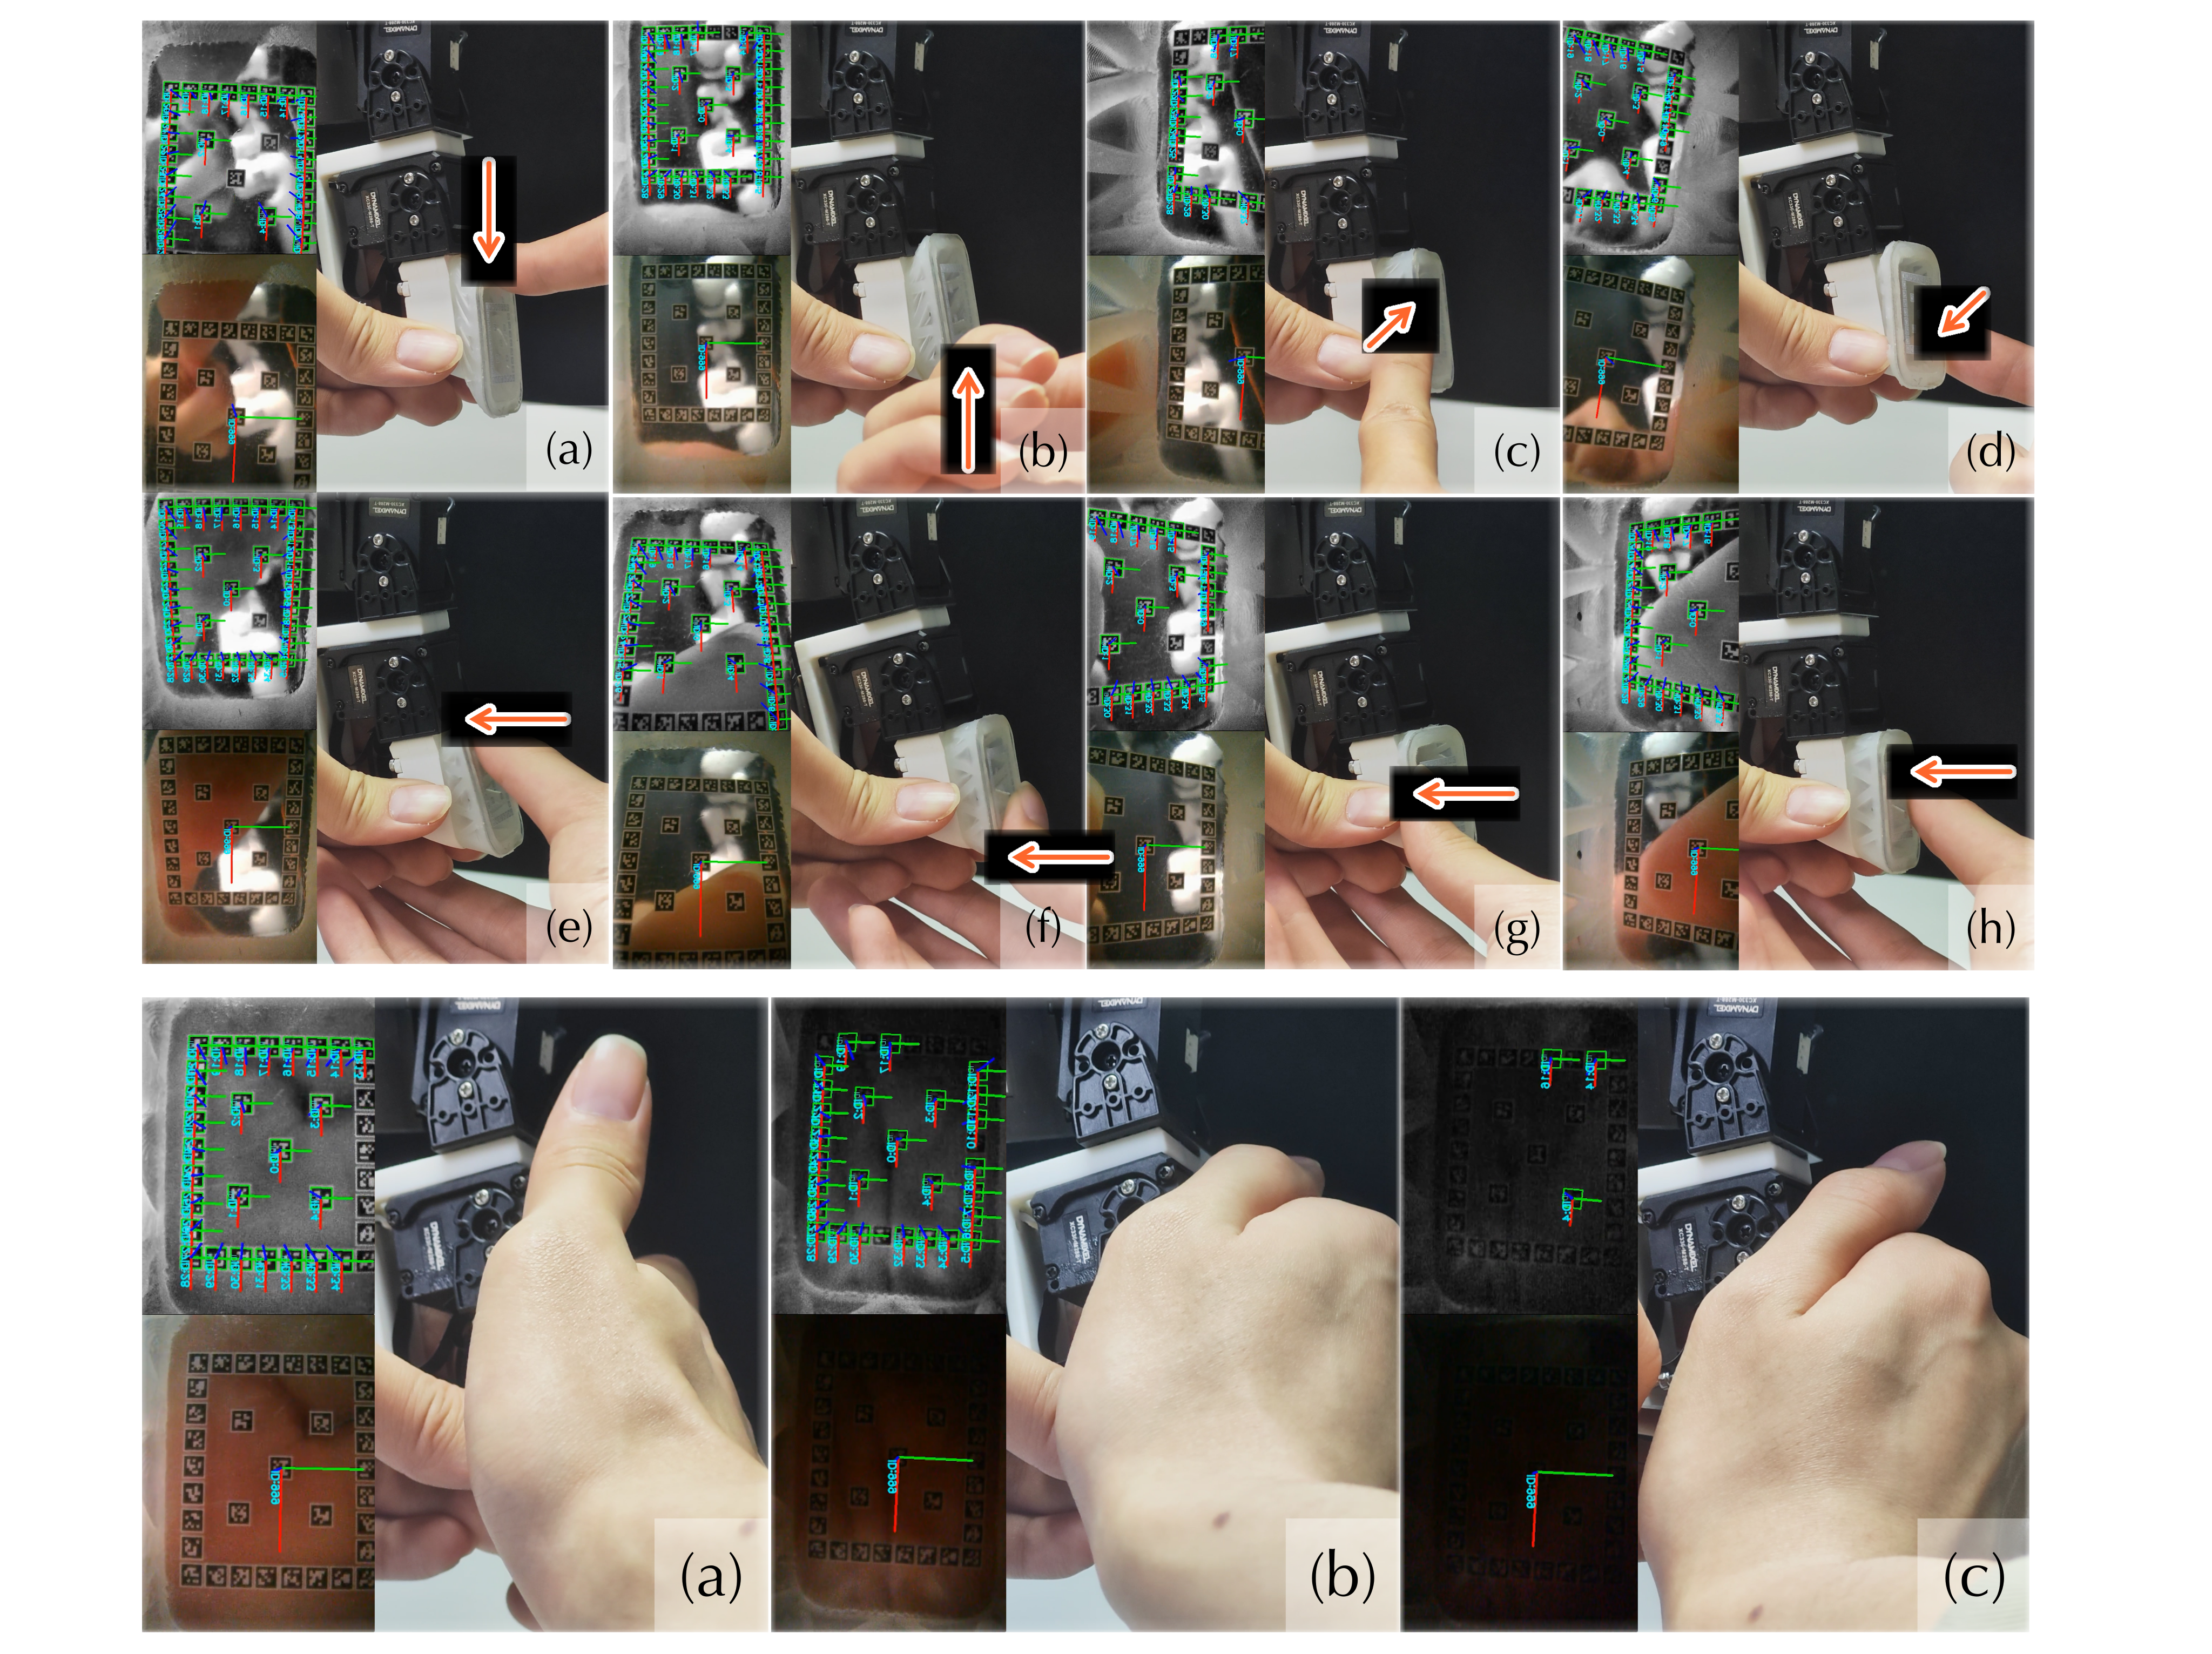
The layout keeps the center visually useful but does not eliminate occlusion or the friction/conformity trade-off of rigid acrylic. Figure 2 retains all dimensions and the exploded design; Figure 3 retains force/lighting examples.
3.2 Sensing Interface Capability Highlights
Multiple visible tags stabilize pose estimation when some disappear. A tag-count ablation measures jitter and agreement with the full layout, while 10,000 normal-compression cycles test one limited durability mode.
Axis-specific calibration relates plate motion to wrench. The quoted minimum detectable forces 4.30/4.22/9.93 mN and torques 0.32/0.13/8.55 mN·m are analytical estimates based on assumed subpixel localization, not directly measured detection thresholds.
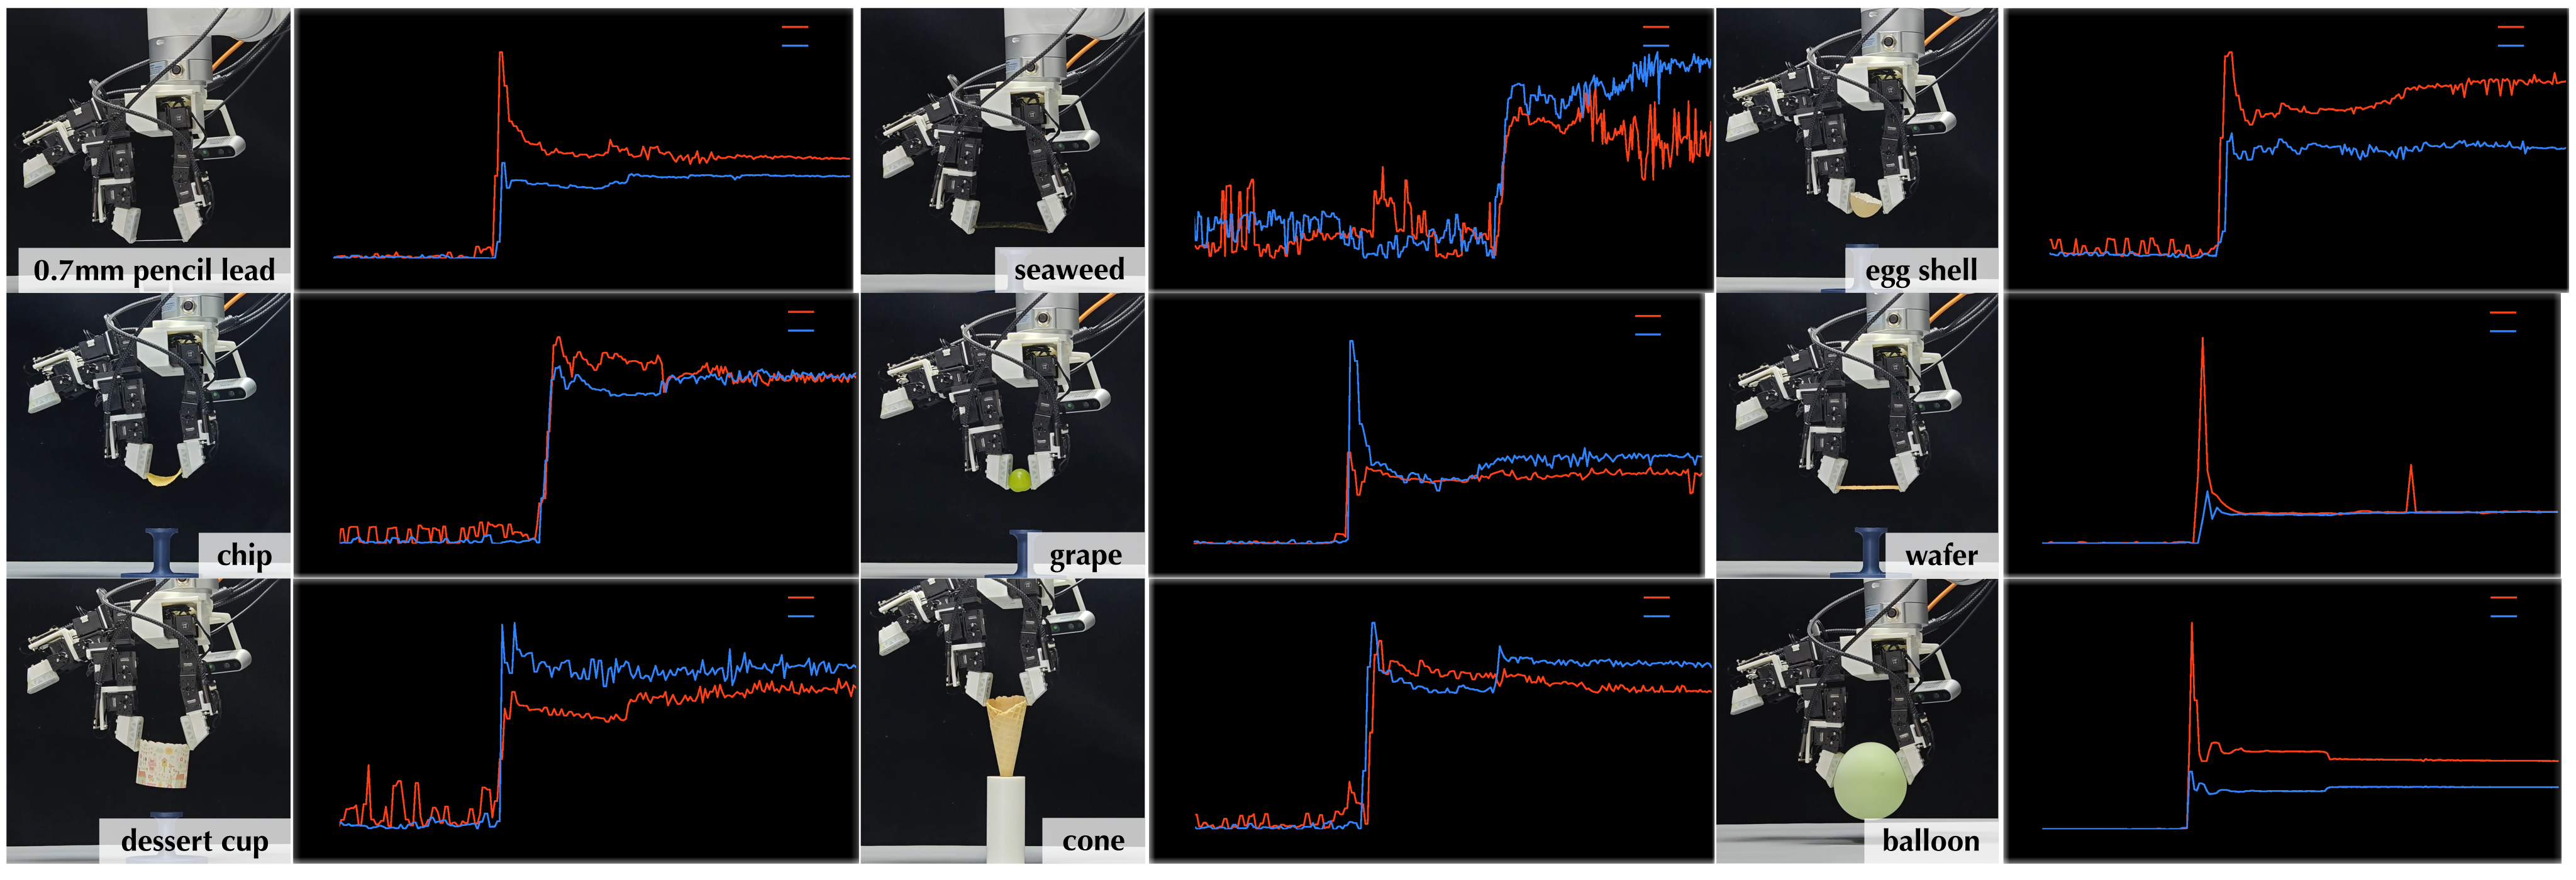
A separate controller stops predefined finger motions at object-specific normal-displacement thresholds and lifts nine delicate objects. This demonstrates contact-onset utility with selected thresholds and support fixtures, not a learned universal force-control policy.
Equations
4 FingerEye Learning Interface
The learning interface combines matched teleoperation, a compliant-plate simulation proxy and an action-query transformer. The key ablation is the scope of observation encoding and decoder attention, with sensing input held fixed.
4.1 Real-and-Sim Learning Infrastructure
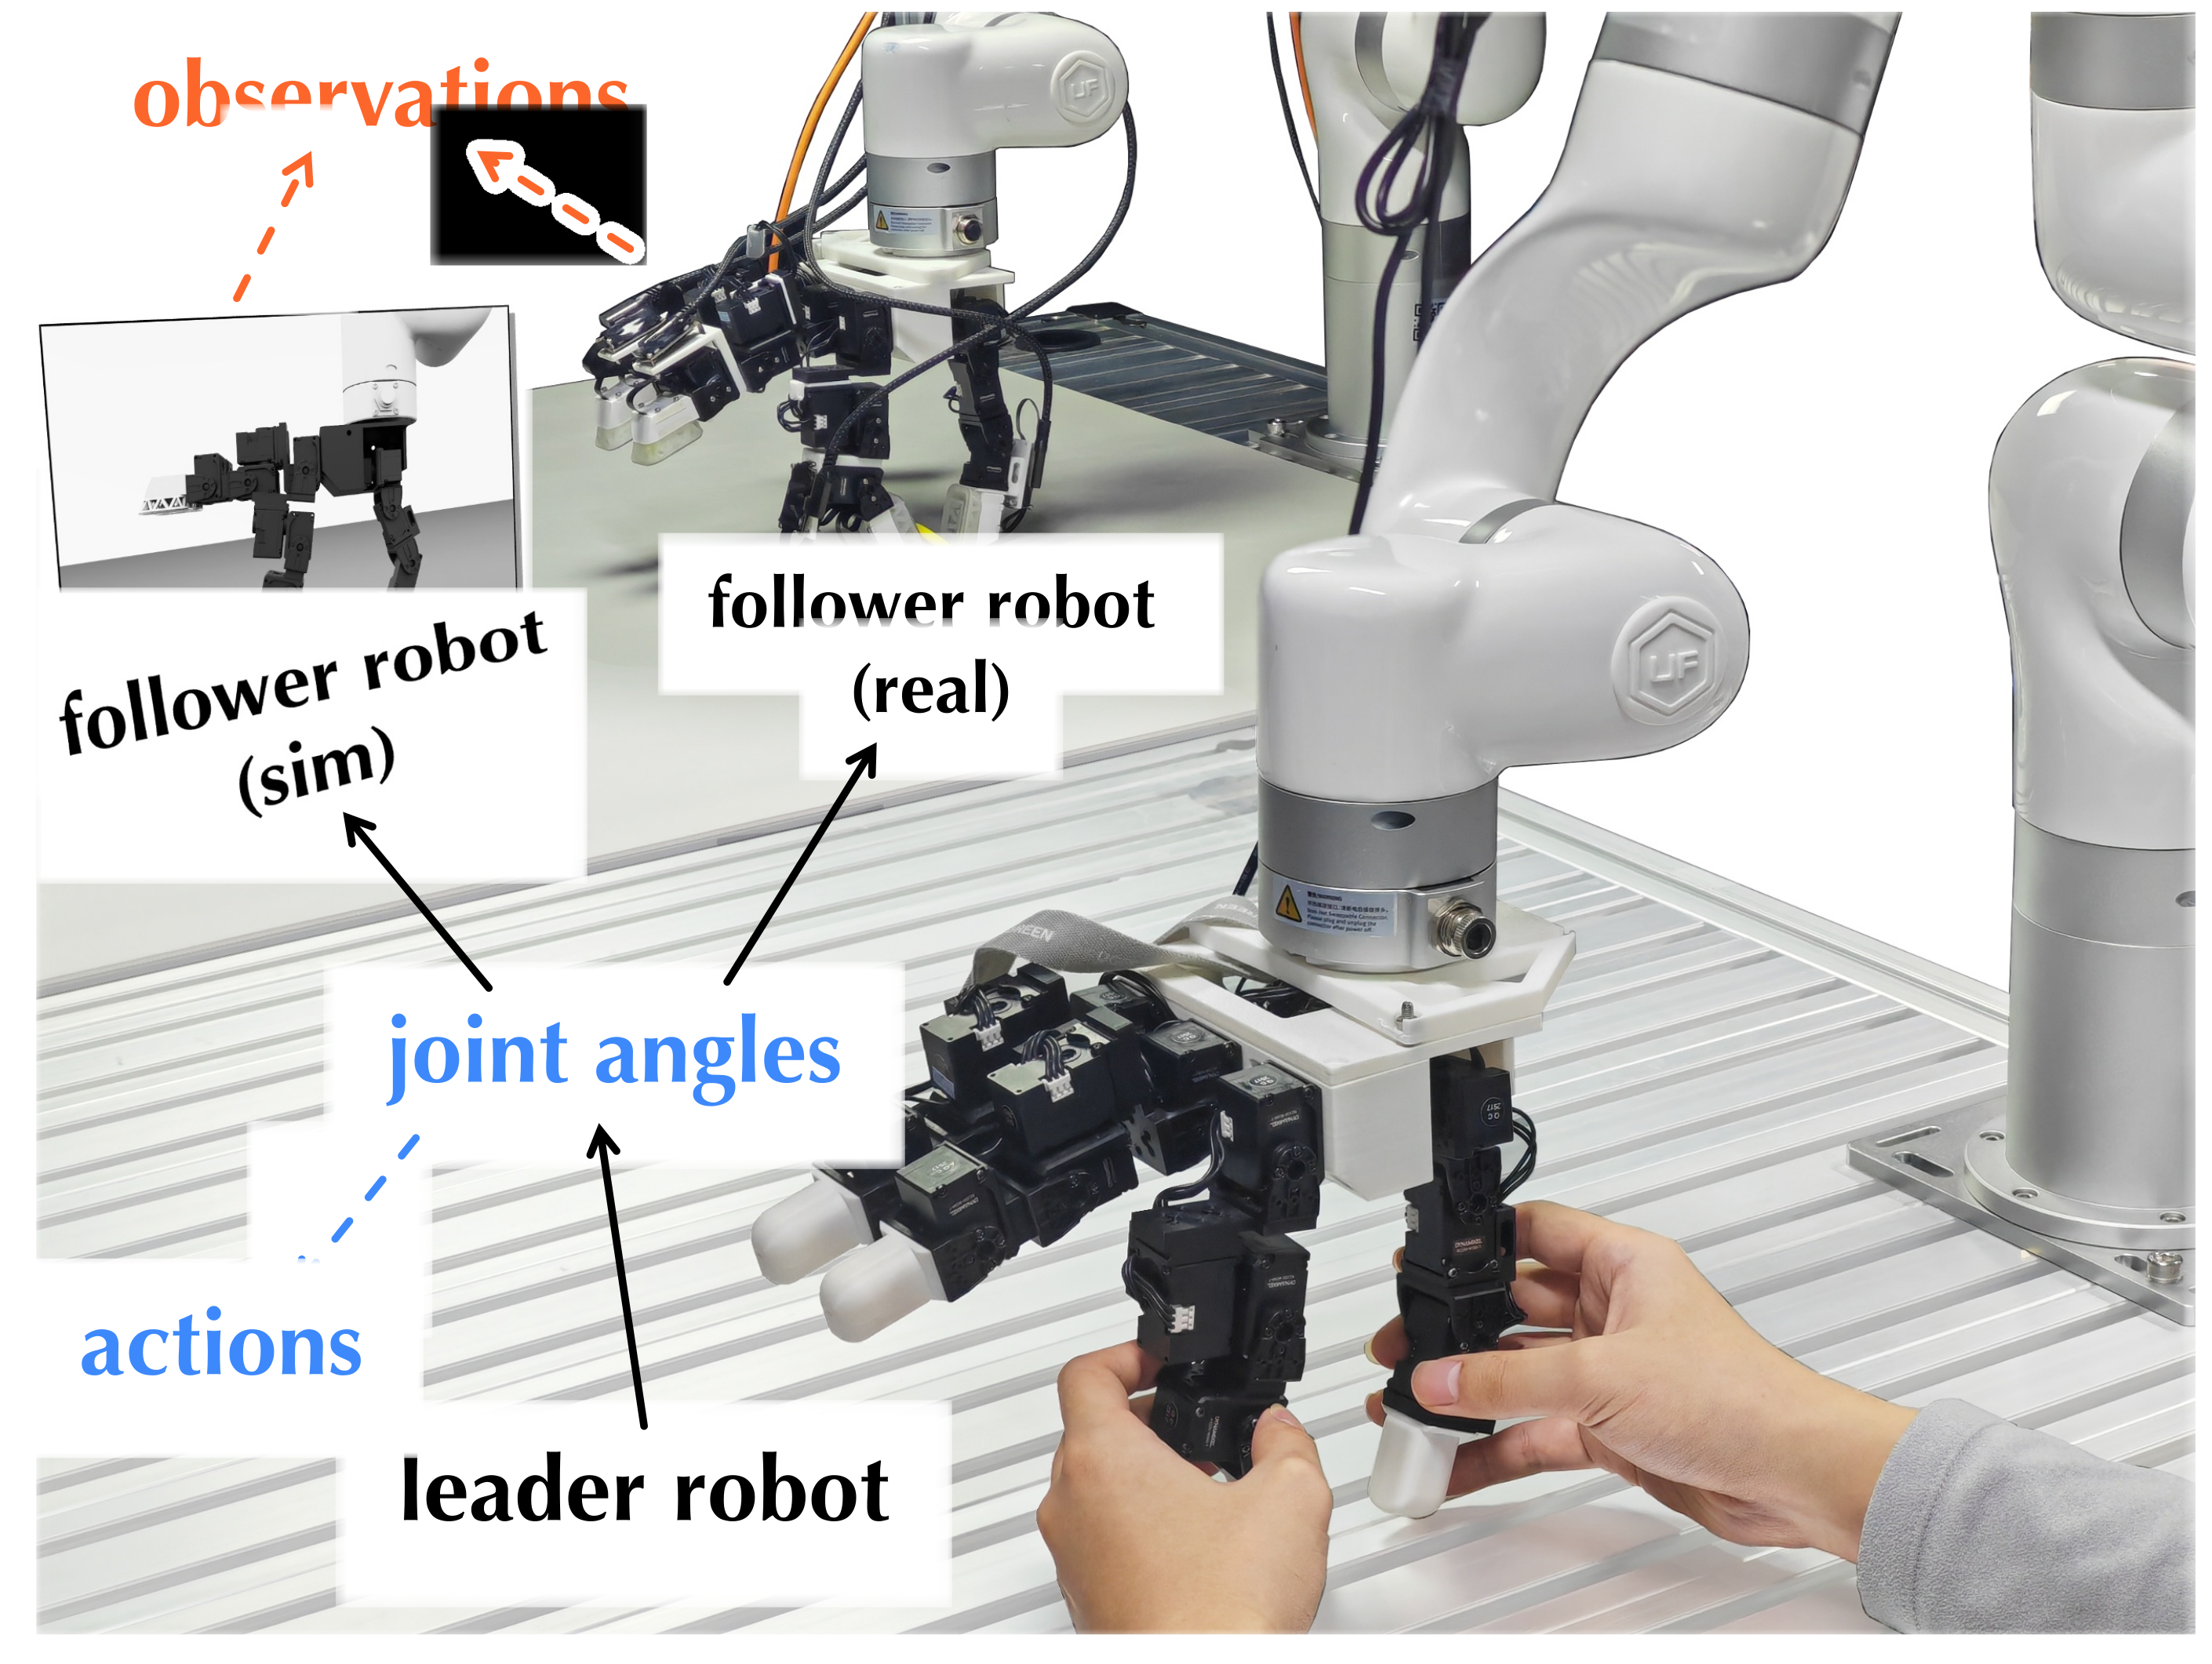
Use a fixed-base uFactory xArm7 and LEAP Hand, with wrist RGB and fingertip modules. A passive leader with matched hand kinematics commands follower joints through PD control, avoiding the human-to-robot retargeting mismatch encountered in preliminary trials.
Record synchronized RGB, plate pose, robot state and actions at 10 Hz. In simulation, attach each plate by six virtual joints whose gains approximate measured pose-to-wrench behavior. Geometry, cameras and tags are matched; nonlinear silicone mechanics and deformable interactions are neither modeled nor validated.
4.2 Policy Interface Design Highlights
Main inputs are wrist RGB, proprioception and fingertip RGB. The detailed implementation groups all FingerEye camera tokens together, separate from wrist and proprioception. Plate pose supports sensor characterization and delicate-grasp control; explicit wrench input is only an additional ablation.
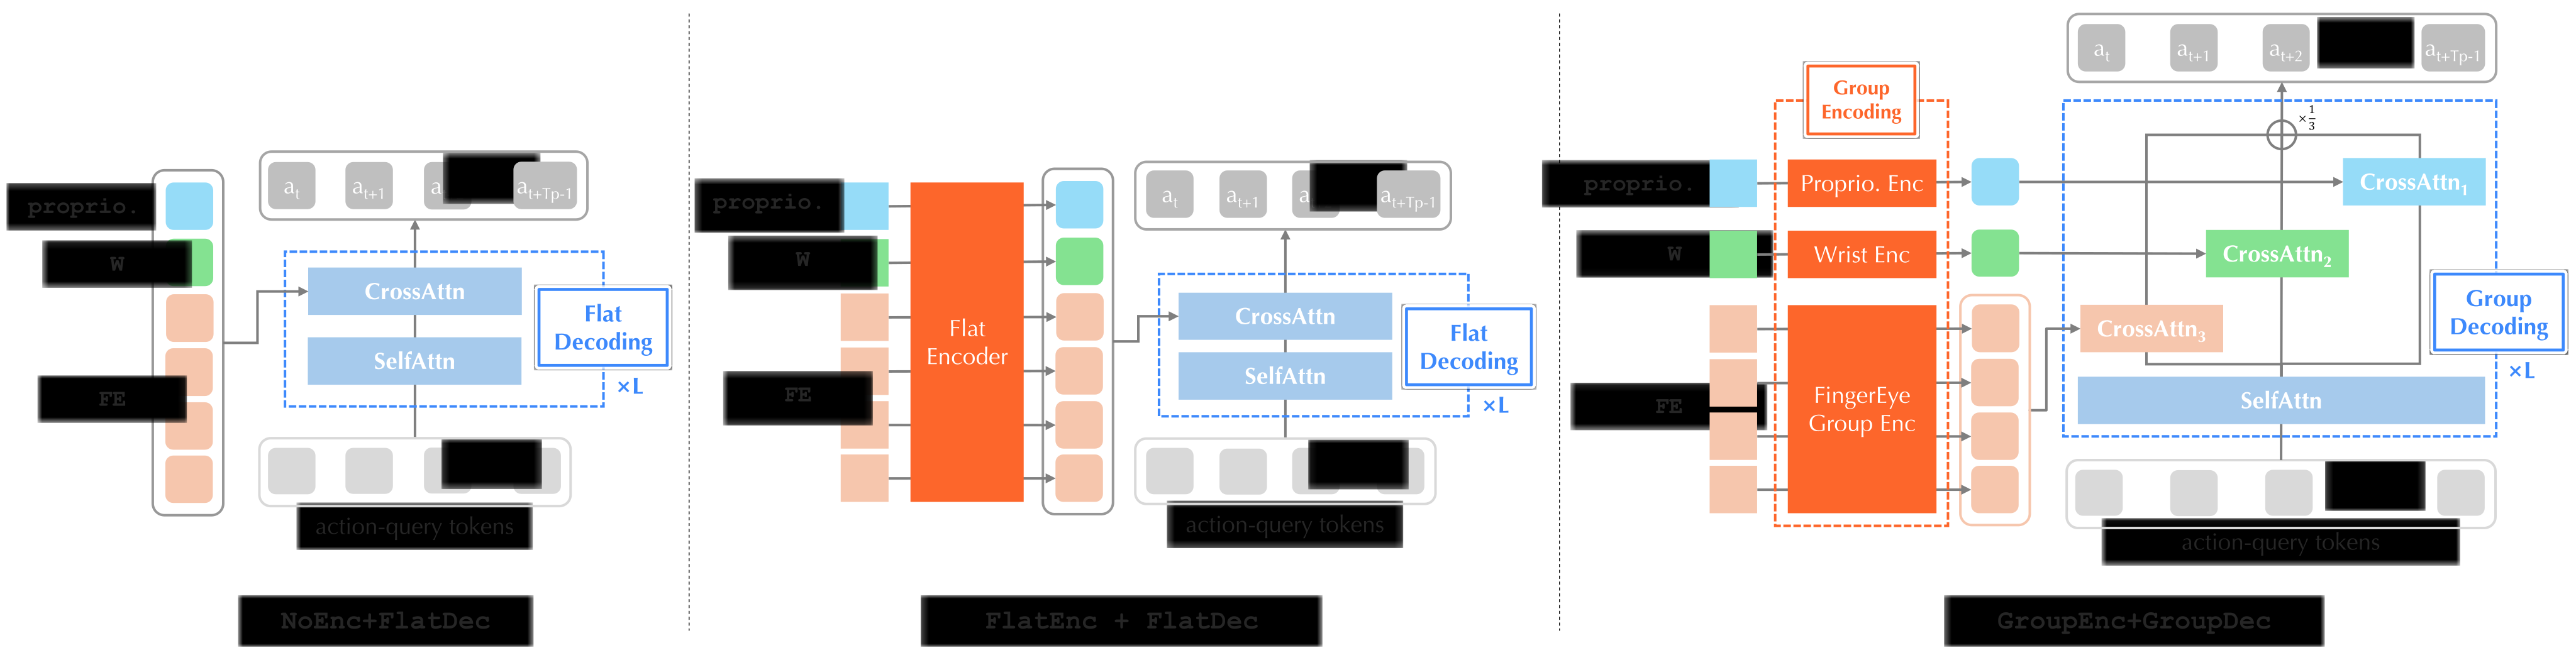
NoEnc passes tokens directly; FlatEnc mixes all tokens; GroupEnc first attends within each group. FlatDec then attends to a single mixed context, whereas GroupDec gives each group a separate cross-attention path and averages their residual updates. This avoids one shared softmax competition, but equal residual weighting does not guarantee equal causal contribution.
Freeze RADIO and cache each image’s summary for policy training. Predict sixteen 10-Hz actions; most tasks execute eight before replanning, while simulated coin and peg tasks execute all sixteen. Continuous sensing therefore coexists with 0.8- or 1.6-second action execution intervals.
Equations
5 Experiments
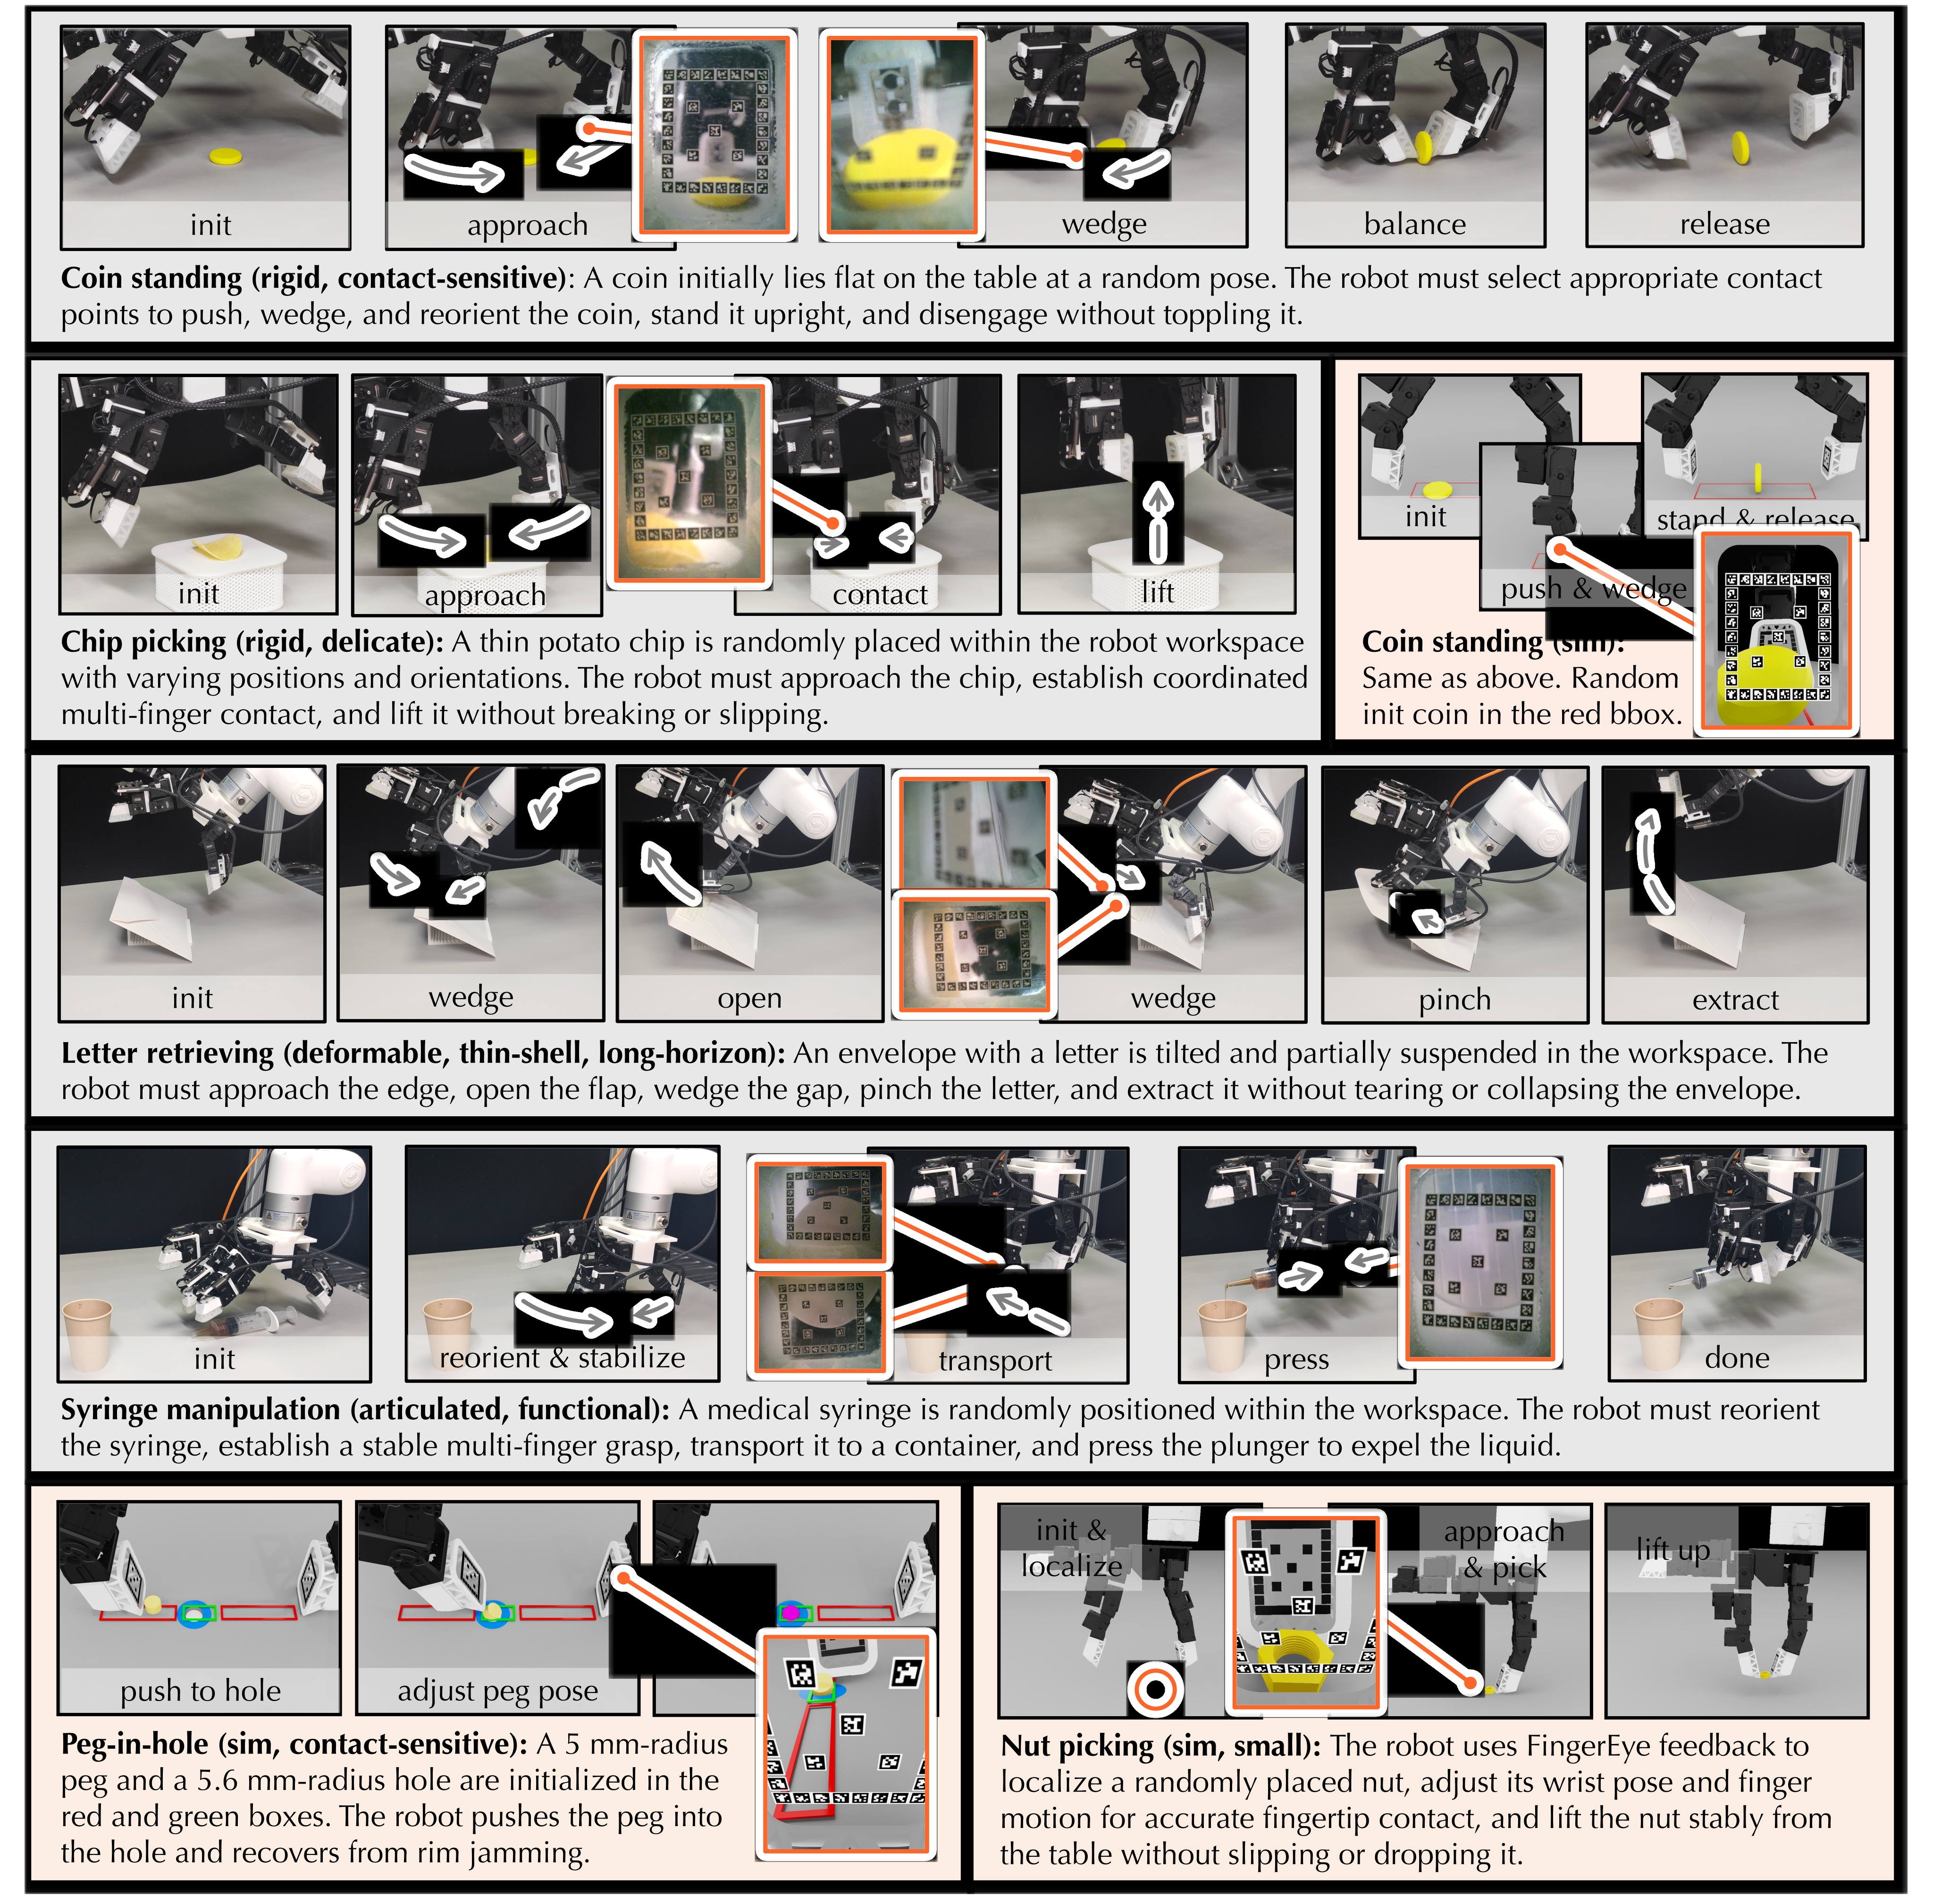
Evaluate three simulated tasks—coin standing, nut picking and peg-in-hole pushing—and four real tasks—coin standing, chip picking, letter retrieval and syringe manipulation. These are seven settings, including coin standing in both domains.
Simulation uses three training seeds and three evaluation seeds with 64 rollouts per evaluation seed. Real evaluation uses twenty trials per method/task. Mean success averages tasks; the real percentages have coarse five-point increments and no reported confidence intervals. Architecture variants are size-matched by adjusting widths when needed.
5.1 Q1–Q2: Sensing Modality Comparison
With the same GroupEnc+GroupDec interface and proprioception, wrist-only W achieves mean success 26.7% in simulation and 37.5% in reality. Tip-camera-only W+M reaches 59.1%/56.3%; binocular W+FE reaches 65.9%/71.3%. Table 1 preserves all task values and simulation variability.
The binocular gain over monocular input is 6.8 and 15.0 percentage points. Selected failures suggest better edge-side and approach coverage, but the comparison does not independently separate stereo depth, field of view, extra tokens and additional visual information. Nut picking remains highly variable with wrist-only input.

5.2 Q3: Continuous Sensing vs. Post-Contact Signals
Simulation W+T uses proximity/contact-depth maps, not physical force measurements or a deformable tactile simulator. Its mean success is 24.1% versus wrist-only 26.7% and W+FE 65.9%. The result concerns this intentionally near-contact-only proxy encoded by the frozen RGB backbone.
Real GelSight reaches 45% on chip picking and 65% on syringe manipulation, versus FingerEye’s 70%/85%, with matched demonstrations and policy architecture. Coin and letter demonstrations were infeasible with the tested GelSight geometry. Sensor shape and sensing modality are therefore confounded; a matched see-through-policy comparison remains absent.
| Modalities | Simulation | Real-world | ||||
| Coin | Nut Pick | Peg-in-Hole | Mean | Chip | Syringe | |
| W | ||||||
| W+T | ||||||
| W+FE | ||||||
5.3 Q4: Policy Interface for Distributed FingerEye Feedback
Table 3 gives mean simulated success 48.5% for FEnc+FDec, 52.0% for NoEnc+FDec, 59.1% for NoEnc+GDec, 59.8% for GEnc+FDec and 65.9% for the full grouped model. The full model wins the mean but not every task: NoEnc+GDec slightly leads nut picking.
Real coin/letter mean success is 65.0% versus 52.5% for NoEnc+FDec. Attention diagnostics are consistent with preserving fingertip access, but are correlational and do not causally prove shortcut removal. Size matching helps control capacity while changing some widths across variants.
6 Limitations and Conclusions
The exposed acrylic remains low-friction despite added gripping material in camera-hidden regions. Long-term and multi-axis durability are untested, and manual camera/tag design leaves coverage and occlusion trade-offs.
Evidence is limited to fixed-base, single-arm tasks. Simulation is a calibrated plate proxy rather than a validated nonlinear contact model; policies learn from demonstrations without tested recovery beyond those behaviors. The study supports the combined sensing/interface design on these tasks, not general force regulation or bimanual/mobile robustness.
Acknowledgement
The authors acknowledge assistance with simulation, hardware, discussions and rebuttal experiments. Funding includes Singapore Ministry of Education Academic Research Fund Tier 1 (FY2024), the President’s Graduate Fellowship and RoboScience; the source states that conclusions do not imply sponsor endorsement.
A.1 Additional Sensing Interface Design Details
The hardware appendix specifies optics, compliance, fabrication, marker estimation and the tracking/visual-coverage trade-off.
A.1.1 Hardware Design Details
Two HBVCAM-2307-FPC82 V11 USB cameras measure about 8.6×8.6×5.4 mm each and provide 120° fields of view. The tip works at roughly 10 mm; the root is tilted 21.48° with about 80-mm working distance.
A 1-mm acrylic plate carries thirty-five 2-mm tag25h9 markers with 0.2-mm white borders. A molded silicone ring with triangular internal elements provides directional compliance around the plate. Printed fixtures and M2×4 screws maintain alignment; cameras connect through USB-C.
The wedge affects physical accessibility to coin/letter edges, not just sensor packaging. It is part of the task advantage and must remain distinct from visual feedback alone.
A.1.2 Fabrication Details and Bill of Materials
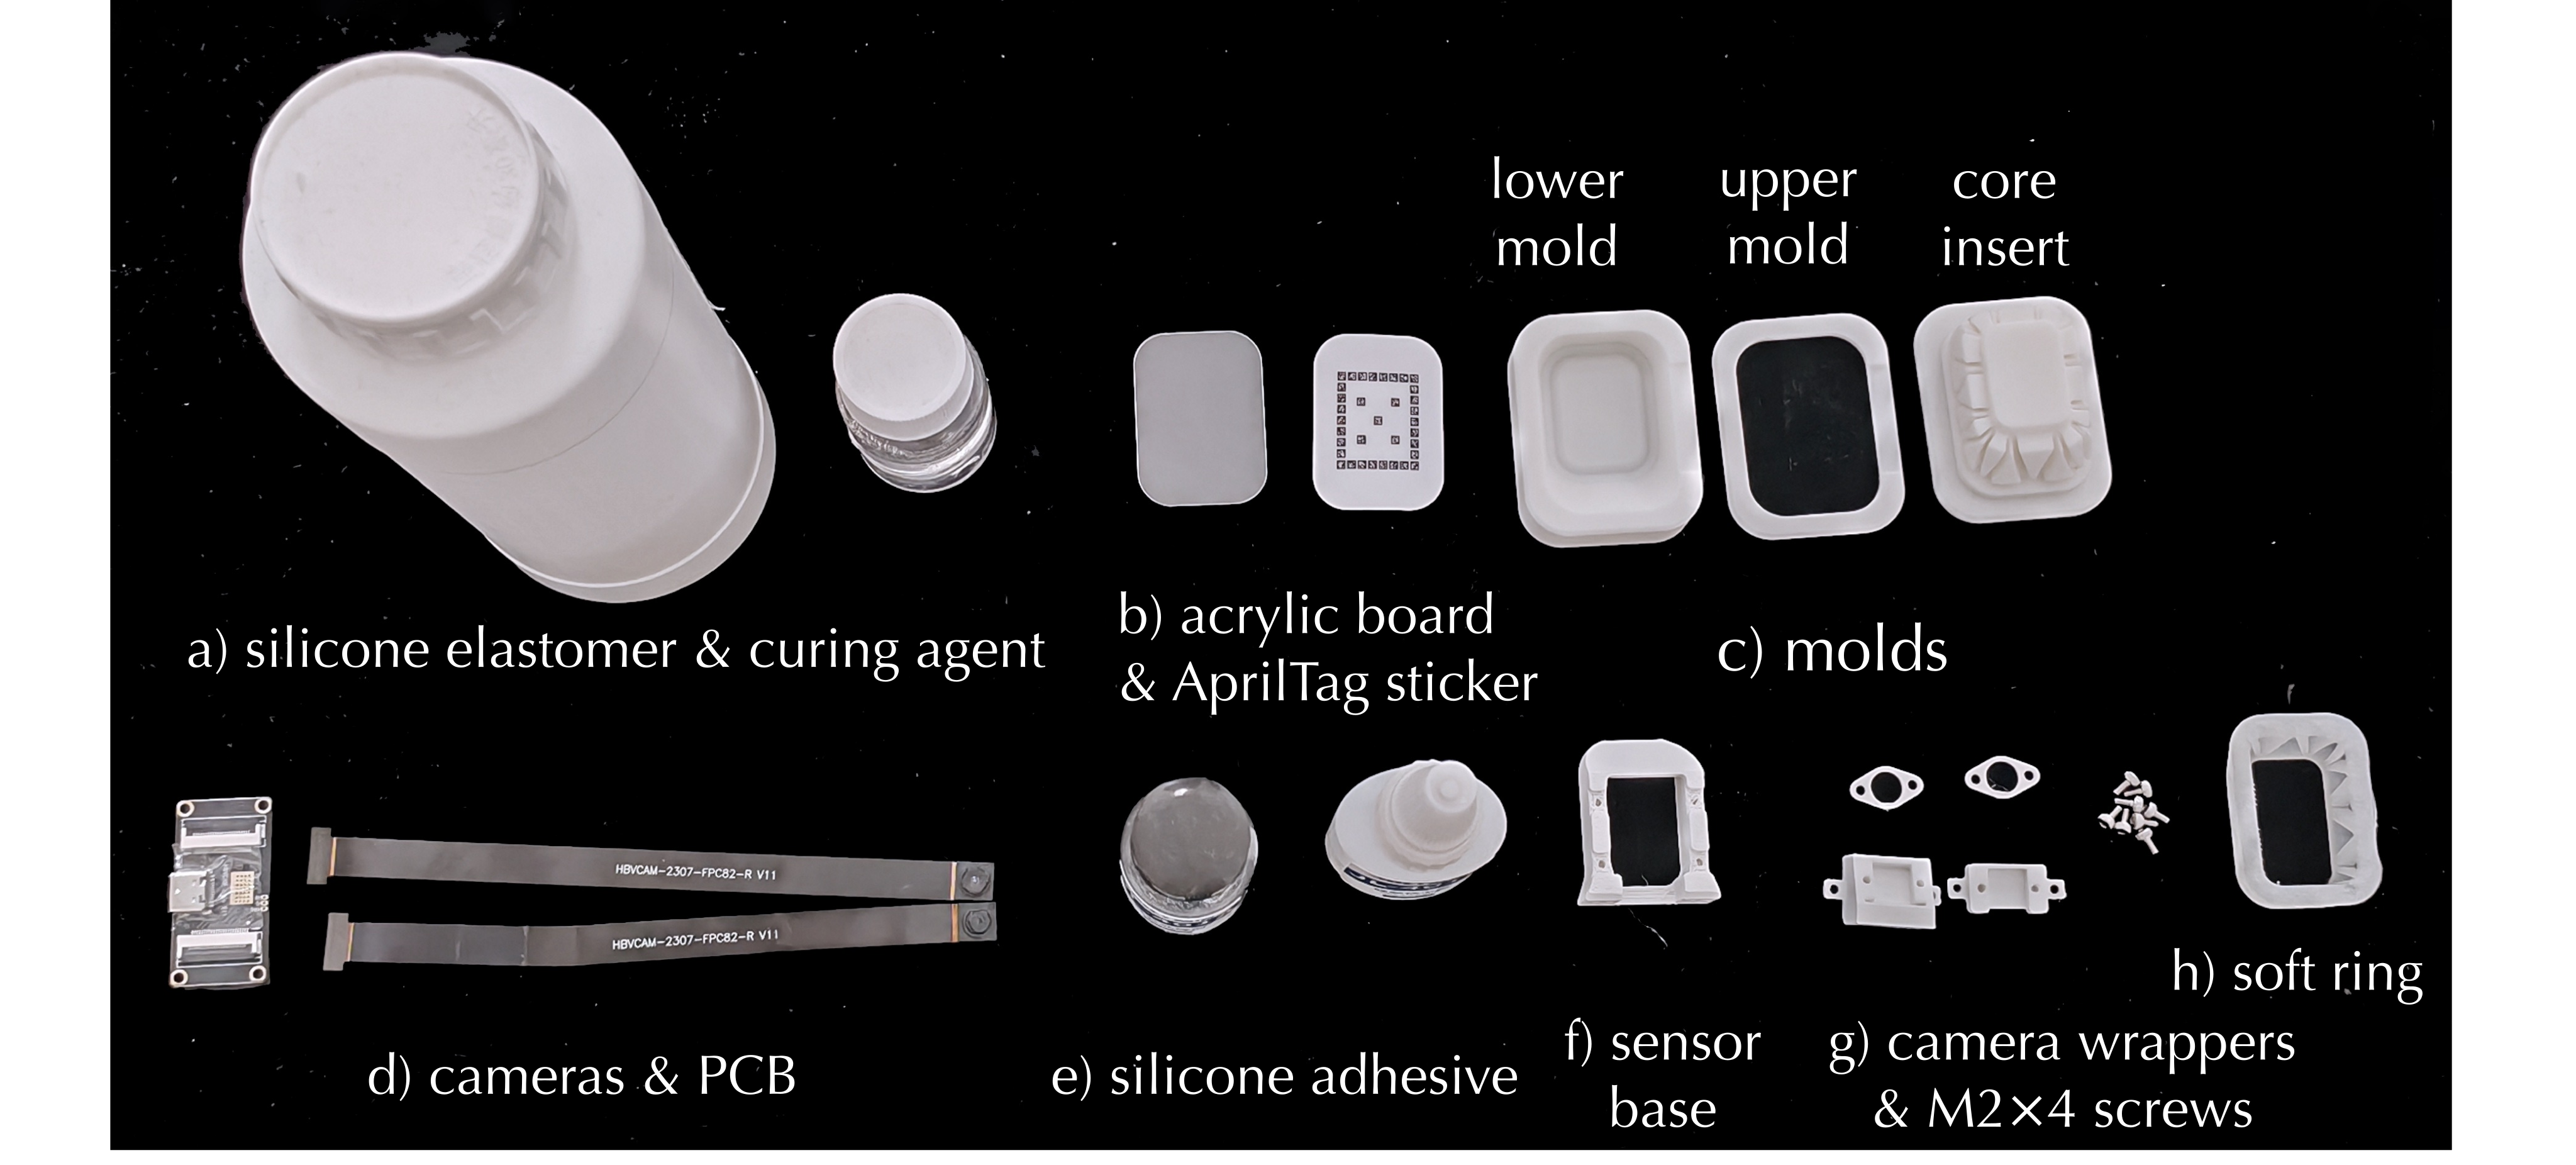
Print base, camera wrappers and mold components. Mix silicone base and curing agent at mass ratio 100:(1–3), mold and cure for more than four hours, then demold. Apply the tag sticker inside the acrylic plate, bond the ring with JL-401 adhesive and let it cure; mount cameras and connect wiring.
Table 4 retains every material cost and the $60.19 total. The two cameras account for $56.49. These are the authors’ reported component costs, not a current vendor quotation or a full robot-system cost.
| Item | Cost (USD) |
| Acrylic plate | 0.28 |
| AprilTag sticker | 0.42 |
| Silicone elastomer & curing agent (20 g) | 0.10 |
| Silicone adhesive (JL-401, 0.5 ml) | 0.17 |
| Soft silicone ring | 0.02 |
| Sensor base (3D-printed) | 0.44 |
| Camera wrappers (3D-printed) | 0.45 |
| Soft-ring mold (3D-printed) | 1.78 |
| M24 screws (8 pcs) | 0.04 |
| Camera modules (2) | 56.49 |
| Total | 60.19 |
A.1.3 Multi-Tag Deformation Estimation
Aggregate every visible tag corner into one 3D-to-2D correspondence set and solve equation 1 with EPnP plus Levenberg–Marquardt refinement. Known tag identities and a shared rigid-plate transform reduce instability from noisy single-tag estimates.
Subtract a no-contact reference pose to form six deformation coordinates. This estimates global plate motion, not a dense contact shape/location map; calibration then maps motion to wrench.
Equations 1
| (1) |
A.1.4 Comparison with GelSight and Keyline Tracking
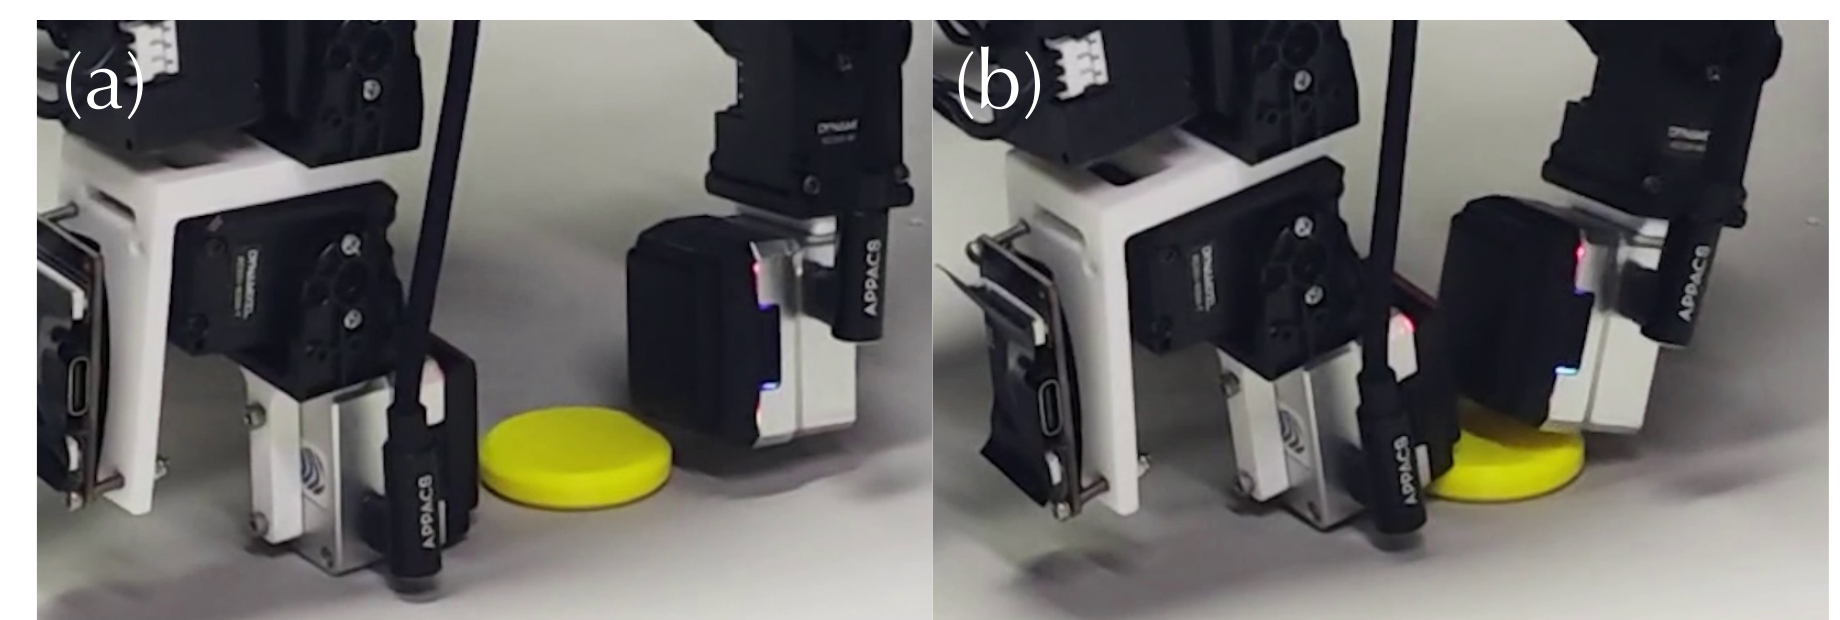
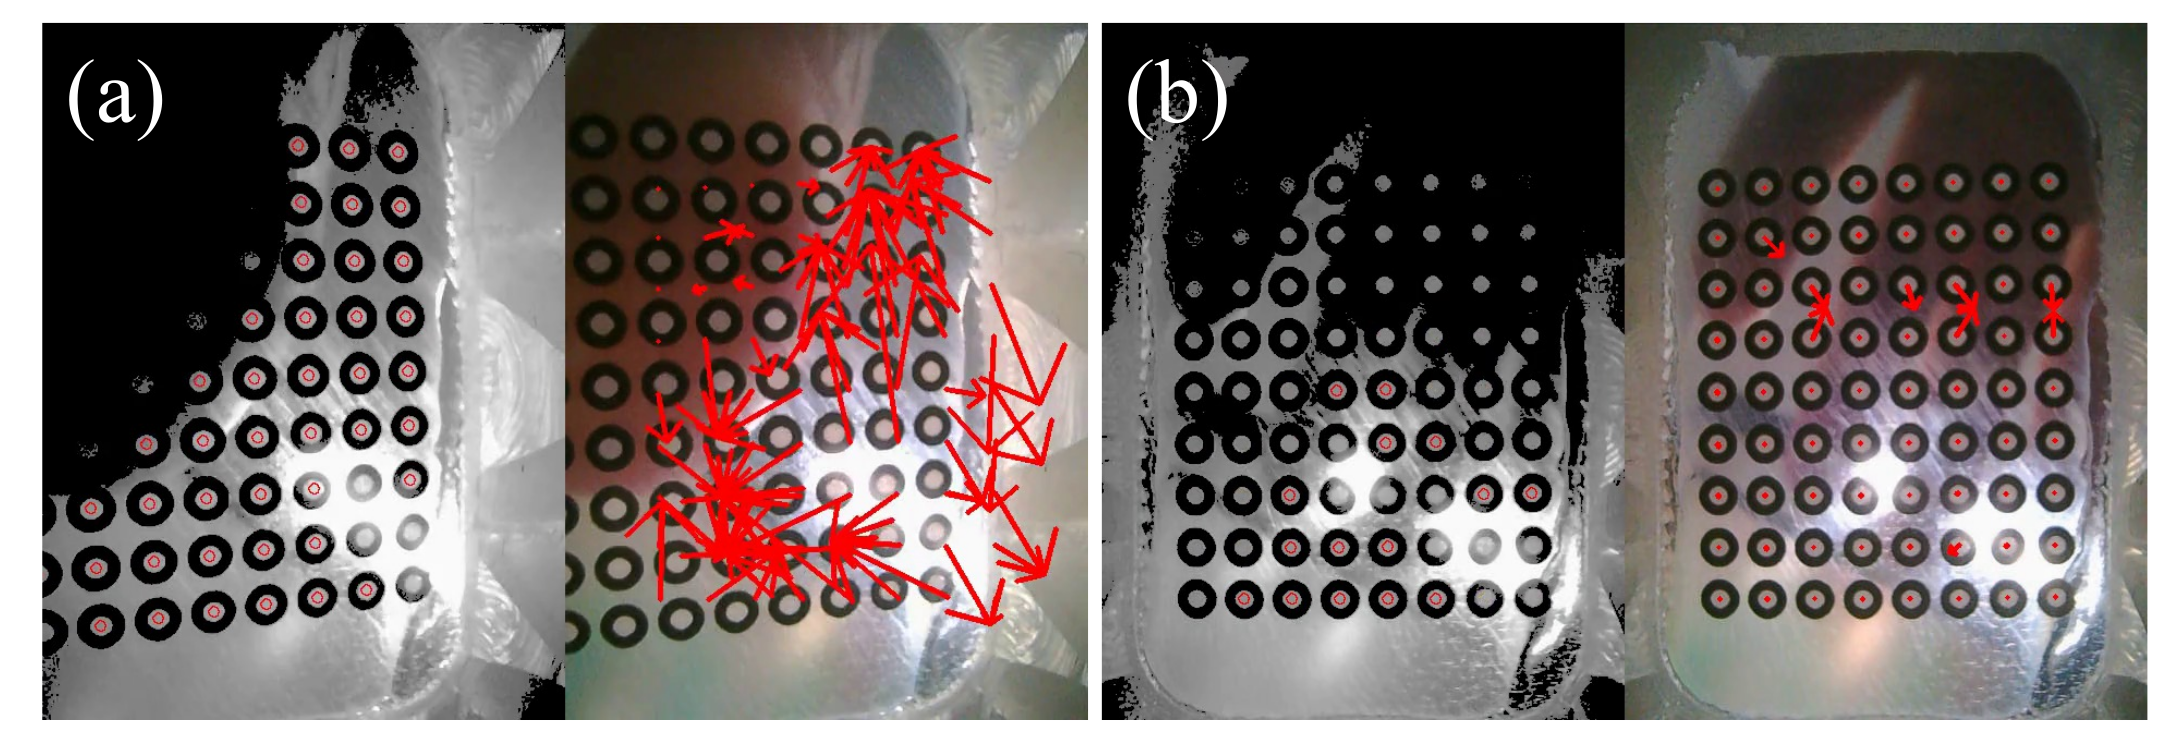
In coin standing, the tested GelSight struggled to sense side/table-edge interaction and its square geometry could not wedge under the coin reliably. Figure 9 preserves that failed configuration.
A keyline pipeline inspired by TacThru uses blob detection, nearest-neighbor association and temporal filtering. Qualitative tests show brittleness under large inter-frame motion and lighting change compared with identified AprilTags. No matched quantitative tracking benchmark is given here.
A.1.5 Design Trade-offs
Binocular hardware adds wiring/calibration complexity but separates near-contact and wider-view optics. Clear acrylic improves RGB continuity while reducing conformity and exposed-surface friction; gripping material is restricted to regions hidden from cameras.
Passive lighting avoids mode-dependent colors, with contrast enhancement for tag detection. Peripheral compliance supports edge and lateral loading. The deliberate output is RGB plus global plate pose, trading explicit contact maps for continuous approach information; neither darkness invariance nor complete contact reconstruction is established.
A.1.6 Tag-Count Ablation
Table 5 compares nested 1/5/20/35-tag layouts. Thirty-five tags reduce static jitter to 0.012 mm/0.109°, with 19.82 detected on average; twenty tags give 0.015 mm/0.120° and 11.86 detected.
Deviation is measured against the simultaneous full-layout estimate, not external pose ground truth. Twenty tags achieve 68.3% simulated mean success versus 65.9% for thirty-five, so better tracking redundancy does not monotonically improve the policy: tags also occupy visual area.
| Tags | Jitter (mm/∘) | Mean detected tags | Deviation (mm/∘) |
| 1 | 0.426 / 6.969 | 0.85 | 0.363 / 6.823 |
| 5 | 0.207 / 1.473 | 3.65 | 0.237 / 2.203 |
| 20 | 0.015 / 0.120 | 11.86 | 0.068 / 0.326 |
| 35 | 0.012 / 0.109 | 19.82 | Reference |
A.2 Sensing Interface Capability and Experiment Details
Calibration, analytical sensitivity, delicate-grasp control and compression cycling test different properties. Their results should not be collapsed into one general accuracy or durability guarantee.
A.2.1 Wrench–Deformation Calibration Setup
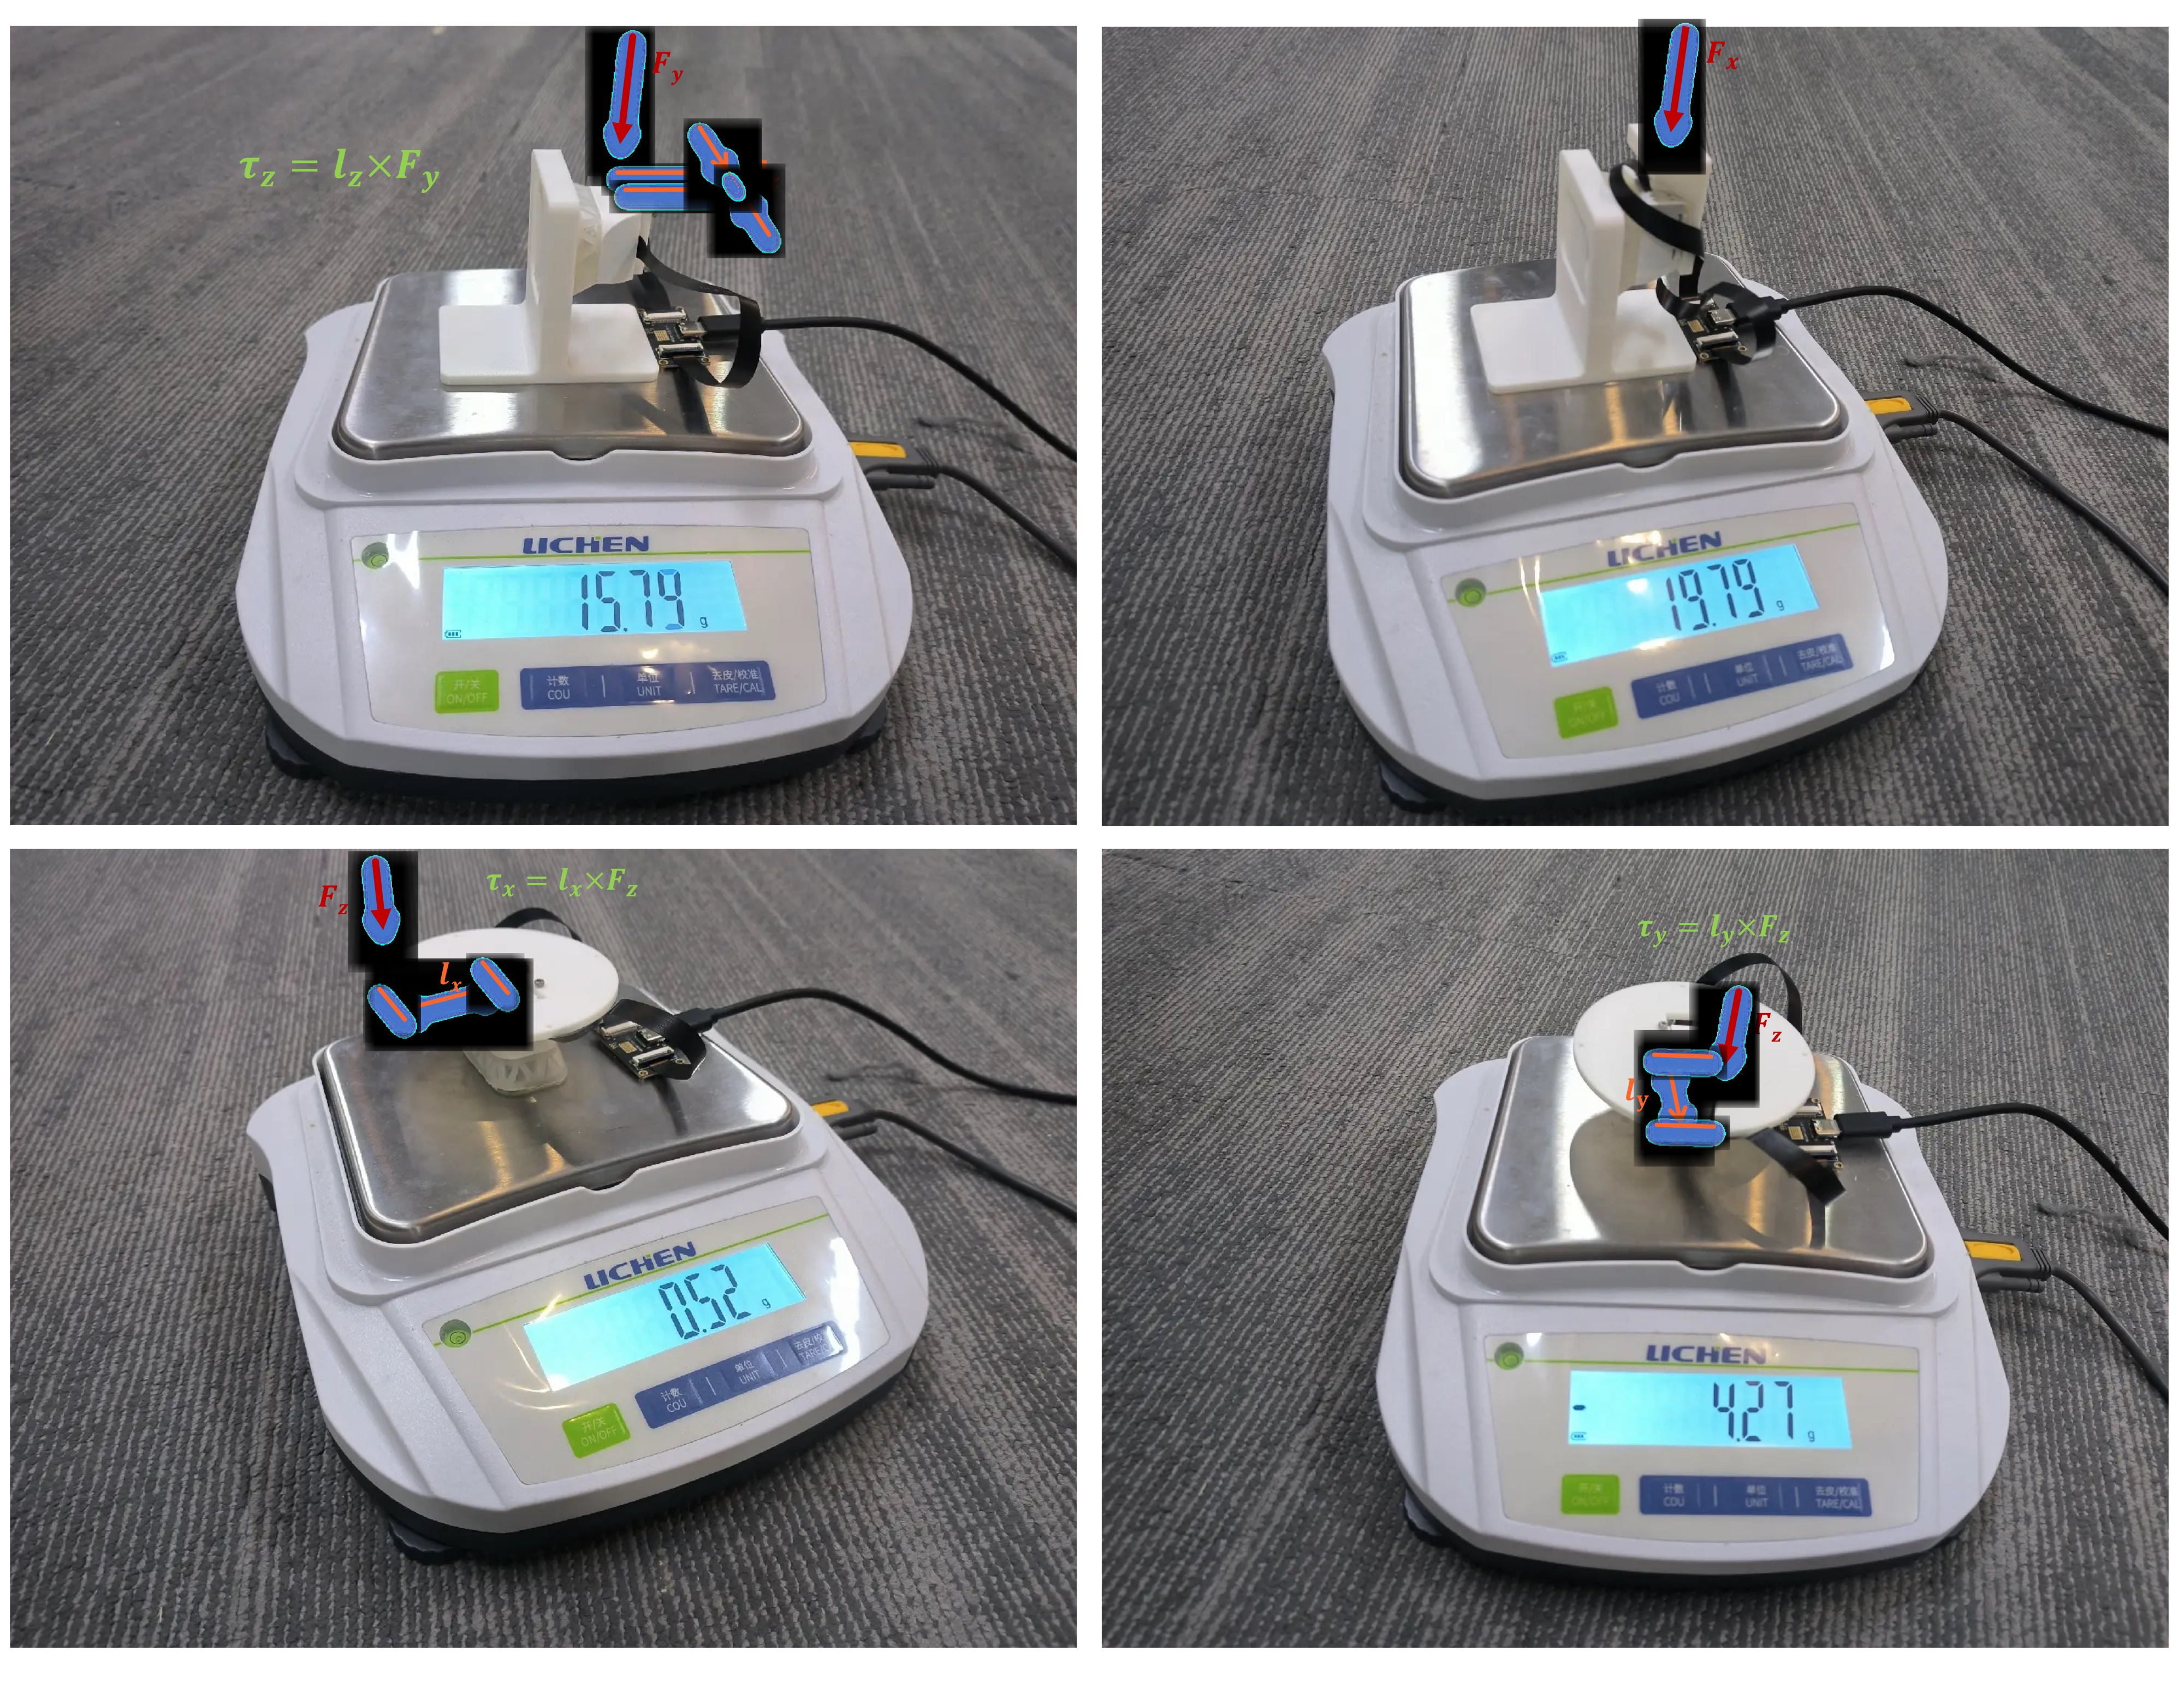
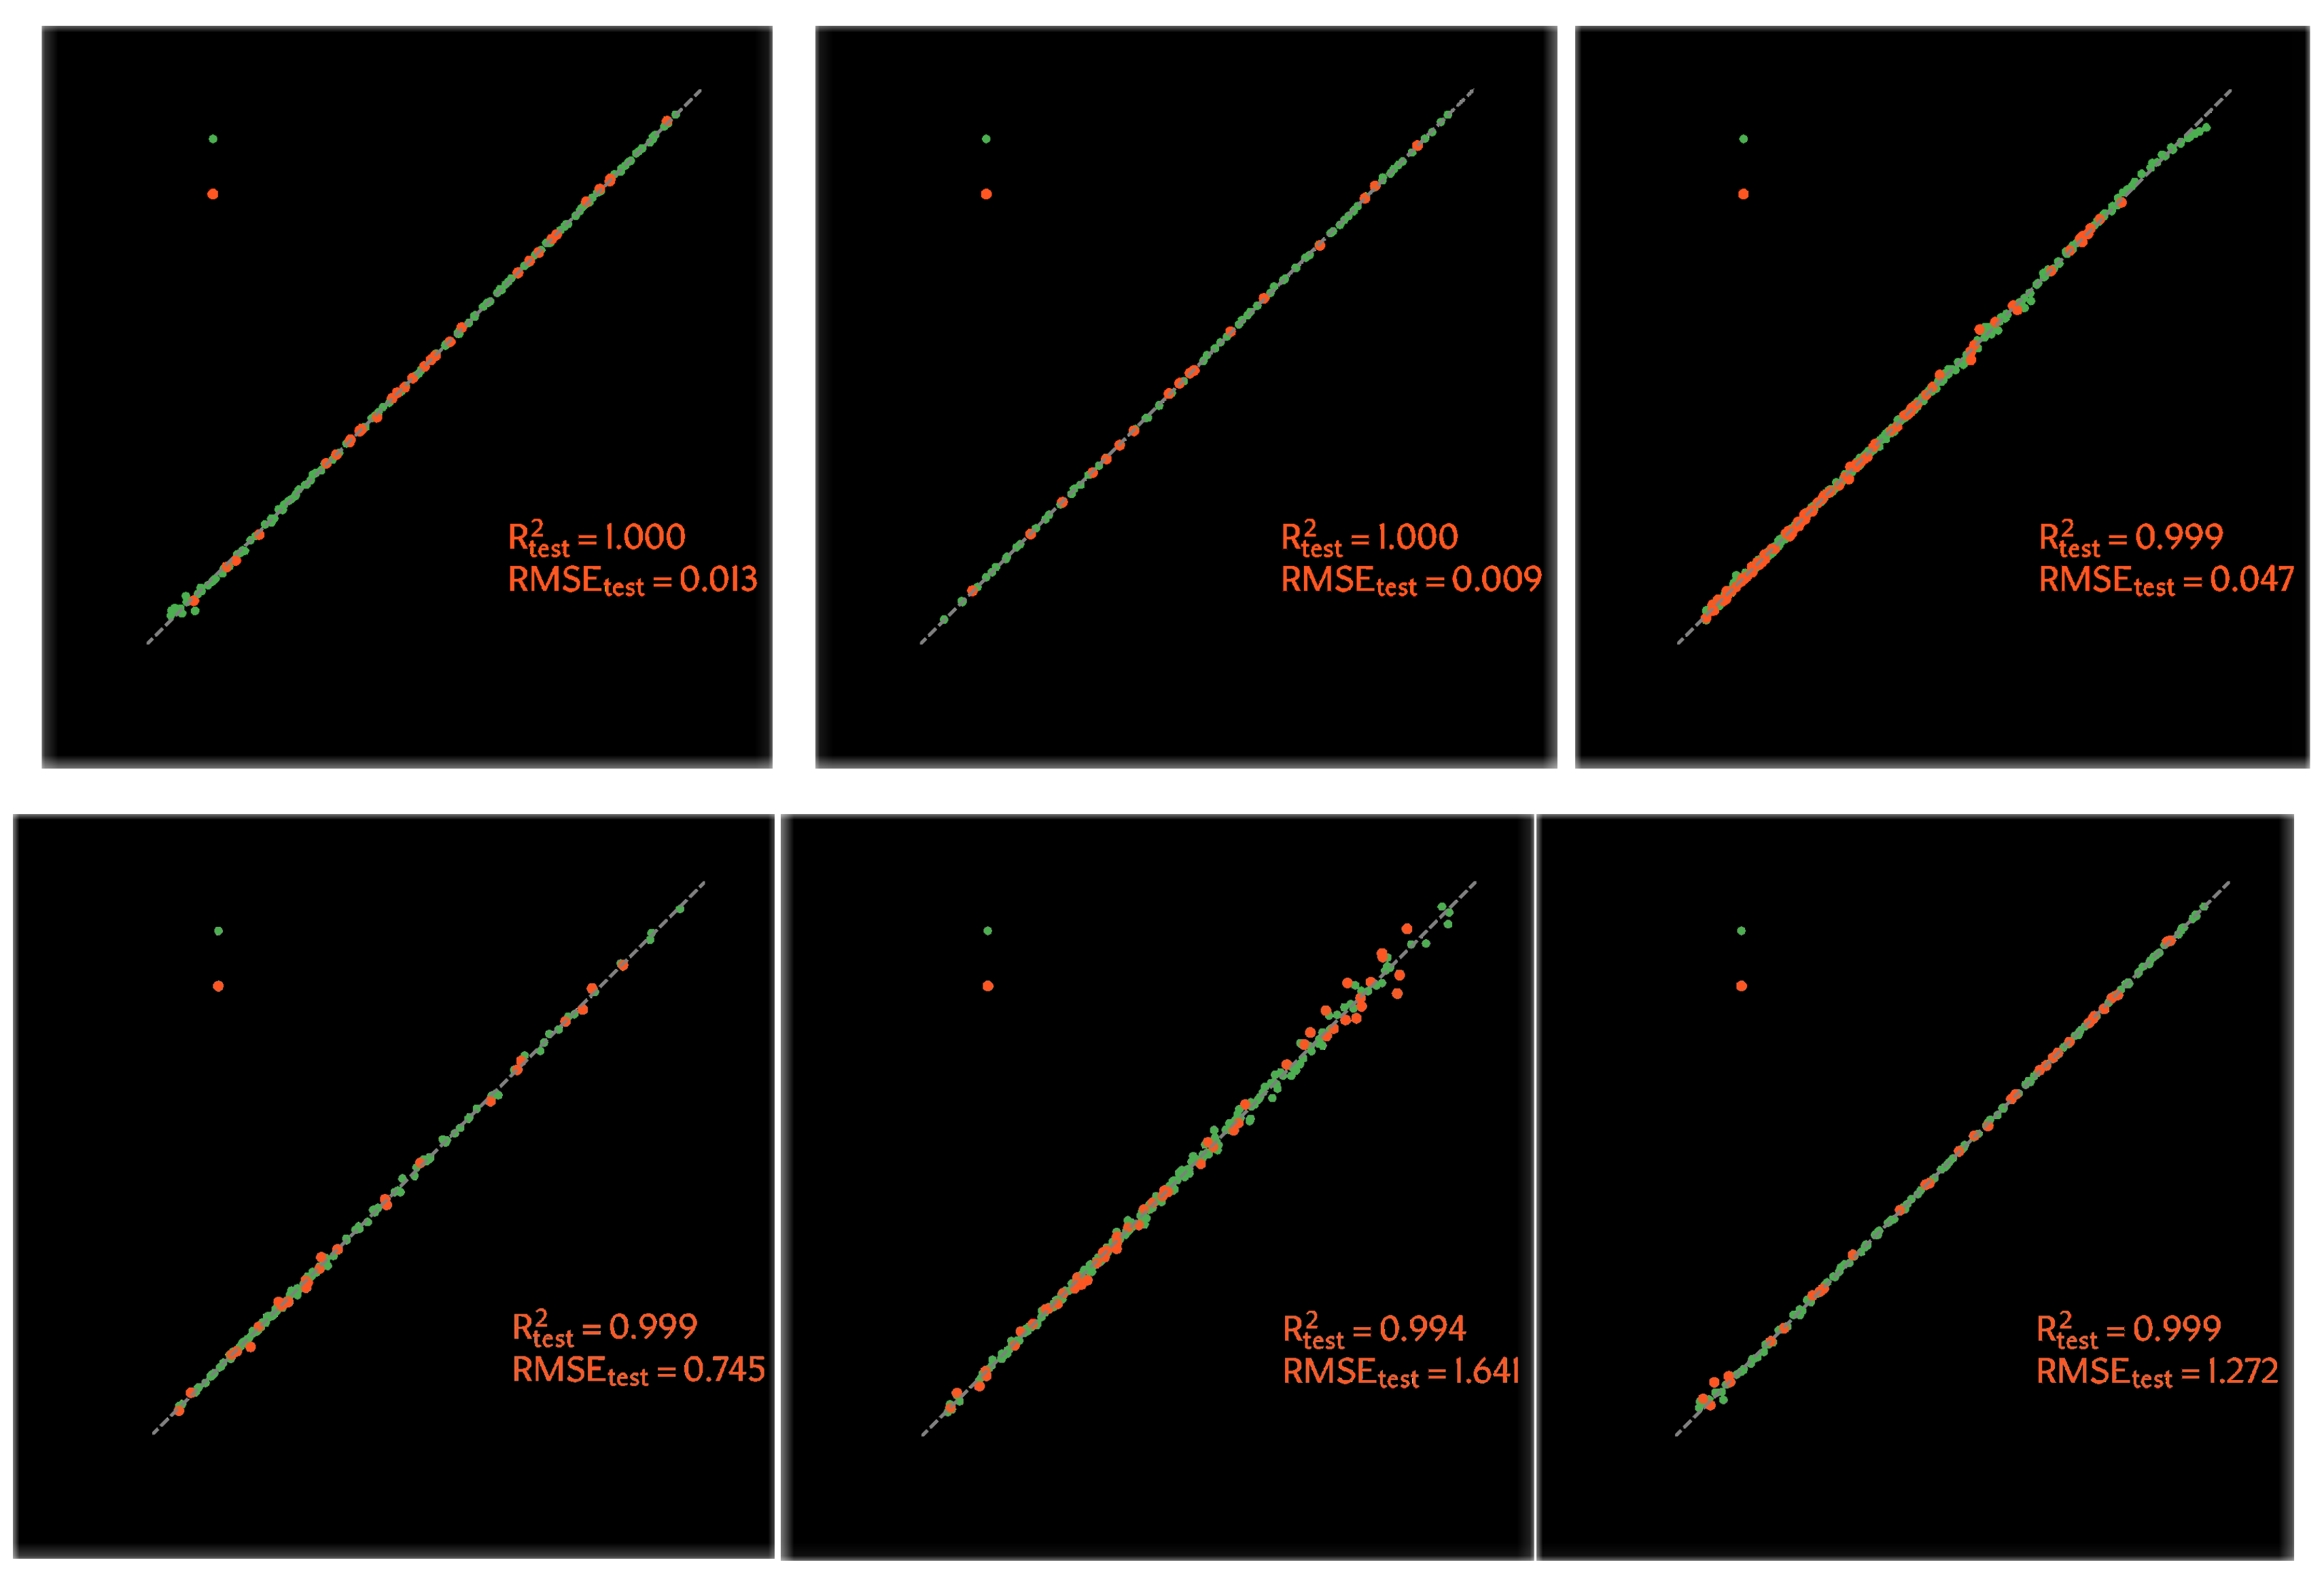
Apply one force/torque axis at a time using a digital scale and fixtures; derive torque from measured force and a known lever arm. Collect over 1,000 synchronized pose–wrench samples and split each axis 80:20 for fitting/testing.
Force held-out R² is at least 0.999, with RMSE 0.013/0.009/0.047 N for x/y/z. Torque R² is 0.999/0.994/0.999. This supports the calibrated proxy under axis-wise loading; it does not validate arbitrary combined loads, hysteresis compensation or unseen operating conditions.
Equations
Equation
A.2.2 Sensitivity Analysis Details
Assume tag localization accuracy of 0.25 pixel. For a 2-mm tag spanning 37 pixels, equation 2 gives translation sensitivity 0.0135 mm. Equation 3 uses θ=π/12 and image radius 18.5 pixels to obtain 0.0136 rad rotational sensitivity.
Propagate the six-component pose threshold through the calibrated linear mapping to obtain equation 5’s force/torque estimates. These assumption-based sensitivities are different from empirical prediction RMSE, and do not establish an observed false-alarm-controlled detection limit.
Equations 2–5
| (2) |
| (3) |
| (4) |
| (5) |
A.2.3 Delicate Grasping Setup and Hyperparameters
Following the contact-sensitive motivation of SpikeATac, interpolate predefined joint trajectories at 0.02-s intervals. Stop approach when normal plate displacement crosses a threshold selected once per object, then lift. Most objects use a custom support to avoid table scraping.
Table 6 retains all nine thresholds and trajectory lengths, including 0.01 mm for seaweed and 0.02 mm for 0.7-mm pencil lead. This 50-Hz scripted controller is separate from the 10-Hz learned policy. Object-specific thresholds and supports limit claims of autonomous general contact detection.
| Object | Contact threshold (mm) | Total frames |
| 0.7 mm pencil lead | 0.02 | 15 |
| Chip | 0.10 | 30 |
| Dessert cup | 0.05 | 10 |
| Seaweed | 0.01 | 150 |
| Grape | 0.06 | 10 |
| Cone | 0.10 | 20 |
| Eggshell | 0.05 | 20 |
| Wafer | 0.05 | 5 |
| Balloon | 0.05 | 3 |
A.2.4 Normal-Compression Durability
After 10,000 cycles of 3-mm normal compression at 1 Hz, no cracking/delamination is observed. Maximum displacement hysteresis increases 0.39→0.46 mm, about 13→15% of the tested range; before/after responses differ by 0.13 mm RMS.
In twenty trials each, coin success is unchanged and chip picking loses one success. This is useful normal-compression evidence, with no long-term multi-axis or statistical equivalence conclusion.
A.3 Learning Interface Details
The architecture appendix makes the current implementation explicit: cached global visual summaries, one-step observation context, grouped transformer processing and clean learned action queries.
A.3.1 Policy Architecture Details
Use one observation step. Resize RGB to 192×256; frozen RADIO returns one 2,304-dimensional summary per camera. A camera-specific two-layer GELU MLP maps it to 512 dimensions and adds camera identity. Vector groups use separate MLP projections. No dense image-token grid is retained by this interface.
All FingerEye camera tokens form one group. GroupEnc applies self-attention only in groups with at least two tokens; singleton wrist/proprioception groups pass through unchanged. Defaults are four encoder/decoder layers, sixteen heads, width 512 and feed-forward width 2,048, with adjusted widths for size-matched ablations.
Initialize sixteen clean learnable action queries. Each decoder layer applies query self-attention, either flat cross-attention or the mean of separate group residuals, then a feed-forward residual. An MLP maps decoded queries to task-specific joint/arm commands. Equations 6–17 retain every tensor definition and update.
Main learned policies omit explicit plate pose/wrench. Optional plate histories are ordinary tokens when used, not query modulation. This architecture predicts chunks directly; the description does not specify a diffusion-noise process or a separate explicit-force controller.
Equations 6–17
| (6) |
| (7) |
| (8) |
| (9) |
| (10) |
| (11) |
| (12) |
| (13) |
| (14) |
| (15) |
| (16) |
| (17) |
A.4 Decoder Attention Diagnostics
Table 7 measures flat-decoder attention for training seed 42 across three evaluation seeds, alongside success statistics from the main multi-training-seed comparison. The single proprioception token receives 35.6–59.0% attention versus a token-uniform reference of 16.7% among six tokens.
For each of three tasks, the stronger flat variant also has more total FingerEye attention. Wrist mass stays 7.8–12.9%. This is consistent with competition at the decoder, but attention is not a causal importance measure; encoded tokens can already contain cross-modal information and group sizes differ.
| Task | Policy | SR | FE mass | Wrist mass | Prop. mass | Prop. win rate |
| Coin | NoEnc+FDec | |||||
| Coin | FEnc+FDec | |||||
| Nut Pick | NoEnc+FDec | |||||
| Nut Pick | FEnc+FDec | |||||
| Peg-in-Hole | NoEnc+FDec | |||||
| Peg-in-Hole | FEnc+FDec |
A.5 Experiment Details
The final appendix preserves shared optimizer settings, task-specific demonstrations/horizons and the precise tactile/wrench baselines.
A.5.1 Default Policy-Training Settings
Table 8 retains AdamW learning rate 10⁻⁴, β=(0.95,0.999), ε=10⁻⁸ and weight decay 10⁻⁶. Use cosine scheduling, 500 warmup steps, batch 256, zero dropout and EMA with maximum decay 0.9999; evaluate the final checkpoint. Epoch counts and action horizons vary by task.
| Category | Default setting |
| Temporal context | observation step; task-specific in Table 9. |
| Policy backbone | encoder layers, decoder layers, hidden dimension , attention heads, feed-forward dimension , GELU activation, dropout . |
| Modality fusion | Group encoding and group decoding enabled by default, corresponding to GEnc+GDec. |
| Optimizer | AdamW with learning rate , , , and weight decay . |
| Schedule and batch | Cosine learning-rate schedule, warmup steps, batch size . |
| EMA and evaluation | Exponential moving average enabled with maximum decay ; evaluation uses the final checkpoint. |
A.5.2 Task-Specific Training Settings
Simulation uses 50 coin, 50 nut and 200 peg demonstrations; real tasks use 60 coin, 30 chip, 60 letter and forty syringe demonstrations. Train 500 epochs except simulated peg at 300. All methods within a task share data and splits.
Simulated train/test initial states come from the same randomized ranges. Real tests interpolate/extrapolate within listed configurations: coin diameters 20/40 mm after 10/30/50-mm training, 45° letters after 30°/60°, and 20-mL syringes after 10/30 mL. Chip tests include full and irregular pieces. These are limited configuration generalization tests, not arbitrary unseen object categories.
Four FE cameras mean two binocular fingertip modules, not four modules. Syringe uses six cameras/three modules. Table 9 retains every action dimension, horizon, object condition and camera count; simulated coin/peg execute full sixteen-action chunks.
| Setting | Task | Cams in use | Demos | Epochs | Action space | Train config. | Test config. | |
| Simulation | Coin standing | 4FE+1W | 50 | 500 | Abs. hand joints (8) | Randomized coin pose | Same randomized range | |
| Simulation | Nut picking | 4FE+1W | 50 | 500 | Abs. wrist position (3) + abs. hand joints (8) | Randomized nut/support + wrist init | Same randomized range | |
| Simulation | Peg-in-Hole pushing | 4FE+1W | 200 | 300 | Abs. hand joints (8) | Randomized peg/hole offsets | Same randomized range | |
| Real-world | Coin standing | 4FE+1W | 60 | 500 | Abs. hand joints (8) | Rand. pose; coin mm | Rand. pose; coin mm | |
| Real-world | Chip picking | 4FE+1W | 30 | 500 | Abs. hand joints (8) + rel. (1) | Rand. pose; chip full/half/quarter | Rand. pose; chip full/irregular | |
| Real-world | Letter retrieving | 4FE+1W | 60 | 500 | Abs. hand joints (8) + arm joints (7) | Rand. pose; letter | Rand. pose; letter | |
| Real-world | Syringe manipulation | 6FE+1W | 40 | 500 | Abs. hand joints (12) + binary arm go-to pose command (1) | Rand. pose; syringe 10/30 mL | Rand. pose; syringe 20 mL |
Note. Here, denotes four FingerEye camera views, i.e., two FingerEye modules with two cameras each; denotes three FingerEye modules with two cameras each. denotes one wrist RGB camera.
A.5.3 Post-Contact Tactile Map Baseline
Rasterize thumb/index contact planes into 64×96 grids. Equation 18 returns max(0,1 mm−distance to nearby collision geometry), so signals begin only within 1 mm. Encode each map with the same frozen RADIO backbone used for RGB.
This simulated baseline represents local proximity geometry rather than forces, silicone deformation or a validated tactile image distribution. Its poor performance cannot by itself show that all post-contact tactile policies are ineffective.
Equation 18
| (18) |
A.5.4 Explicit Wrench-Input Ablation
Adding six-dimensional simulated wrench input to wrist vision gives 32.8/43.9/23.8% success across coin/nut/peg, averaging 33.5% versus 26.7% without it. Adding wrench to W+FE raises its mean 65.9→67.1%.
The small incremental gain is consistent with redundancy on these tasks, but does not prove explicit force input is unnecessary for other force-regulation tasks. Per-seed variability for this auxiliary ablation is not reported.