Overview
This edition covers all thirty-nine pages of arXiv v2 dated 12 September 2026, including the sixteen supplementary sections. Jack W. O’Sullivan and Mohammad Asadi contributed equally. The thirteen authors are affiliated with Stanford, UCSF and the joint UCSF–UC Berkeley program.
All fifteen figures and seven tables embedded in the paper are retained. Two separately named CSV supplements are described but are not embedded in the PDF/HTML; their complete rows were not available in the reviewed source.
At a glance
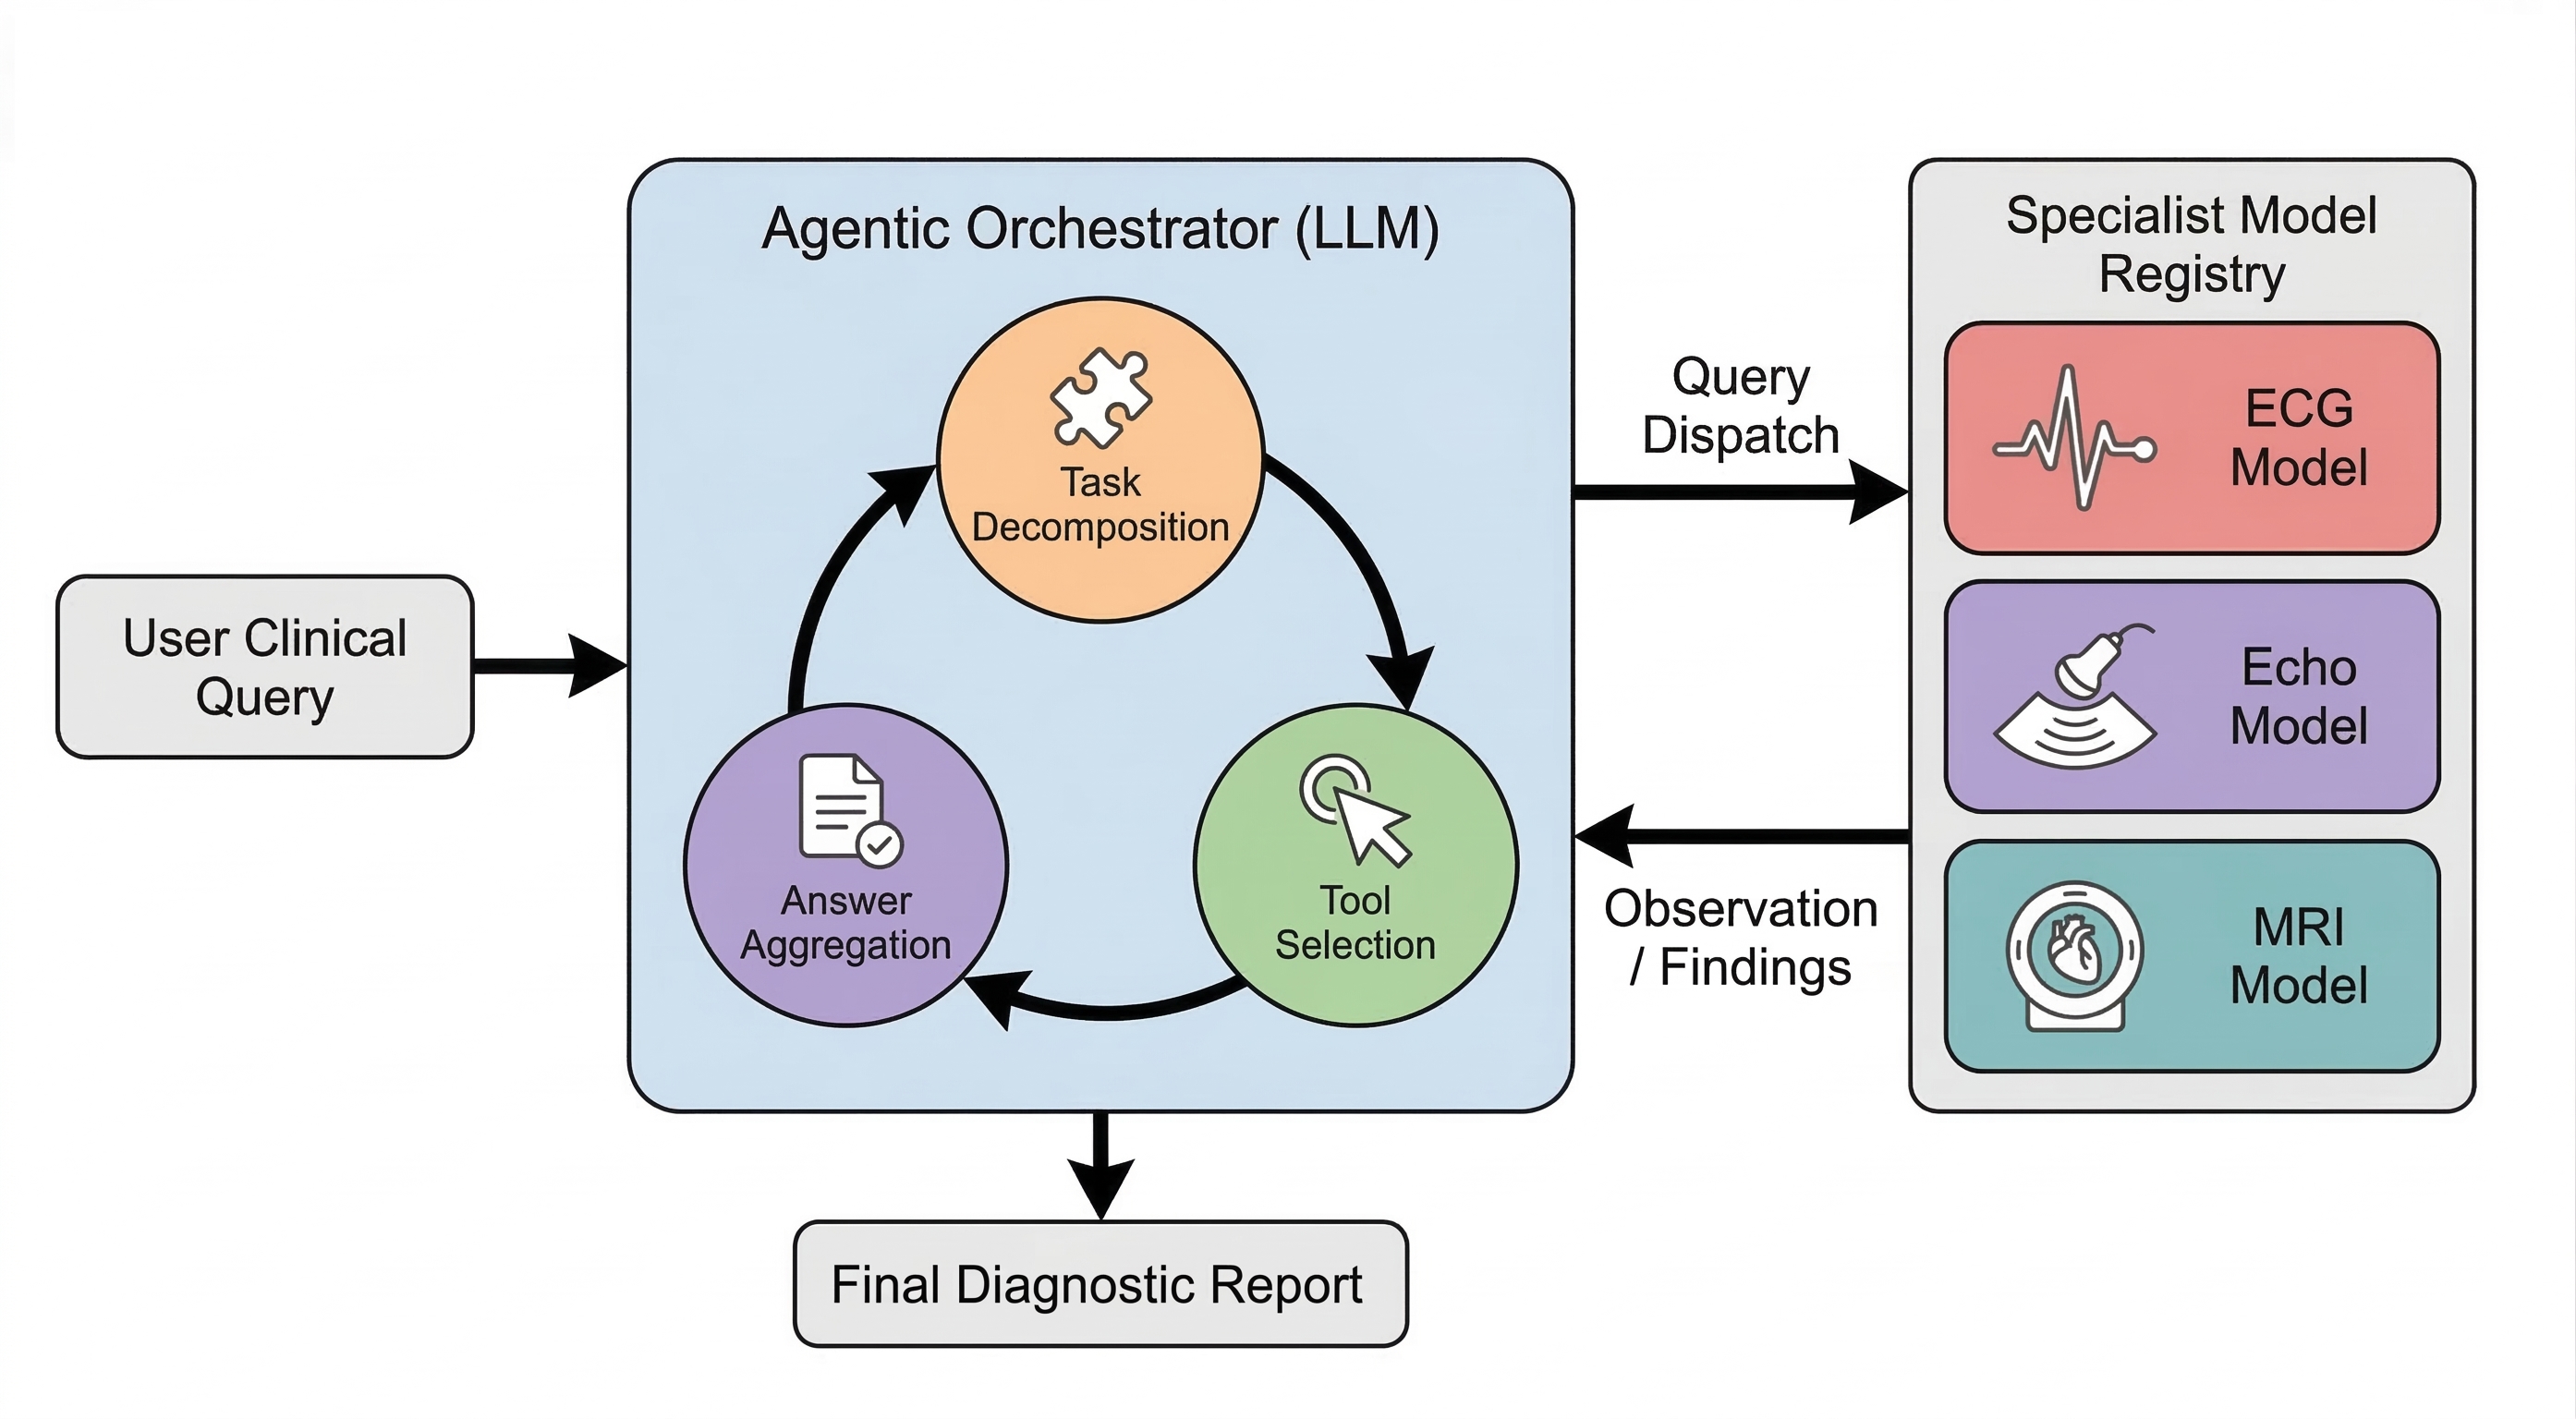
MARCUS combines three modality-specific cardiac vision-language models with a text-based orchestrator. Experts interpret ECG, echocardiography and CMR; the orchestrator decomposes questions, queries experts and combines their answers with a counterfactual consistency check.
Training uses about 13.7 million image/signal instances from roughly 270,000 studies and 1.62 million report-derived questions. Retrospective benchmarks favor MARCUS over the tested general models and specialist-output pipelines, but public-set accuracy and free-text reliability vary substantially. The study does not measure prospective clinical outcomes.
1 Main
Cardiac interpretation combines electrical signals, ultrasound motion and MRI findings. EchoNext, EchoPrime and ViTa address narrower tasks. MARCUS adds generative question answering and natural-language communication among experts.
The training corpus contains 249,785 ECGs, 1,266,144 echo frames from 10,823 studies, and 12,191,751 CMR frames from 9,473 studies. Frames and questions are correlated samples, not independent patients. The paper rounds this corpus to 13.5 million images; its printed component counts total about 13.71 million.
Use 741,000 supervised Q&A pairs, then 879,000 MCQs for GRPO. Questions are generated by an LLM from physician reports using cardiologist-designed templates; “expert-curated” does not mean every free-text answer was independently authored from raw images by a clinician.
1.1 Expert single modality model accuracy exceeds frontier models
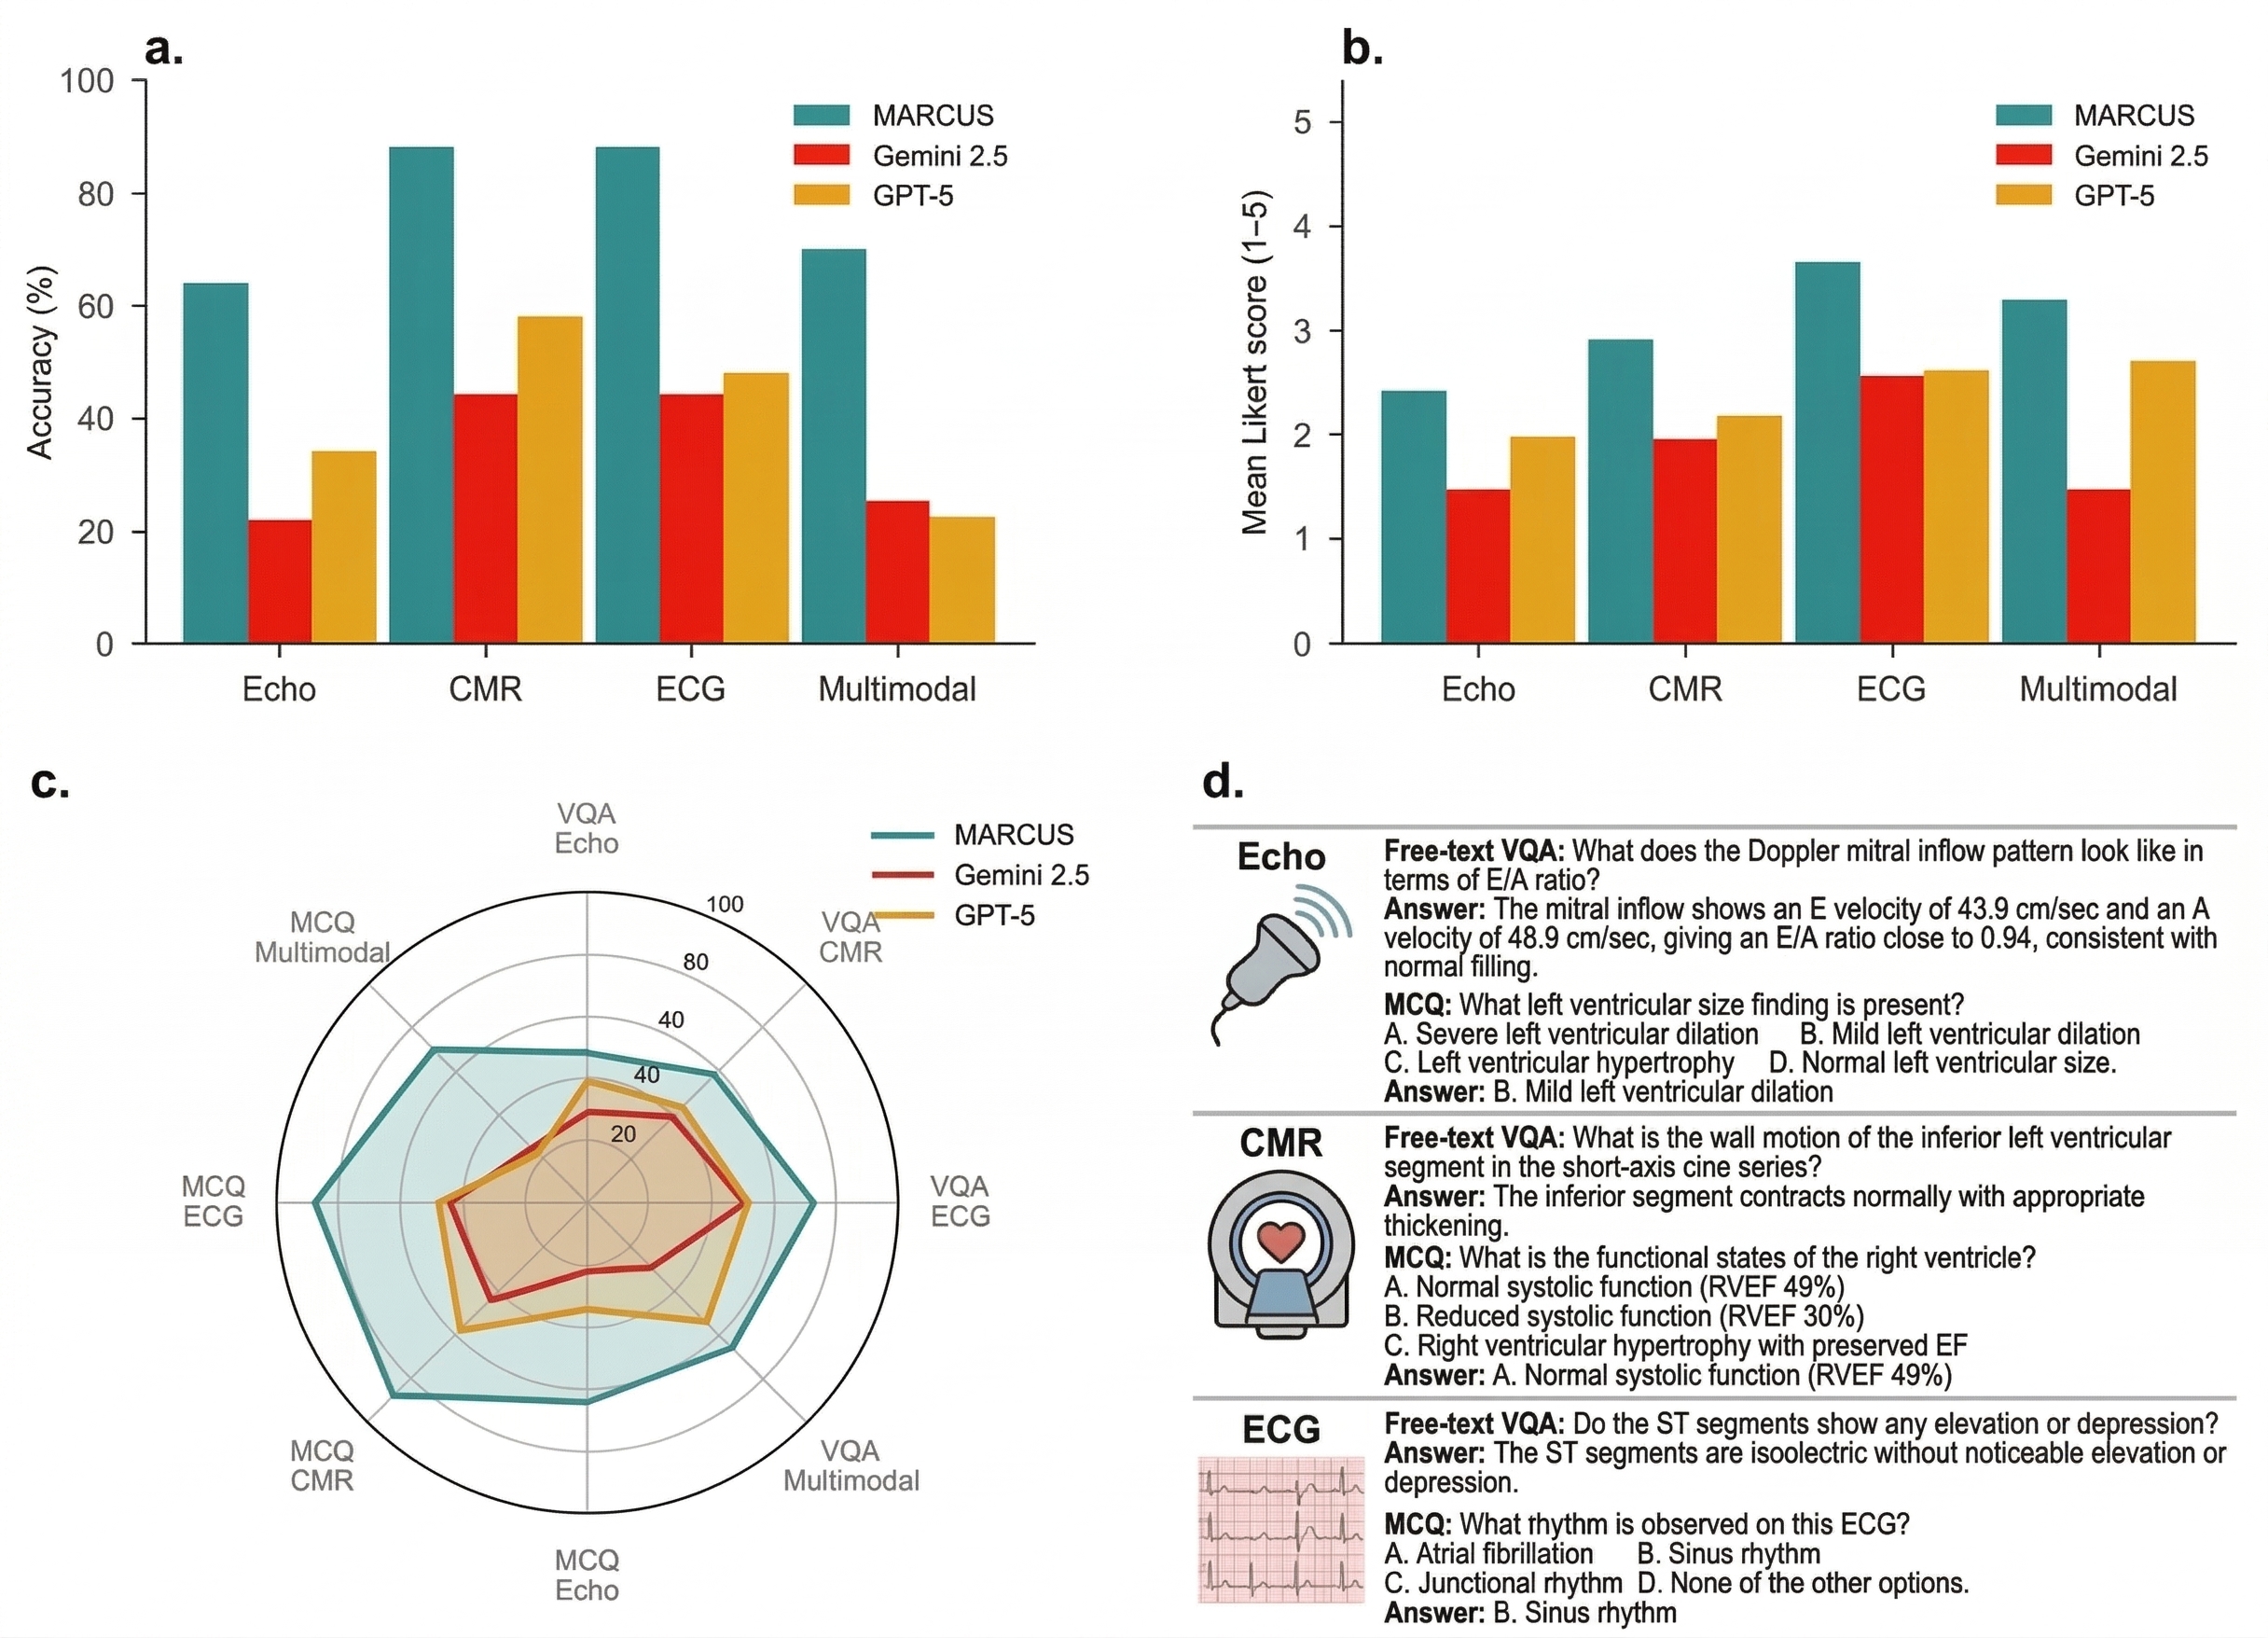
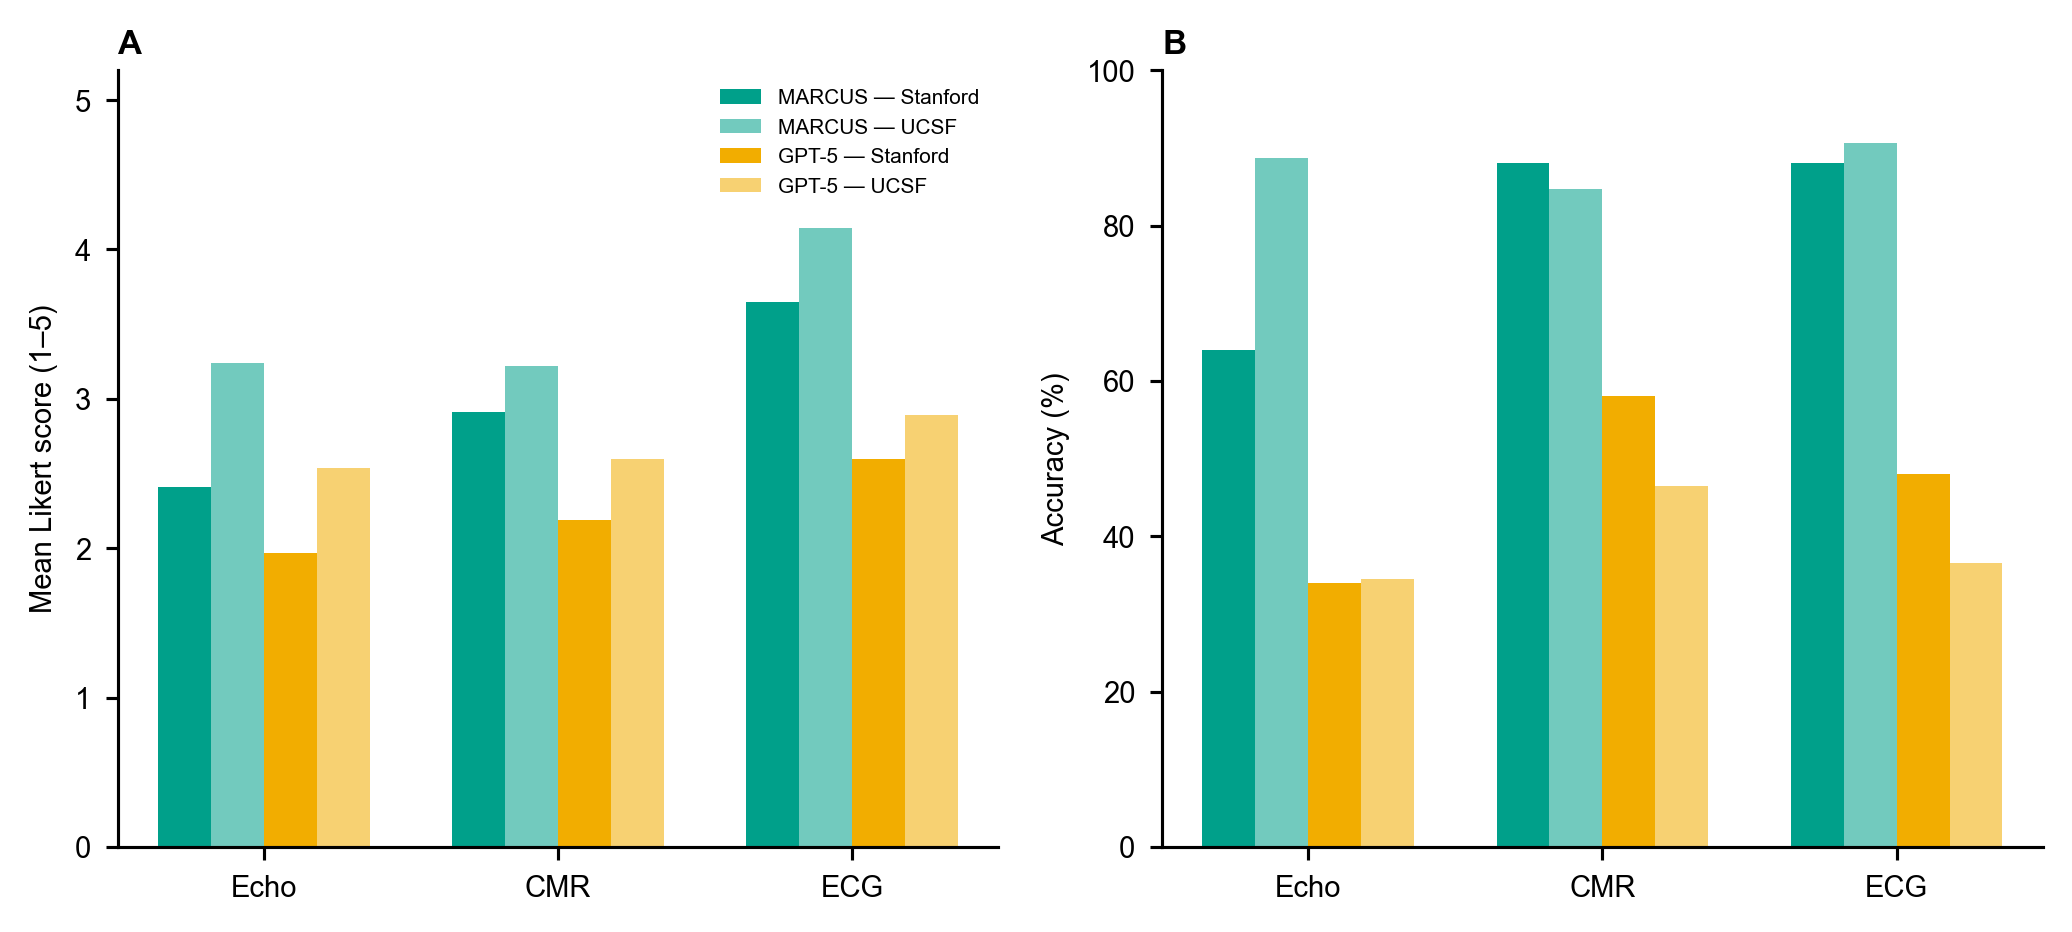
The main text reports Stanford/UCSF MCQ accuracy of 87%/91% for ECG, 67.4%/86% for echo and 88%/85% for CMR. General-model comparators are GPT-5 Thinking and Gemini 2.5 Pro Deep Think; Gemini was not tested at UCSF because the authors lacked an approved secure server.
Supplementary Table 6 gives different retained-set Stanford values: ECG 88%, echo 64% and CMR 88%, with model-specific denominators. These results should not be merged into one interchangeable accuracy estimate. Some figure-panel references in the prose also differ from the captions.
1.2 Agentic orchestration enables synthesis of multimodal data
The main multimodal result is 70% versus 22.5% for GPT-5 and 27.5% for Gemini. The orchestrator can request targeted observations from each expert, then reconcile their textual findings.
Although the main description emphasizes three-modality integration, the supplementary benchmark specifies forty paired echo–CMR questions. Table 6 reports 28/38 correct for retained MARCUS responses, or 73.7%. The experiment supports this evaluated synthesis task; architecture, extra domain data and verification are not independently ablated as causes of the gain.
1.3 MARCUS generates higher-quality, interactive clinical responses across single-modality and multimodal data
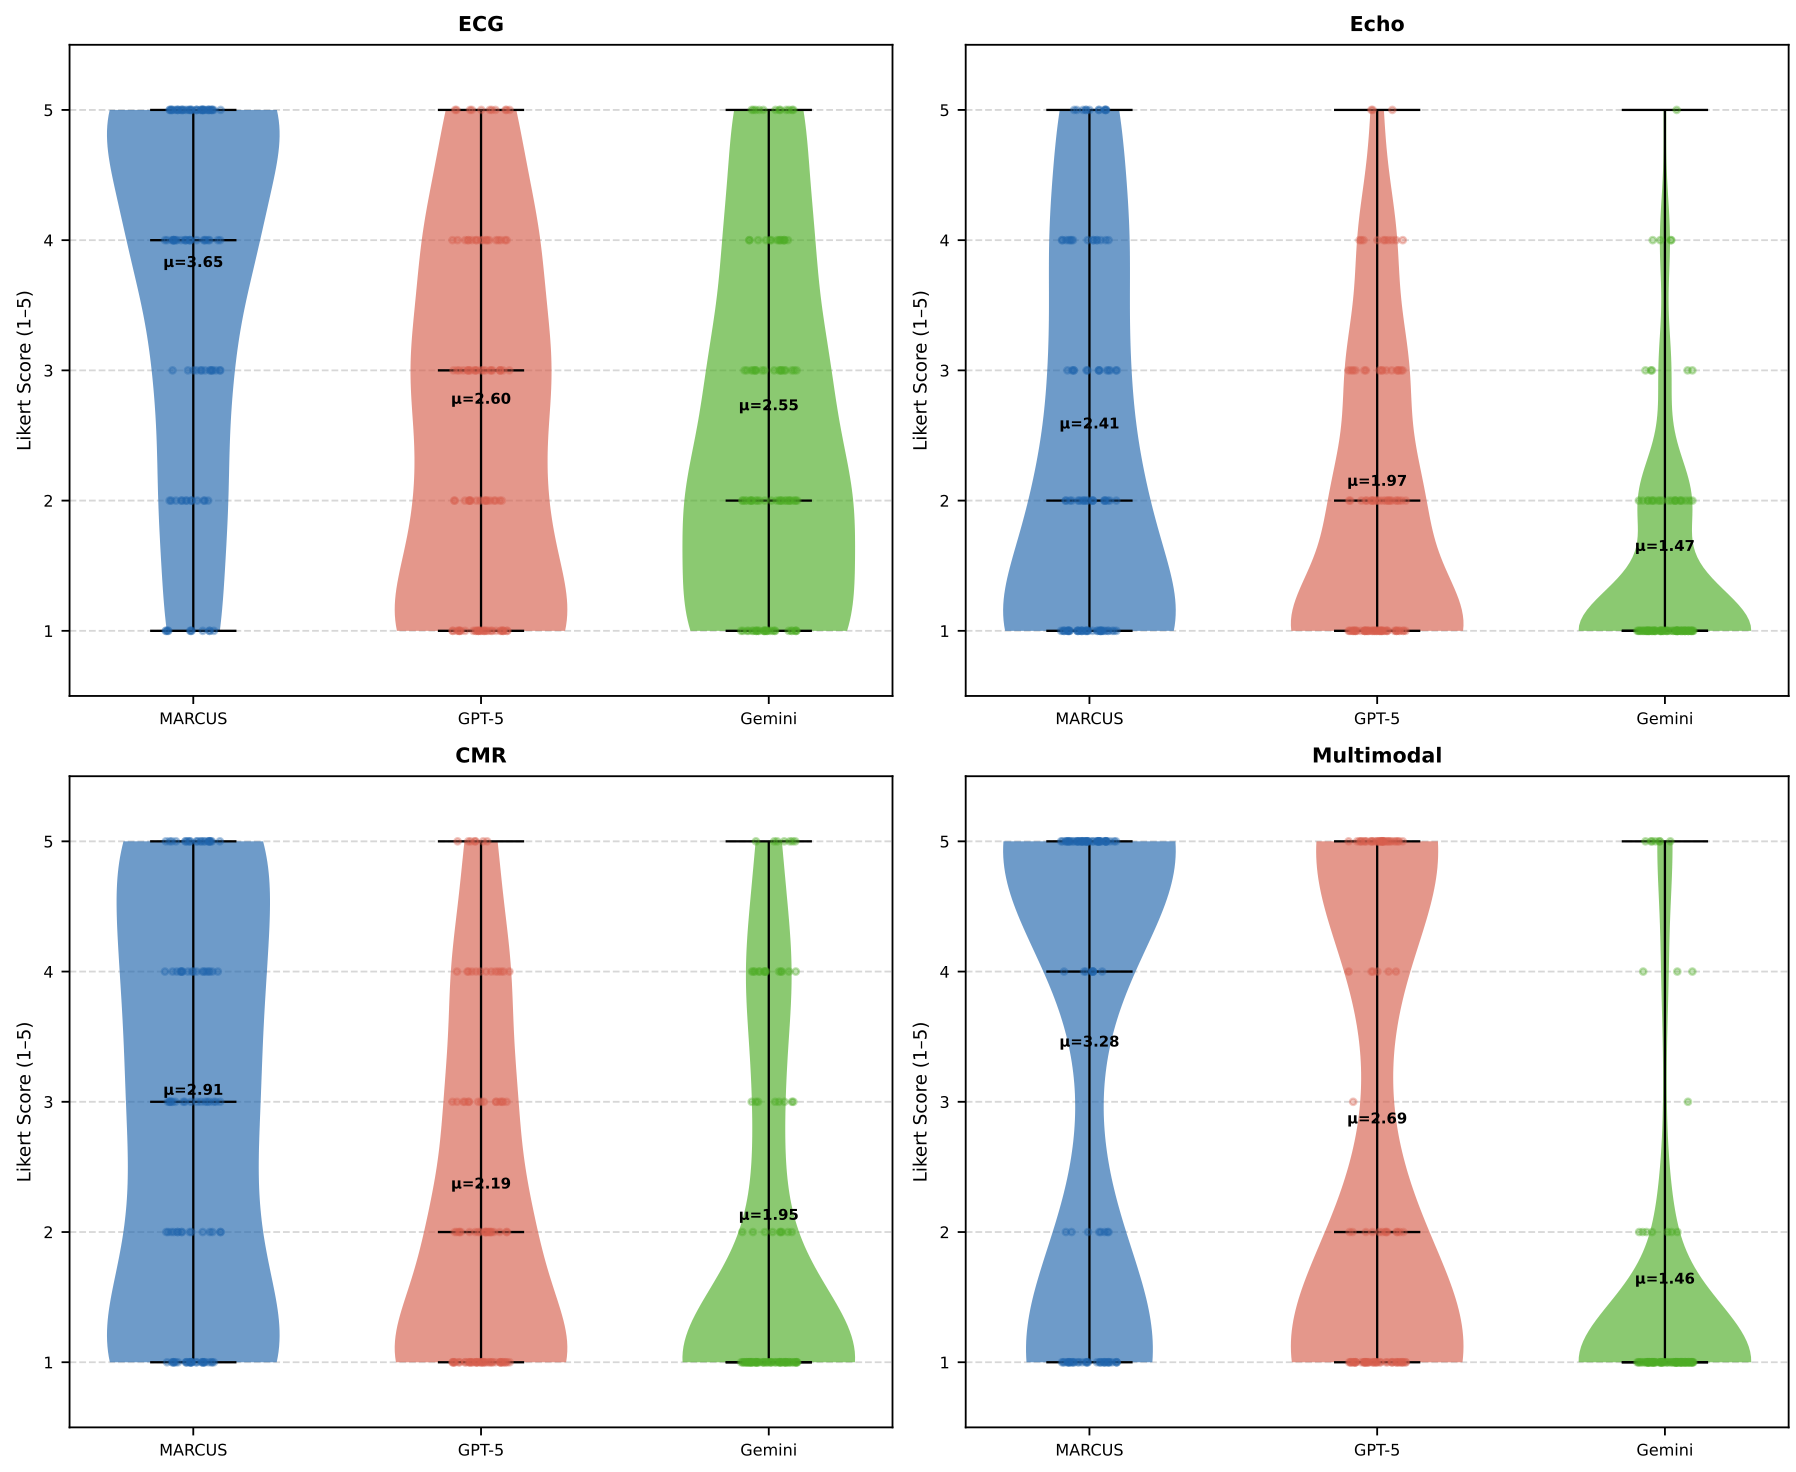
Free-text responses are graded against physician-report answers on a five-point Likert scale, using an LLM judge and a blinded cardiologist on an unspecified subset. Stanford MARCUS means are ECG 3.65, echo 2.41, CMR 2.91 and multimodal 3.28; corresponding GPT-5 means are 2.60, 1.97, 2.19 and 2.69.
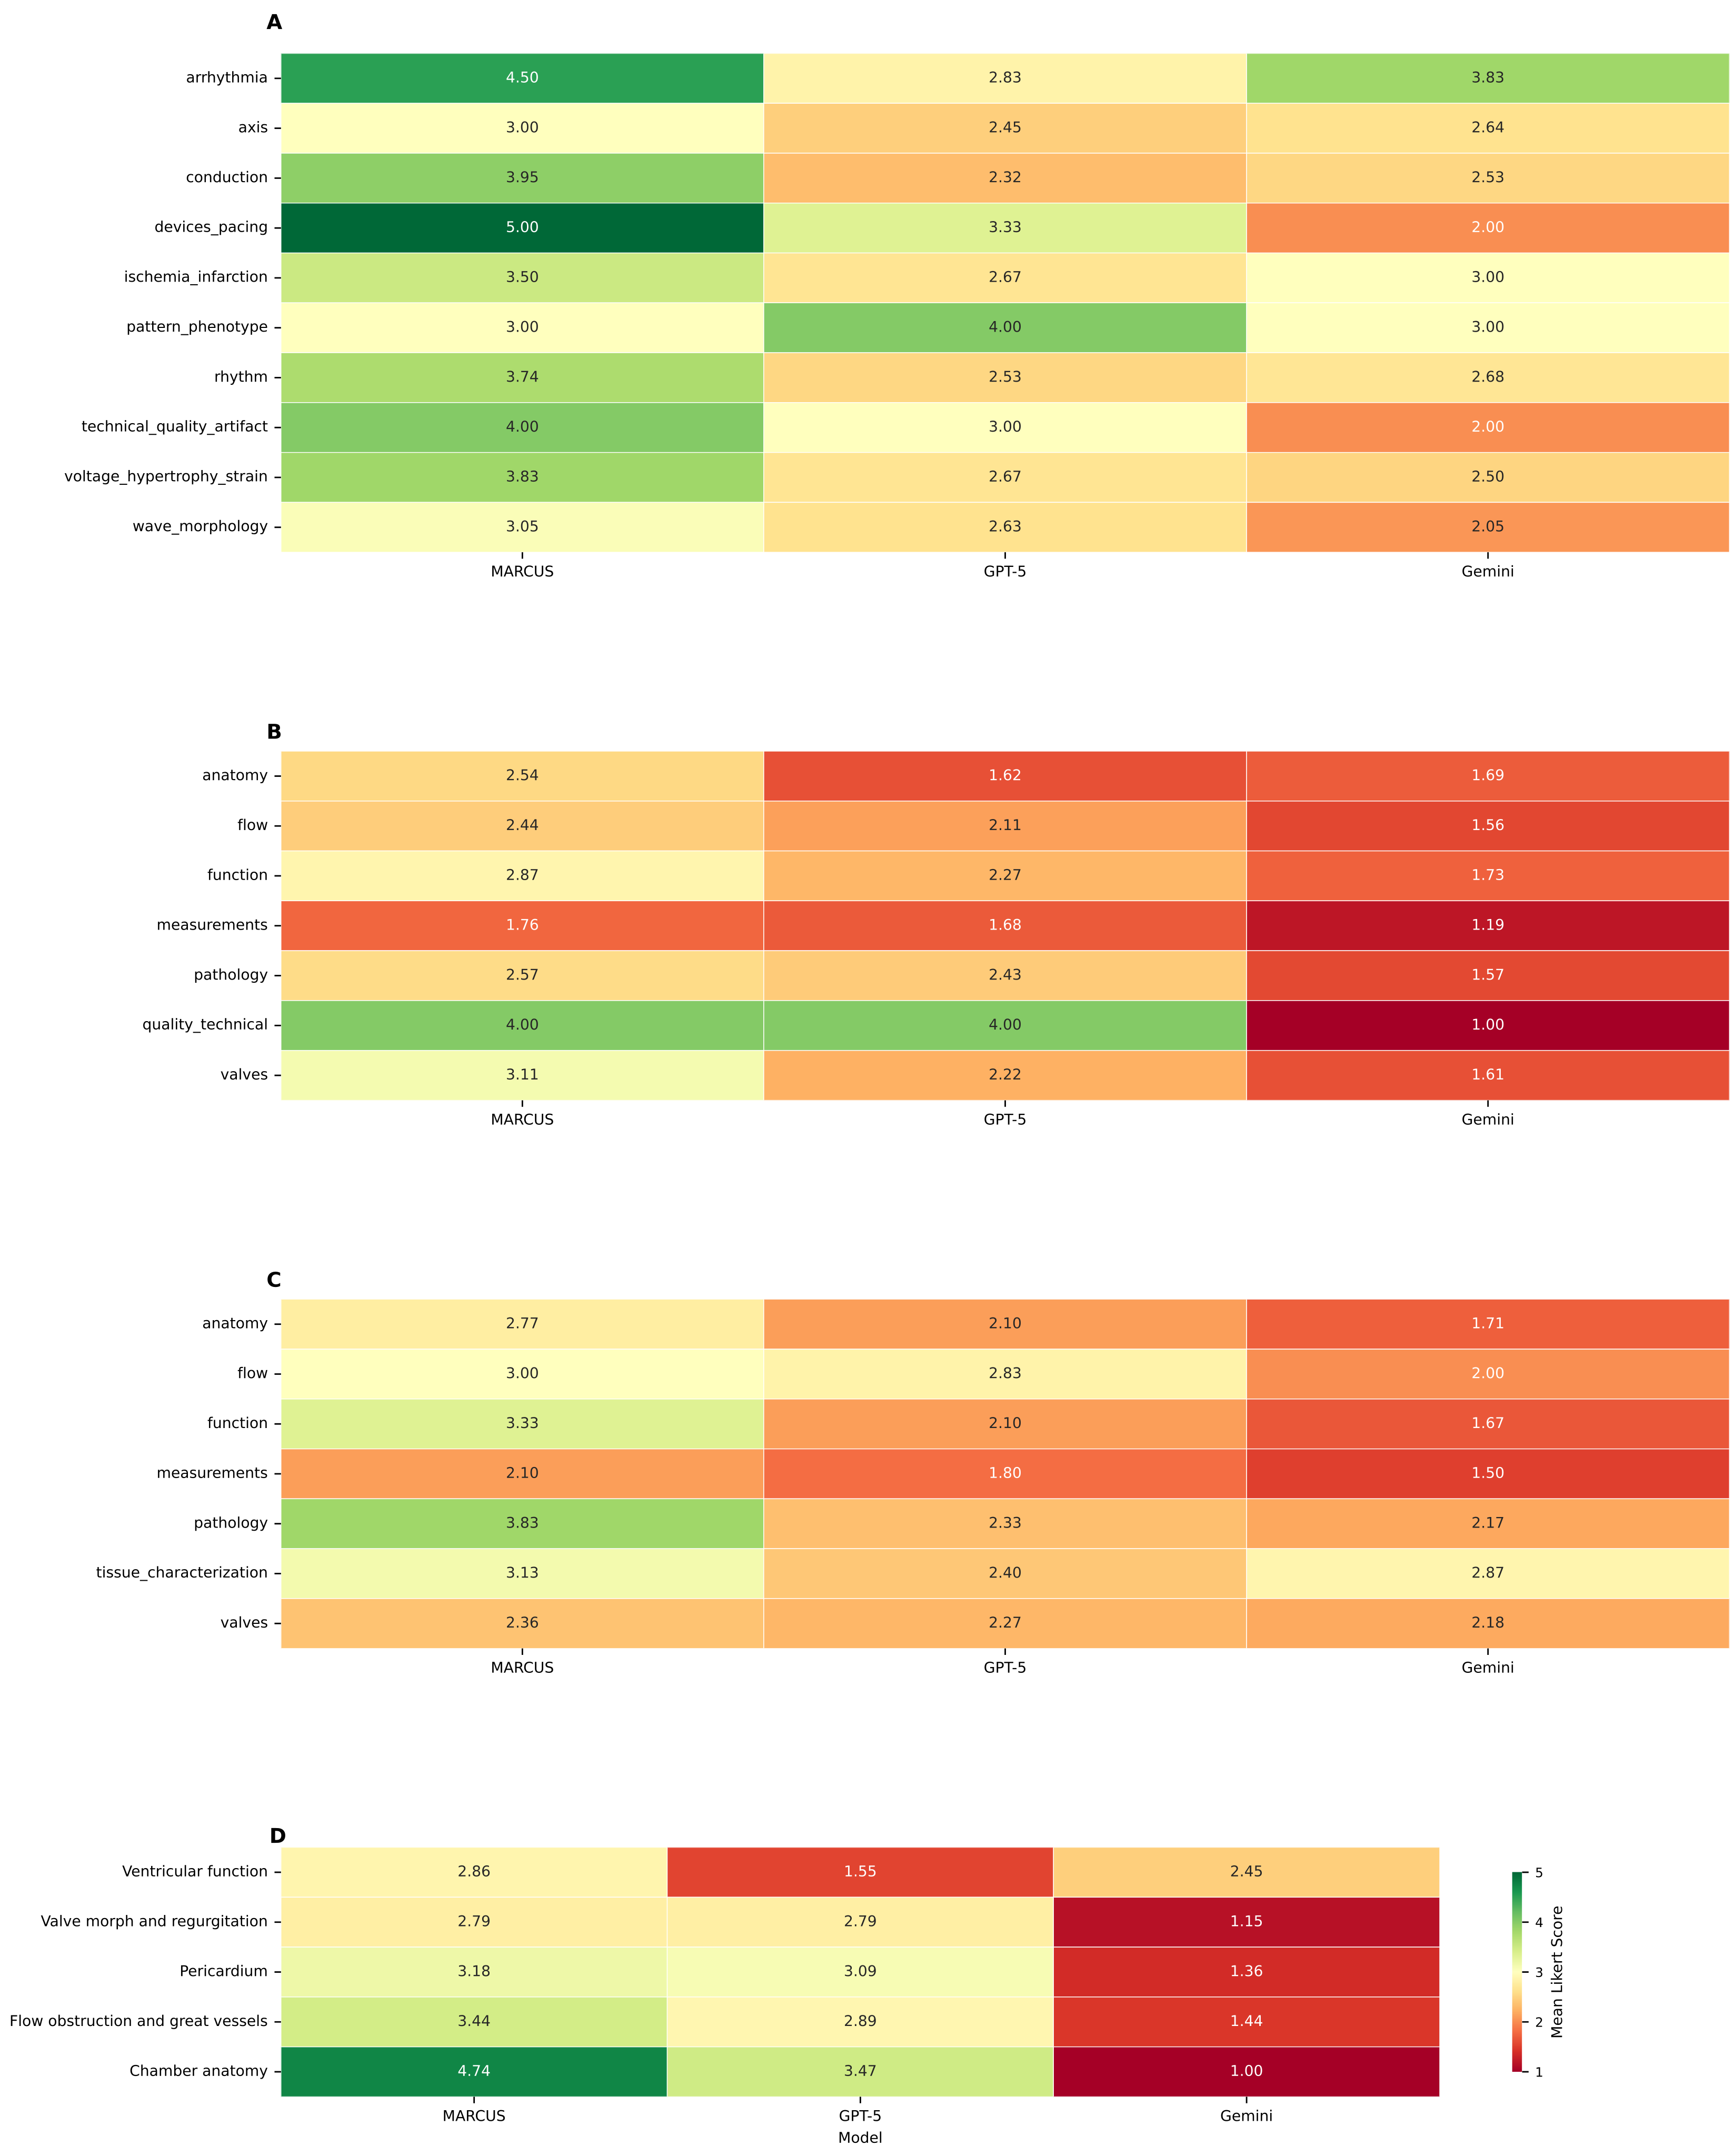
UCSF MARCUS means are 4.14, 3.24 and 3.22 for ECG, echo and CMR. Advantages are uneven: echo measurements score 1.76, while ECG arrhythmia scores 4.50 on only six items. Ratios of ordinal Likert means are not calibrated “times better” clinical quality. Table 7 gives p=0.041 for echo and p=0.036 for multimodal versus GPT-5, rather than the prose’s blanket p<0.001.
1.4 MARCUS maintains superior performance over frontier models across institutions
UCSF uses different patients and acquisition settings without additional fine-tuning. ECG/CMR main-text differences have p>0.05, while echo improves markedly. Non-significance is not an equivalence test, and improved external performance does not establish invariant biological features.
Supplementary protocols evaluate different-sized MARCUS and GPT-5 subsets. Case mix, question selection and subset sizes limit direct across-site comparisons; these results are not broad community deployment validation.
1.5 MARCUS outperforms frontier models in discrete diagnosis across all modalities
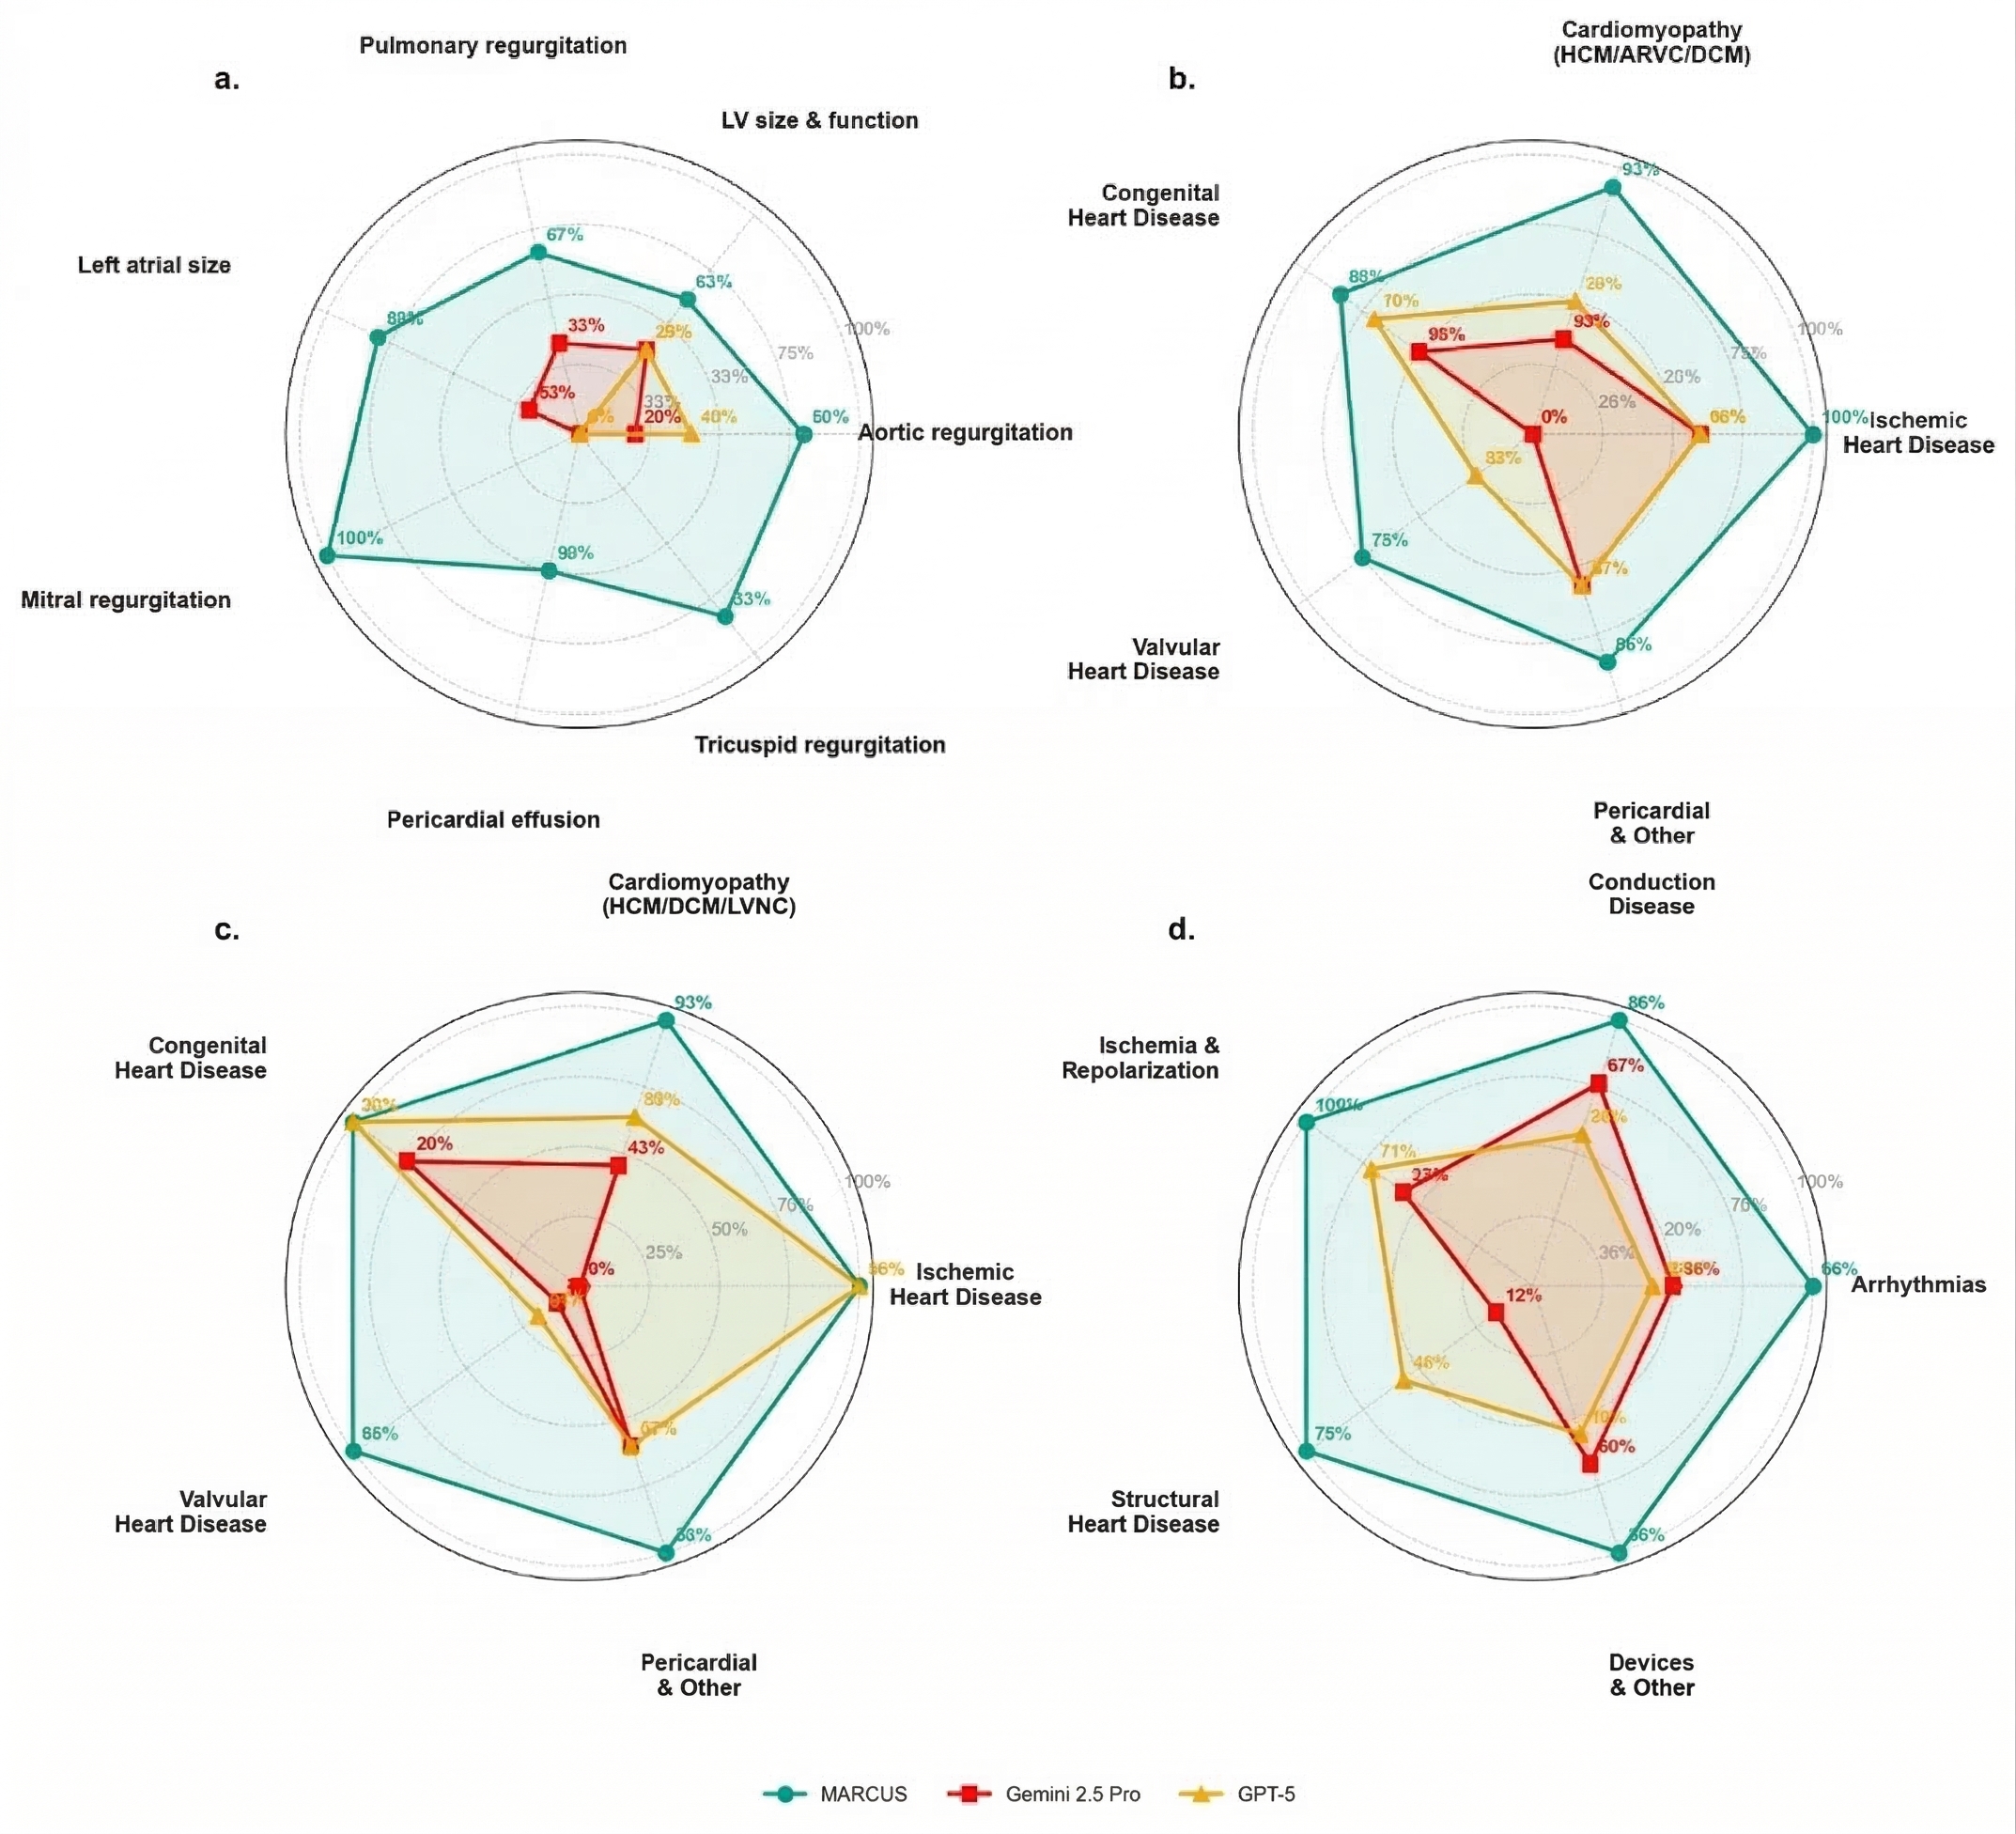
Disease-category plots show strengths in ECG recognition and several CMR categories, but echo congenital/pericardial categories reach only 38%, and multimodal pericardial effusion 50%. Small per-category denominators and answer-option composition matter when interpreting apparent 100% results.
1.6 MARCUS exceeds purpose-built specialist Cardiac AI models
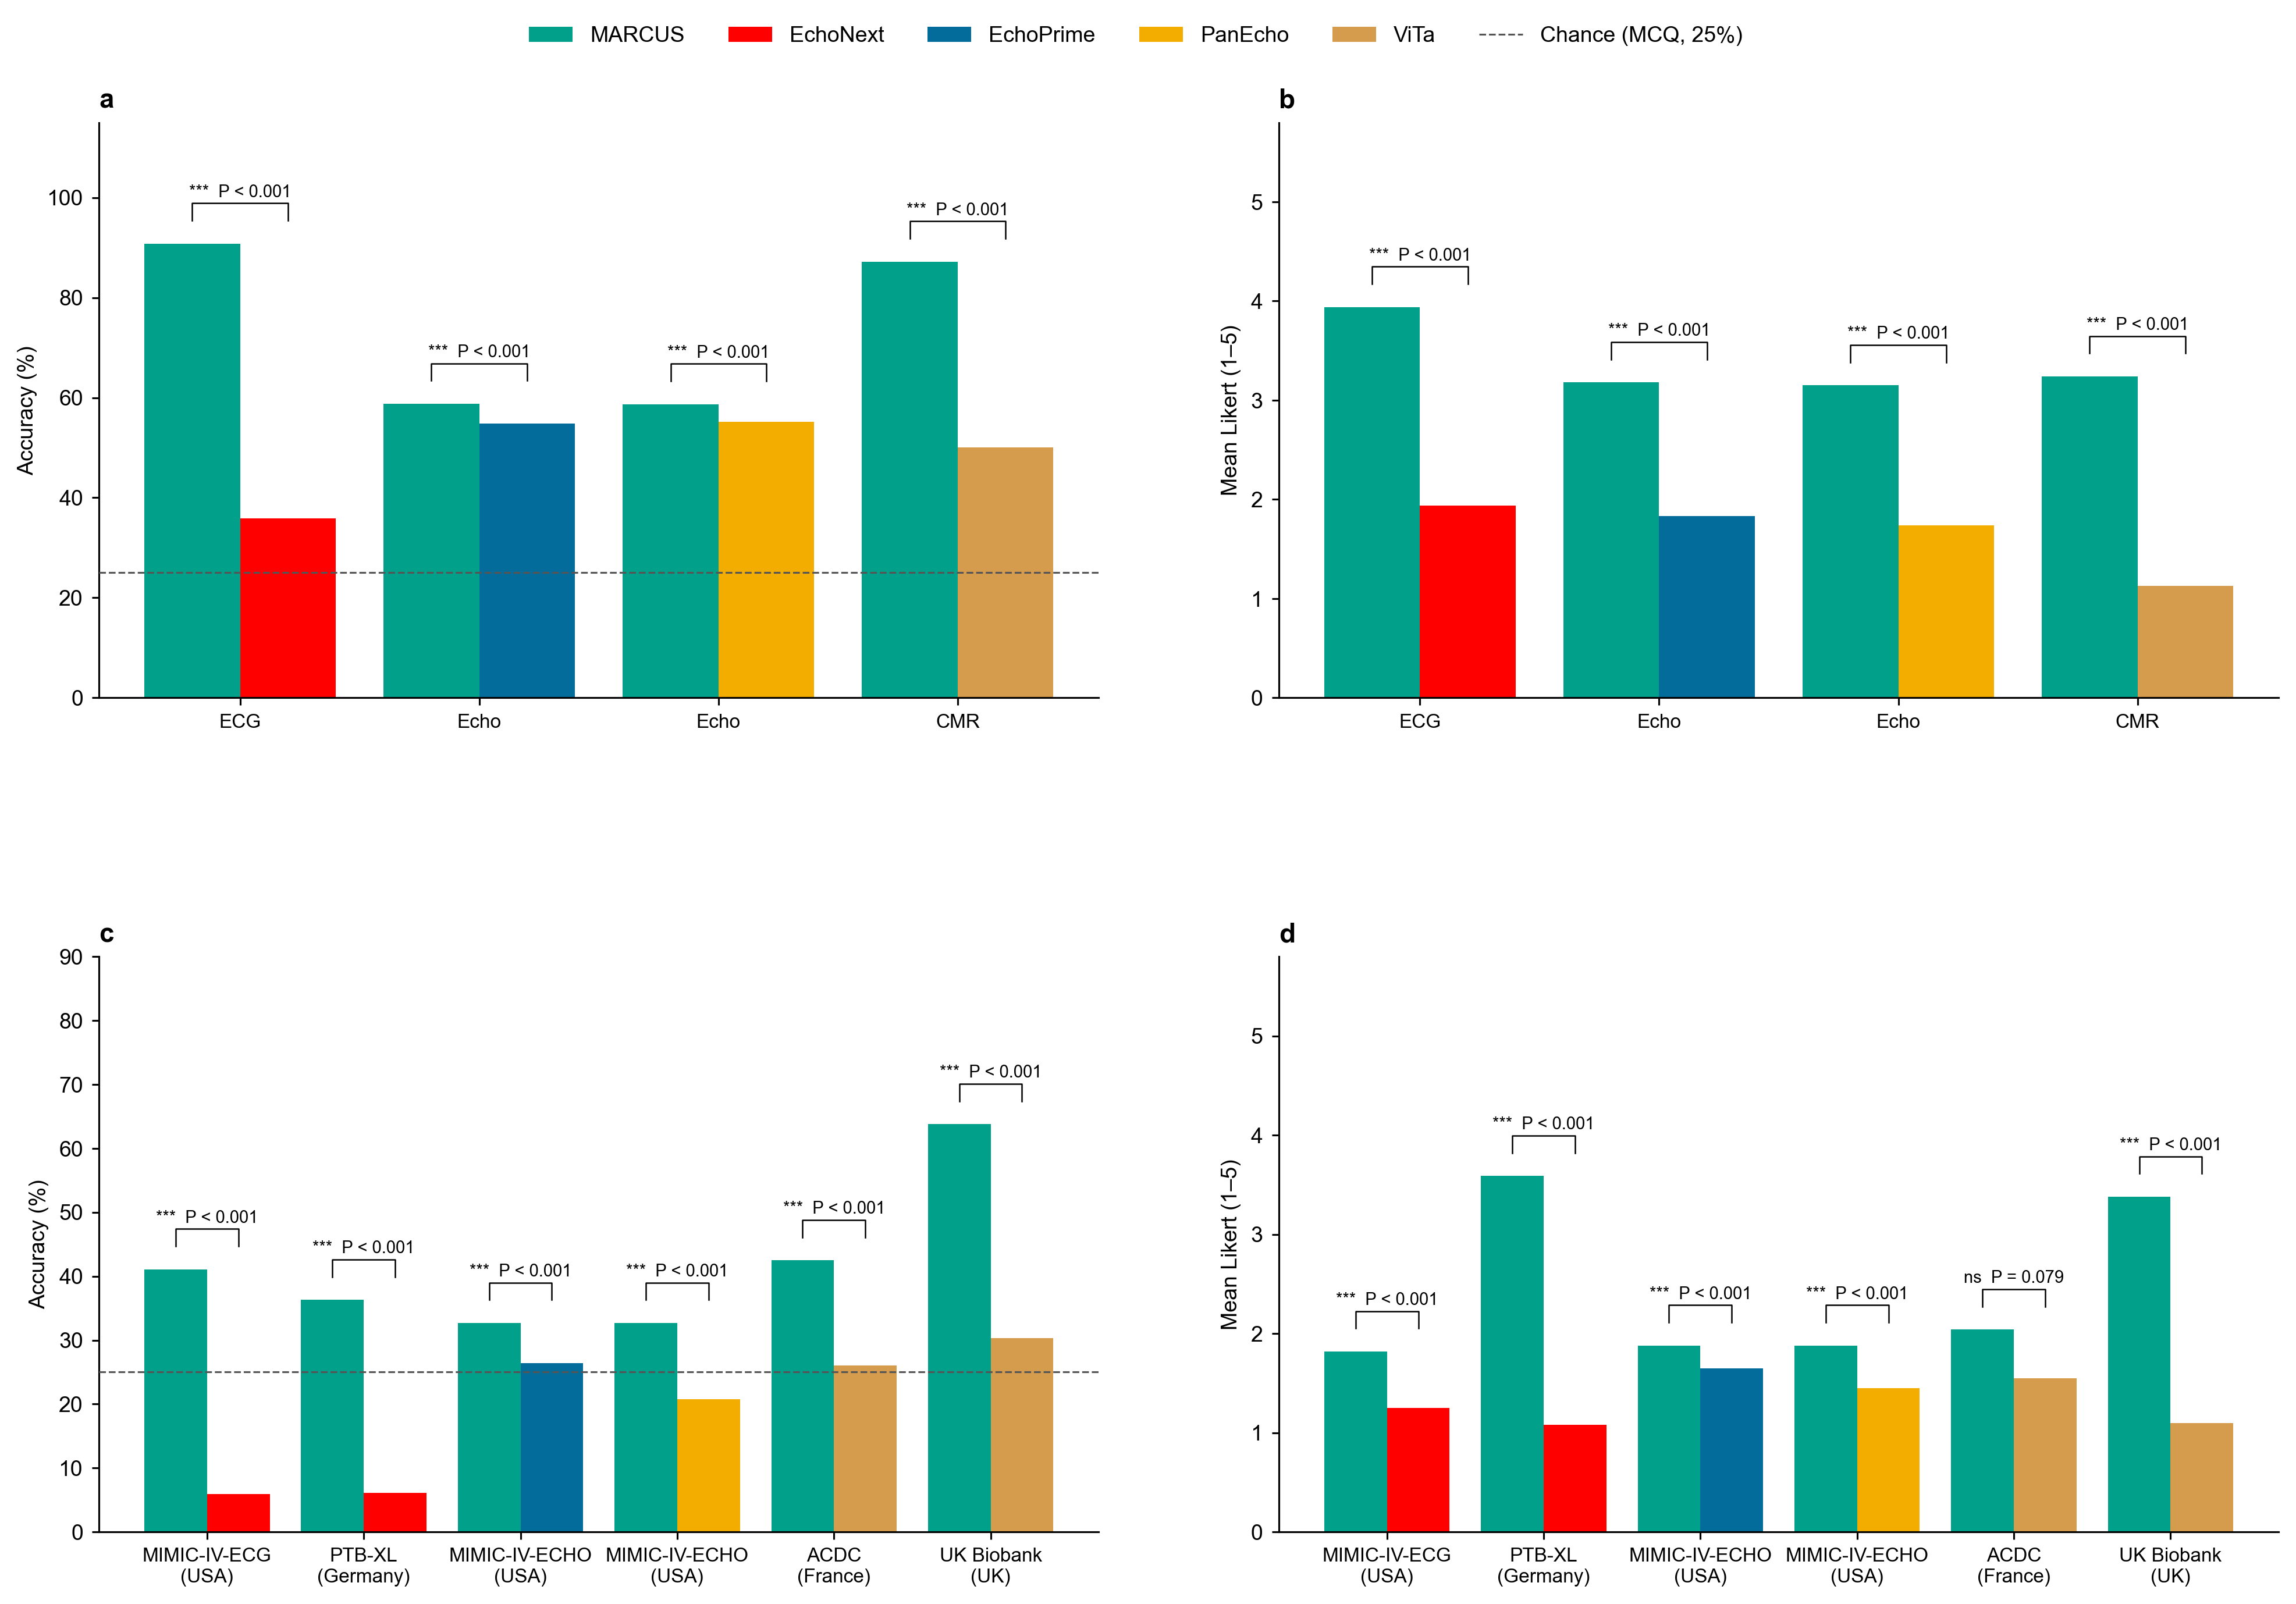
Specialist comparisons use different, much larger question sets than the small frontier-model benchmark. Stanford in-scope ECG accuracy is 90.8% versus EchoNext 35.9%; echo is 58.8% versus EchoPrime 54.8% and PanEcho 55.2%; CMR is 87.2% versus ViTa 50.0%.
On external public MCQs, MARCUS reaches 41.1% on MIMIC ECG, 36.3% on PTB-XL, 32.7% on MIMIC echo, 42.5% on ACDC and 63.8% on UK Biobank. It outperforms the reported comparators, but these absolute rates are much lower than the Stanford/UCSF headline range. MIMIC ECG/echo mean Likert scores are only 1.82/1.88.
External comparisons include questions outside specialists’ output scope; EchoNext out-of-scope items are explicitly counted wrong. Structured predictions are converted to pseudo-reports and judged by an LLM. This evaluates broad question coverage plus the conversion/scoring pipeline, not solely accuracy on each specialist’s intended task.
1.7 Counterfactual probing by the agentic orchestrator confers mirage resistance for MARCUS
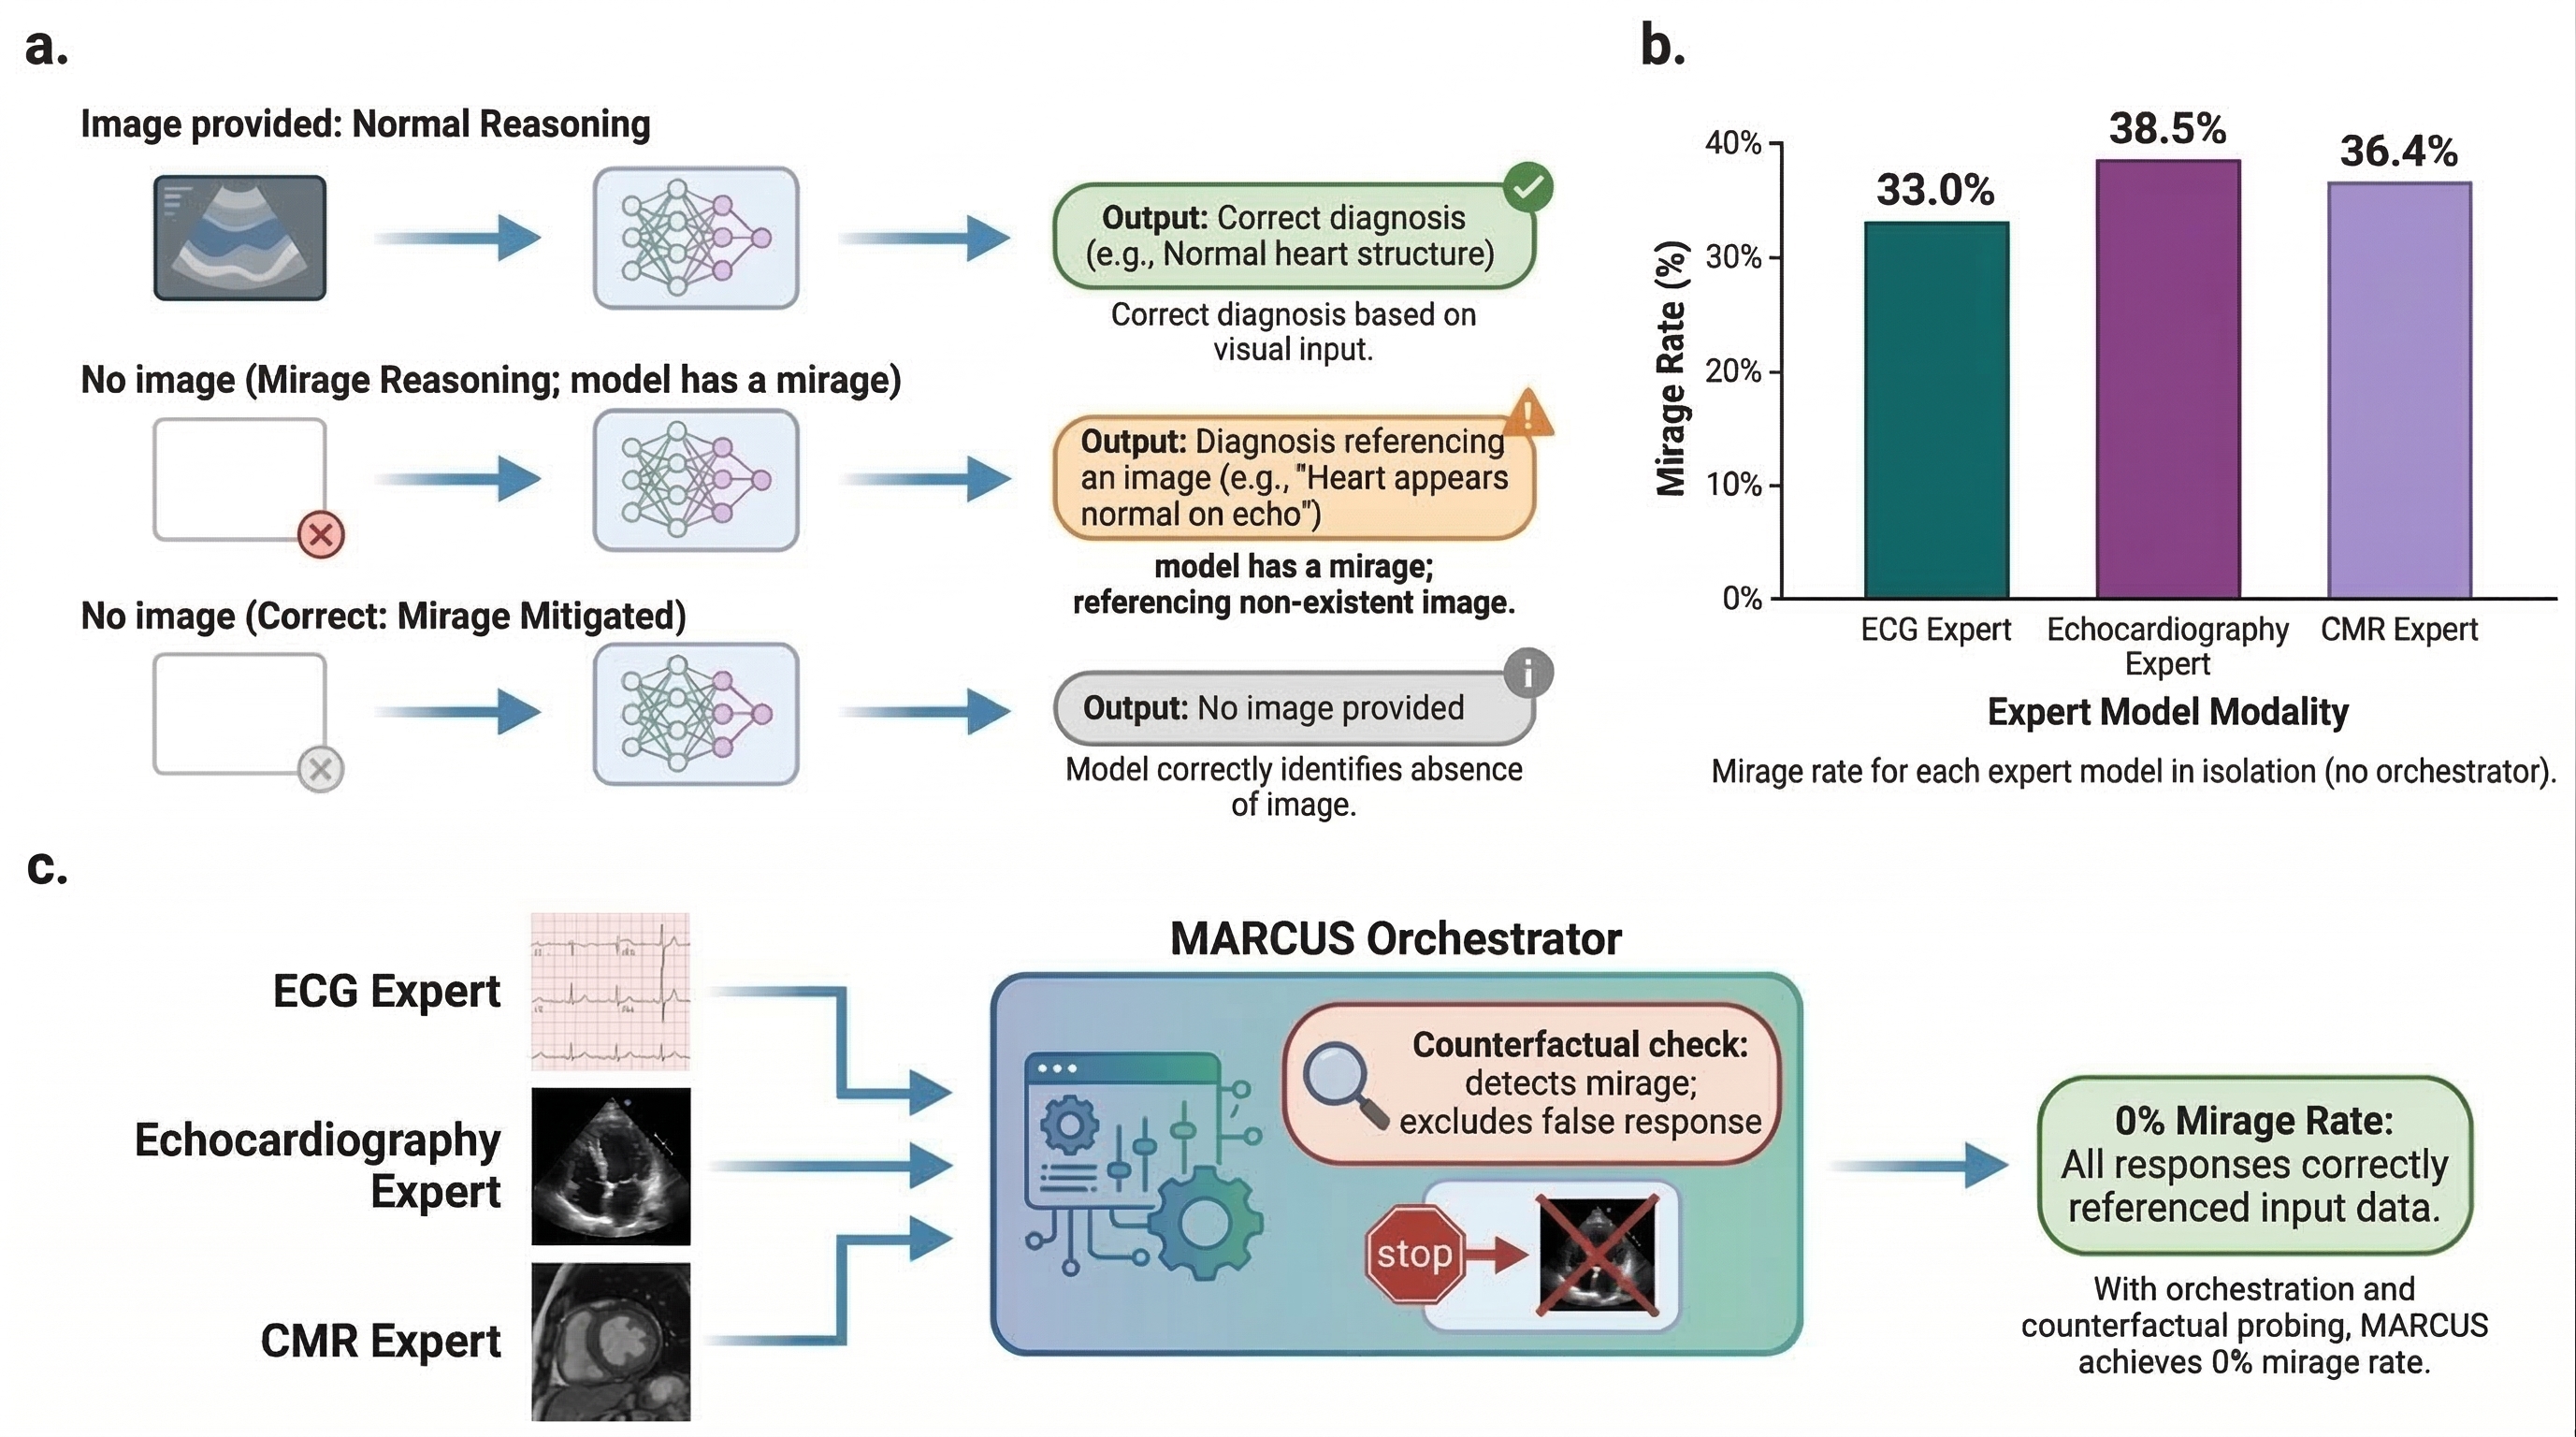
Without orchestration, image-absent mirage rates are reported as 33.0% ECG, 38.5% echo and 36.4% CMR. With three rephrasings and an image-absent probe, the authors report zero detected mirages and no grounded answers suppressed.
The detector uses token-overlap consistency, not a causal guarantee of visual grounding. The evaluated number of mirage trials and uncertainty interval are not stated. Zero on this specific test does not mean zero clinical hallucinations; the later failure analysis identifies hallucination/fabrication errors under a different definition. The companion Mirage reference retains a placeholder arXiv identifier.
2 Discussion
The contribution is an interactive, domain-trained multimodal interpretation system with explicit expert verification. Access to hospital data, task-specific training and modular orchestration all plausibly contribute; the experiments do not isolate their effects.
Limitations include single-center training, curated report-derived questions, automated grading, small frontier-model subsets, heterogeneous specialist comparisons and retrospective design. Prospective effects on diagnostic errors, treatment timing and patient outcomes remain unknown. Quantification and echo free-text reasoning remain substantial weaknesses.
3 Methods
Methods cover preprocessing, report-derived supervision, three-stage training, expert coordination and two distinct evaluation families.
3.1 Overview
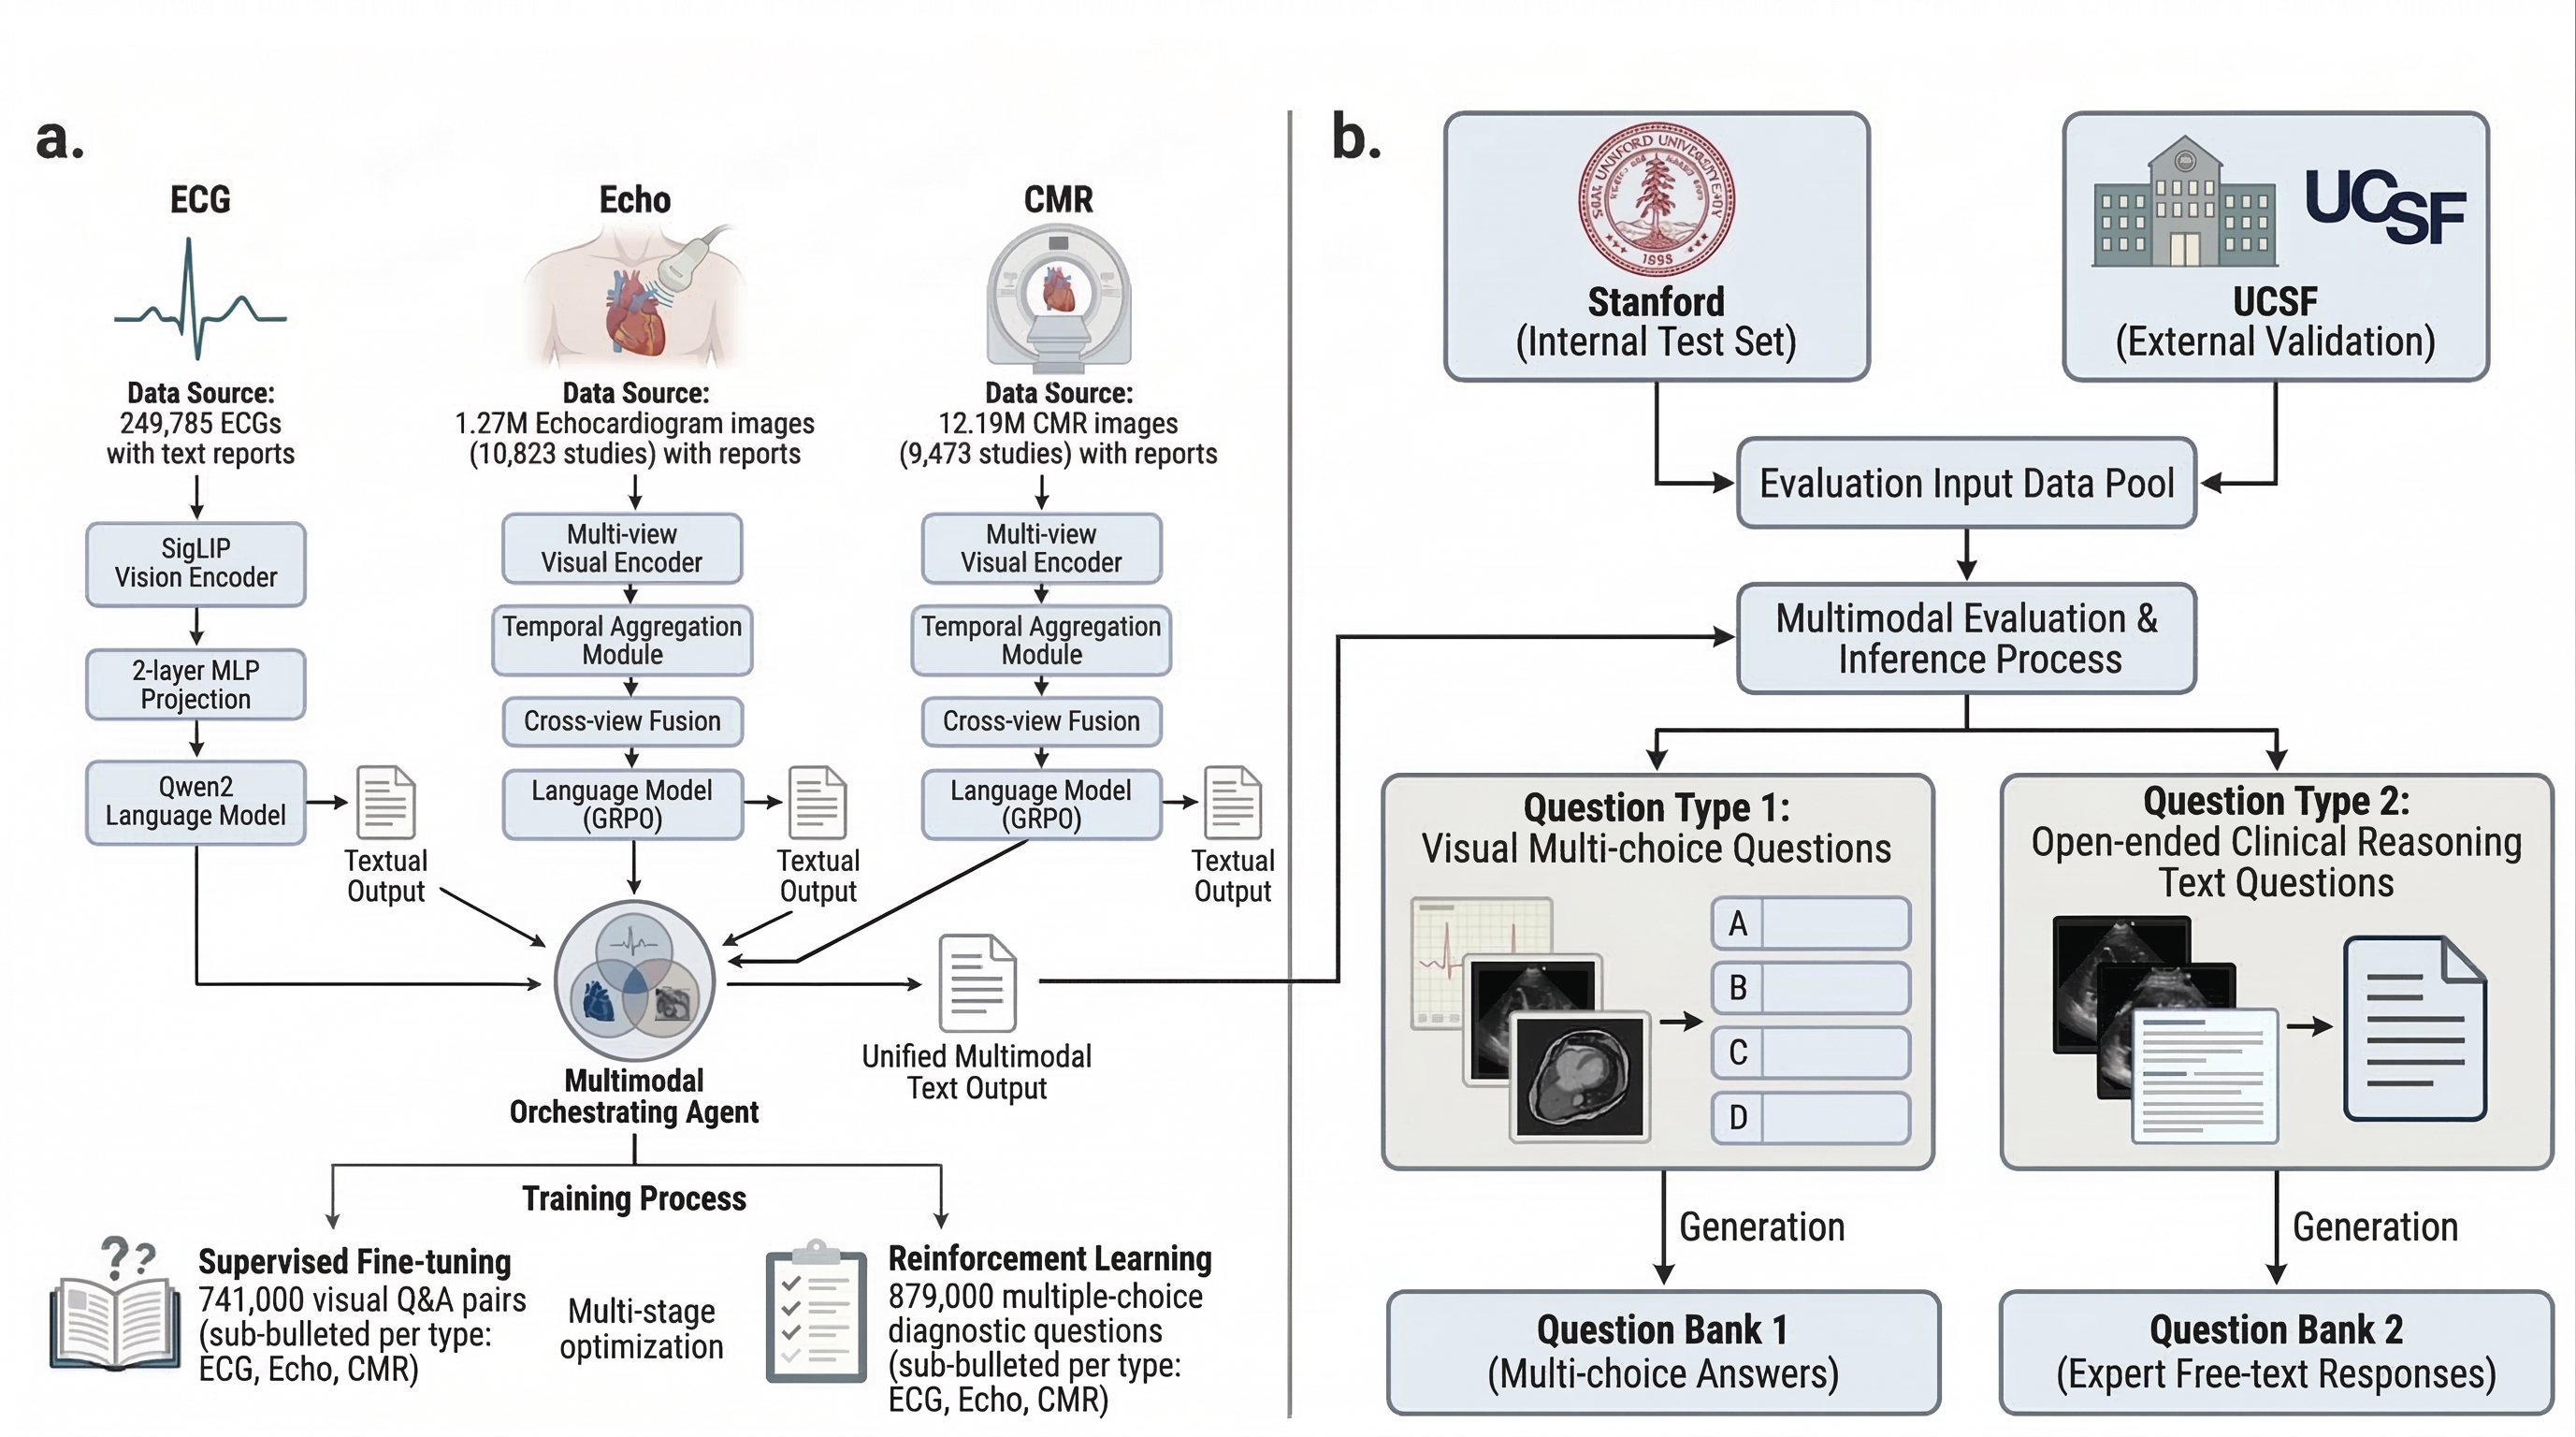
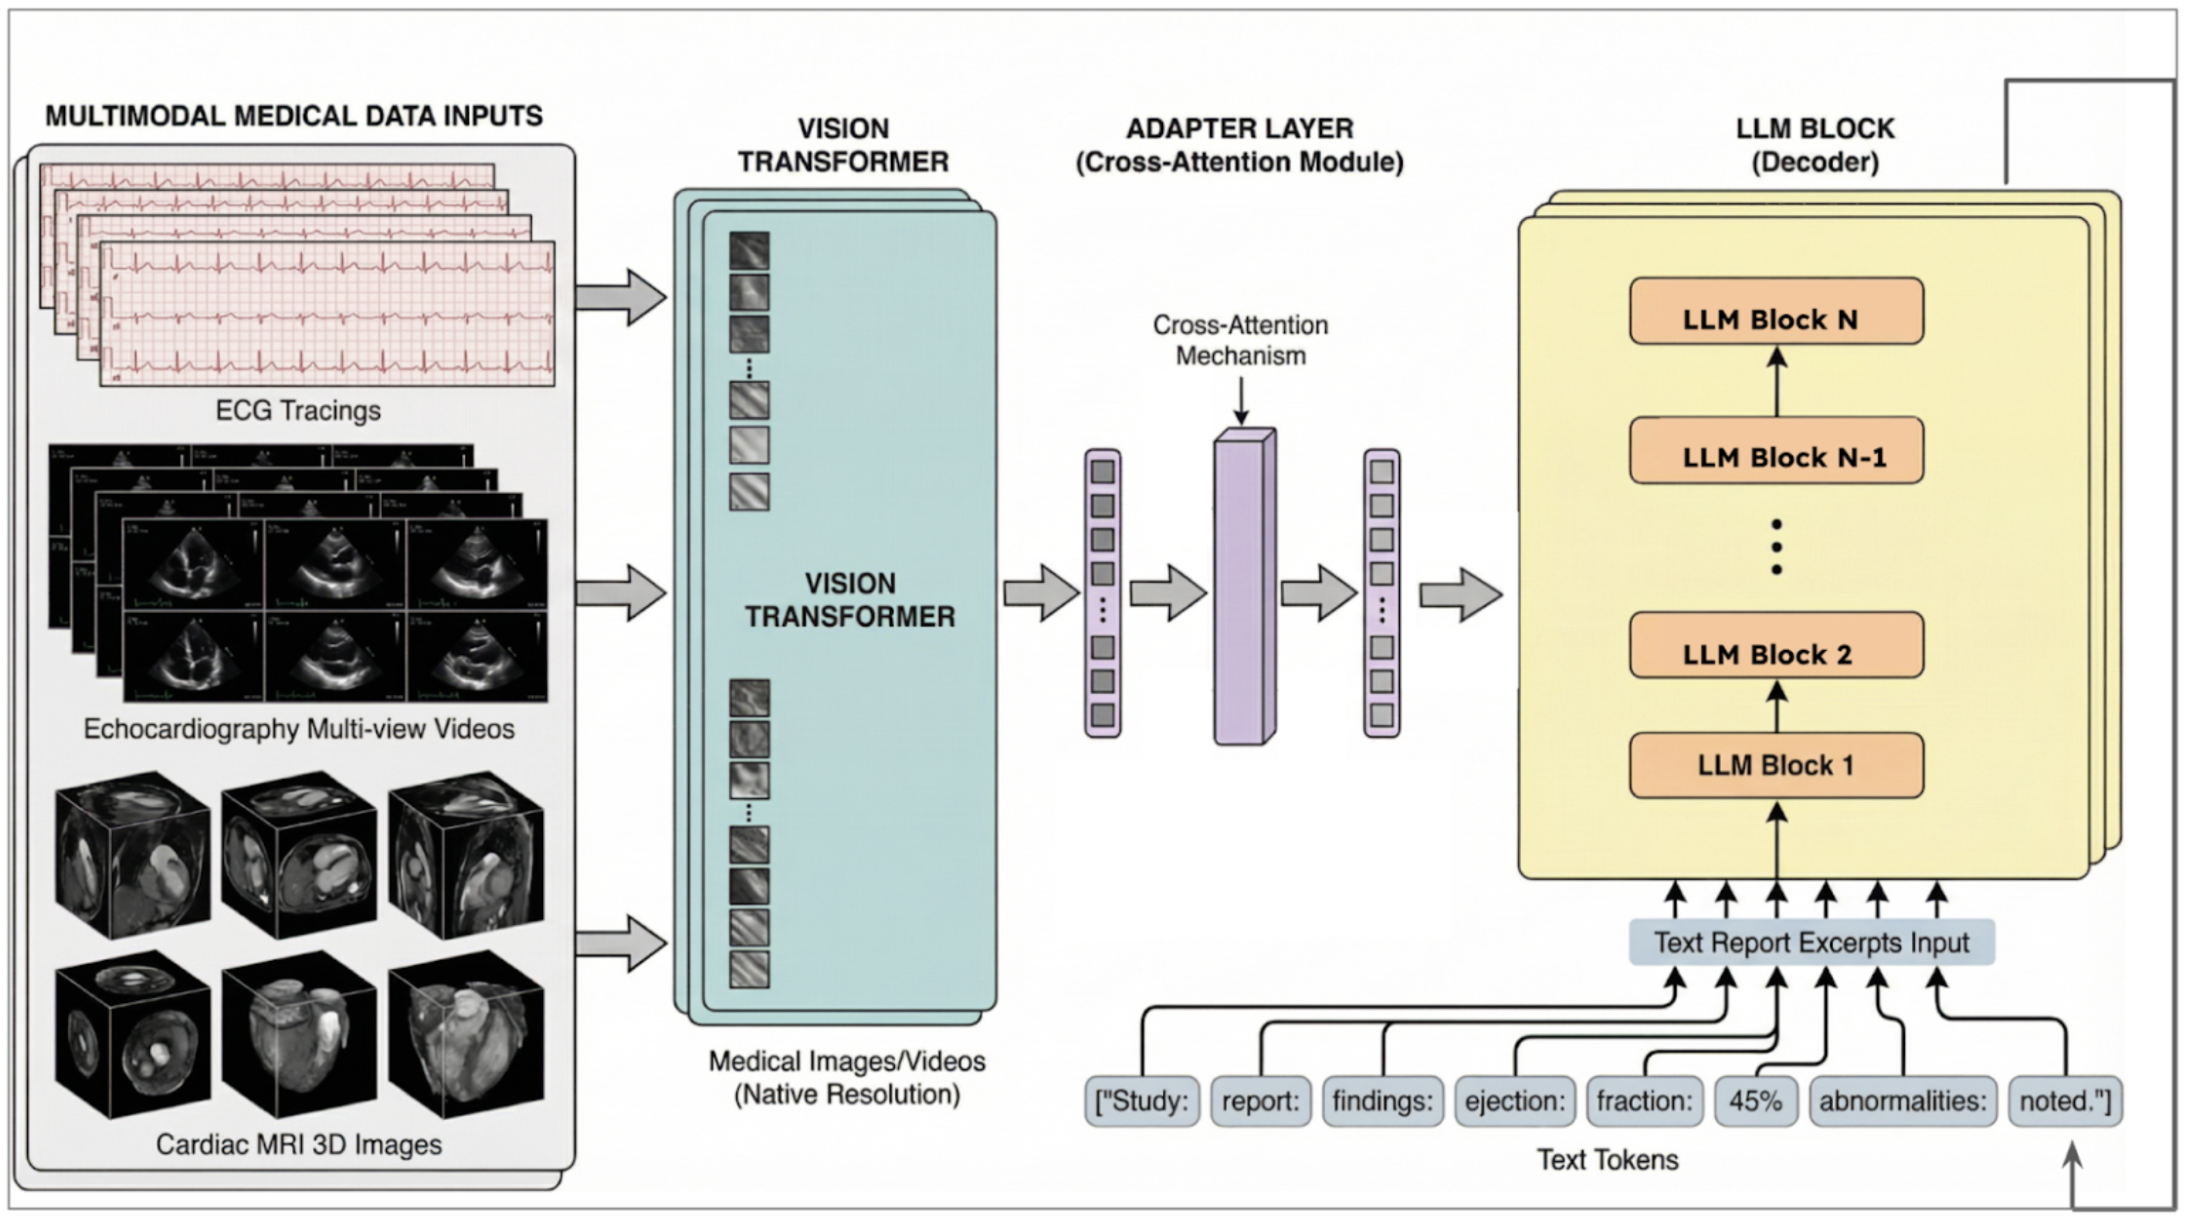
Echo/CMR experts combine visual encoding, temporal aggregation, cross-view fusion and a language decoder. ECG uses SigLIP, a two-layer projection and Qwen-family decoding. Stanford approvals are IRB 67663 and 41045; the model is studied retrospectively.
3.2 ECG, echocardiogram and CMR data processing
Render full ten-second, twelve-lead ECGs into a 4×3 grid, proportionally scaling signals and background grids. Absolute paper calibration no longer directly maps to pixels, although relative waveform/grid scale is preserved.
Echo videos are tiled and selected using attention without standardized view metadata. CMR sequences are routed using acquisition metadata and the clinical query. Frames are split into 16×16 patches; ordered tokens carry temporal/slice position. This represents motion and geometry but does not itself establish accurate reconstruction or quantitative calibration.
3.3 Question and answer datasets
A cardiologist designs 100 question-type templates; an LLM derives questions and answers from physician reports, with cardiologist review and distractor creation for MCQs. Supervised counts are 460k ECG, 155k echo and 126k CMR; GRPO counts are 425k, 236k and 218k.
UCSF questions are generated independently with the same procedure. Report extraction supplies labels and may inherit report omissions or errors. The paper states held-out studies/questions, but does not fully detail patient-level partitioning, temporal leakage checks or all human-review coverage.
3.4 Model training overview
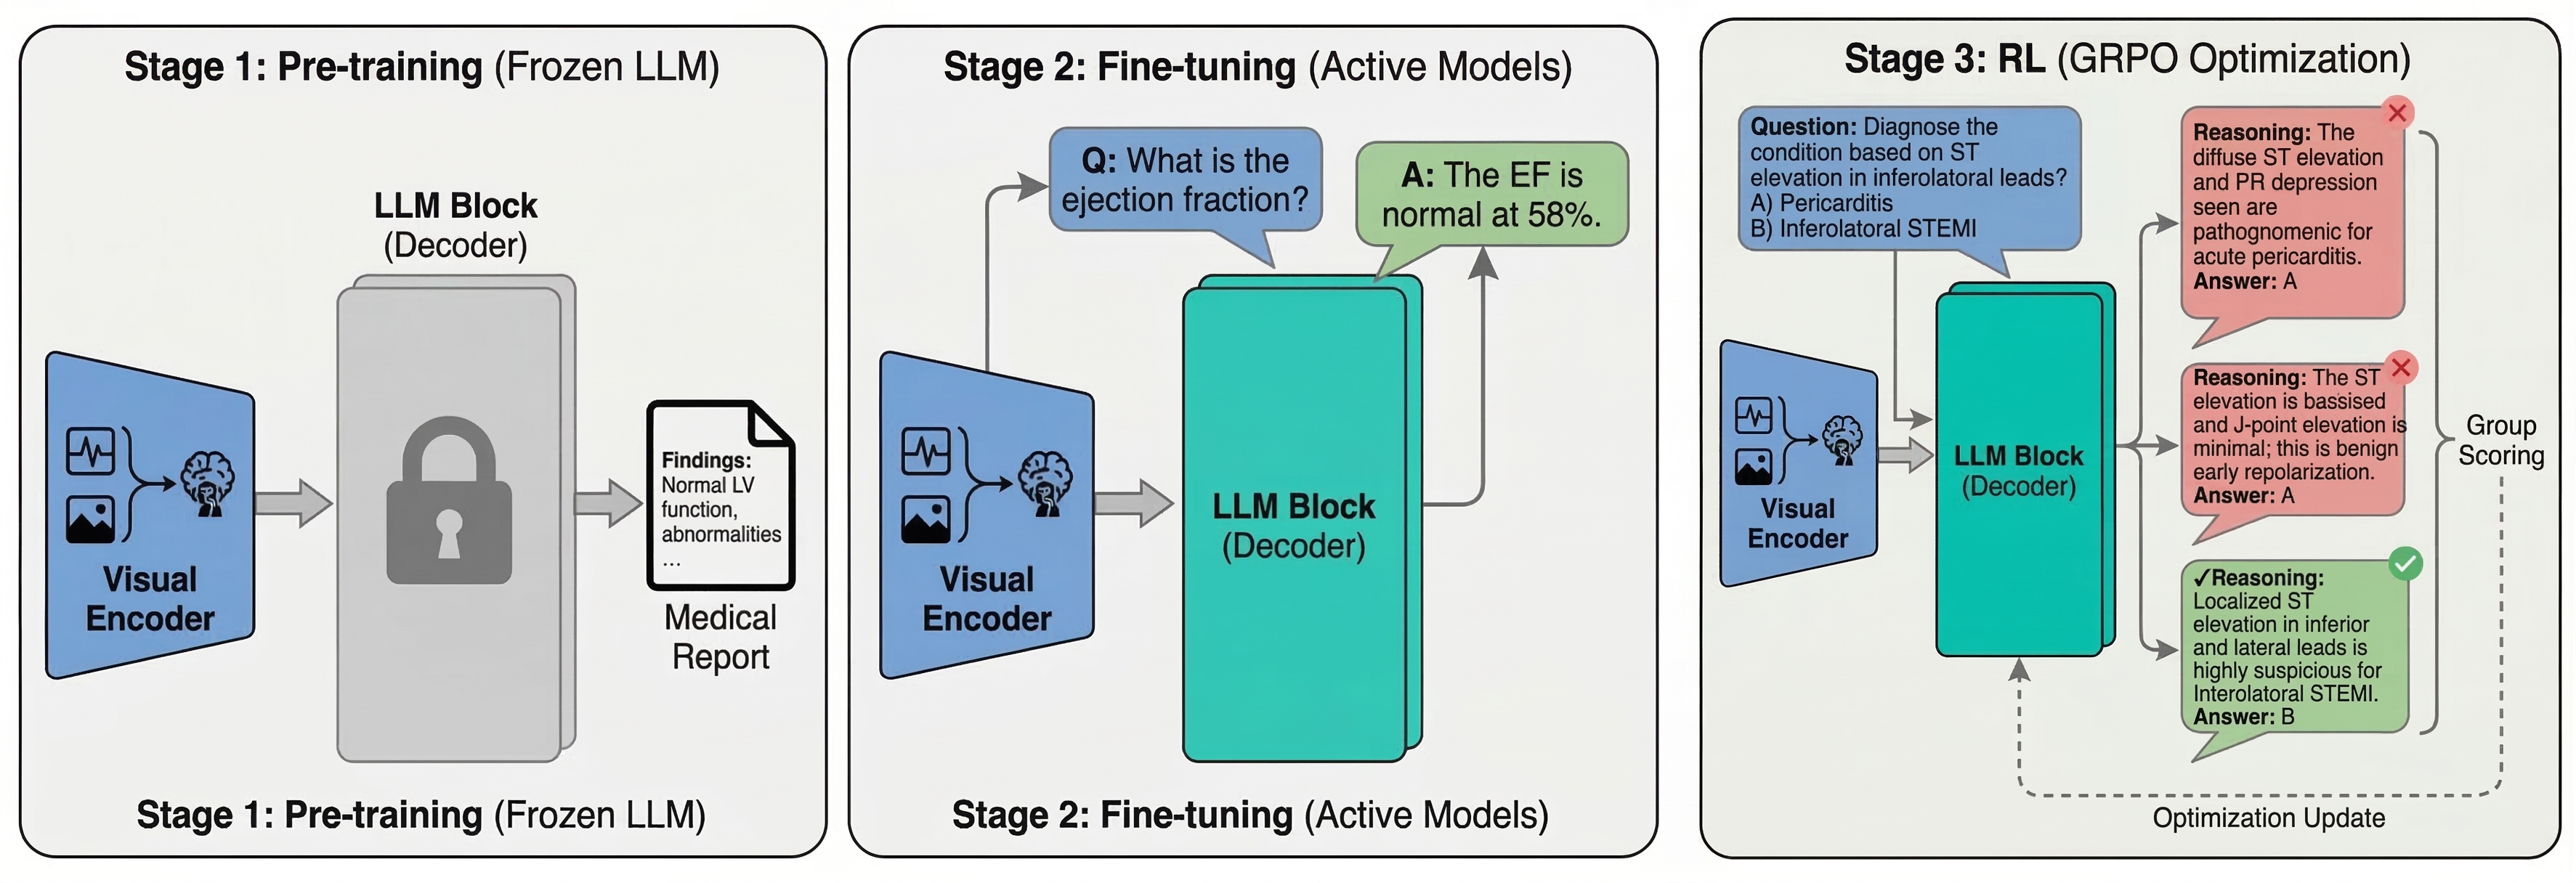
First align visual encoders to paired reports with the language model frozen; then jointly fine-tune on questions; finally optimize MCQ correctness with GRPO. Textual expert outputs feed the orchestrator. Comparisons use the paper’s specified GPT-5 and Gemini 2.5 configurations, not all possible contemporary model settings.
3.5 Model architecture and training: Single modality ECG model
The ECG expert follows a LLaVA-style SigLIP–MLP–Qwen architecture. Train vision/projection first, then jointly update vision/language, then apply correctness-based GRPO. Inputs interleave question, image and answer. Table 4 names Qwen2.5-VL-3B-Instruct, while prose sometimes calls the decoder Qwen2.
3.6 Model architecture and training: Single modality echocardiography and CMR model
Echo and CMR add frame sequencing and cross-view fusion to the same frozen-then-joint training recipe. GRPO follows supervised learning. Ordering patches/frames preserves positional information, while the paper does not provide an ablation separating temporal aggregation, cross-view fusion and residual connections.
3.7 Model architecture: Multimodality
Experts exchange natural-language findings rather than a common learned embedding. For each sub-query, ask three equivalent phrasings with the image and once without it. Confidence averages agreement across image-present answers and divergence from the image-absent answer.
Weight expert contributions by confidence and communicate residual uncertainty. The interface can accommodate replacement language models, but the paper does not evaluate arbitrary replacements, calibrated confidence or the cost of the additional inference calls.
3.8 Evaluation
MCQs require one letter among four or five options; free text is graded 1–5 against reports. The primary image-dependent benchmark applies B-Clean: exclude a question if any evaluated model answers it correctly without images, retaining 60% of the initial set.
This model-dependent filtering defines a conditional benchmark and limits comparison with unfiltered deployment performance. The extent of human grading, judge agreement and patient/study-level uncertainty are not fully reported. UCSF receives no fine-tuning; the supplementary subset protocol qualifies the main statement that all evaluations use identical inputs.
3.9 Benchmarking MARCUS against single-modality cardiac AI models
Benchmark EchoNext, EchoPrime, PanEcho and ViTa on Stanford and five public datasets. Convert structured predictions to pseudo-reports for free-text scoring; EchoPrime already produces report text.
Use 2,000 bootstrap resamples for these specialist comparisons, McNemar for binary correctness and paired Wilcoxon for mean Likert. These differ from the frontier-model appendix’s 5,000-resample/Mann–Whitney protocol. Per-comparison counts are preserved in Table 5.
Acknowledgements
The Knight Initiative for Brain Resilience funded compute; Mohammad Asadi received an Amazon AI Fellowship.
Author contributions
O’Sullivan, Asadi and Ashley conceived the work. Asadi and Elbe implemented/analyzed the system, with Nedaee and others contributing methods and visualization. Arnaout and Ashley supervised; Ashley obtained funding. All authors reviewed the manuscript.
Competing interests
Disclosures include Ashley’s founder/adviser/director roles at Personalis, Deepcell, Svexa, Saturnus Bio, Swift Bio, Candela, Parameter Health, Pacific Biosciences, AstraZeneca and Dexcom; O’Sullivan’s fellowship support and Google AI, Curie Bio and Foresite Labs consultancy; and Chaudhari’s Cognita Imaging salary/cofounder role, other imaging-company equity and consulting relationships. Other authors report no relevant conflicts.
Code availability
The paper links MARCUS source code and calls its license MIT. At review, the repository’s LICENSE file instead states CC BY-NC 4.0 while its README still says MIT; this edition records that inconsistency without resolving usage rights.
Data availability
The paper says test questions are available and full benchmark/weights will be released upon acceptance, despite broader release claims elsewhere. Raw Stanford/UCSF clinical imaging remains governed by institutional agreements and is not public. The two named CSV analysis supplements are not embedded in this version; complete model/data availability was not independently established.
1 Stanford Data Question Test Set
This supplement describes the small Stanford frontier-model benchmark, distinct from the larger specialist-comparison sets.
1.1 Dataset Overview
Evaluate MARCUS, GPT-5 Thinking and Gemini 2.5 Pro Deep Think on held-out ECG, echo, CMR and paired-modality questions.
1.2 Dataset Composition
Table 1 contains 100 VQA items per modality, totaling 400, and fifty MCQs per single modality plus forty multimodal MCQs, totaling 190. Single-modality VQA items draw from 78–82 studies and MCQs from 41–46. Multimodal items pair echo with CMR; retained-response counts later differ.
1.3 Question Categories
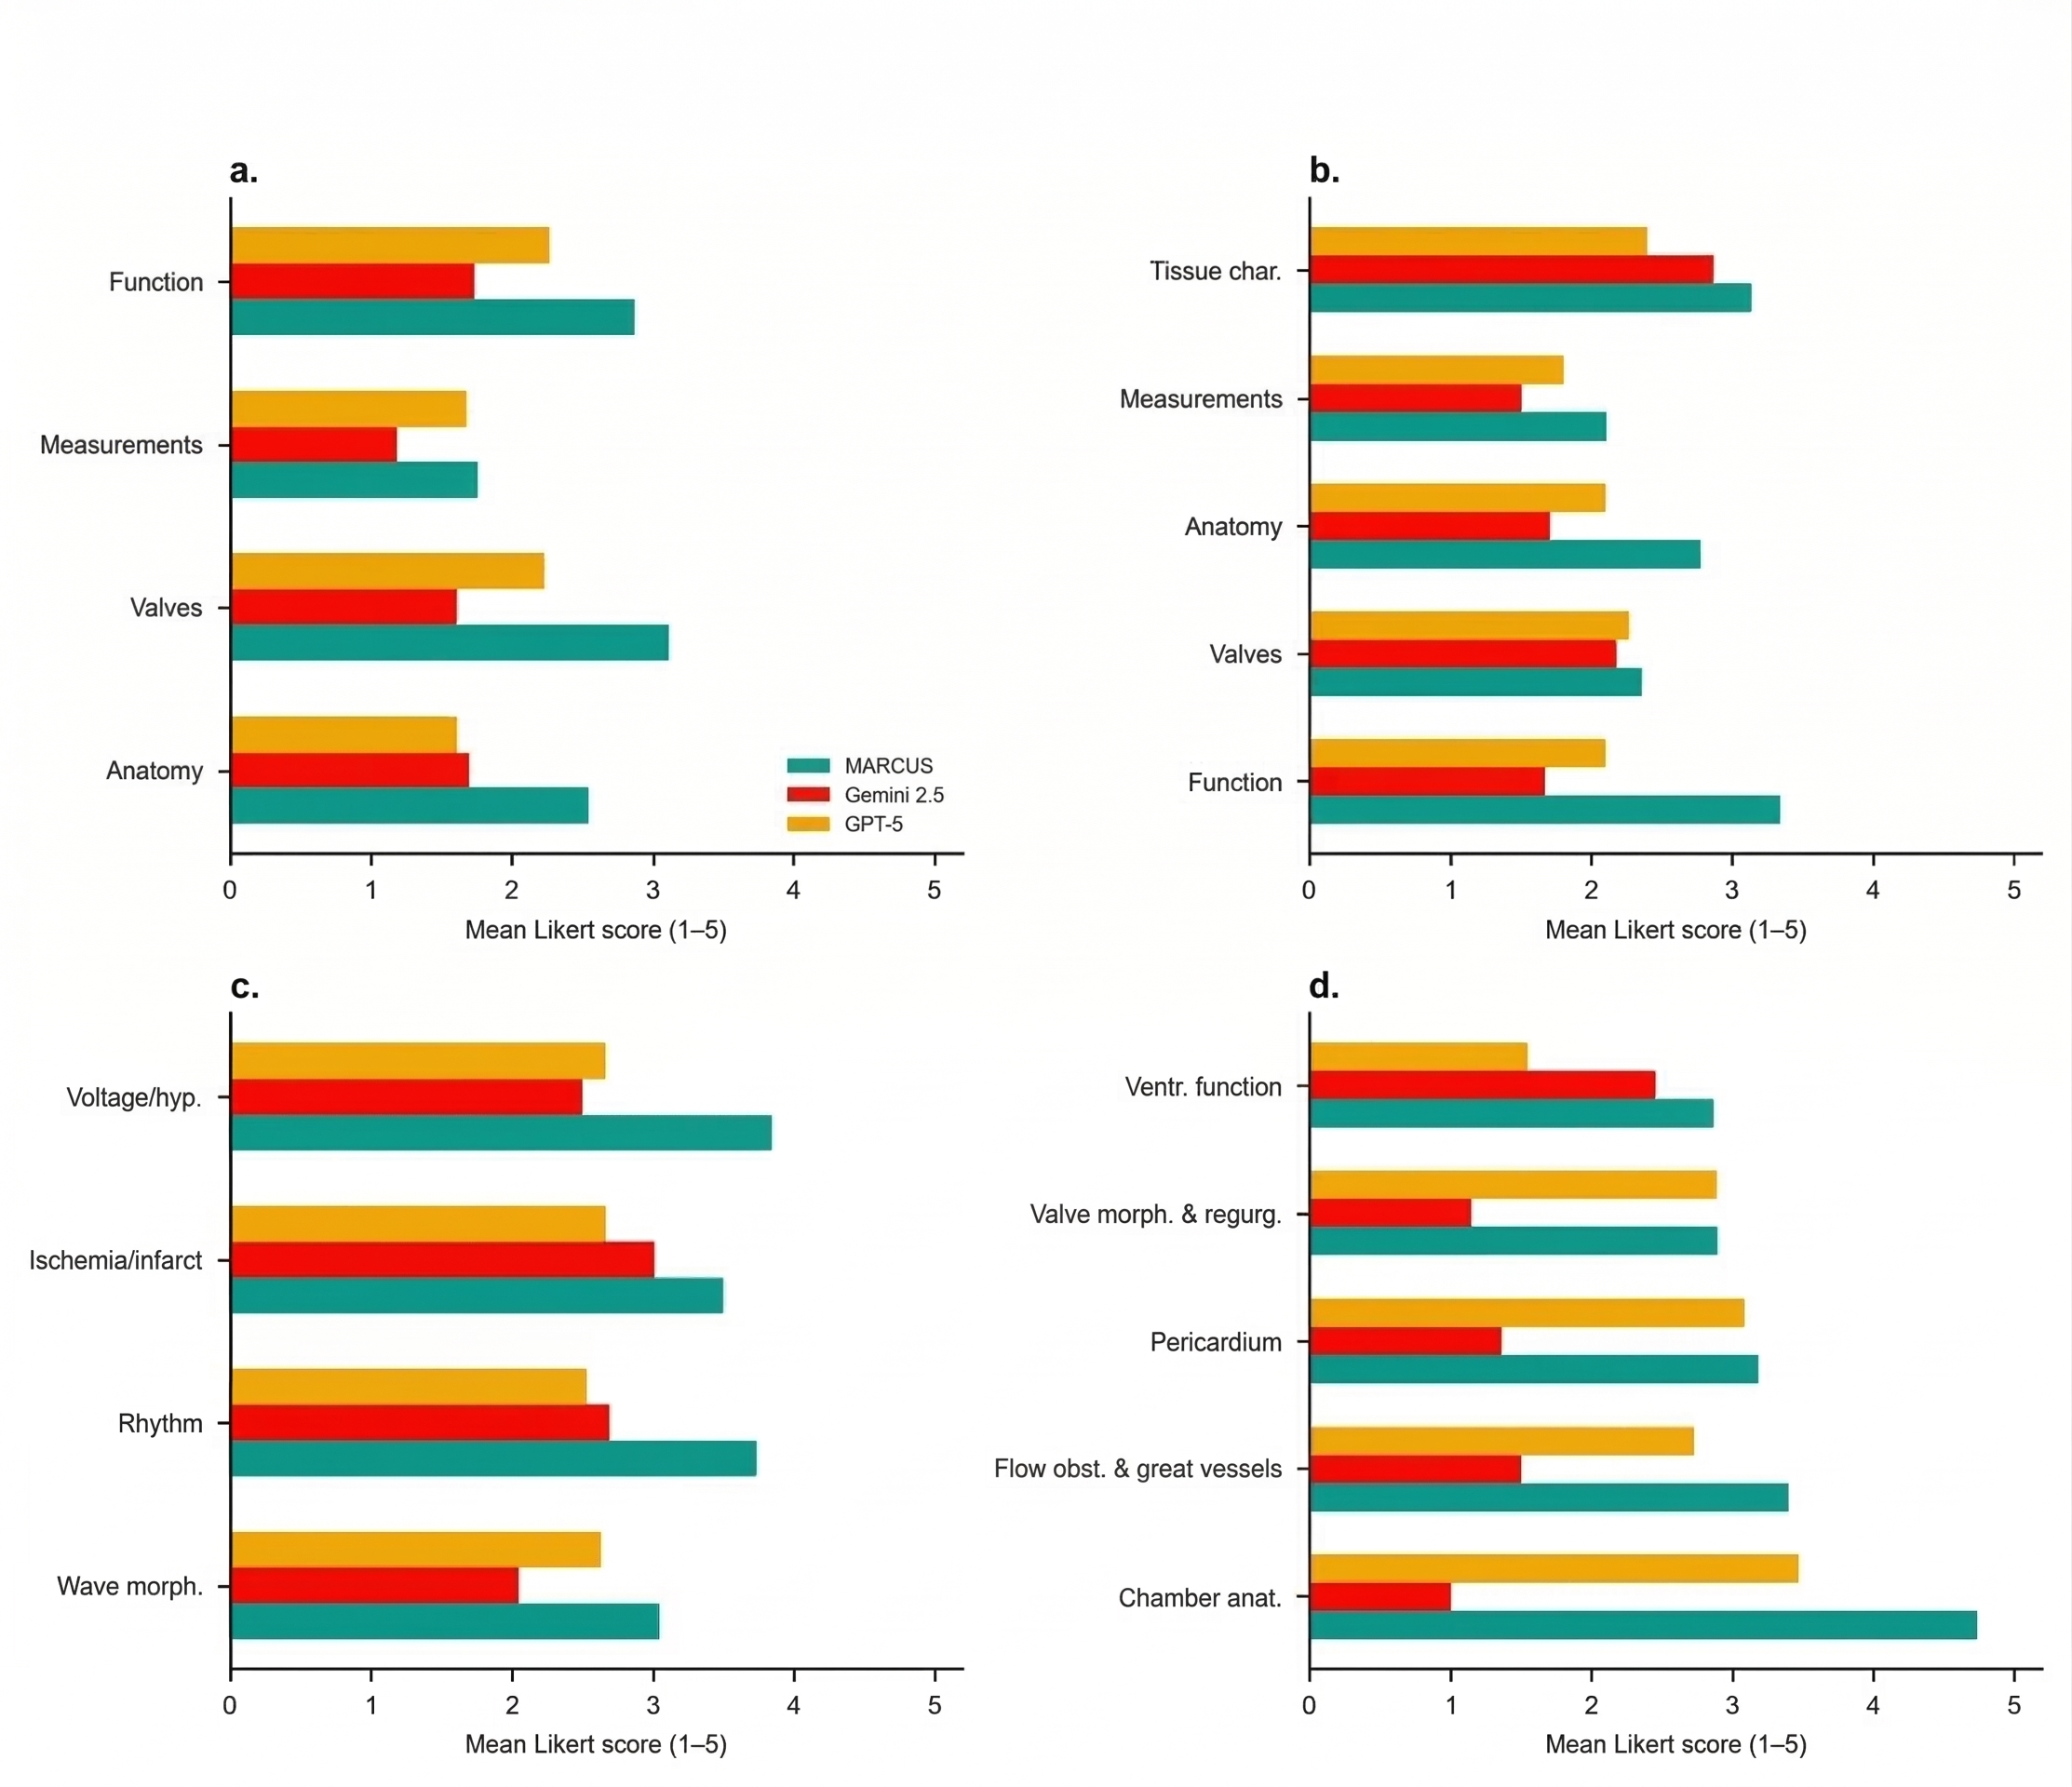
Questions cover anatomy, valves, function and measurements for imaging; morphology, rhythm, ischemia and voltage for ECG; and seven cross-modal domains including ventricular function, regurgitation, chamber anatomy, flow obstruction, vessels and pericardium.
1.4 Model Evaluation
Use the same question sets for the three models, automated Likert grading for VQA, and regular-expression extraction of MCQ answer letters. Unparseable or missing responses affect the model-specific sample sizes in later tables.
2 UCSF Question External Validation Dataset
The UCSF validation cohort supplies independent clinical studies and report-derived questions, with anonymized study and response content.
2.1 Dataset Overview
Evaluate MARCUS and GPT-5 on UCSF echo, CMR and ECG. Gemini is absent from this external cohort, so its Stanford performance should not be read as cross-site validation.
2.2 Dataset Composition
Table 2 lists roughly 1,274 unique studies, 19,565 VQA questions and 19,262 MCQs. The surrounding prose instead says 19,841 VQAs. Preserve the table and report the discrepancy rather than treating either total as independently verified.
2.3 Model Evaluation
MARCUS is sampled on 1,000 questions per modality/task; full MCQ results are also computed on 10,345 echo, 6,226 CMR and 2,691 ECG items. GPT-5 uses 200 per modality/task, specifically gpt-5-2025-08-07. The paper does not fully map every plotted statistic to these overlapping subsets.
3 Public datasets for external validation
Public cohorts from France, the UK, the US and Germany provide reports, structured labels or validated annotations as question-answer sources. Table 3 preserves all test-item counts; these heterogeneous labels are not interchangeable with independently adjudicated clinical diagnoses.
| Dataset | Modality | Country | MCQ | VQA |
|---|---|---|---|---|
| ACDC | Cardiac MRI | France | 520 | 50 |
| UK Biobank | Cardiac MRI | UK | 337 | 29 |
| MIMIC-IV-ECHO | Echo | USA | 4,795 | 750 |
| MIMIC-IV-ECG | 12-lead ECG | USA | 3,000 | 479 |
| PTB-XL | 12-lead ECG | Germany | 1,676 | 321 |
ACDC.
ACDC contributes 100 cine-MRI studies with diagnostic classes and end-diastolic/end-systolic short- and long-axis views. Evaluation has 520 MCQs and fifty VQAs.
UK Biobank.
UK Biobank supplies sampled short-axis and two-/three-/four-chamber cines with derived ventricular phenotypes. Evaluation uses 337 MCQs and 29 VQAs. ViTa was pretrained on this resource; exact subject disjointness from its pretraining set is not described here.
MIMIC-IV-ECHO.
MIMIC-IV-ECHO pairs echocardiograms with clinical interpretation reports. The evaluation contains 4,795 MCQs and 750 VQAs.
MIMIC-IV-ECG.
MIMIC-IV-ECG provides twelve-lead, ten-second, 500-Hz waveforms with reports. MARCUS receives rendered 4×3 grids; EchoNext receives waveforms. Counts are 3,000 MCQs and 479 VQAs, with a smaller mean-Likert subset later.
PTB-XL.
PTB-XL supplies cardiologist-validated diagnostic codes and statements. Evaluation uses 1,676 MCQs and 321 VQAs; MARCUS receives the same ECG grid format as elsewhere.
4 MARCUS Architecture and Training Details
The supplement specifies training hyperparameters, compute, answer-based reinforcement learning and token-overlap mirage checks.
4.1 Hyperparameter Table
Table 4 retains every setting across three stages. Learning rates decrease 2×10⁻⁴→10⁻⁵→10⁻⁶; epochs are 3, 5 and 15. Stage 1 trains vision/projection, stage 2 the full model, and stage 3 the policy against a frozen reference. The prose’s “Table S3” points to the hyperparameter table numbered 4.
| Parameter | Stage 1 (Pretrain) | Stage 2 (SFT) | Stage 3 (GRPO) |
|---|---|---|---|
| Base model | Qwen2.5-VL-3B-Instruct | Qwen2.5-VL-3B-Instruct | Qwen2.5-VL-3B-Instruct |
| Trainable | Vision encoder + MLP | Full model | Full model (policy) |
| Frozen | Qwen2 LLM | None | Reference model |
| Learning rate | 2.0e-4 | 1.0e-5 | 1.0e-6 |
| LR scheduler | Cosine | Cosine | — |
| Warmup ratio | 0.05 | 0.05 | — |
| Epochs | 3 | 5 | 15 |
| Batch size /device | 8 (ECG) | 4 (ECG), 2 (Echo/CMR) | 32 (train), 16 (val) |
| Grad. accumulation | 4 | 8 | — |
| Optimizer | AdamW | AdamW | AdamW |
| Weight decay | 0.0 | 0.01 | — |
| Max grad norm | 1.0 | 1.0 | — |
| Precision | BF16 + TF32 | BF16 + TF32 | BF16 |
| Max tokens | 1,024 | 2,048 | 5,000 + 512 |
| Validation split | — | 1% | Separate parquet |
| GRPO group size | — | — | 4 |
| KL loss coeff. | — | — | 0.01 (low_var_kl) |
| Entropy coeff. | — | — | 0 |
| Rollout backend | — | — | sglang |
4.2 Hardware and Training Times
Pretraining uses four H100 80-GB GPUs for ECG (~12 h) and eight for echo (~48 h) or CMR (~72 h). SFT uses eight GPUs for ~24 h per modality; GRPO uses eight for ~36 h each. FSDP shards training. The stated eight-process launcher for stages 1–2 is not reconciled with the four-GPU ECG pretraining configuration.
torchrun --nproc_per_node=8
4.3 GRPO Reward Function
Generate four responses per prompt; reward 1 for an extracted correct MCQ letter and 0 otherwise. Regex patterns recognize several answer formats. Use the group mean as baseline, clipped policy updates without a learned critic, and a KL penalty of 0.01.
This objective rewards final-answer matching, not independently verified reasoning traces. The KL term regularizes updates but does not guarantee elimination of reward hacking, hallucination or mode collapse.
4.4 Mirage Analysis
The three exact rephrasing templates are retained below. Consistency is mean pairwise Jaccard token similarity among image-present answers. Divergence is one minus their mean similarity to the image-absent answer; confidence averages the two.
Flag image-absent similarity above 0.85, equivalent to divergence below 0.15. Token overlap can vary with phrasing and shared correct findings; no independent calibration or proof of visual dependence is supplied.
{question}
Please describe {subject} as seen in the provided {modality} data.
Based on the {modality} provided, answer the following: {question}
5 Single-modality cardiac AI model inference protocols
Specialist evaluation depends on input formatting, output conversion, scope selection and scoring. These details explain why its rates differ from the earlier frontier-model results.
5.1 Clinical-deployment-fairness rule and scope of evaluation
The authors’ “clinical-deployment-fairness” rule includes all external questions even when specialists were not trained to answer them. Their rationale is broad standalone coverage, citing clinical-impact challenges and responsible health ML.
This is an evaluation choice, not an established requirement that a specialist must attempt every question. Out-of-scope penalties confound breadth with intended-task accuracy. Stanford additionally uses an in-scope EchoNext subset; deployment claims should retain that distinction.
5.2 EchoNext (ECG)
EchoNext predicts twelve structural-heart-disease probabilities from ECG waveforms. Downsample 500→250 Hz, rederive dependent leads, remove baseline wander with 0.2/0.6-s median filters, clip and normalize each lead. The exact twelve target definitions are preserved below.
Of 3,516 Stanford ECG questions, 247 keyword-match its scope. After deterministic positive/negative option mapping, compare 153 MCQs and 62 VQAs. Use threshold 0.5; exclude options lacking a matching presence/absence pole. External out-of-scope items are counted incorrect.
For mean Likert, list all twelve probabilities with an out-of-scope notice in a pseudo-report. Paired mean-Likert counts are 62 Stanford, 263 MIMIC and 237 PTB-XL, smaller than external binary-VQA totals of 479/321.
EchoNext28 is a 1D residual convolutional neural network trained on over one million paired ECG–echocardiogram studies to detect structural heart disease from 12-lead ECG waveforms. The released checkpoint produces twelve independent sigmoid probabilities (LVEF %, LV wall thickness cm, moderate-or-greater aortic stenosis, aortic regurgitation, mitral regurgitation, tricuspid regurgitation and pulmonary regurgitation, moderate-or-greater right-ventricular systolic dysfunction, moderate-or-large pericardial effusion, pulmonary-artery systolic pressure mmHg, peak tricuspid regurgitation velocity m/s, and a composite structural-heart-disease label).
5.3 EchoPrime (echocardiography)
EchoPrime processes all clips from 117 Stanford studies: median 43, range 20–60. Its view-informed embedding retrieves a report. GPT-4o at temperature zero maps that report to an MCQ letter or a one-sentence VQA answer, then judges free text against ground truth.
Paired counts are 9,008 Stanford MCQs/4,980 VQAs and 4,795/750 external items. Scores therefore include a report-to-answer conversion step; many questions share the same study.
5.4 PanEcho (echocardiography)
PanEcho supplies forty structured measurements/findings, including Doppler-derived indices. Convert these to a pseudo-report and use the same two-stage GPT-4o pipeline. Counts are 9,017 Stanford MCQs/3,088 VQAs and 4,795/750 MIMIC items.
5.5 ViTa (cardiac MRI)
ViTa predicts eighteen quantitative phenotypes. Format inputs at 128×128, six short-axis slices, 25 frames and three long-axis views. Repeat slices when fewer than six exist, zero-fill missing long-axis views and set tabular covariates to zero.
Only 181 of 200 Stanford studies preprocess successfully; nineteen lack recognized short-axis cine series. Convert predictions with normal-range annotations into pseudo-reports, then score 3,357 MCQs/2,705 VQAs. External counts are 520/50 for ACDC and 337/29 for UK Biobank. Missing views, zero covariates and preprocessing exclusions qualify the comparison.
5.6 MARCUS evaluation
Within each specialist comparison, score MARCUS on the same retained items. This pairing does not make the different specialist cohorts or their output scopes identical.
5.7 Sample sizes for paired single-modality model comparisons
Table 5 retains every paired sample count and distinguishes binary VQA from mean-Likert subsets. It also explicitly records EchoNext’s external out-of-scope penalty.
| Cohort | Modality / dataset | Single-modality model | MCQ | VQA (binary) | VQA (mean Likert) |
|---|---|---|---|---|---|
| Stanford internal test set | |||||
| Stanford | ECG (in-scope) | EchoNext | 153 | 62 | 62 |
| Stanford | Echo | EchoPrime | 9,008 | 4,980 | 4,980 |
| Stanford | Echo | PanEcho | 9,017 | 3,088 | 3,088 |
| Stanford | CMR | ViTa | 3,357 | 2,705 | 2,705 |
| External multi-country public test sets | |||||
| External | MIMIC-IV-ECG (USA) | EchoNext | 3,000 | 479 | 263 |
| External | PTB-XL (Germany) | EchoNext | 1,676 | 321 | 237 |
| External | MIMIC-IV-ECHO (USA) | EchoPrime | 4,795 | 750 | 750 |
| External | MIMIC-IV-ECHO (USA) | PanEcho | 4,795 | 750 | 750 |
| External | ACDC (France) | ViTa | 520 | 50 | 50 |
| External | UK Biobank (UK) | ViTa | 337 | 29 | 29 |
6 Supplementary Figures
Supplementary Figures 1–4 preserve expert visual/language connections, orchestration, the three training stages and mirage probing. These diagrams describe the proposed components; the experimental design does not separately establish each component’s causal contribution.
7 MCQ Accuracy with 95% CI and McNemar p-values
Table 6 reports retained-response MCQ accuracies, bootstrap intervals and paired McNemar comparisons. Denominators vary: MARCUS multimodal n=38, GPT-5 n=40 and Gemini n=34; the MARCUS–Gemini pair has n=32. Echo versus GPT-5 has p=0.007, qualifying the main text’s blanket p<0.001 statement.
| Modality | Model | Accuracy | 95% CI / p-value | |
|---|---|---|---|---|
| ECG | MARCUS | 50 | 88.0% | (78.0–96.0%) |
| ECG | GPT-5 | 50 | 48.0% | (34.0–62.0%) |
| ECG | Gemini 2.5 Pro | 47 | 46.8% | (34.0–61.7%) |
| ECG | MARCUS vs GPT-5 (McNemar p) | 50 | — | 0.001 |
| ECG | MARCUS vs Gemini (McNemar p) | 47 | — | 0.001 |
| Echo | MARCUS | 50 | 64.0% | (50.0–78.0%) |
| Echo | GPT-5 | 50 | 34.0% | (22.0–48.0%) |
| Echo | Gemini 2.5 Pro | 48 | 22.9% | (10.4–35.4%) |
| Echo | MARCUS vs GPT-5 (McNemar p) | 50 | — | 0.007 |
| Echo | MARCUS vs Gemini (McNemar p) | 48 | — | 0.001 |
| CMR | MARCUS | 50 | 88.0% | (78.0–96.0%) |
| CMR | GPT-5 | 50 | 58.0% | (44.0–72.0%) |
| CMR | Gemini 2.5 Pro | 50 | 44.0% | (30.0–58.0%) |
| CMR | MARCUS vs GPT-5 (McNemar p) | 50 | — | 0.001 |
| CMR | MARCUS vs Gemini (McNemar p) | 50 | — | 0.001 |
| Multimodal | MARCUS | 38 | 73.7% | (60.5–86.8%) |
| Multimodal | GPT-5 | 40 | 22.5% | (10.0–35.0%) |
| Multimodal | Gemini 2.5 Pro | 34 | 29.4% | (14.7–44.1%) |
| Multimodal | MARCUS vs GPT-5 (McNemar p) | 38 | — | 0.001 |
| Multimodal | MARCUS vs Gemini (McNemar p) | 32 | — | 0.001 |
8 VQA Likert Scores with 95% CI and Mann–Whitney p-values
Table 7 preserves all means, medians, confidence intervals and Mann–Whitney p-values for 100 VQAs per model/modality. Echo and multimodal comparisons against GPT-5 have p=0.041 and 0.036. This unpaired rank test does not use the matched-question structure despite earlier general references to paired testing.
| Modality | Model | Mean | 95% CI (mean) | Median | 95% CI (median) | p-value | |
|---|---|---|---|---|---|---|---|
| ECG | MARCUS | 100 | 3.65 | (3.37–3.91) | 4.0 | (4.0–4.0) | — |
| ECG | GPT-5 | 100 | 2.60 | (2.34–2.87) | 3.0 | (2.0–3.0) | 0.001 |
| ECG | Gemini 2.5 Pro | 100 | 2.55 | (2.29–2.81) | 2.0 | (2.0–3.0) | 0.001 |
| Echo | MARCUS | 100 | 2.41 | (2.14–2.69) | 2.0 | (2.0–3.0) | — |
| Echo | GPT-5 | 100 | 1.97 | (1.75–2.20) | 2.0 | (1.0–2.0) | 0.041 |
| Echo | Gemini 2.5 Pro | 100 | 1.47 | (1.31–1.65) | 1.0 | (1.0–1.0) | 0.001 |
| CMR | MARCUS | 100 | 2.91 | (2.62–3.21) | 3.0 | (2.0–3.0) | — |
| CMR | GPT-5 | 100 | 2.19 | (1.94–2.45) | 2.0 | (1.0–2.0) | 0.001 |
| CMR | Gemini 2.5 Pro | 100 | 1.95 | (1.69–2.22) | 1.0 | (1.0–1.0) | 0.001 |
| Multimodal | MARCUS | 100 | 3.28 | (2.92–3.64) | 4.0 | (2.0–5.0) | — |
| Multimodal | GPT-5 | 100 | 2.69 | (2.33–3.06) | 2.0 | (1.0–3.0) | 0.036 |
| Multimodal | Gemini 2.5 Pro | 100 | 1.46 | (1.25–1.70) | 1.0 | (1.0–1.0) | 0.001 |
9 Per-Category VQA Statistics
The source names Table_S5_PerCategory_VQA_Stats.csv as a separate supplement. Reported examples include ECG pacing 5.00 on three items, arrhythmia 4.50 on six, CMR pathology 3.83 on six and multimodal wall motion 1.00 on seven. These small-cell extremes are not broad clinical reliability estimates; the full CSV is not embedded here.
10 MARCUS Failure Case Log
The source names Table_S7_MARCUS_Failures.csv for 209 failure records: forty wrong MCQs and 169 VQAs graded at most 2. The PDF provides aggregate analyses, not those complete case rows; this edition does not invent the missing log.
11 Statistical Analysis
The frontier-model analysis uses 5,000 percentile bootstrap resamples, seed 42 and two-sided α=0.05. MCQs use exact McNemar below 25 discordant pairs and continuity correction otherwise; VQA uses Mann–Whitney. Primary modality comparisons receive no multiplicity correction.
Earlier text calls McNemar universally exact and all tests paired, while specialist comparisons use 2,000 resamples and Wilcoxon. Many questions share clinical studies; a study/patient-clustered bootstrap is not specified. Preserve these protocol distinctions rather than overstating the precision of item-level inference.
12 Failure Case Classification
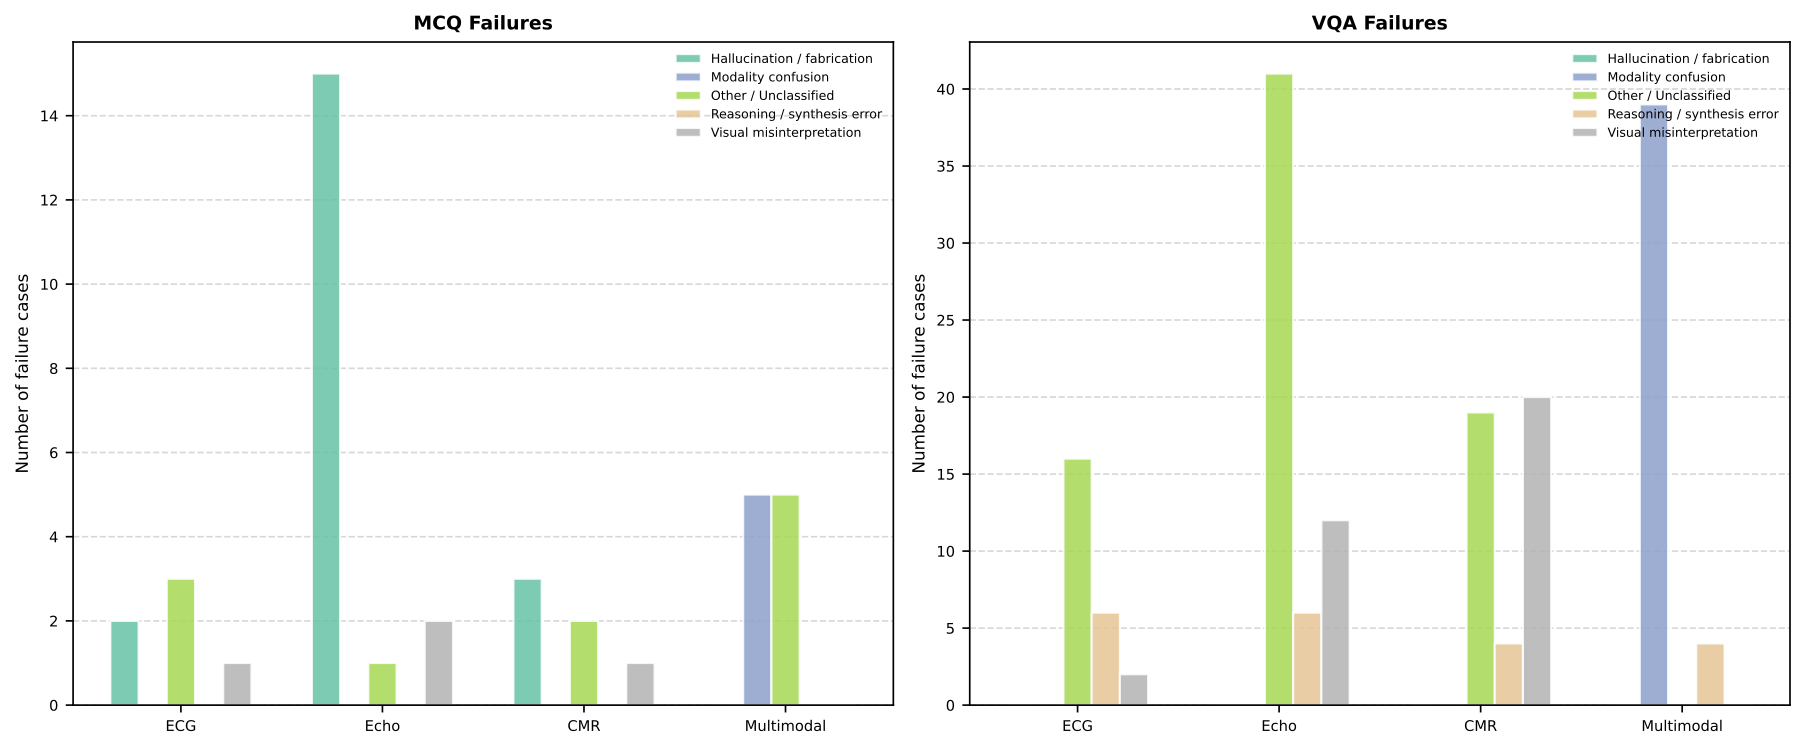
Define MCQ failures as wrong extracted letters and VQA failures as scores ≤2. Assign visual, reasoning, modality-confusion or hallucination labels using keywords in the response plus evaluator explanation; unmatched cases are Other. These are heuristic error categories, not independent clinical adjudication.
13 MCQ Confusion Matrices per Modality
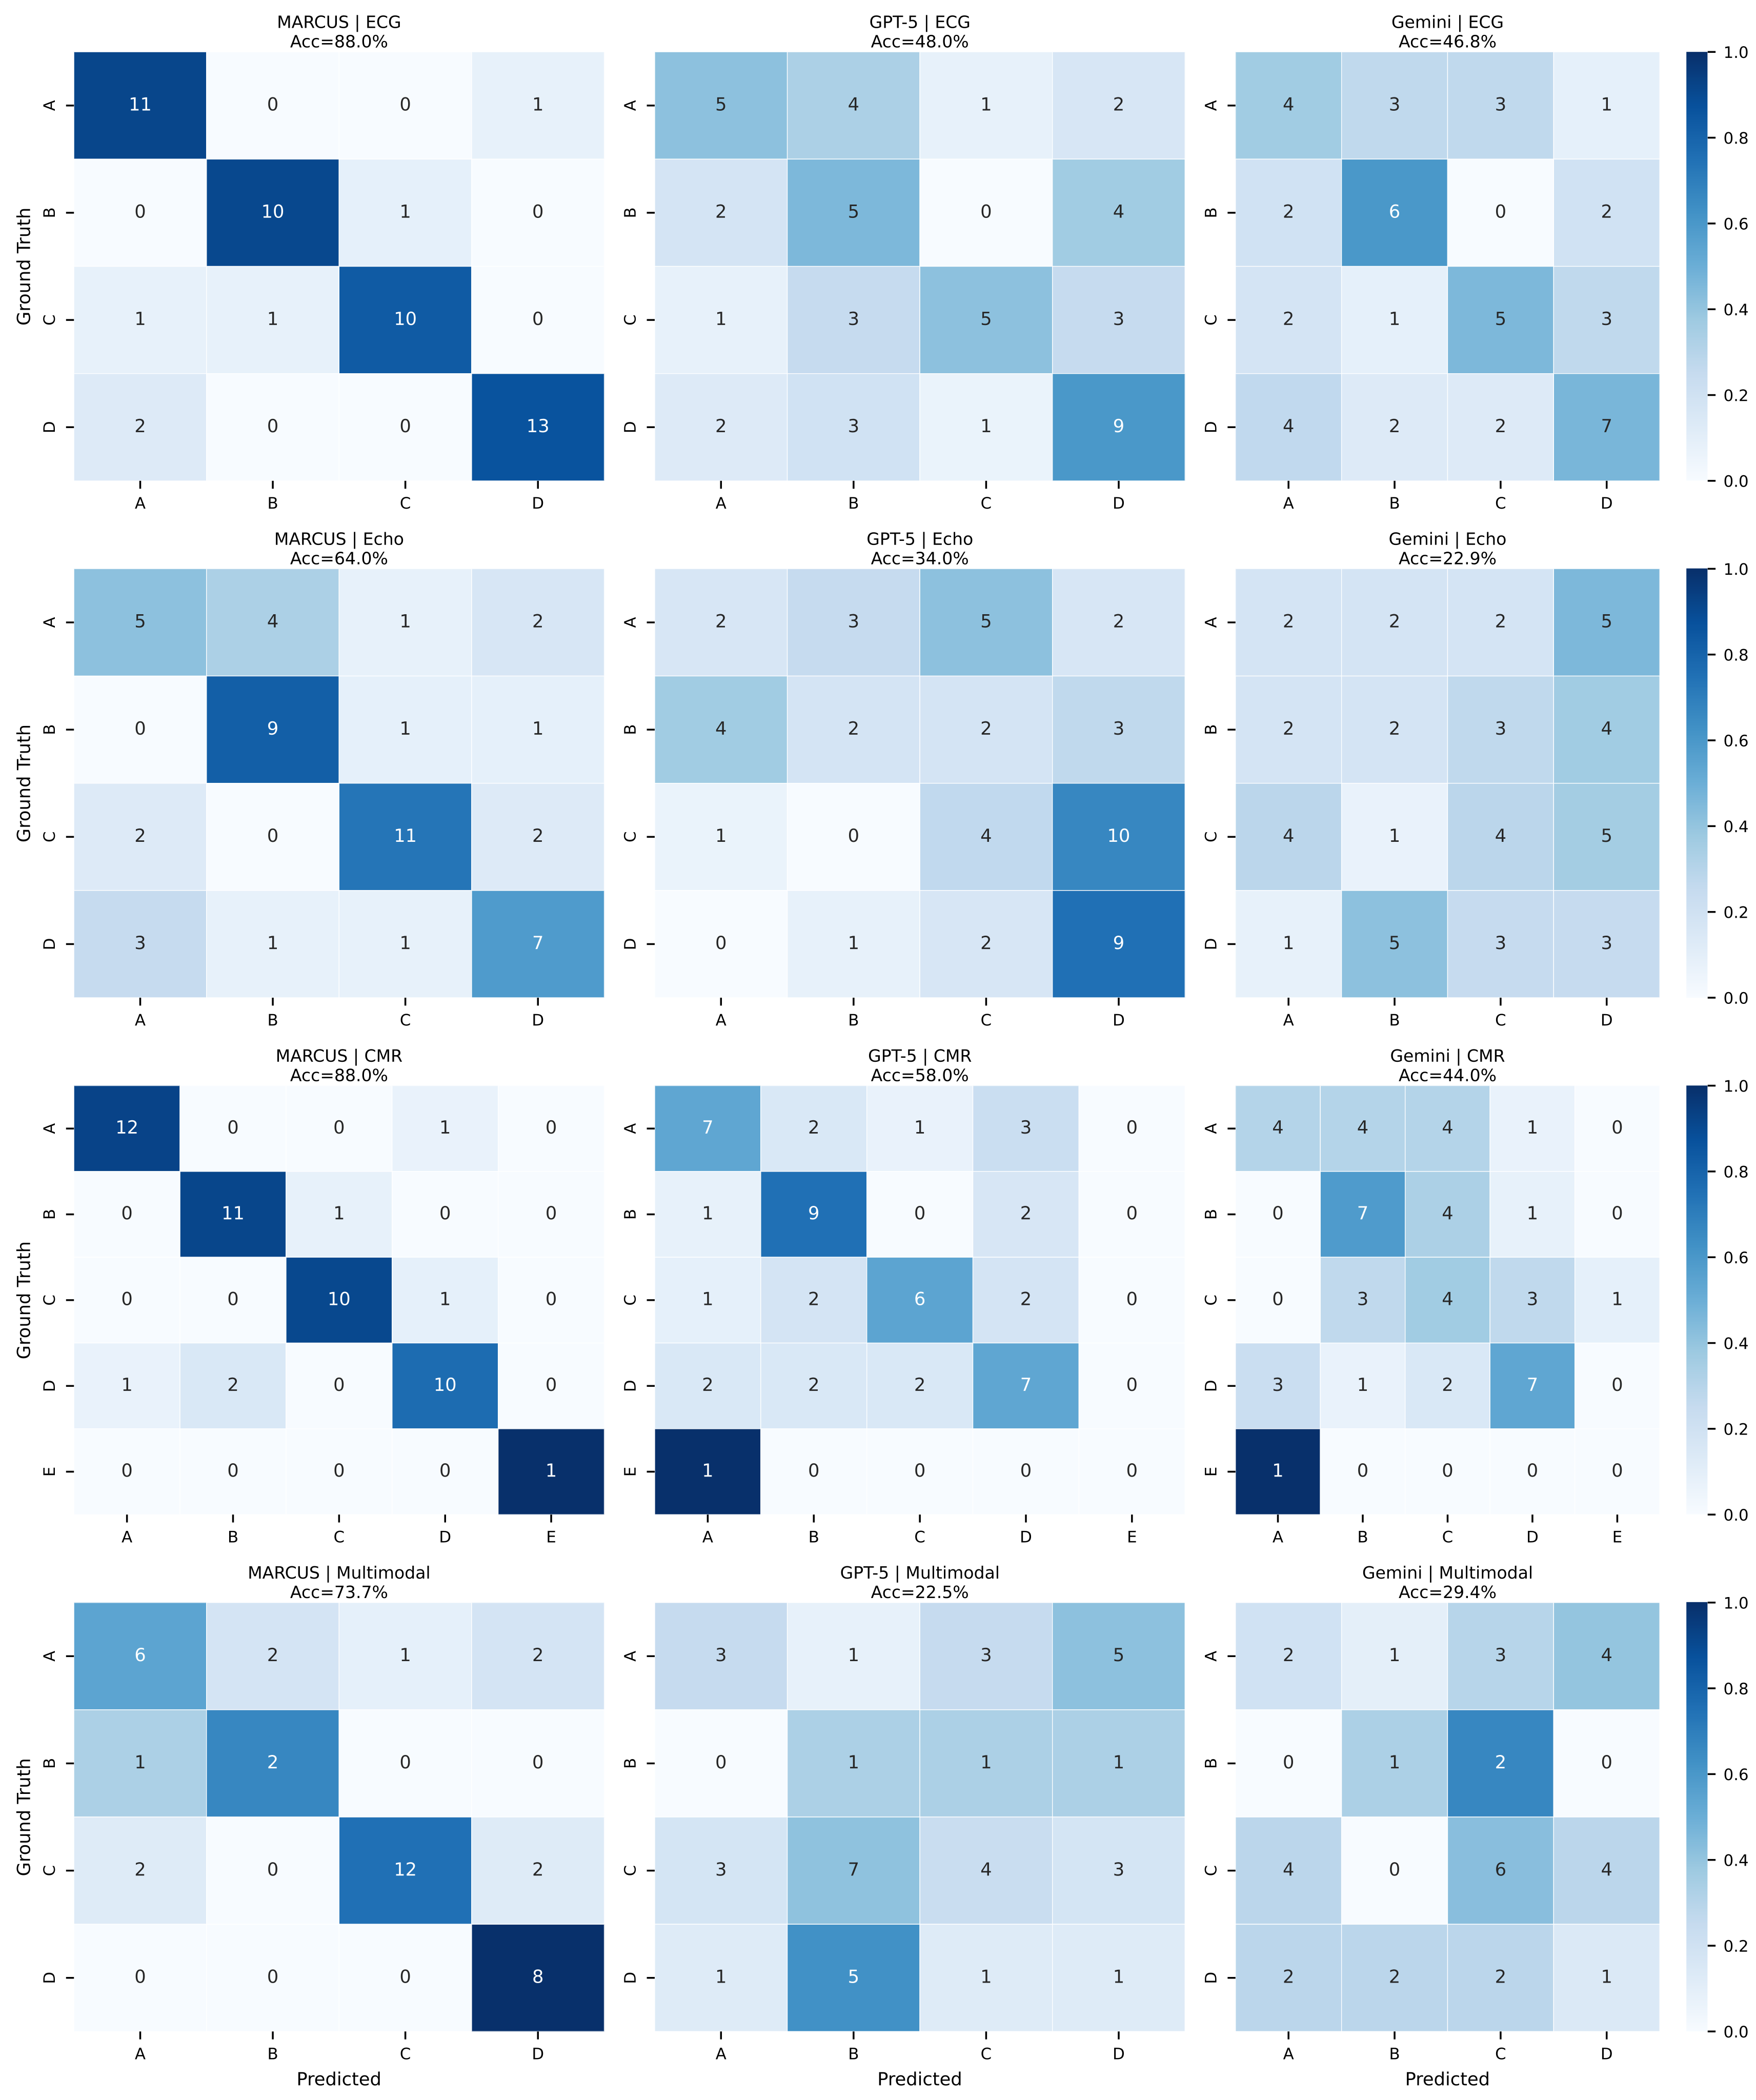
Supplementary Figure 5 contains twelve answer-option confusion matrices. MARCUS rates are 88% ECG, 64% echo, 88% CMR and 73.7% multimodal. Axes are answer letters, not disease classes, so diagonal structure measures option selection.
Frequent “none” responses in comparators are interpreted as hedging, but option frequencies and question design can also influence this pattern; the plot alone does not establish lack of visual grounding.
14 Per-Category VQA Likert Score Heatmaps
All four category heatmaps are retained. Strong small categories include pacing and atrial/LV size, while wall motion averages 1.00 and mitral-regurgitation quantification 1.29. These detailed failures temper the aggregate multimodal advantage.
15 Likert Score Distribution: Violin Plots
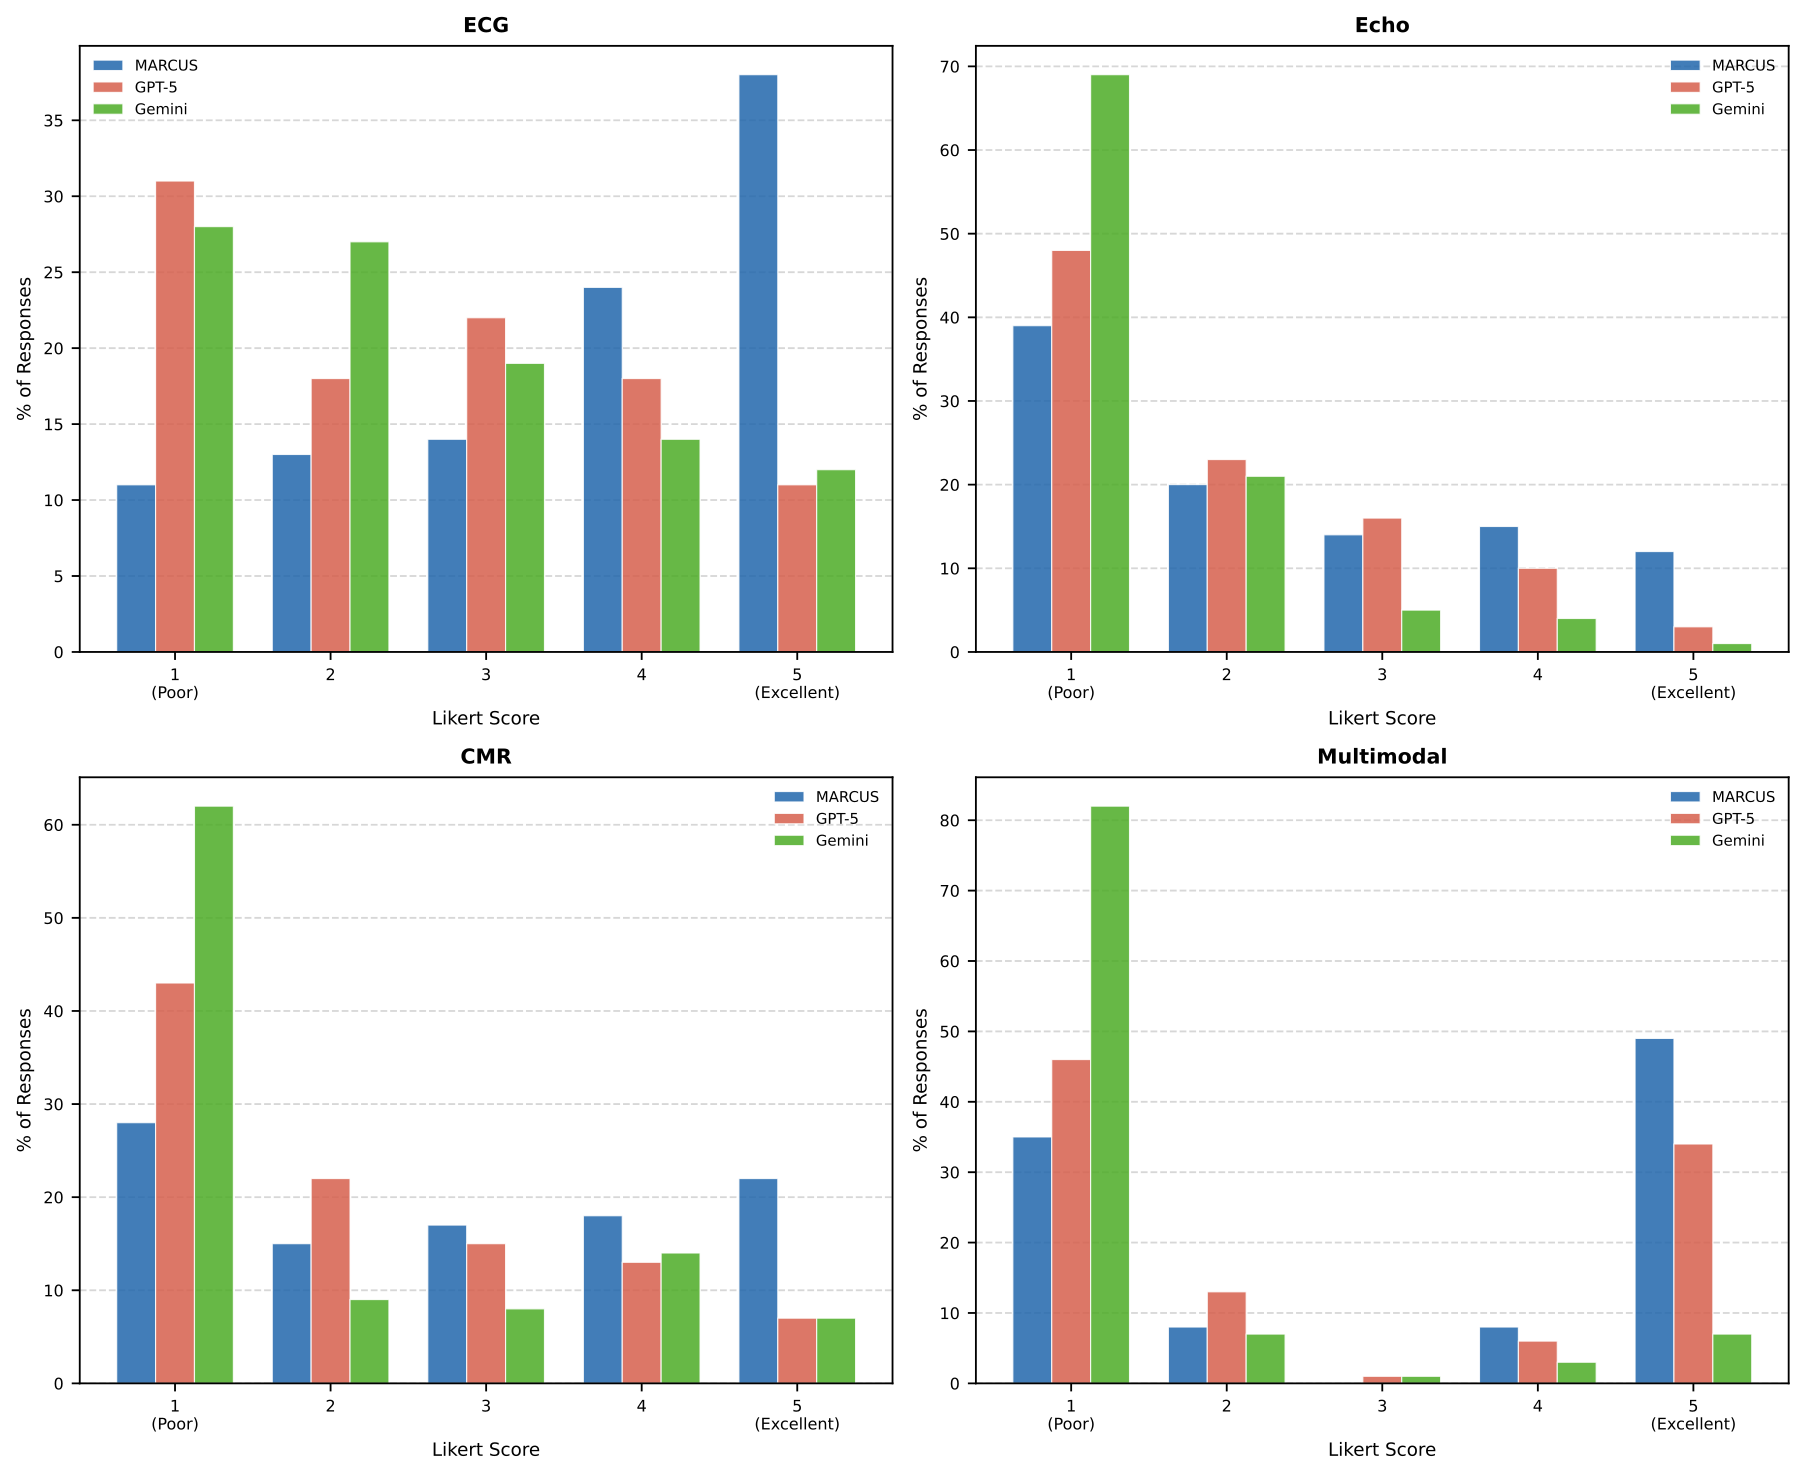
Violin plots and frequency histograms retain the full score distributions. MARCUS medians are 4 for ECG, 2 for echo, 3 for CMR and 4 for multimodal. Echo is concentrated at low scores; multimodal output is bimodal. Mean improvements therefore coexist with many clinically inadequate responses.
16 MARCUS Failure Case Analysis: Error Type Distribution
MARCUS has forty wrong MCQs among 188 retained responses (21.3%) and 169 VQAs graded ≤2 among 400 (42.3%). Echo is weakest: 18/50 wrong MCQs and 59/100 inadequate VQAs. VQA failures are 24% ECG and 43% each CMR/multimodal.
Heuristic coding assigns half of MCQ failures to hallucination/fabrication. VQA failures include 39 modality-confusion, 34 visual and twenty reasoning errors. These counts concern clinical-answer errors and coexist with the separately defined zero image-absent-mirage result.