Overview
MolmoB0T builds robot policies from large-scale simulated expert demonstrations and deploys them without real-robot training or fine-tuning. Its strongest evidence is 79.2% pick-and-place success over 120 real Franka trials, versus 39.2% for the strongest listed DROID baseline. Mobile manipulation is a smaller proof of concept. The latest appendix qualifies the contribution of observation history and reports substantial failures on adapted external benchmarks, so the results support a useful simulation-data recipe within the tested task family rather than unrestricted manipulation generality.
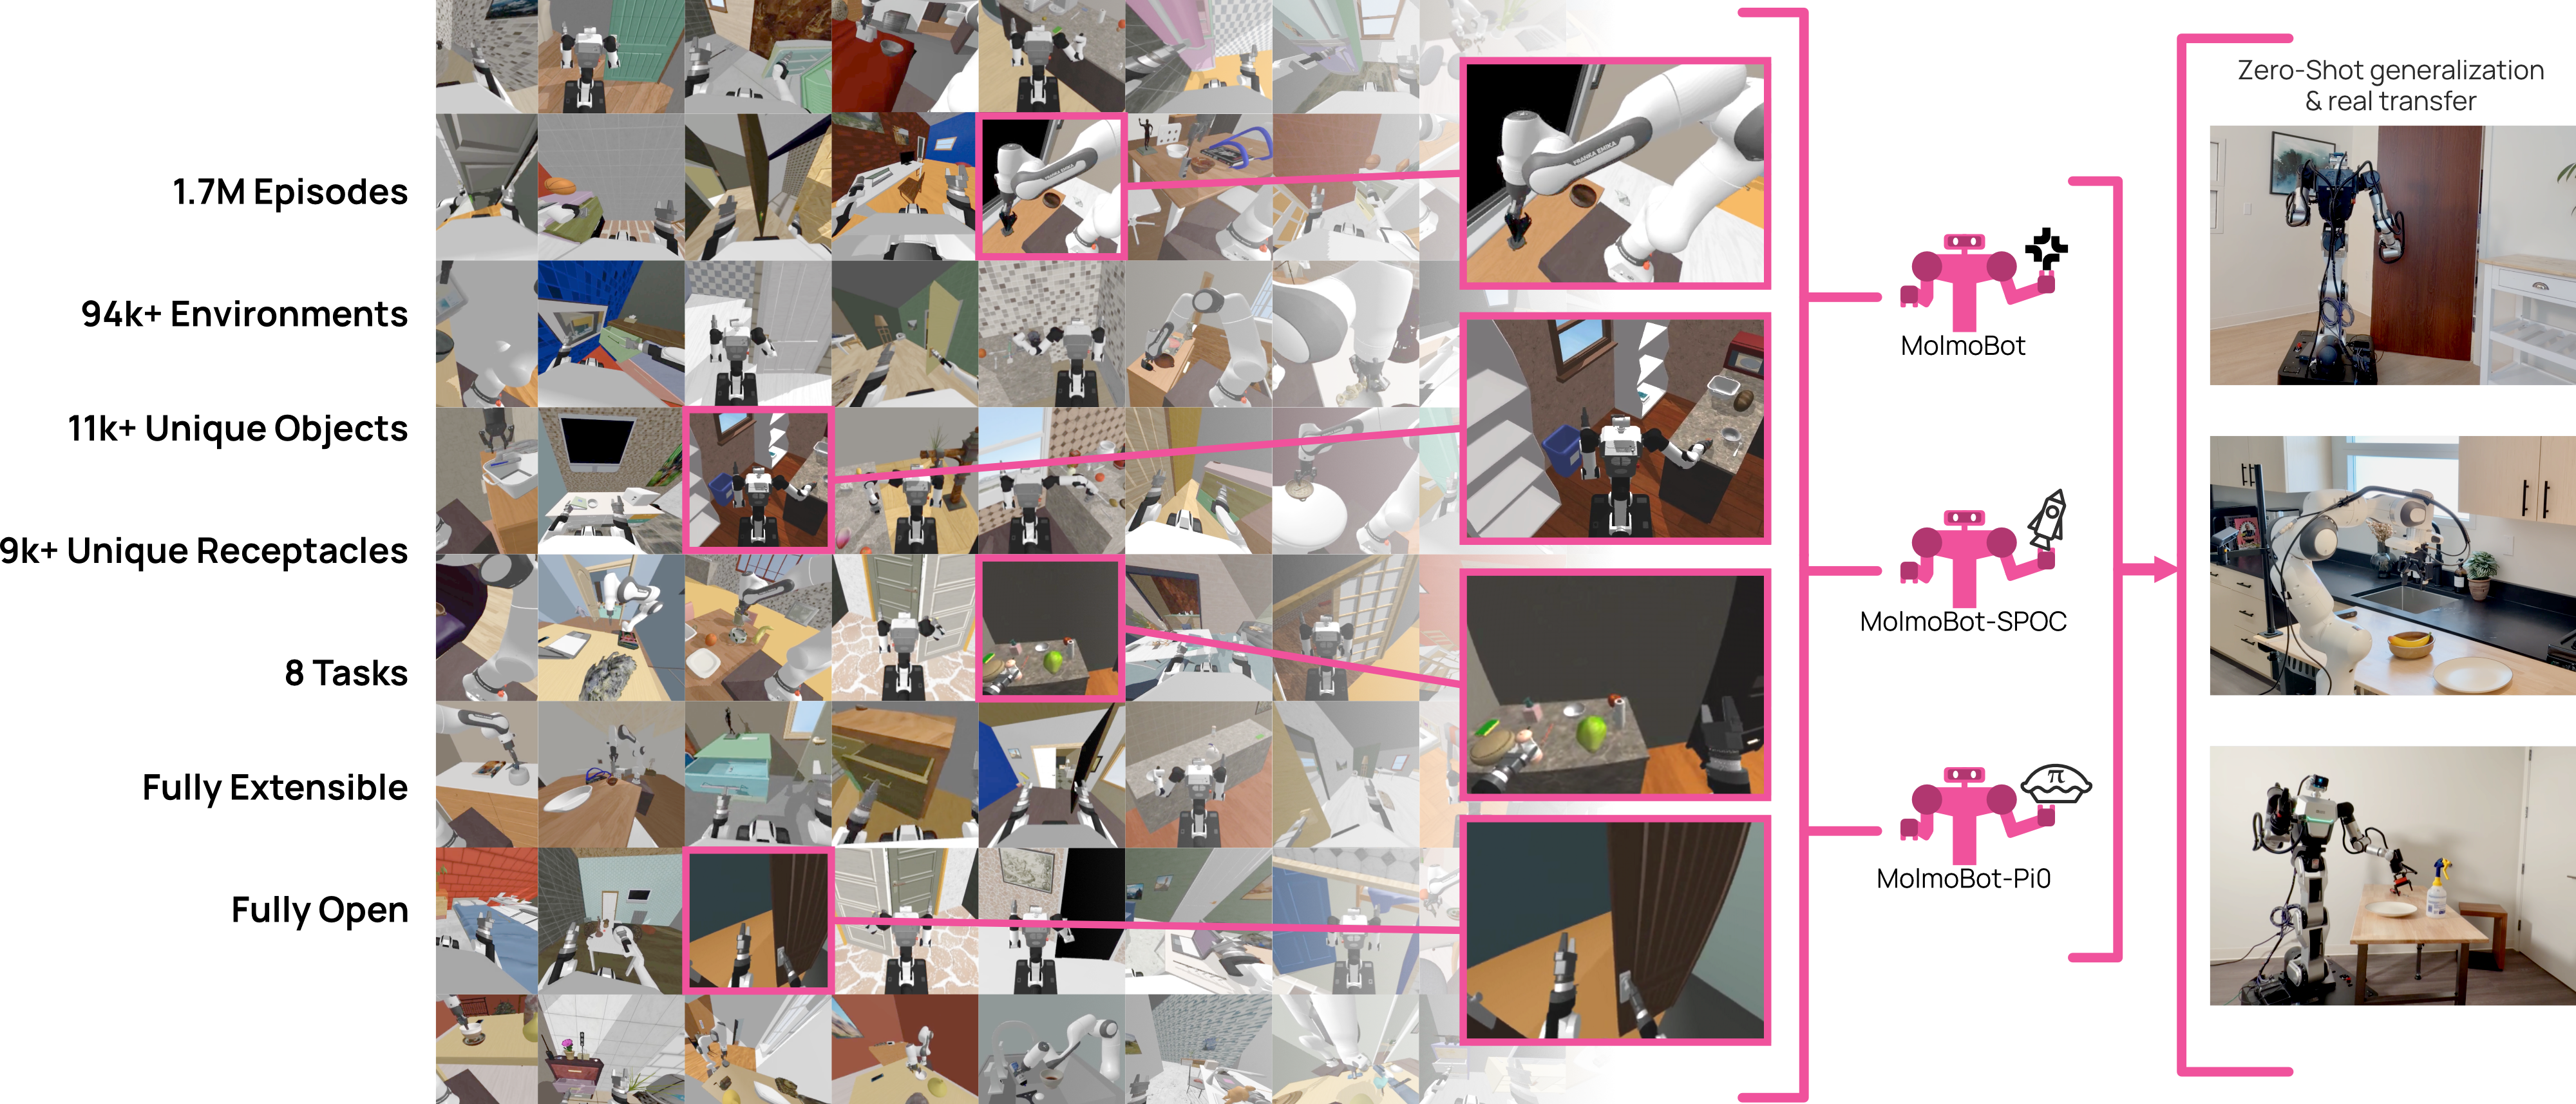
At a glance
MolmoBot-Engine combines procedural environments, randomized assets and sensors, and scripted motion planners. MolmoBot-Data contains 1.7 million episodes across two robot platforms, used to train a large vision-language-action model, a lightweight transformer, and a π0-based policy. The robot training data are entirely simulated; the pretrained visual-language backbones still contain real-world image/text knowledge. All eight original figures and fourteen numbered tables are retained, including the additional controls and external evaluations in version 3.
1 Introduction
Real robot demonstrations are costly to collect and reset, while simulations permit scalable control over objects, viewpoints, and task states. The proposed approach tests whether enough simulated diversity can overcome transfer gaps without subsequent real-robot training. It contributes a procedural collection engine, a 1.7-million-episode dataset, and three policy families. Strong tabletop results coexist with limited mobile evidence and narrower rigid/articulated task coverage; the central claim concerns zero-shot robot-policy transfer, not the absence of real-world visual pretraining.
2 Related Work
Prior work scales imitation through real demonstrations, human videos, and synthetic trajectories, with different collection costs and domain gaps. DROID provides the main real-data baseline setting; MolmoSpaces supplies procedural scenes and assets. Navigation systems already exploit simulated scale, while earlier manipulation systems often specialize or require post-training. MolmoBot combines varied tasks and robot embodiments with scripted experts; its comparisons assess selected policies and datasets rather than every route to general manipulation.
3 MolmoBot-Engine: A Procedural Data Generation Pipeline
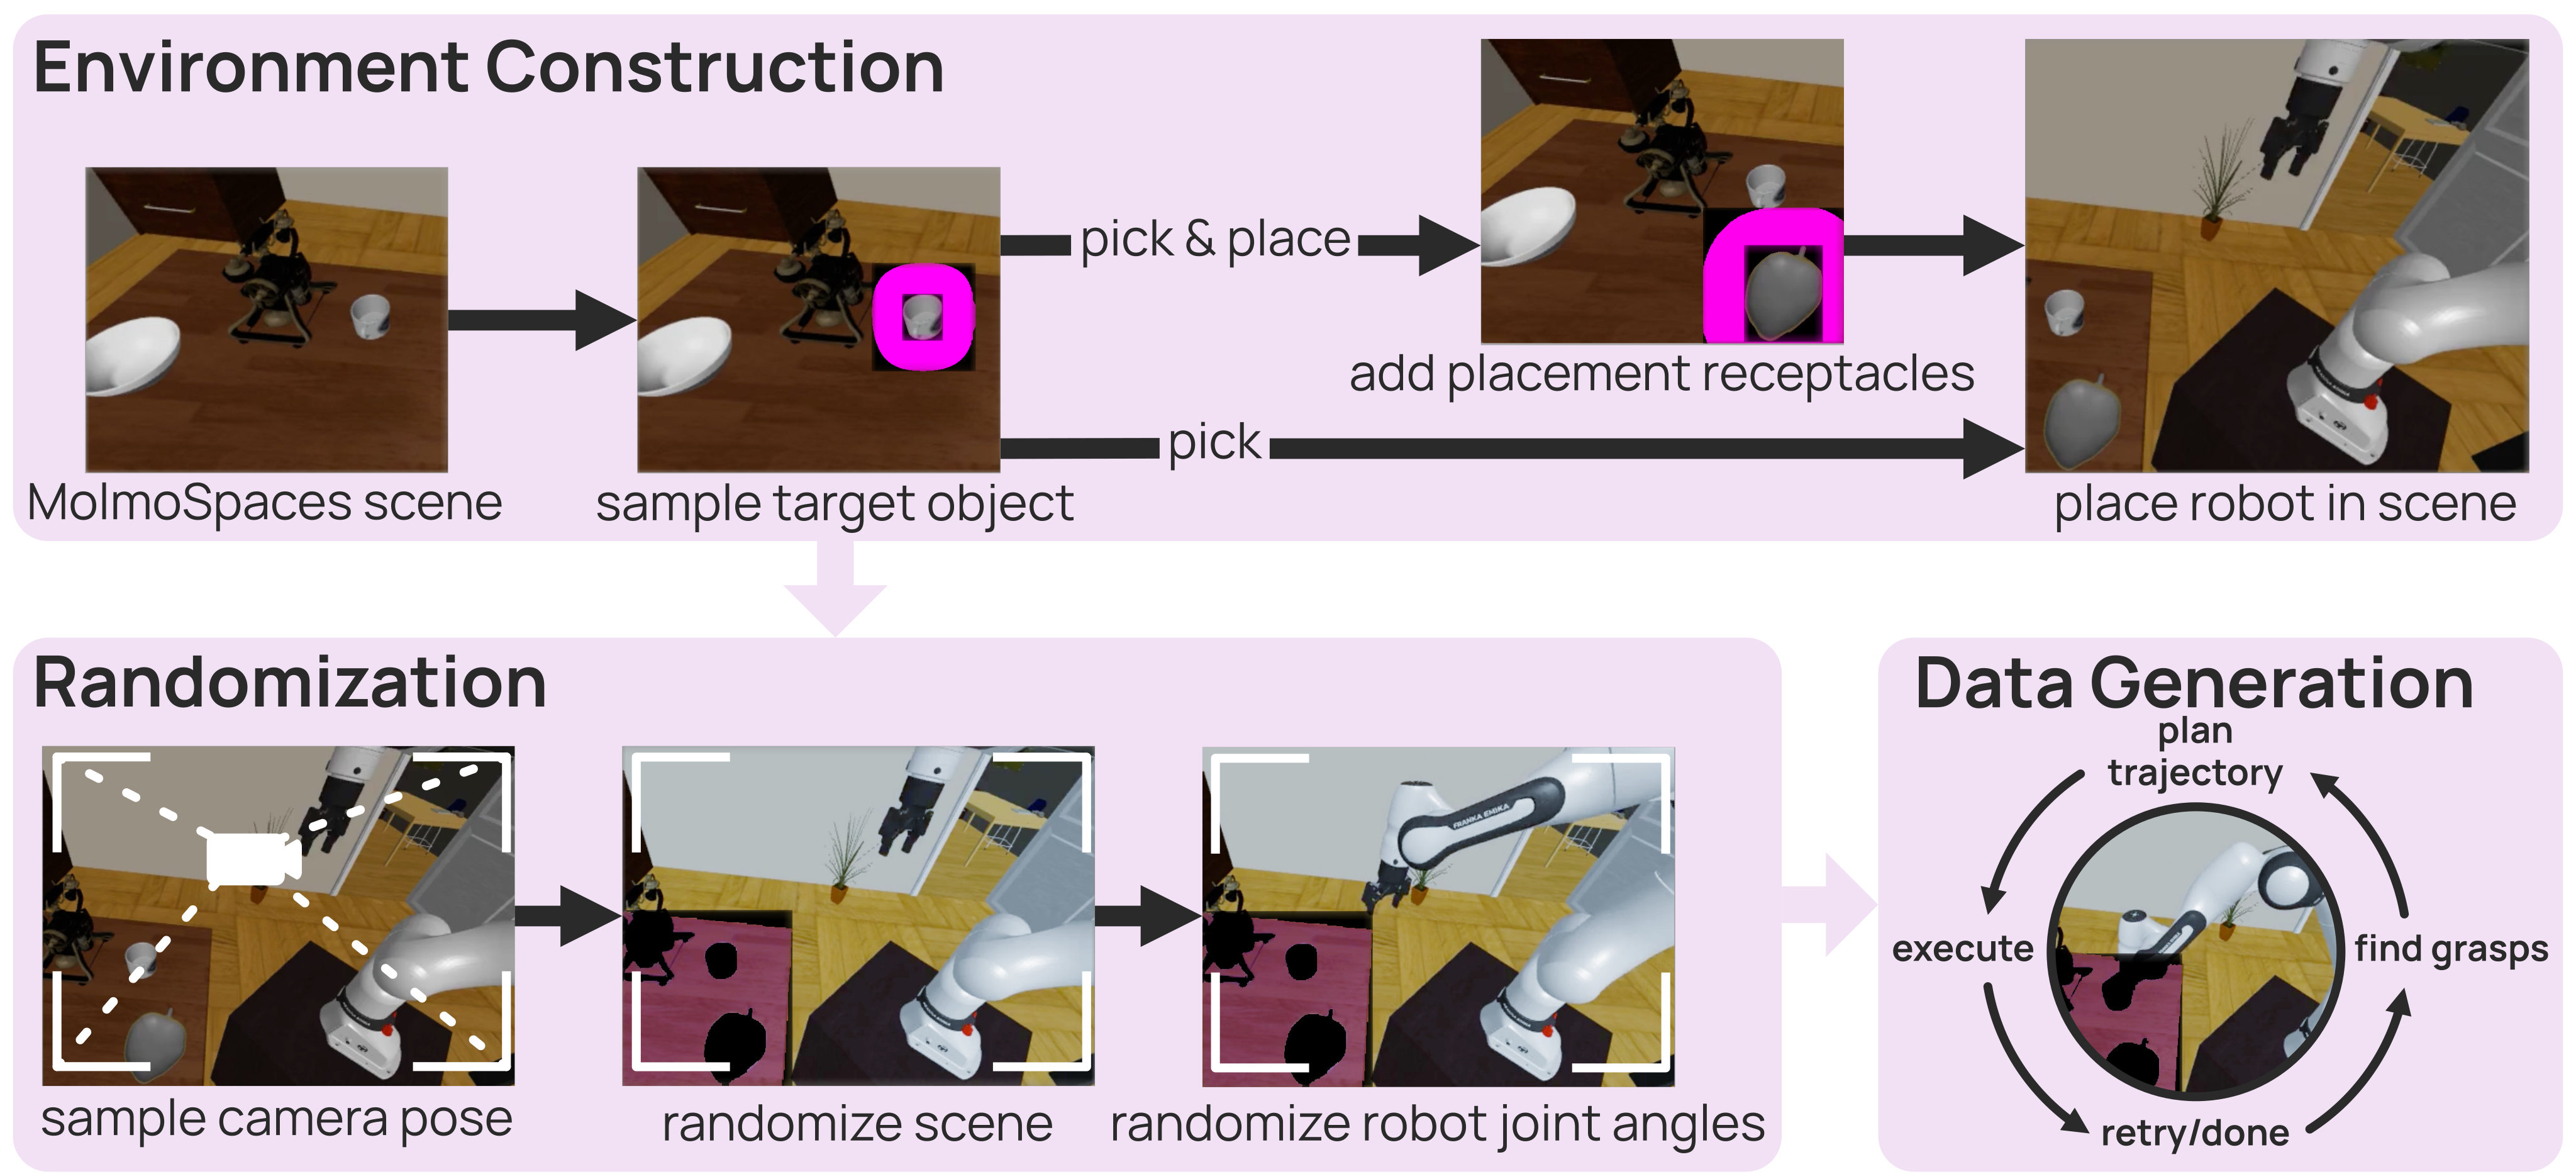
The engine samples an environment, task objects and robot configuration, randomizes appearance and dynamics, then generates a successful expert rollout with recovery attempts. Figure 2 preserves the complete collection loop. Simulation makes repeated sampling inexpensive, but unsuccessful trajectories beyond the retry limit are discarded, so the released experience is filtered rather than an unbiased record of every attempted interaction.
3.1 Environments and Assets
Each episode uses one of more than 200,000 available prebuilt MolmoSpaces scenes; the generated dataset actually spans about 94,200 environments. Static layout and furniture remain fixed while task-specific manipulable objects are added. Rigid assets from iTHOR and Objaverse are filtered for size and watertightness. Randomization covers lights, shadows, textures, friction, inertia, joint damping, object poses, robot actions, and camera calibration. Collision and reachability constraints limit placements to feasible tasks.
3.2 Setup: Robotic Platforms and Tasks
The fixed-base Franka FR3 follows the DROID configuration and runs at 15 Hz. Rainbow RB-Y1 combines a mobile base, six-degree-of-freedom torso, two head joints, and two seven-joint arms. Four rigid-object tasks cover picking and placing into, beside, or into a color-specified receptacle; articulated tasks open nearby mechanisms or doors. Initial arm configurations, expert actions, and cameras are randomized. These six task types produce eight robot/task rows in the dataset statistics.
3.3 Expert Task and Motion Planners
Experts sample stored grasps, reject collisions and unreachable poses, and execute a sequence of task phases. Franka uses inverse-kinematics interpolation; RB-Y1 uses CuRobo to coordinate the larger whole-body configuration. Programmed retries supply recovery examples. Success depends on the sampled task and expert, so scaling also entails rejection sampling and scene setup, not merely faster trajectory playback.
4 Training MolmoBot Policies on Simulated Data
The same simulated collection supports MolmoBot, MolmoBot-SPOC, and MolmoBot-Pi0. Their different capacities and action heads help test whether the data transfer beyond one architecture, although training, pretraining, and compute remain relevant comparison factors.
4.1 MolmoBot: Our Flagship VLA
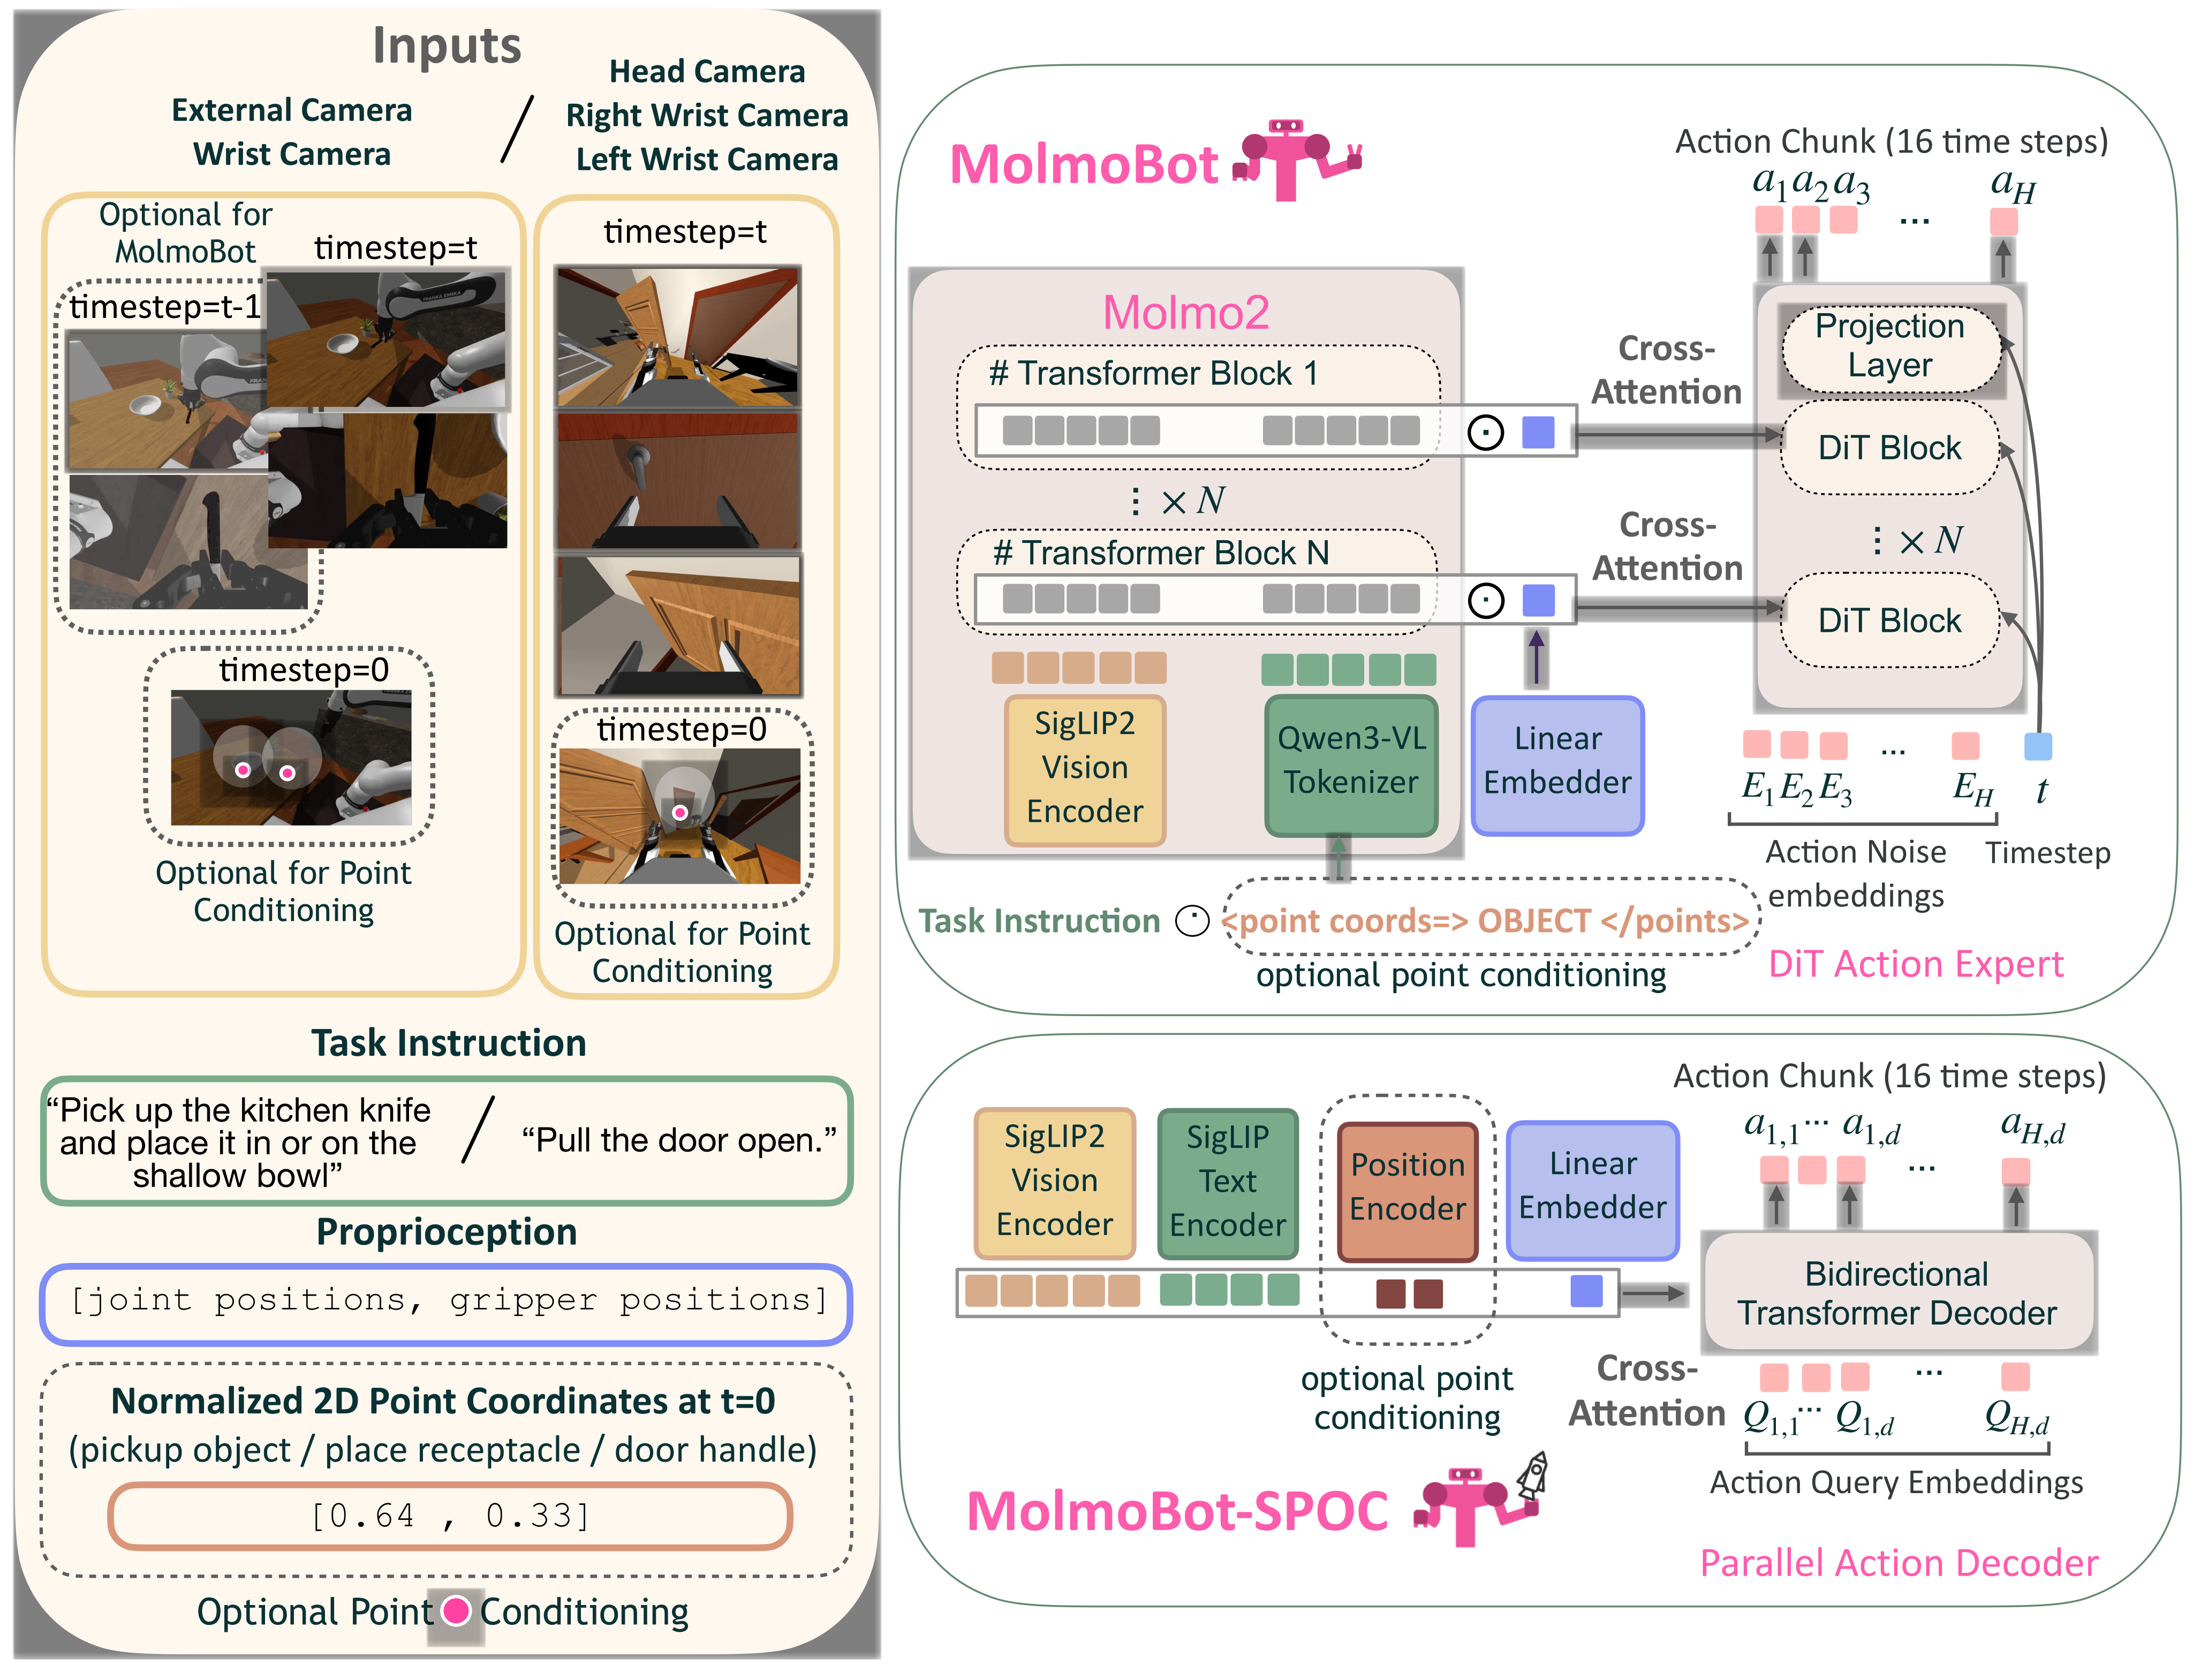
The flagship uses Molmo2-4B for multi-view and multi-frame observations, with its vision encoder frozen. A diffusion-transformer action head has corresponding layers that cross-attend to backbone features; projected proprioception and flow time condition action generation. It predicts sixteen actions and executes eight before replanning. Training upweights retry, successful-grasp, and completion frames by 3×, 2×, and 2×, and samples eight flow-matching times per example to amortize backbone computation.
MolmoBot-Img uses only current images and trains for 200,000 steps for static manipulation or 100,000 for mobile manipulation, at batch size 1,024. H=1 and H=2 add one or two observations about half a second apart and receive another 50,000 steps from the image-only checkpoint. H=1 is the flagship. Appendix C.8 shows why their advantage over the original image-only model cannot be attributed solely to history: the initial comparison also gives them more training.
4.2 MolmoBot-SPOC: A Lightweight Transformer Policy
The 108-million-trainable-parameter SPOC variant combines SigLIP2 visual patch features, SigLIP text features, and projected proprioception. Optional one- or two-point goals become positional tokens. Actions are clipped at the first and ninety-ninth percentiles and discretized into 256 approximately equal-population bins. A bidirectional transformer decodes all action dimensions across a sixteen-step chunk in parallel, supervised by categorical cross-entropy. This compact architecture avoids a large language backbone but performs less strongly in the reported tasks.
4.3 MolmoBot-Pi0: A Systematic Ablation
MolmoBot-Pi0 follows the π0 architecture through openpi, combining PaliGemma-3B and a flow-matching action expert. It trains on simulated data for 200,000 steps with batch size 1,024, learning rate 0.00005, 1,000 warmup steps, and a frozen vision encoder. Its comparison with π0-DROID supports the value of the data recipe. π0.5-DROID additionally changes architecture, so that comparison does not isolate data alone.
5 Experiments
Evaluation covers real tabletop pick-and-place, a small real door-opening study, held-out simulation, and controlled data/model variations. None of the proposed policies receives real-robot task-specific post-training. The expanded appendix also tests camera-matched setups, equal-training-step history variants, and robot-adapted external benchmarks.
| Model | Pick v1 | Pick v2 | Pick v2 (F) | Pick v2 RC (F) | PnP Into (F) | PnP Next-To (F) | PnP Color | Avg. | |
| [4] | 18.12.4 | 6.41.5 | 7.01.6 | 8.01.9 | 11.72.1/7.61.7 | 8.22.2/6.21.9 | 10.41.9/6.71.6 | 10.0 | |
| -Finetune | 48.03.1 | 28.32.8 | 25.82.7 | 29.72.9 | 43.56.0/37.45.8 | 3.2/14.72.5 | 48.33.1/38.93.0 | 36.0 | |
| StereoVLA [14] | 6.62.6 | 4.31.5 | 1.11.0 | N/A | 0 | N/A | 0 | 1.7 | |
| LAP-VLA [50] | 19.42.4 | 2.41.0 | 3.11.1 | 2.71.0 | 3.811.5/1.591.0 | 6.482.8/3.412.1 | 3.11.1/1.50.8 | 4.8 | |
| X-VLA [54] | 3.31.0 | 0.50.5 | 0.70.5 | 0.80.5 | 0.10.2/0.10.2 | 1.90.9/1.00.7 | 0.90.6/0.50.5 | 1.2 | |
| MolmoBot-Pi0 | 66.22.9 | 35.73.0 | 33.32.9 | 39.83.1 | 44.73.1/38.23.1 | 24.73.2/13.32.5 | 46.23.1/40.03.1 | 41.5 | |
| MolmoBot-Img | 92.21.7 | 63.53.0 | 61.43.0 | 62.13.0 | 63.03.0/55.03.1 | 21.02.5/16.42.3 | 2.9/3.0 | 61.6 | |
| MolmoBot (H=1) | 1.5 | 2.9 | 3.0 | 3.0 | 2.9/3.0 | 26.42.7/20.22.5 | 2.9/60.03.0 | ||
| MolmoBot (H=2) | 91.31.8 | 63.83.0 | 59.03.0 | 62.73.0 | 65.42.9/55.63.1 | 28.32.8/2.6 | 66.12.9/57.33.1 | 62.4 |
5.1 Zero-Shot Real-World Transfer
Real Franka baselines are π0-DROID and π0.5-DROID, trained with large real-world datasets and DROID post-training. The RB-Y1 experiment lacks a comparable generalist baseline. Its findings therefore demonstrate attempted transfer and characteristic failures, rather than a measured advantage over an established mobile policy.
5.1.1 Static Manipulation Evaluation
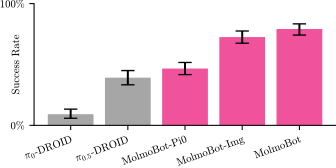
Each policy runs 120 pick-and-place trials across kitchen, workroom, bedroom, and office settings at two institutions. H=1 achieves 79.2%, image-only 72.5%, MolmoBot-Pi0 46.7%, π0.5-DROID 39.2%, and π0-DROID 9.2%, as preserved by the detailed tables and Figure 4. Thus the headline improvement is 40 percentage points over π0.5-DROID. Performance varies by room; image-only is better than H=1 in the kitchen. Confidence intervals in Figure 4 use stratified bootstrapping.
5.1.2 Mobile Manipulation Evaluation
A door-specialist RB-Y1 policy is tested three times on each of three pull doors. It grasps a handle in four of nine trials and opens the door in two. Hardware faults, collisions, joint limits, and grasp failures all appear in Table 9. These nine trials support a limited mobile-transfer demonstration, with substantial reliability problems; they do not establish robust general mobile manipulation.
5.2 Simulation Evaluation
Held-out simulation separates asset and house instances from training. Some evaluations also switch to Filament rendering or random camera poses. Picking reports success at any time; placing additionally reports whether success remains at the episode end. The distinction exposes policies that achieve a placement and then undo it. Table 10 gives the actual benchmark sizes, which vary despite the main text and Table 1 caption describing 1,000 episodes per task.
5.2.1 Static Manipulation
Table 1 reports mean performance of 64.1% for H=1, 61.6% for image-only, 62.4% for H=2, and 41.5% for MolmoBot-Pi0, versus 10.0% for π0.5-DROID and 36.0% after its 15,000-step simulation fine-tuning. StereoVLA, LAP-VLA, and X-VLA score below 5% on average in this suite. StereoVLA cannot handle two listed configurations, and its unavailable entries count as zero in the mean. These aggregates therefore combine capability and benchmark compatibility. Pick tasks allow twenty seconds and placing tasks forty seconds.
5.2.2 Mobile Manipulation
RB-Y1 multitask MolmoBot reaches 44.8% picking, 22.5% placement, 25.2% opening, and 70.2% door opening; the door specialist reaches 77.7%. SPOC rigid-task scores are 10.5% and 1.8%, while its articulated specialist reaches 21.8% opening and 58.8% door opening. Task scenes and initial states differ from the Franka benchmark. Architecture size and training mixture change together, limiting attribution of the multitask model’s advantage to any single factor.
5.3 Data Ablations
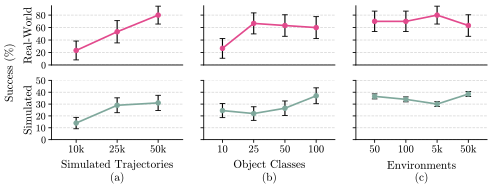
Pick-only ablations use bespoke datasets and evaluate both simulated Pick v2 and thirty real workroom trials. Increasing demonstrations from 10,000 to 50,000 improves performance; increasing object classes helps simulation but quickly saturates the small real evaluation. Varying environment count at fixed 50,000 demonstrations shows little consistent effect over the tested range. The authors hypothesize that geometric variety and pretrained semantics dominate here. This is a task- and range-specific finding: each environment already offers multiple rooms, and the study does not establish that scene diversity is generally unnecessary.
6 Conclusion
The collection engine enables useful zero-shot transfer for the tested rigid-object and articulated tasks, especially tabletop pick-and-place. Models, data, and code are released. Limitations include simulation fidelity, missing deformable/contact-rich tasks, sparse mobile evidence, and lack of an RB-Y1 baseline. The authors explicitly allow that reliable deployment may still require target-environment examples, on-policy failures, and interventions. External benchmark failures and the history/compute control further constrain broad generality claims.
Acknowledgments
The acknowledgments credit Ai2 colleagues for research discussions, project and robot-room support, publicity, and cluster infrastructure.
Appendix A Data Generation
Appendix A specifies the collection procedure, including robot perturbations, cameras, task-success predicates, expert recovery, language sampling, and dataset throughput. These details define which variations and failures the policies actually observe.
A.1 Robot Randomization
Initial arm-joint perturbations grow toward distal joints; the Franka magnitudes are chosen to keep tool displacement around ten centimeters or less. RB-Y1 additionally perturbs its head and grippers, leaving initial torso/base joints unchanged. During collection, action-proportional noise is added in tool space and mapped back through the Jacobian pseudoinverse, with position noise clipped to two centimeters and rotation noise to 0.1 radians. Base noise is similarly bounded and disabled in simulated evaluation. Fixed gripper-close/open durations and settling steps prevent immediate arm motion from disrupting grasps.
A.2 Sensor Configuration
Cameras are configured after scene and object randomization. The collection records more viewpoints and modalities than the policies use; retaining data is distinct from consuming it during training.
A.2.1 FR3 camera system
Franka records a wrist camera, a fixed shoulder camera, and three randomized external views. Training uses the wrist plus one randomized ZED-like external view. Intrinsics, positions, and angles vary; external views span full azimuth and heights of 5–60 cm, with visibility rejection and up to twenty resampling attempts. Images render at 624×352, near the real 640×360 resolution. The wrist field of view is about 52°, while external models span ZED-like and wider GoPro-like optics.
A.2.2 RB-Y1 camera system
RB-Y1 training uses all three recorded views: a wide head camera and two wrist cameras. The head renders at 1024×576, crops to 768×576, and applies randomized fisheye warping; wrist images remain 1024×576. Field of view, camera offsets, and rotations vary around the real sensor configurations. Depth is recorded but unused by every reported training run.
A.2.3 Proprioception and additional sensors
Recorded state includes joints, velocities, tool and base poses; action labels include absolute and relative joints plus tool-space commands. Task metadata retains goals, grasps, phase, and retry count. Camera calibration and projected object points support alternative conditioning or analysis. The evaluated policies use selected image and proprioceptive inputs rather than this full privileged-state inventory.
A.3 Tasks
Success predicates are task-specific and deliberately distinguish grasping, placement, and articulation. They define expert filtering and simulation scoring; real-world judging uses its separately described protocol.
A.3.1 Rigid object manipulation
Picking requires the object to be unsupported by non-robot surfaces and lifted at least one centimeter. Placement into a receptacle requires it to support at least half the object’s weight, while moving no more than ten centimeters or rotating more than forty-five degrees. Next-to placement requires a 0–5 cm surface gap in the horizontal plane and limits reference-object motion to fifteen centimeters. Color placement uses otherwise identical receptacles with distinct colors and the same placement-success conditions.
A.3.2 Articulated object manipulation
Opening requires reaching at least 67% of the relevant joint’s range, whether a drawer, appliance, or door. Door instructions specify push or pull according to the robot’s starting side. These predicates measure achieved articulation, not broader traversal or safe completion of a multi-stage household task.
A.4 Expert Demonstrations
Stored grasps are ranked by proximity, orientation, vertical alignment, and center-of-mass distance, then filtered in batches for collisions and inverse-kinematics feasibility. Phase sequences cover approach, grasp, lift, placement, release, and optional stow; articulated objects instead follow hinge arcs or sliding directions. A detected failure restarts the sequence, but episodes exceeding three retries are discarded.
RB-Y1 planning uses a 23-dimensional base/torso/arm chain, 64 inverse-kinematics seeds, four trajectory seeds, collision spheres, and mesh obstacles. It tests candidate goals in batches and selects low-displacement feasible motions. Up to five replans per phase handle missed waypoints. These programmed recovery rules produce useful examples without making the expert universally successful.
A.5 Referral Expressions
Referring expressions distinguish the target from objects in its local workspace, using CLIP contrast rather than uniqueness throughout the house. Candidates include short language-model descriptions, synset lemmas, and normalized category names. Expressions must exceed target similarity 0.1 and contrast 0.03, then are sampled with softmax temperature 0.02. The resulting instructions rely on task context as well as names.
A.6 Train-Time Task Prompt Randomization
Training independently randomizes instruction templates and stored referring expressions, favoring shorter descriptions. The full template inventory is delegated to the released code. This variation broadens phrasing exposure but does not guarantee robustness to every external benchmark prompt.
A.7 Dataset Statistics
The dataset totals 1.7 million episodes, 295 million frames, 5,704 robot-hours, about 12 TB, 11,400 target assets, 9,400 receptacles, and 94,200 environments. Dataset rows are highly imbalanced, with Franka picking and pick-and-place dominating. Reported generation averages about 260 successful episodes per GPU-hour, peaks at 660, and consumes roughly 6,500 GPU-hours overall. Expert success varies from about 25% for RB-Y1 opening to 80% for Franka picking. Claimed dollar costs depend on assumed A100 cloud rates, and the throughput comparison to human collection assumes an ALOHA effective real-time factor of one third.
| Task | Robot | Episodes | Assets (Obj. + Rec.) | Envs. | Avg. Length | Total Length |
| Door-open | RBY1 | 79.0k | – | 15.1k | 19.6 s | 429 h |
| Open | RBY1 | 46.6k | 217 | 10.5k | 14.8 s | 192 h |
| Pick | RBY1 | 62.3k | 4.2k | 28.0k | 10.7 s | 184 h |
| Pick | Franka | 781.8k | 10.7k | 73.2k | 4.8 s | 1,042 h |
| Pick-and-Place | RBY1 | 14.8k | 2.4k + 183 | 9.3k | 14.0 s | 58 h |
| Pick-and-Place | Franka | 554.2k | 7.0k + 494 | 61.6k | 17.1 s | 2,638 h |
| PnP Next-To | Franka | 182.7k | 931 + 9.0k | 44.9k | 20.1 s | 1,022 h |
| PnP Color | Franka | 28.6k | 3.1k + 183 | 5.3k | 17.4 s | 138 h |
| Total | 1.7M | 11.4k + 9.4k | 94.2k | 11.7 s | 5,704 h |
| Dataset | Source | Episodes | Hours | Uniq. Envs. | Tasks | Embod. | Mob. Manip. |
| DROID [19] | Real | 76k | 350 | 564 | 86 | 1 | ✗ |
| OXE [33] | Real | 1.4M | 2k | 311 | 527 | 22 | ✓ |
| AgiBot-World [1] | Real | 1M+ | 2,976 | 100+ | 217 | 1 | ✓ |
| RoboMimic [28] | Sim | 1k | – | 1 | 5 | 1 | ✗ |
| MimicGen [27] | Sim | 50k+ | – | – | 18 | 1 | ✗ |
| InternData-A1 [43] | Sim | 630k | 7,433 | 227 | 70 | 4 | ✗ |
| RoboCasa-365 [30] | Sim | 500k | 2,200 | 2,500 | 365 | 1 | ✓ |
| MB-Data (Ours) | Sim | 1.7M | 5,704 | 94.2k | 8 | 2 | ✓ |
Appendix B Models
Appendix B gives spatial conditioning, mixtures, augmentations, and platform-specific interfaces. These implementation choices accompany the architecture comparisons and affect what the zero-shot transfer claim entails.
B.1 Optional point conditioning
Optional goal points pair the initial grounding frame with normalized image coordinates. MolmoBot expresses coordinates and object names in a text representation; SPOC encodes point tokens. DROID models and evaluations do not use points. The RB-Y1 multitask, door-specialist, and SPOC articulated policies do, so their task specification includes spatial guidance beyond language alone.
B.2 Data mixing
Franka sampling assigns 20% to picking, 10% to fixed-height placement, 35% to randomized-height placement, 20% to next-to placement, and 15% to color placement. RB-Y1 multitask sampling assigns 20% each to opening and doors, and 30% each to picking and placement. Door specialization uses only doors; SPOC rigid and articulated specialists use their respective two-task mixtures. The original tables preserve all ratios.
| Task | Sampling Ratio |
| Pick | 20% |
| Pick-and-place Fixed Height | 10% |
| Pick-and-place Random Height | 35% |
| Pick-and-place-next-to | 20% |
| Pick-and-place-color | 15% |
B.3 Data augmentation
Image augmentation combines color jitter, blur, posterization, sharpness changes, and grayscale with varying probabilities. Instruction templates and referring expressions are also randomized. These augmentations complement physical and camera randomization in simulation.
B.4 DROID Input/Output
DROID policies consume wrist and randomized external images plus current joint angles, and output absolute joint positions. Their interface matches the real Franka deployment used for the central comparison.
B.5 RB-Y1 Input/Output
RB-Y1 policies consume head and both wrist images plus current joints. Articulated tasks add an initial grounding image and a point selected on the target object. Arm and torso outputs are relative joint changes; base outputs are linear and angular offsets from the current pose. This differs from the absolute-joint Franka action representation.
Appendix C Experiments
Appendix C preserves exact prompts, per-task real outcomes, simulated benchmark definitions, camera controls, ablations, equal-step history comparisons, and external evaluations. Several numerical inconsistencies between prose and tables are identified in the corresponding notes rather than silently changing original material.
C.1 DROID Evaluation Environments
The four real environments vary support surfaces, clutter, cameras, objects, and receptacles. Kitchen tasks vary easy/hard placements and bowl targets; workroom tasks combine five objects with two receptacles; bedroom tasks place onto a towel or into a basket on a bed; office tasks run at a separate institution. Each setting contributes thirty trials. A placement counts when stable for a reasonable interval within 900 steps; unsafe behavior before success or timeout counts as failure. Tables 7–8 preserve every instruction and trial count, including distractors and cluttered cases.

| Benchmark | Task ID(s) | Task Prompt |
| Workroom | spoon_tray | “put the wooden spoon on the light blue tray” |
| spoon_box | “put the wooden spoon in the wooden box” | |
| tape_tray | “put the blue tape on the light blue tray” | |
| tape_box | “put the blue tape in the wooden box” | |
| blue_mug_tray | “put the blue mug on the light blue tray” | |
| blue_mug_box | “put the blue mug in the wooden box” | |
| copper_mug_tray | “put the copper mug on the light blue tray” | |
| copper_mug_box | “put the copper mug in the wooden box” | |
| timer_tray | “put the green timer on the light blue tray” | |
| timer_box | “put the green timer in the wooden box” | |
| Kitchen | apple_easy, apple_hard | “put the apple in the brown bowl” |
| clutter_brown, mug_easy, mug_hard | “put the mug in the brown bowl” | |
| banana_easy, banana_hard | “put the banana in the brown bowl” | |
| mouse_easy, mouse_hard | “put the computer mouse in the brown bowl” | |
| clutter_black | “put the mug in the black bowl” | |
| Bedroom | pills_towel | “put the pill bottle on the yellow towel” |
| pills_basket | “put the pill bottle in the basket” | |
| roller_towel | “put the lint roller on the yellow towel” | |
| roller_basket | “put the lint roller in the basket” | |
| banana_towel, clutter_towel | “put the banana on the yellow towel” | |
| banana_basket, clutter_basket | “put the banana in the basket” | |
| ball_towel | “put the tennis ball on the yellow towel” | |
| ball_basket | “put the tennis ball in the basket” | |
| Office | knife_board | “put the knife on the cutting board” |
| banana_plate | “move the toy banana on the plate” | |
| marker_mug | “put the marker into the mug” | |
| scissors_bowl | “pick up the scissor and place it inside the bowl” | |
| carrot_basket | “put the carrot into the basket” | |
| knife_green_bowl | “pick up the knife and place it inside the green bowl” | |
| screwdriver_blue_bowl | “put the screwdriver in the blue bowl” | |
| mouse_blue_bowl | “place the mouse into the blue bowl” | |
| mug_bowl | “grasp the mug and put it inside the bowl” | |
| marker_box | “pick up the red marker and place it into the box” |
| Benchmark | Policy |
Spoon Tray |
Spoon Box |
Tape Tray |
Tape Box |
Blue Mug Tray |
Blue Mug Box |
Copper Mug Tray |
Copper Mug Box |
Timer Tray |
Timer Box |
Avg |
| Workroom | MolmoBot | 3/3 | 2/3 | 3/3 | 3/3 | 3/3 | 3/3 | 3/3 | 1/3 | 3/3 | 3/3 | 90% |
| MolmoBot-Img | 3/3 | 3/3 | 3/3 | 3/3 | 3/3 | 2/3 | 2/3 | 0/3 | 3/3 | 1/3 | 77% | |
| MolmoBot-Pi0 | 1/3 | 0/3 | 3/3 | 3/3 | 3/3 | 3/3 | 2/3 | 1/3 | 0/3 | 2/3 | 60% | |
| 2/3 | 2/3 | 2/3 | 0/3 | 1/3 | 1/3 | 0/3 | 0/3 | 0/3 | 0/3 | 27% | ||
| 0/3 | 0/3 | 1/3 | 0/3 | 0/3 | 0/3 | 0/3 | 0/3 | 0/3 | 0/3 | 3% | ||
|
Apple Easy |
Apple Hard |
Mug Easy |
Mug Hard |
Banana Easy |
Banana Hard |
Mouse Easy |
Mouse Hard |
Clutter Brown |
Clutter Black |
Avg | ||
| Kitchen | MolmoBot | 1/3 | 2/3 | 3/3 | 3/3 | 3/3 | 3/3 | 3/3 | 3/3 | 0/3 | 0/3 | 70% |
| MolmoBot-Img | 3/3 | 3/3 | 2/3 | 3/3 | 3/3 | 3/3 | 3/3 | 2/3 | 3/3 | 1/3 | 87% | |
| MolmoBot-Pi0 | 2/3 | 3/3 | 2/3 | 0/3 | 3/3 | 1/3 | 3/3 | 2/3 | 0/3 | 0/3 | 53% | |
| 3/3 | 0/3 | 2/3 | 1/3 | 3/3 | 2/3 | 3/3 | 1/3 | 2/3 | 2/3 | 63% | ||
| 0/3 | 1/3 | 0/3 | 0/3 | 1/3 | 0/3 | 3/3 | 1/3 | 0/3 | 0/3 | 20% | ||
|
Pills Towel |
Pills Basket |
Roller Towel |
Roller Basket |
Banana Towel |
Banana Basket |
Ball Towel |
Ball Basket |
Clutter Towel |
Clutter Basket |
Avg | ||
| Bedroom | MolmoBot | 3/3 | 3/3 | 3/3 | 0/3 | 3/3 | 2/3 | 3/3 | 3/3 | 3/3 | 3/3 | 87% |
| MolmoBot-Img | 0/3 | 0/3 | 1/3 | 2/3 | 3/3 | 3/3 | 3/3 | 2/3 | 3/3 | 3/3 | 67% | |
| MolmoBot-Pi0 | 2/3 | 0/3 | 2/3 | 0/3 | 0/3 | 0/3 | 1/3 | 0/3 | 0/3 | 2/3 | 23% | |
| 0/3 | 0/3 | 0/3 | 0/3 | 1/3 | 0/3 | 0/3 | 0/3 | 2/3 | 0/3 | 10% | ||
| 0/3 | 0/3 | 0/3 | 0/3 | 0/3 | 0/3 | 0/3 | 0/3 | 0/3 | 0/3 | 0% | ||
|
Knife Board |
Banana Plate |
Marker Mug |
Scissors Bowl |
Carrot Basket |
Knife Green Bowl |
Screwdriver Blue Bowl |
Mouse Blue Bowl |
Mug Bowl |
Marker Box |
Avg | ||
| Office | MolmoBot | 2/3 | 3/3 | 1/3 | 2/3 | 2/3 | 2/3 | 3/3 | 2/3 | 3/3 | 1/3 | 70% |
| MolmoBot-Img | 2/3 | 1/3 | 0/3 | 1/3 | 3/3 | 1/3 | 3/3 | 2/3 | 3/3 | 2/3 | 60% | |
| MolmoBot-Pi0 | 1/3 | 3/3 | 0/3 | 0/3 | 0/3 | 1/3 | 3/3 | 2/3 | 3/3 | 2/3 | 50% | |
| 2/3 | 3/3 | 1/3 | 1/3 | 1/3 | 1/3 | 2/3 | 1/3 | 3/3 | 2/3 | 57% | ||
| 0/3 | 0/3 | 0/3 | 0/3 | 1/3 | 1/3 | 1/3 | 1/3 | 0/3 | 0/3 | 13% |
C.2 Mobile Manipulation Experiments
Door trials run at a slower 100 ms inference timestep for safety. Right-side handles in two scenes are difficult to grasp; the authors attribute this partly to underrepresentation in training, which is a plausible explanation rather than an isolated causal result. All three successful grasps on Door 2 include hardware-fault qualifications, with two successful openings. Figure 7 also shows a rigid-object mobile scene, but the quantitative real mobile table concerns the nine door trials.

| Door | Trial | Grasp | Opened | Failure Mode |
| 1 | 1 | ✓† | ✗ | Grasping HW fault |
| 2 | ✗ | ✗ | Base collision | |
| 3 | ✗ | ✗ | Joint limits | |
| 2 | 1 | ✓† | ✗ | Grasping HW fault |
| 2 | ✓ | ✓† | Opening HW fault | |
| 3 | ✓ | ✓† | Opening HW fault | |
| 3 | 1 | ✗ | ✗ | Base collision |
| 2 | ✗† | ✗ | Approach HW fault | |
| 3 | ✗ | ✗ | Grasping failure |
C.3 Franka Simulation Evaluation
Simulation uses a 66 ms policy timestep and 303/606-step picking/placing horizons. Table 10 lists 1,000 Pick v1 episodes but 200 for the other listed tasks, unlike the blanket 1,000-per-task description. StereoVLA receives front-facing views and visibility filtering, leaving 92 and 91 episodes in two picking conditions. Oracle success and end success remain separate for placing.
The appendix prose gives 10.1% for π0.5 simulation, 41.8% for MolmoBot-Pi0, and 31.3% for π0.5 real success; the retained result tables instead give 10.0%, 41.5%, and 39.2%. These notes use the tables, including the per-room real counts. Simulation fine-tuning helps π0.5, especially next-to placement, so the comparison is sensitive to domain adaptation and task definition.
| Task Name | Objects | Episodes | Renderer | Camera |
| Pick v1 | Thor | 1000 | MuJoCo | DROID |
| Pick v2 | Objaverse | 200 | MuJoCo | DROID-Light |
| Pick v2 (F) | Objaverse | 200 | Filament | DROID-Light |
| Pick v2 RC (F) | Objaverse | 200 | Filament | Random Camera |
| PnP-Next-To (F) | Objaverse | 200 | Filament | DROID-Light |
| PnP-Color | Objaverse | 200 | MuJoCo | DROID-Light |
C.4 RB-Y1 Simulation Evaluation
The larger multitask RB-Y1 model beats the smaller specialists on their shared simulated tasks. The authors suggest stronger pretrained representations and cross-task transfer; both architecture and mixture differ, so those explanations are not separately identified. Future on-policy reinforcement learning for the compact model is proposed, not evaluated here.
C.5 Fixed-Camera Evaluation
A shoulder-camera control compares 1,000 simulated Pick v1 trials and thirty kitchen placements. π0.5-DROID rises from 39.2% across real scenes to 63.3% in the kitchen; H=1 scores 70.0% there, while image-only reaches 86.6%. This supports camera sensitivity and retained MolmoBot strength in that setting, but the real control selects a particular room/task subset rather than changing only camera pose in otherwise identical trials. Table 11 retains additional baselines and all values.
| Real-World | |||
| Model | Pick v1 (Sim) | Kitchen | All-Scene Avg |
| StereoVLA [14] | 6.6 | – | – |
| LAP-VLA [50] | 19.4 | – | – |
| [5] | 13.5 | 20.0 | 9.2 |
| [4] | 18.1 | 63.3 | 39.2 |
| -Finetune | 48.0 | – | – |
| DreamZero [48] | 44.3 | – | – |
| MolmoBot-Pi0 | 66.2 | 53.3 | 46.7 |
| MolmoBot-SPOC | 70.4 | 36.6 | – |
| MolmoBot-Img | 92.2 | 86.6 | 72.5 |
| MolmoBot (H=1) | 93.5 | 70.0 | 79.2 |
| MolmoBot (H=2) | 91.3 | 73.3 | 75.0 |
C.6 Data Ablations
Data ablations train image-only policies for 24,000 steps at batch size 512 on bespoke pick datasets. Real evaluation uses six objects with five trials each; class-diversity experiments substitute two objects from unseen classes. Lifting roughly two centimeters defines real success. These thirty-trial pick tests differ from the main 120-trial placement study and use much shorter training, limiting extrapolation of their scaling curves.
C.7 Model Ablations
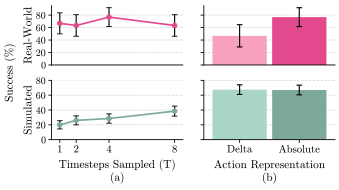
Sampling more flow times per example improves simulated picking up to eight; the thirty-trial real result peaks at four and is noisier. A separate 200,000-step full-mixture comparison finds absolute and delta joints similar in simulation but absolute commands stronger across the real tests. Figure 8 preserves both ablations and uncertainty bars. The action conclusion applies to this Franka interface and does not invalidate the relative-action RB-Y1 policy.
C.8 Compute-Controlled History-Conditioning Experiments
Equalizing the extra 50,000 training steps creates MolmoBot-Img+. On thirty workroom placements, image-only reaches 76.7%, image-only-plus 83.3%, H=1 90.0%, and H=2 76.7%, with broad reported confidence intervals. Thus some apparent history gain may come from additional optimization. The authors explicitly say these experiments cannot determine the extent conclusively; compatibility with history is established more clearly than its isolated benefit.
| Policy | Success Rate (%) |
| MolmoBot-Img | 76.710.0 |
| MolmoBot-Img+ | 83.313.3 |
| MolmoBot (H=1) | 90.06.7 |
| MolmoBot (H=2) | 76.713.3 |
C.9 Zero-Shot Evaluation on External Simulation Benchmarks
The external tests replace the original embodiments and cameras in SIMPLER and LIBERO with DROID-compatible Franka hardware, without task-specific fine-tuning. These are adapted benchmarks, not standard leaderboard scores. On four adapted SIMPLER tasks, image-only succeeds on carrot-to-plate at 45.8% and scores zero elsewhere; all listed baselines score zero throughout. A wording change helps qualitatively, but the reported table uses original prompts.
On adapted LIBERO-Object, image-only averages 8.0% with distractors and 36.6% without, versus at most 1.0% and 3.8% for listed baselines. The 3.8% comparator is MolmoBot-Pi0. No-distractor success ranges from 2% on butter to 78% on chocolate pudding. Removing clutter helps, yet performance remains asset- and prompt-sensitive. The authors interpret these benchmarks as measuring familiarity more than general competence; the experiments directly establish poor absolute external transfer and relative ranking, not that such failures can be dismissed as irrelevant to generalization.
| Model | CarrotPlate | EggplantBasket | Stack Cubes | SpoonCloth | Avg. |
| MolmoBot-Img | 45.8% | 0% | 0% | 0% | 11.5% |
| MolmoBot-Pi0 | 0% | 0% | 0% | 0% | 0% |
| 0% | 0% | 0% | 0% | 0% | |
| 0% | 0% | 0% | 0% | 0% |
| MolmoBot-Img | MolmoBot-Pi0 | -DROID | ||||||
| Task | std. | no dist. | std. | no dist. | std. | no dist. | std. | no dist. |
| Alphabet soup | 0% | 16% | 0% | 2% | 0% | 2% | 0% | 0% |
| Cream cheese | 0% | 24% | 0% | 2% | 2% | 0% | 0% | 0% |
| Salad dressing | 20% | 40% | 0% | 2% | 0% | 0% | 0% | 0% |
| BBQ sauce | 0% | 42% | 0% | 14% | 0% | 2% | 0% | 0% |
| Ketchup | 0% | 42% | 0% | 6% | 0% | 4% | 0% | 0% |
| Tomato sauce | 0% | 52% | 2% | 6% | 2% | 8% | 0% | 0% |
| Butter | 0% | 2% | 0% | 0% | 0% | 2% | 0% | 0% |
| Milk | 0% | 26% | 4% | 2% | 4% | 0% | 0% | 0% |
| Choc. pudding | 10% | 78% | 0% | 2% | 0% | 6% | 0% | 0% |
| Orange juice | 50% | 44% | 2% | 2% | 2% | 0% | 0% | 2% |
| Average | 8% | 36.6% | 0.8% | 3.8% | 1% | 2.4% | 0% | 0.2% |