Overview
Theory of Space separates spatial competence into constructing a map through exploration, using it to answer questions, and revising it after changes. In matched procedural layouts, six foundation models generally reason better from scripted observation histories than from their own exploration; visual observations introduce especially severe orientation and map-maintenance errors. Explicit map probes help locate failures, while remaining prompted reports rather than direct measurements of hidden model state.
| Website | https://theory-of-space.github.io/ | |
| Code | https://github.com/mll-lab-nu/Theory-of-Space | |
| Data | https://huggingface.co/datasets/MLL-Lab/tos-data |
At a glance
The benchmark combines task-agnostic exploration, nine downstream spatial tasks, structured cognitive-map probes, unseen-region classification, and a changed-environment test. It contrasts text and rendered-image observations. The main result is a gap between passive reasoning and effective information collection: models take redundant steps, overlook regions, and retain obsolete estimates, especially in vision. The controlled simulator makes these behaviors inspectable but uses high-level actions and does not establish physical navigation competence.
1 Introduction
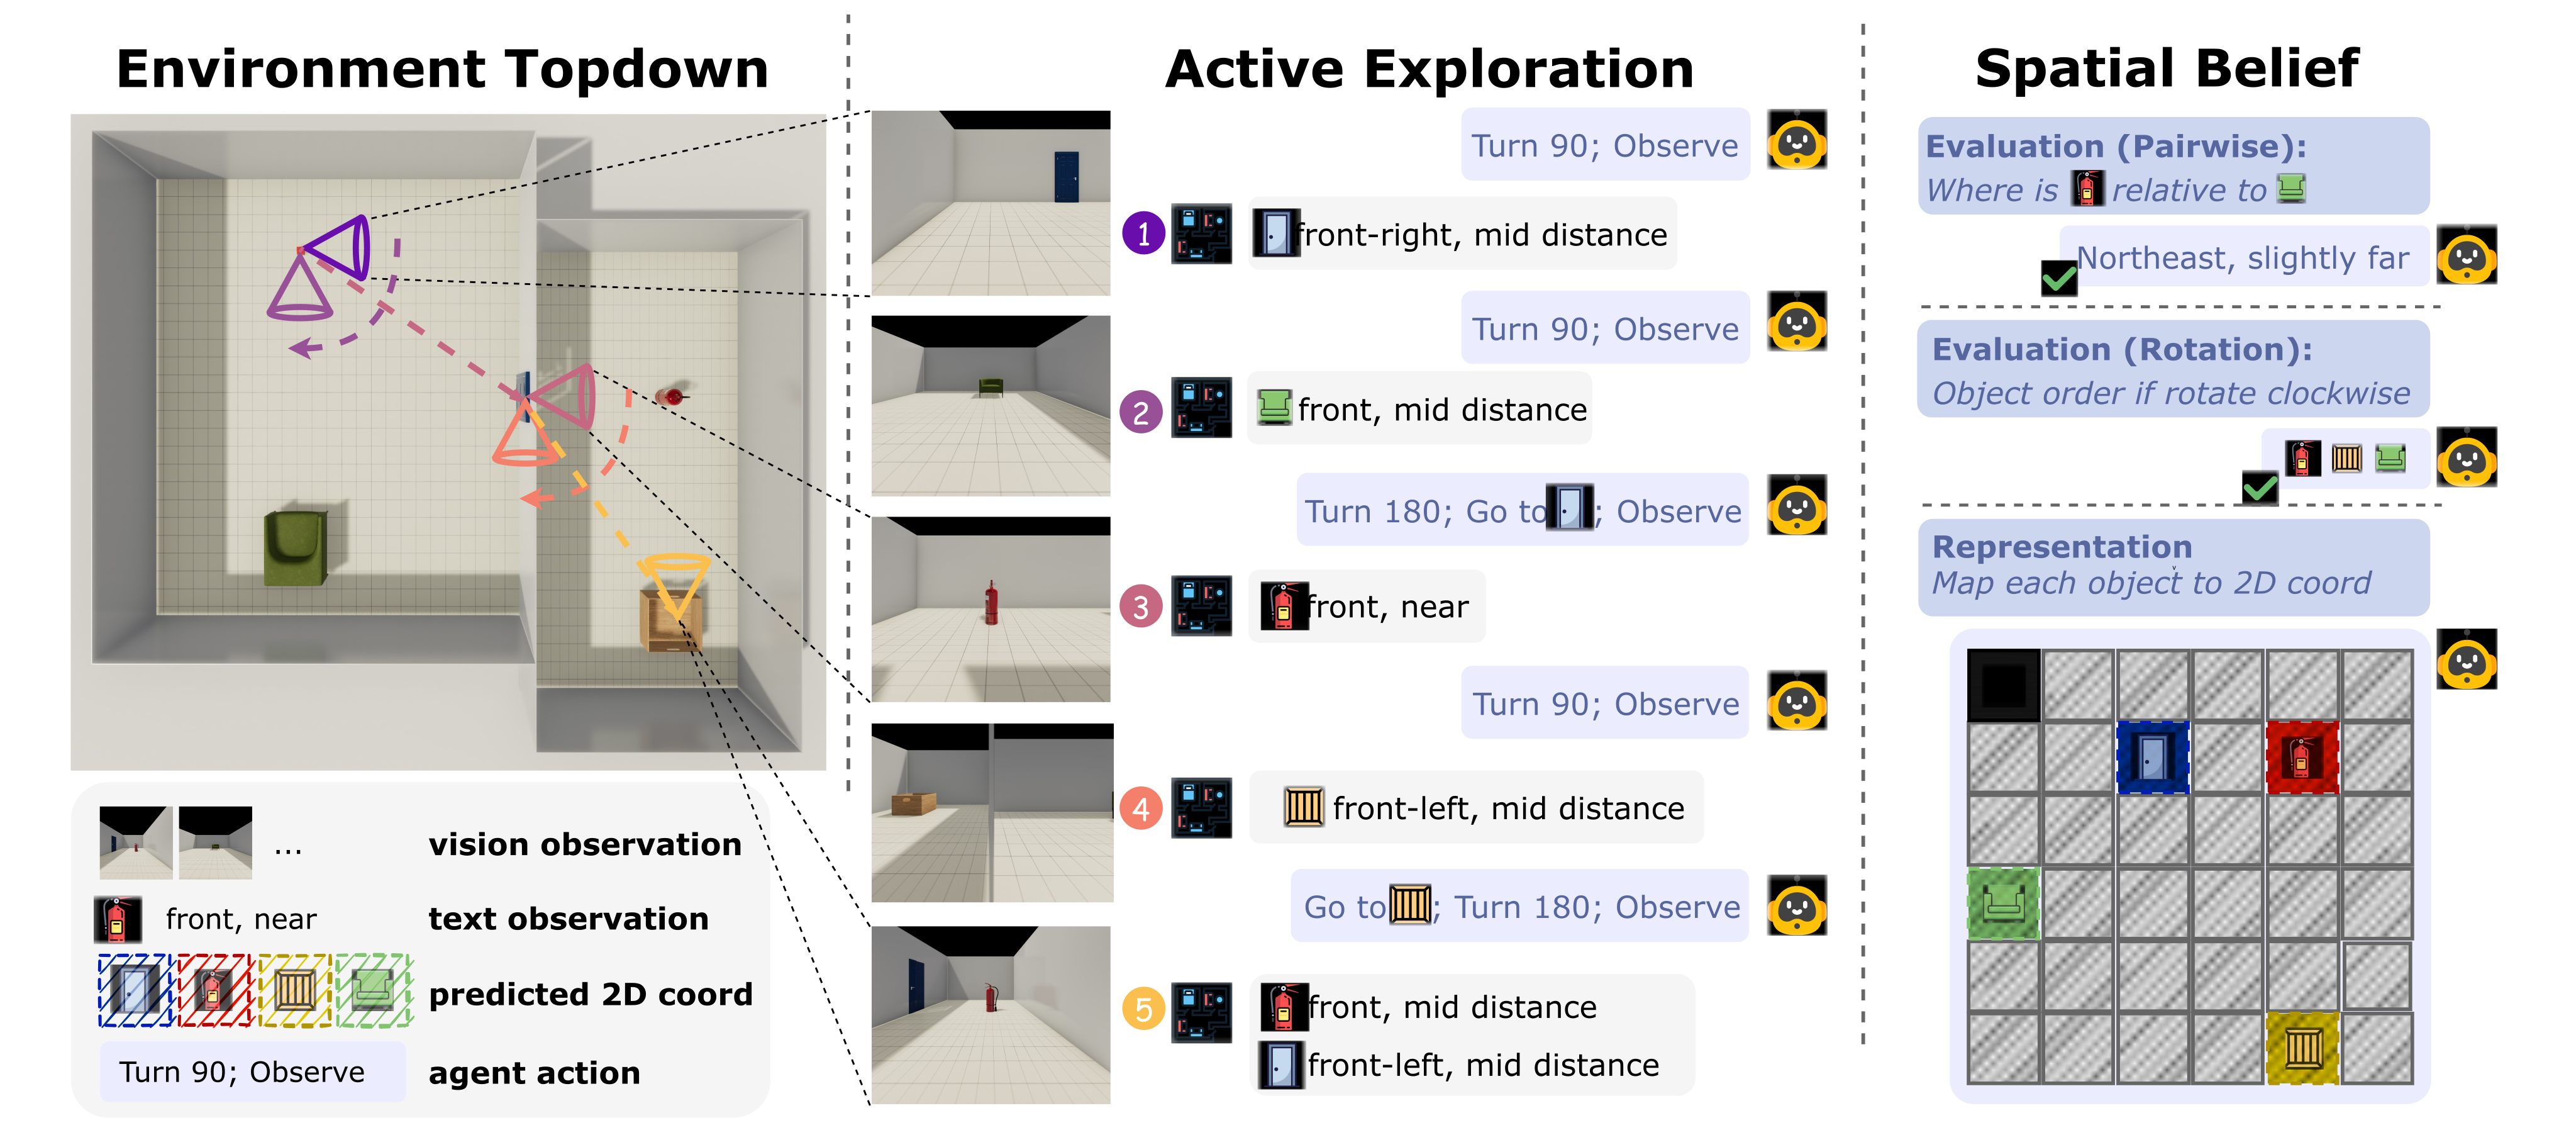
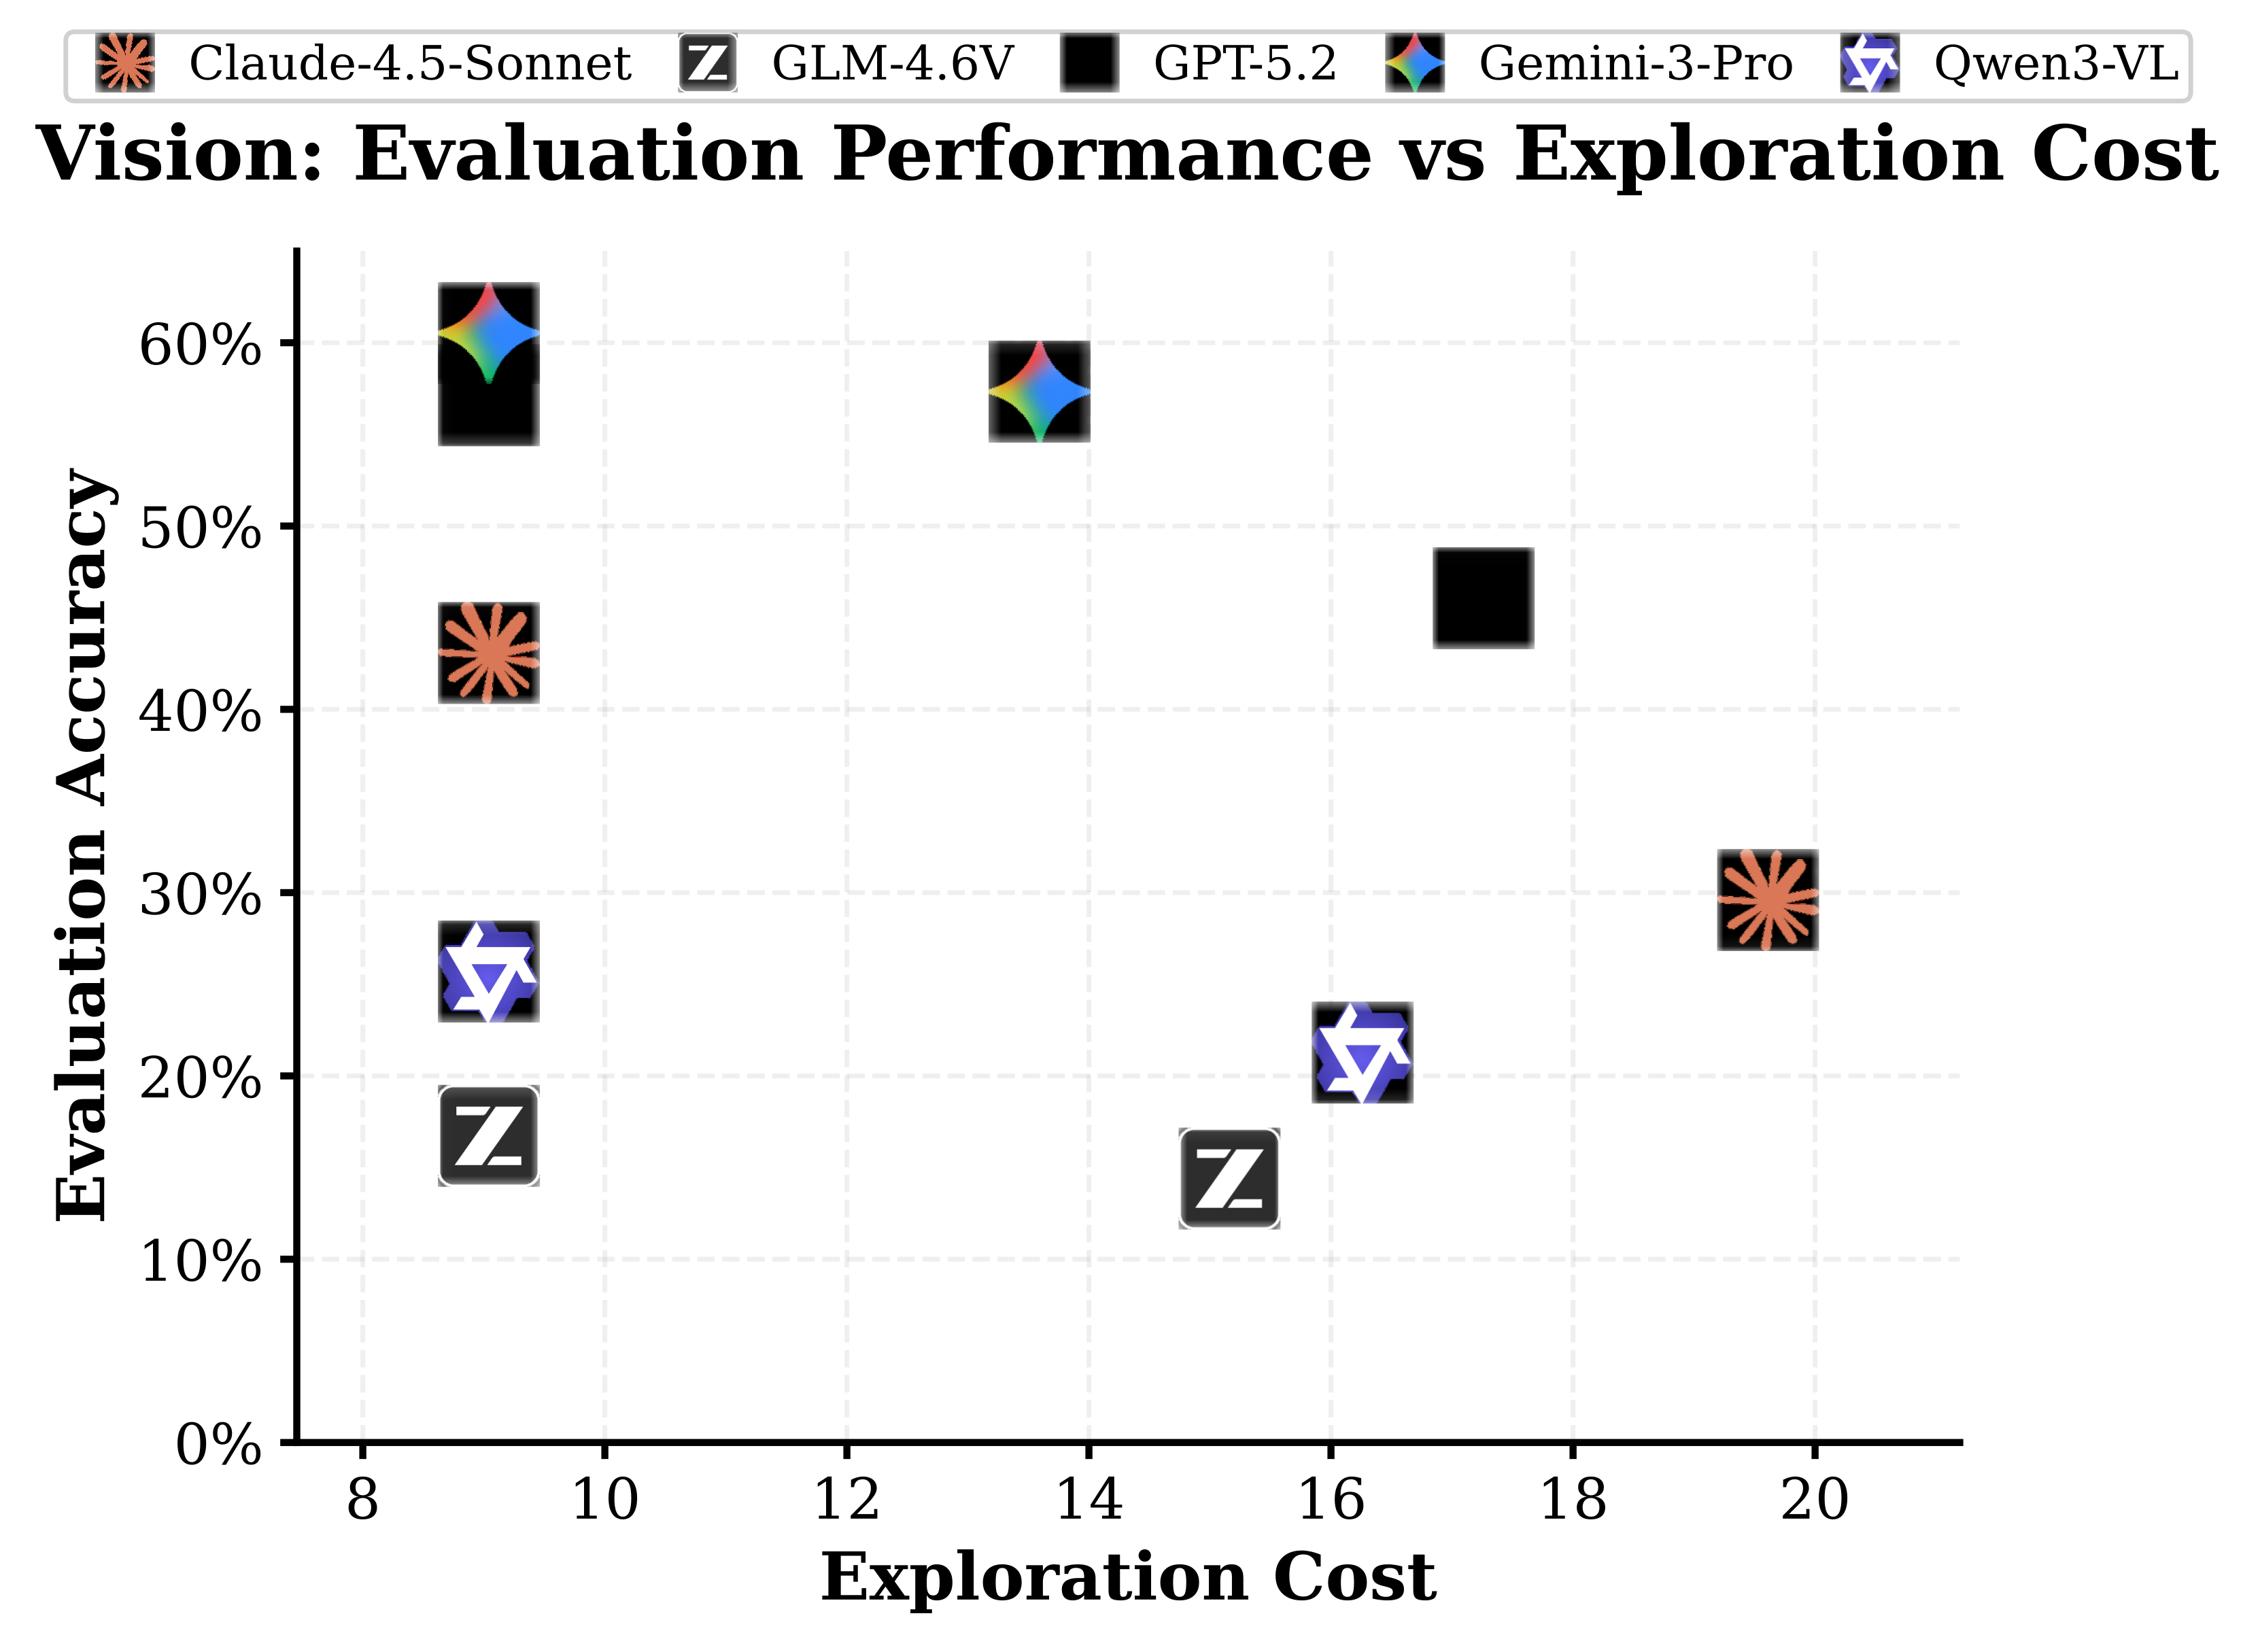
A correct answer after a supplied video does not show that an agent could choose the views needed to produce it. Motivated by work on active and passive spatial learning, the paper tests how models gather evidence before receiving specific questions. It also asks them to externalize maps throughout exploration and after the environment changes. These probes distinguish observation, self-tracking, map consistency, coverage, and updating errors; associations between them and task scores should not be read as direct access to internal representations. Figures 1–2 introduce the workflow and its accuracy–cost trade-off.
2 Theory of Space
Theory of Space is the ability to construct, revise, and exploit an internal spatial belief under partial observability. Formally, observations and actions build a history that supports a belief over spatial structure; new observations should revise that belief after a state change, and a belief-conditioned policy should support downstream tasks. The probabilistic formulation is conceptual: the implemented probes request deterministic coordinate-and-heading maps, not a full posterior distribution.

2.1 A Paradigm for assessing Theory of Space of Large Foundation Models
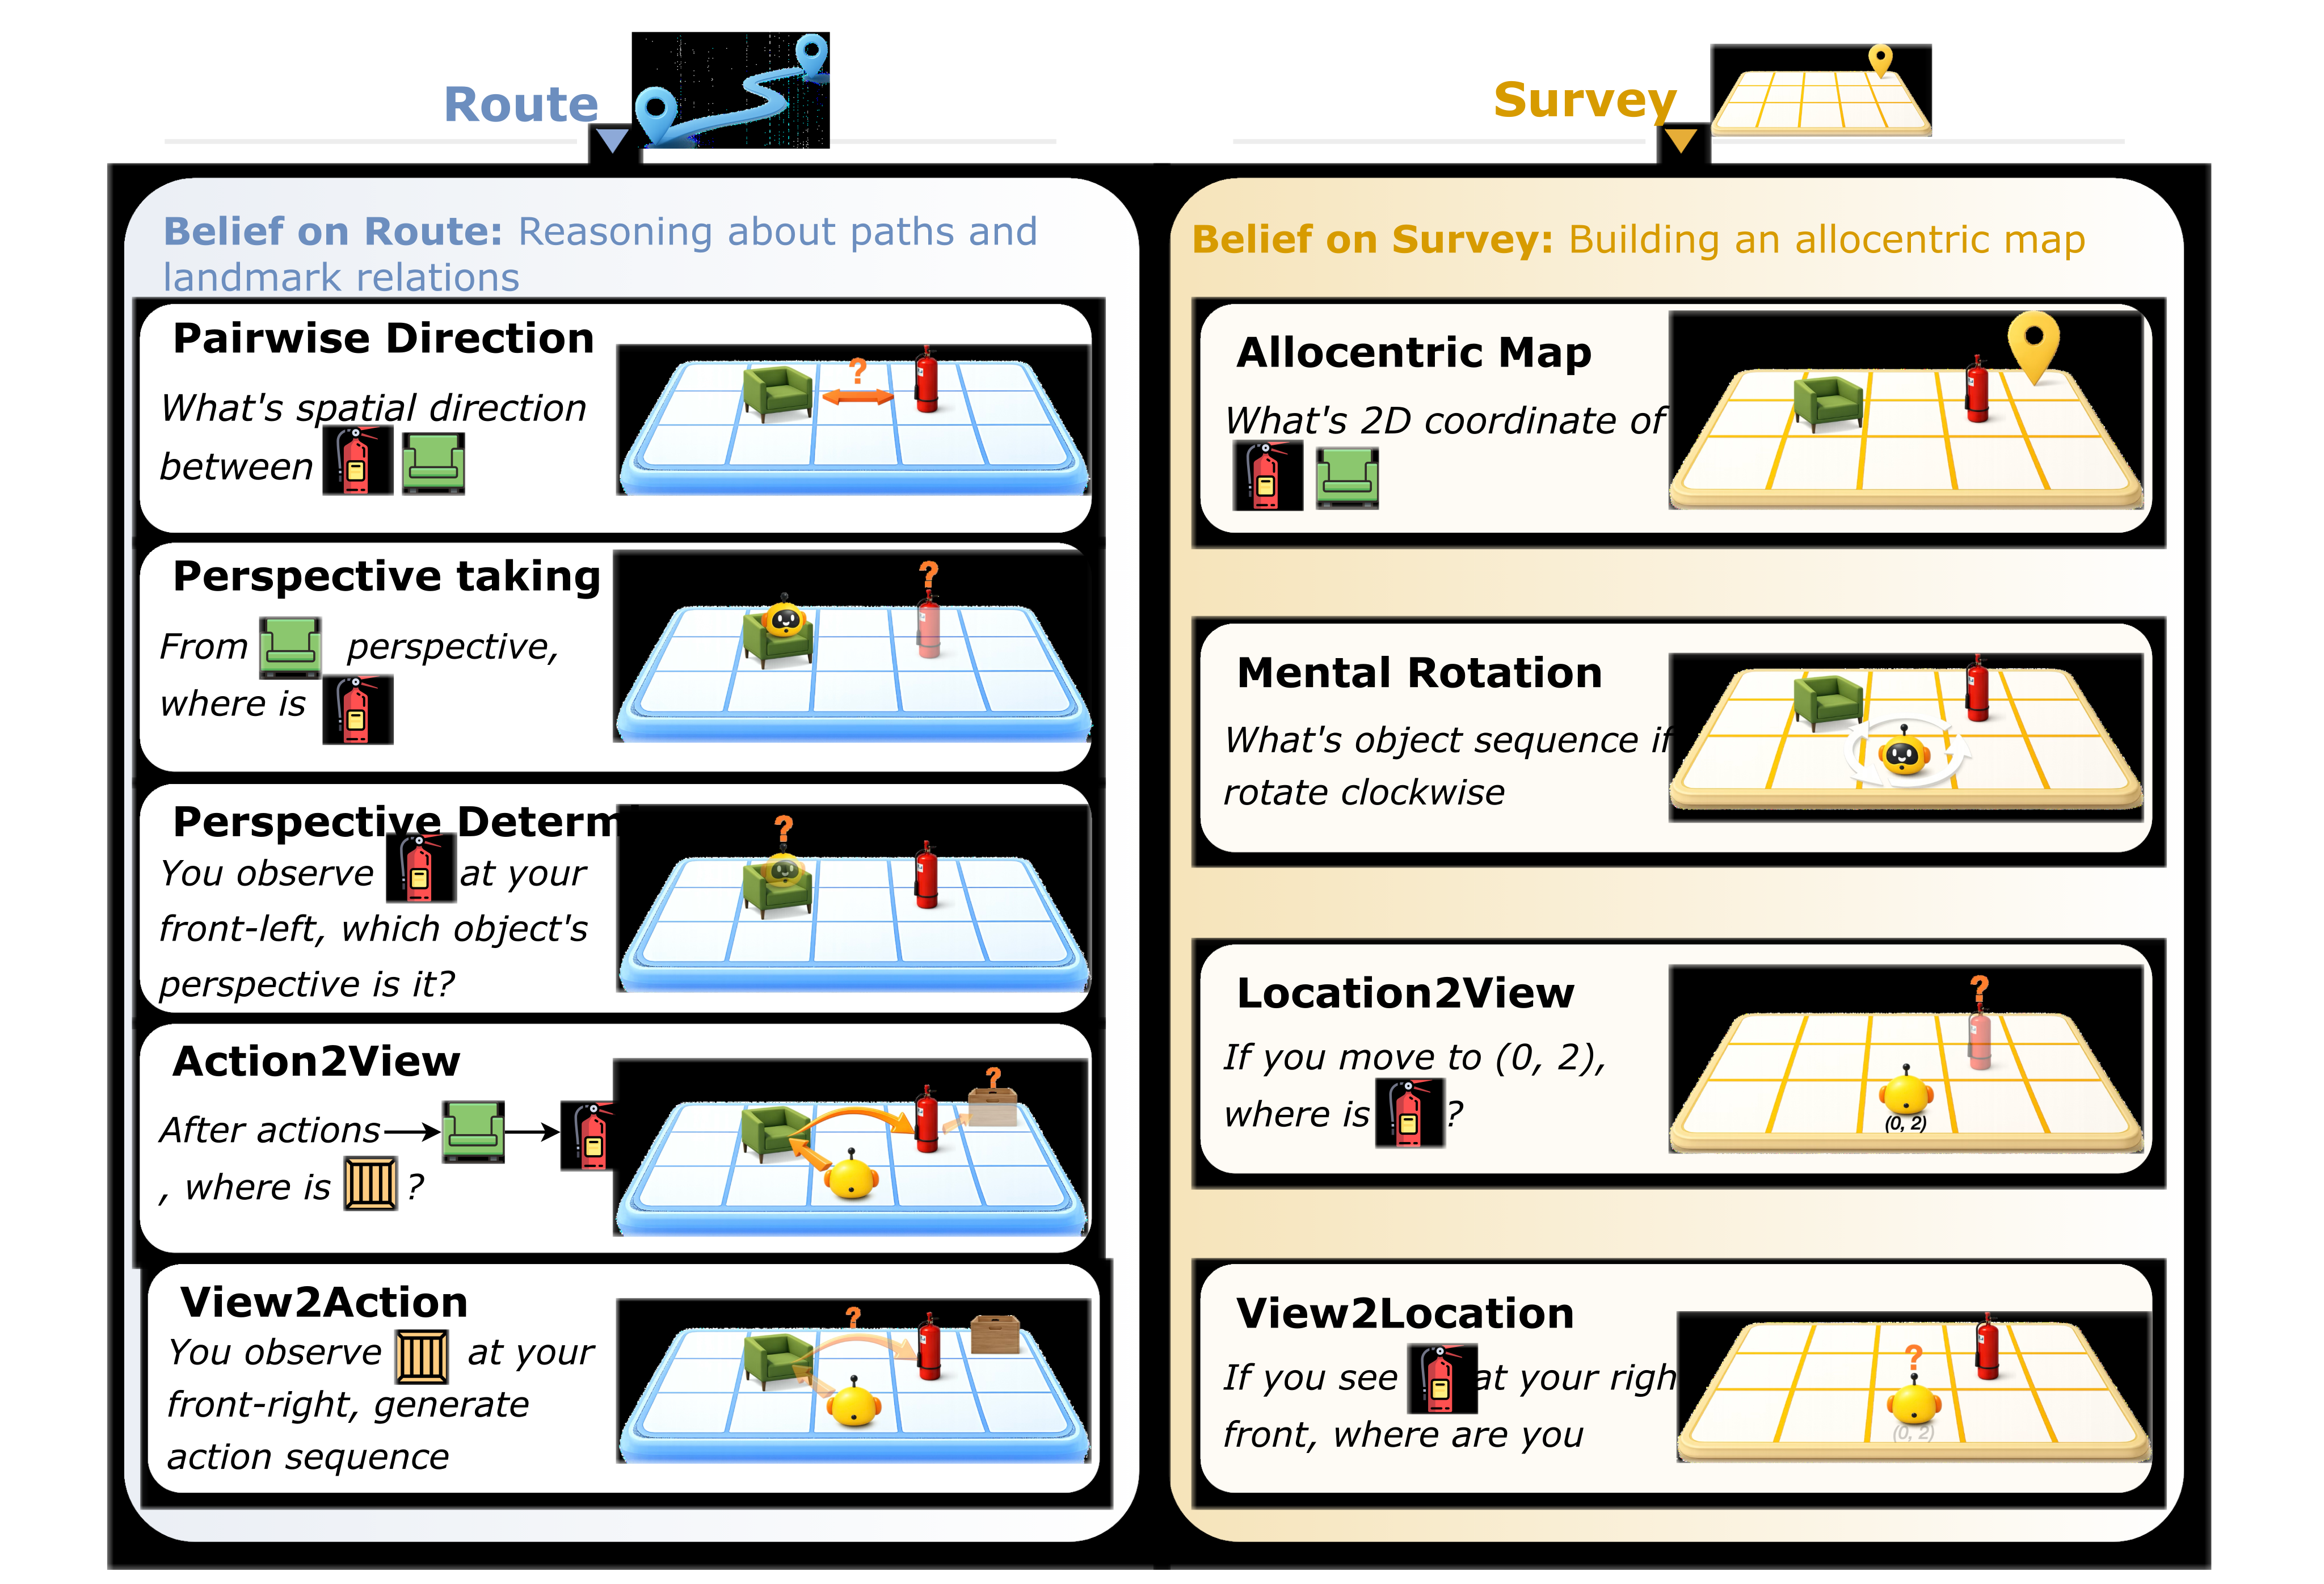
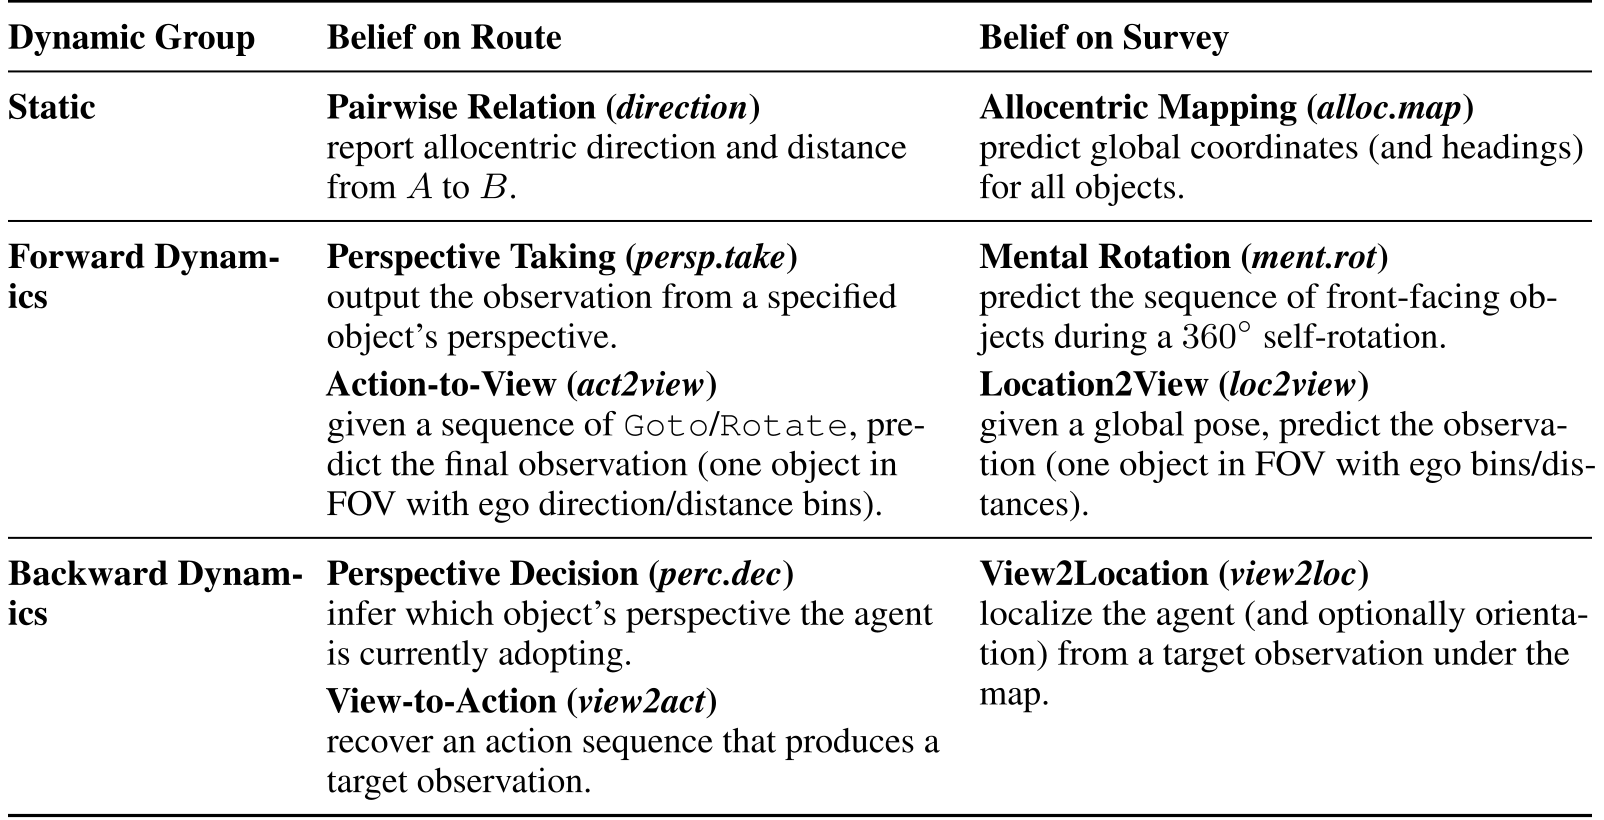
Agents first explore without a downstream question, aiming to build a useful map with minimal observation cost. Evaluation then tests route knowledge—landmark relations and egocentric transformations—and survey knowledge, including global coordinates and novel views. This distinction follows Siegel and White and Taylor and Tversky. Structured map reports and unseen-region predictions complement task accuracy. A further intervention changes object states to test revision; neither behavioral success nor a prompted map alone completely identifies the agent’s latent knowledge.
3 Benchmarking Theory of Space Ability for Foundation Models
The benchmark has two phases: an agent gathers a history of local observations by selecting actions, then answers spatial questions using that history. Separate probes measure the quality and evolution of its reported map, and a re-exploration phase tests whether it detects and incorporates changed objects.
3.1 Spatial Environment Construction
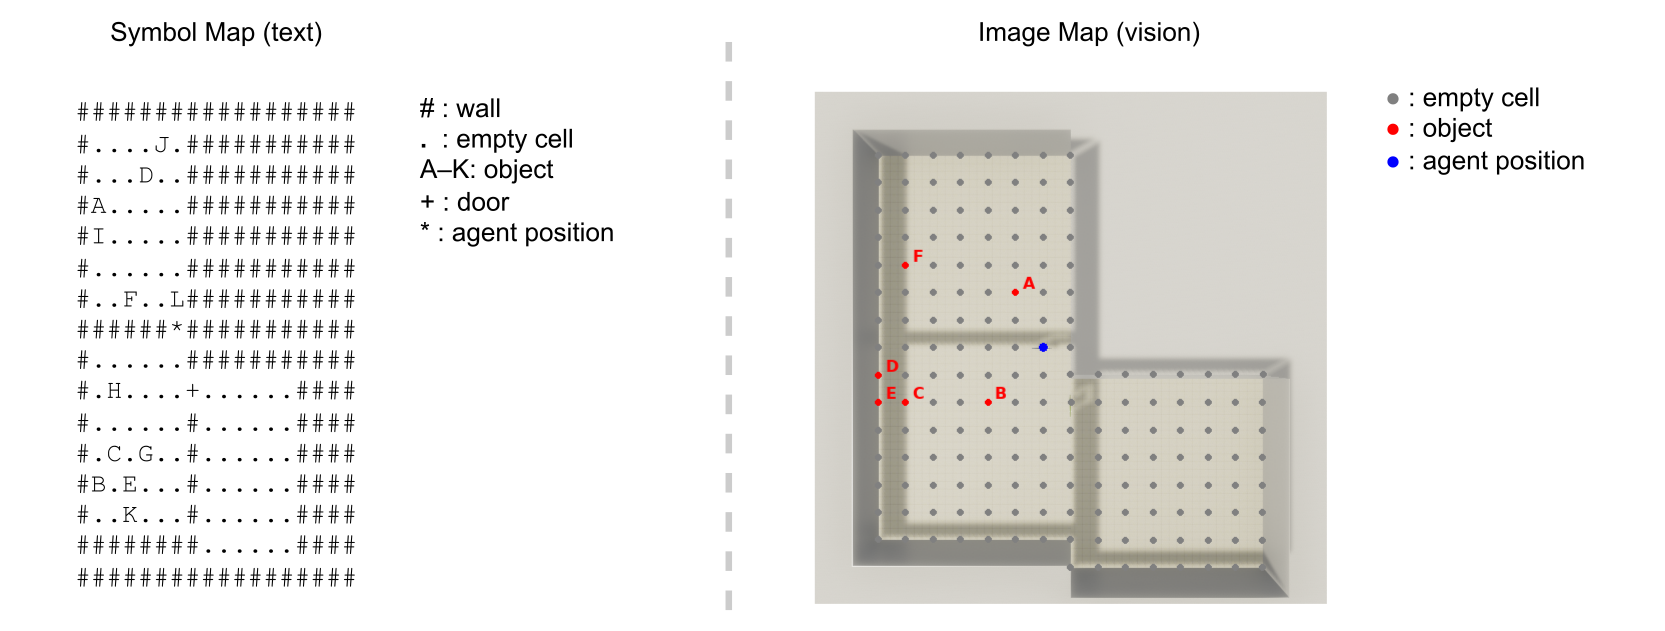
Scenes are integer-grid, connected multi-room layouts with named objects and cardinal headings. The default has three 6×6 rooms with four objects each. Agents know the room count and object names. High-level actions move directly to objects, rotate, observe, query visible-object coordinates, or terminate; movement feasibility and motor control are abstracted away. Text and vision share layouts, while observations have different informational and perceptual demands.
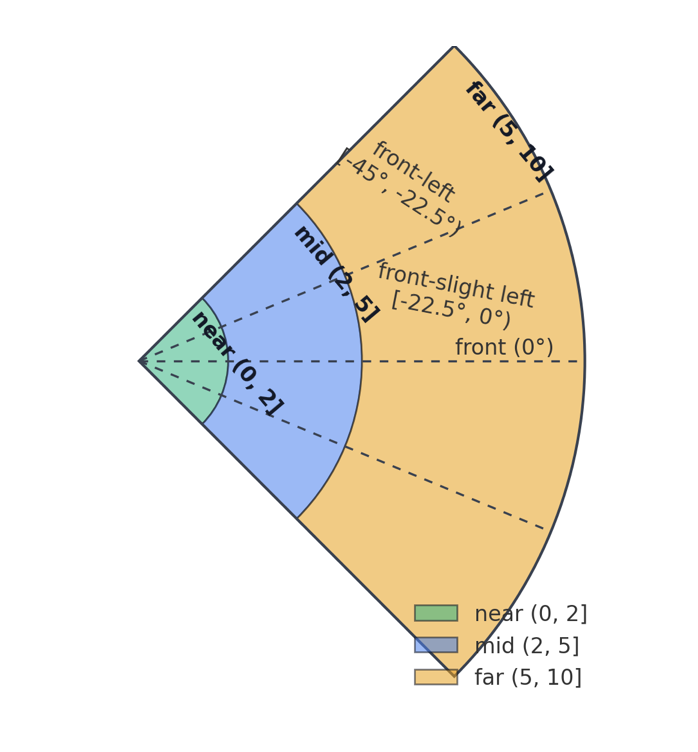
The field of view spans 90°. Text reports binned egocentric direction, distance, identity, and facing. The main specification uses six distance categories from coincident through very far, and eight allocentric directions; Figure 7(a) instead illustrates different distance boundaries. The vision condition includes calibration and canonical object-view images. Query costs two units and Observe one, but queries are rare and analyses mainly count turns. The full prompt permits multiple movement commands before one observation, so a reported step is not a primitive move or distance traveled.
3.2 Downstream Spatial Tasks
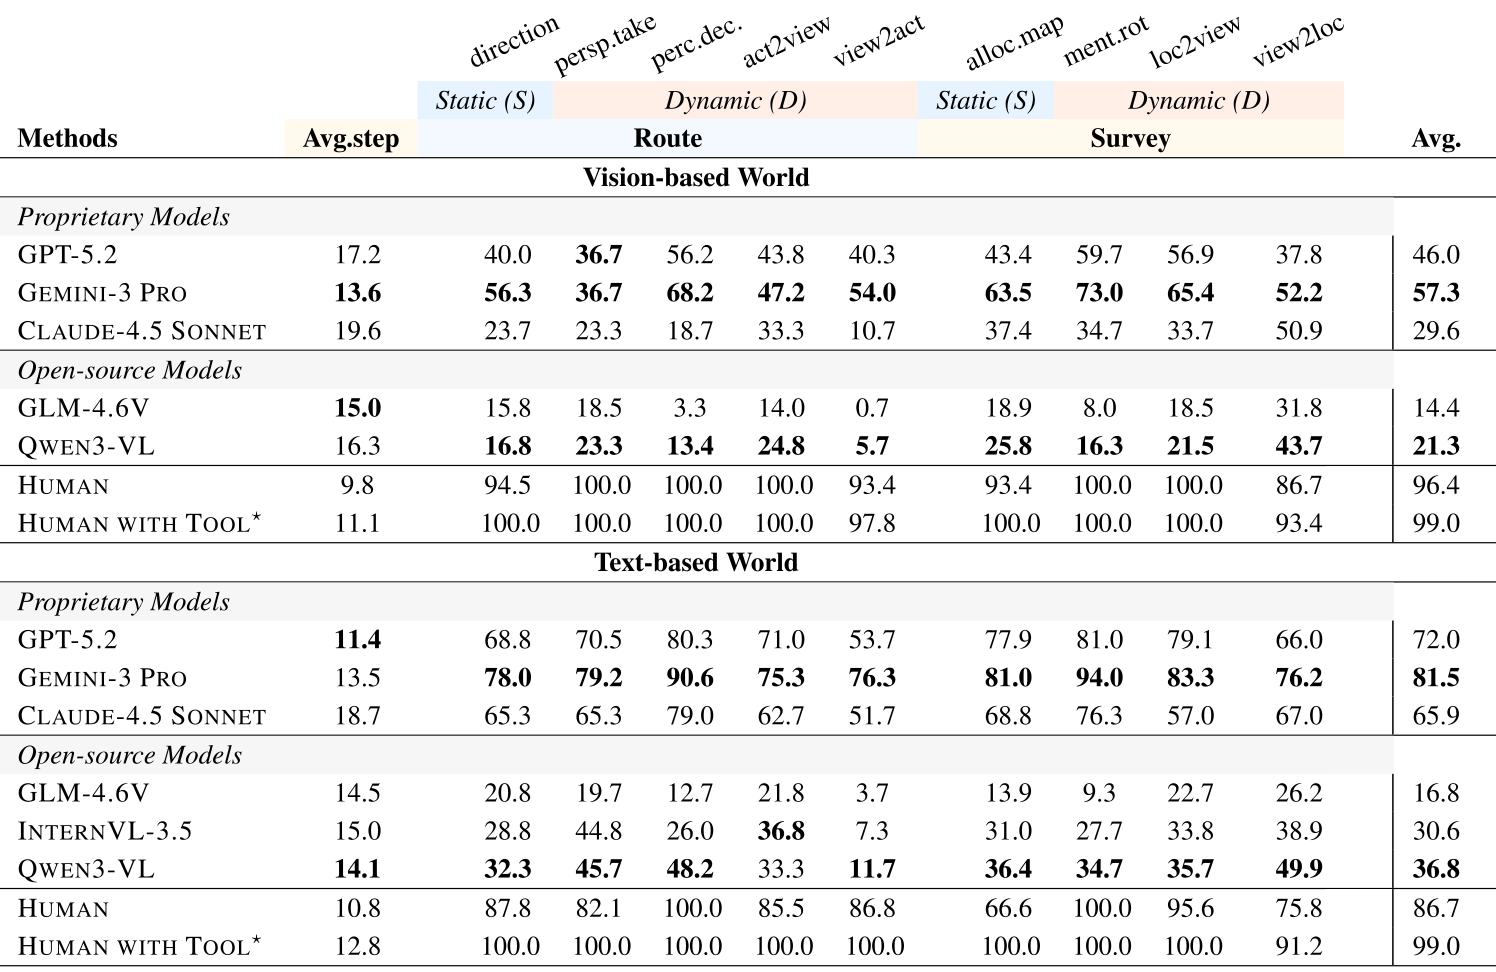
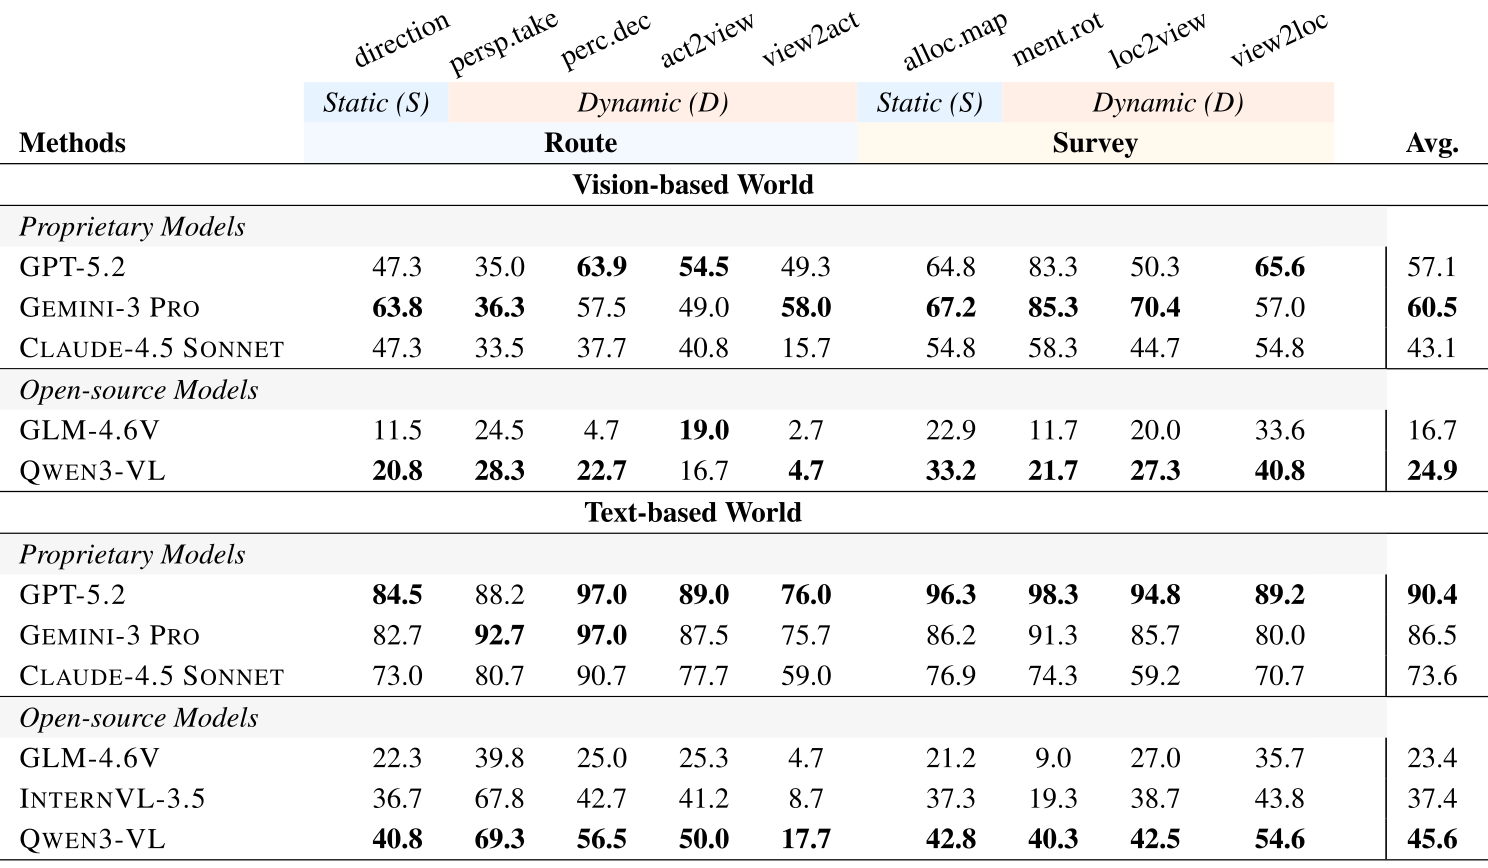
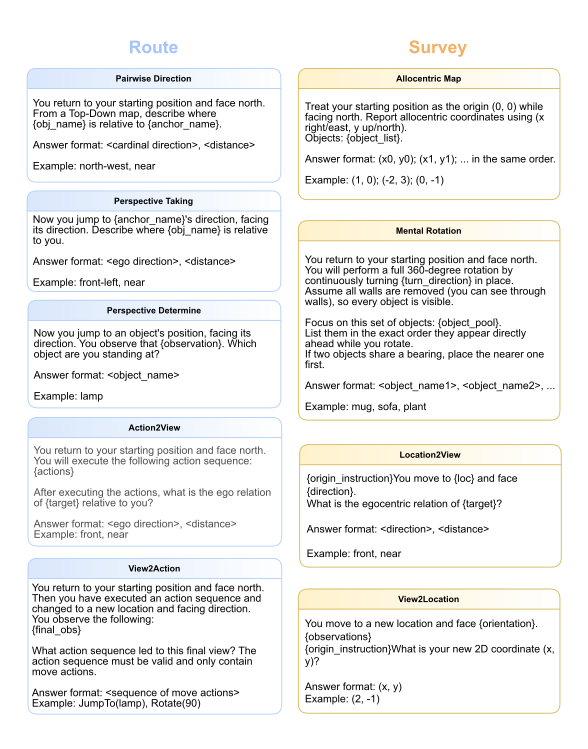
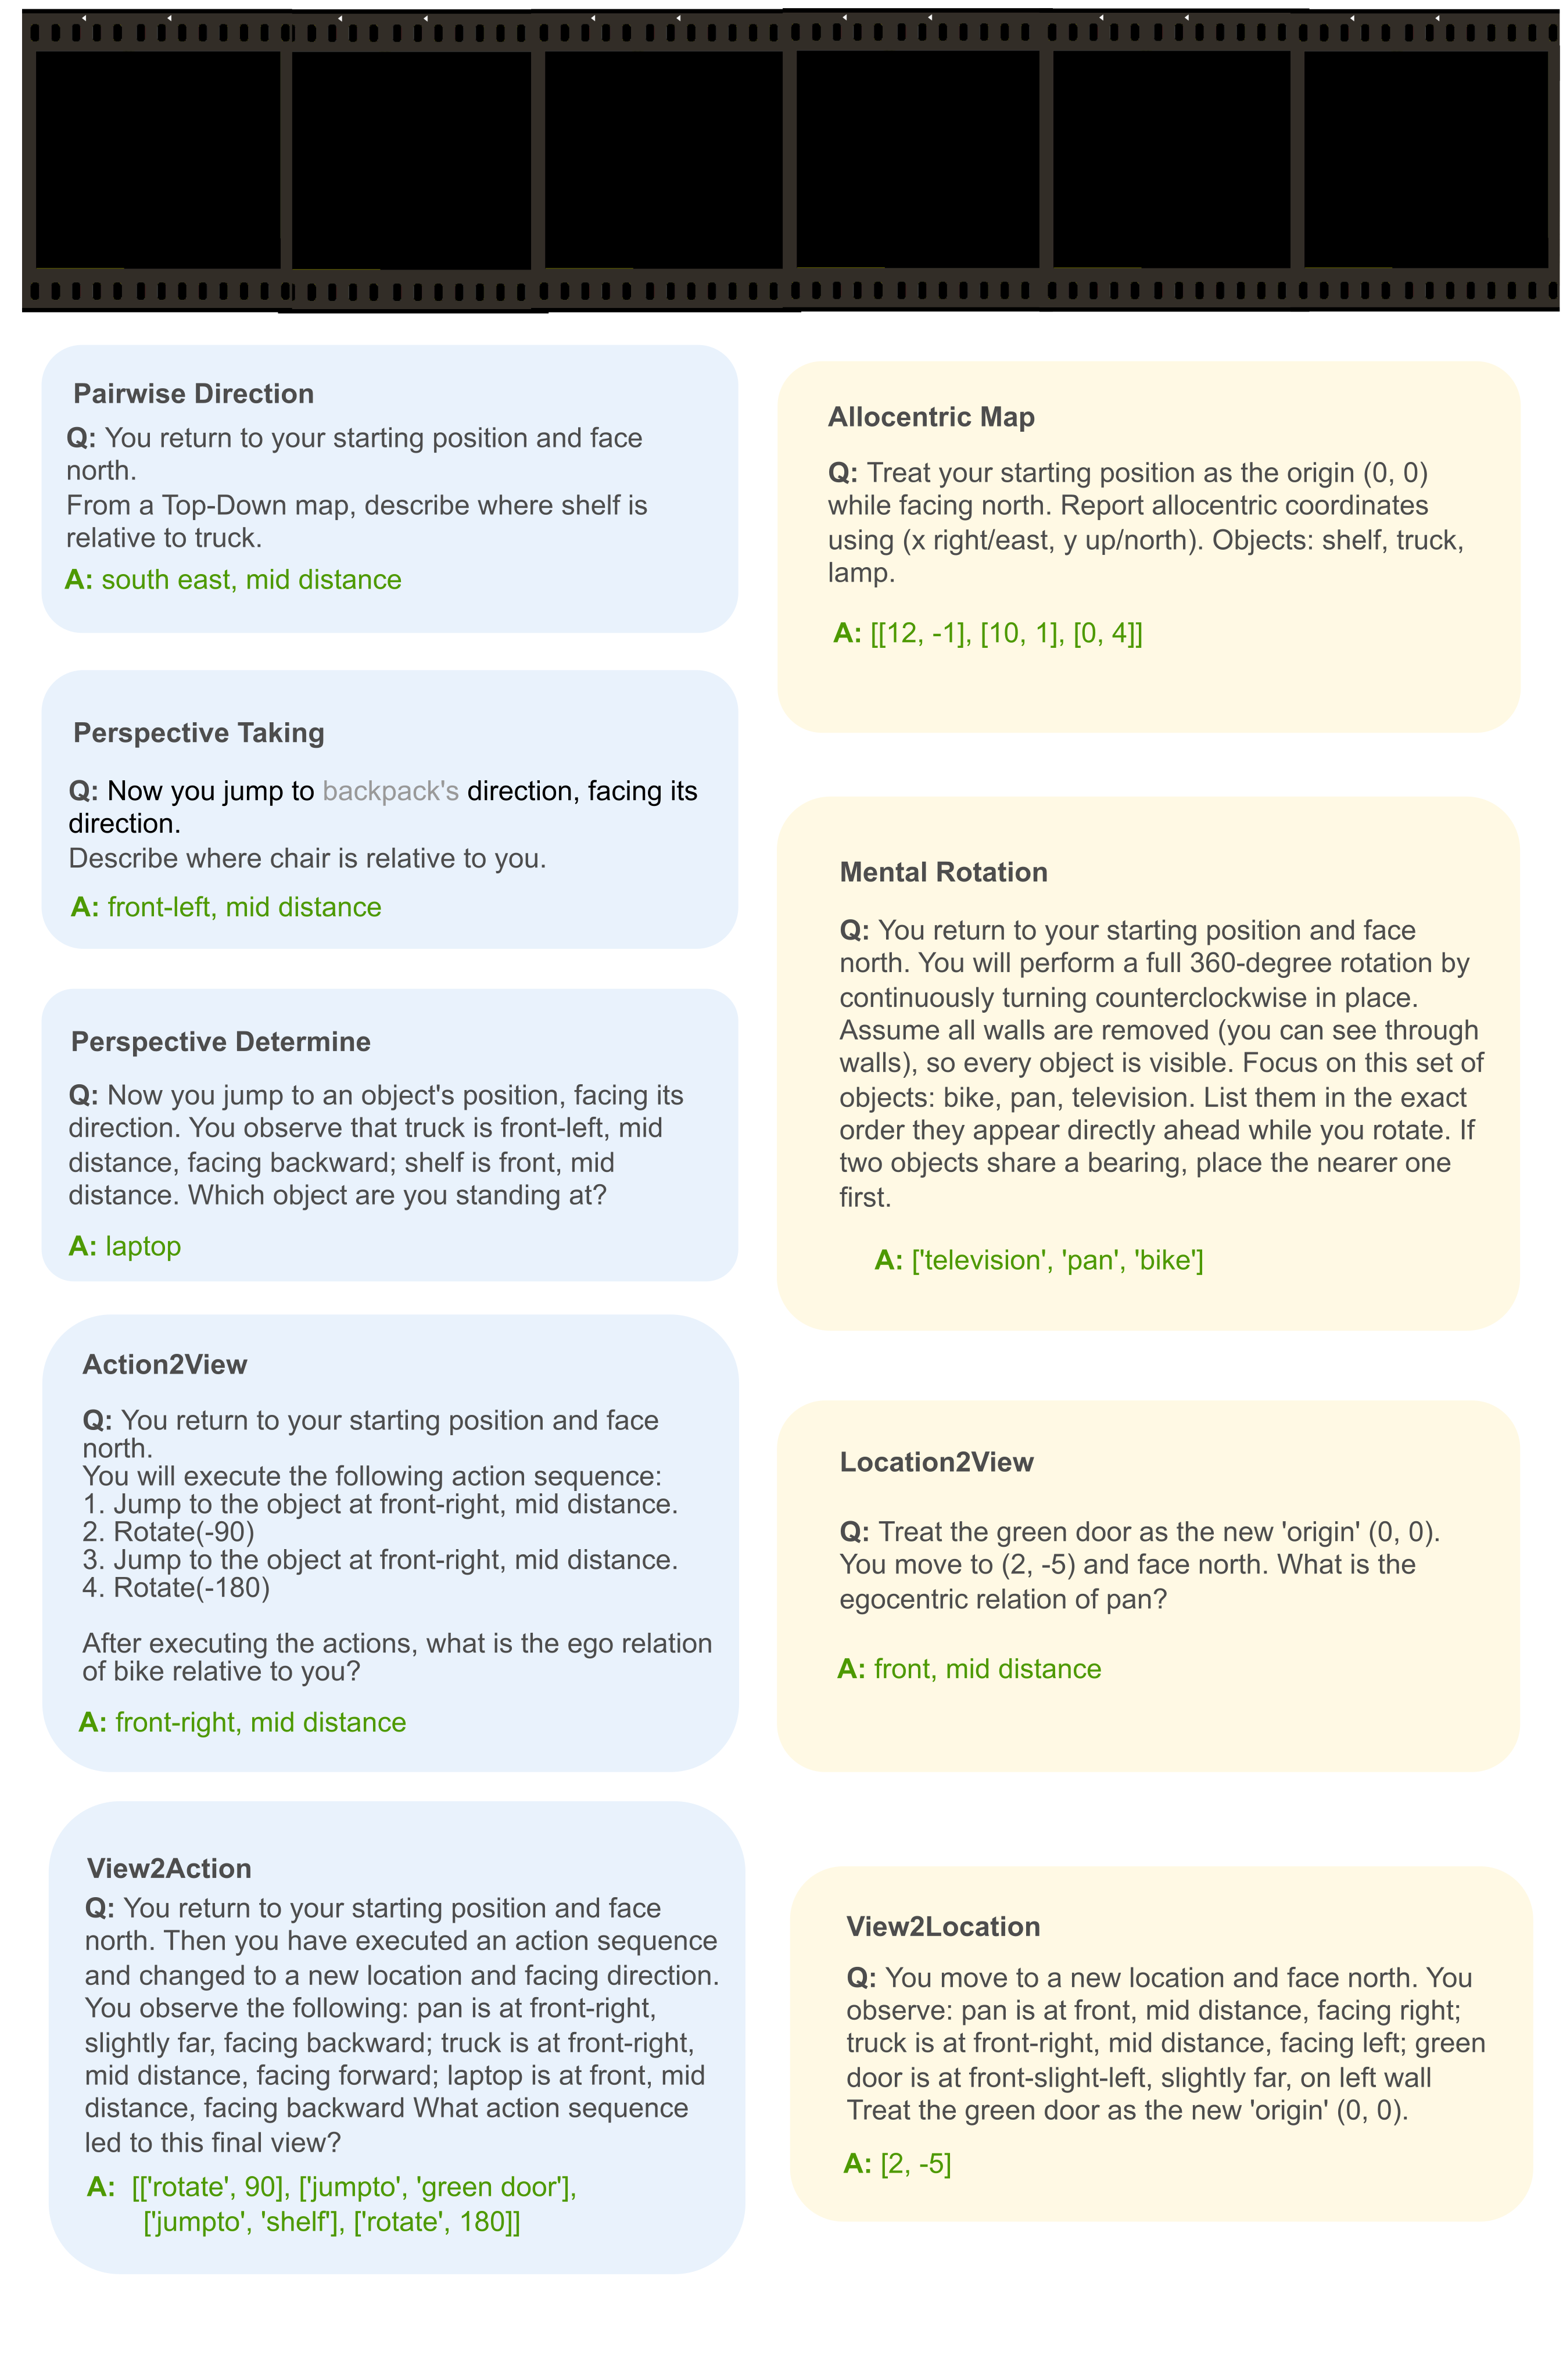
Nine open-ended tasks assess five route abilities—pairwise relations, perspective taking, perspective identification, action-to-view, and view-to-action—and four survey abilities: allocentric mapping, mental rotation, location-to-view, and view-to-location. Answers follow fixed formats rather than multiple-choice options. Figure 3 and Table 1 preserve the full taxonomy. Mental-rotation prompts explicitly imagine removing the walls, so this reasoning task differs from the room-bounded visibility used in exploration.
3.3 Assessment Dimensions
Construction efficiency measures how much observations reduce candidate locations: each object starts with M possible cells, and the score normalizes the sum of logarithms of its remaining candidate count. AC-3 propagates constraints. This is a marginal-domain reduction proxy, not the model’s measured entropy or a full joint posterior; vision instead uses object coverage.
Cognitive-map probes assess reported positions, pairwise directions, headings, self-tracking, temporal stability, and agreement between local and global maps. Uncertainty probes classify candidate points as previously unseen. Revision metrics measure detected changes, redundant exploration, revised correctness, and persistence of old estimates. Exploitation averages the nine downstream tasks, with direction/distance components weighted equally where applicable and normalized coordinate similarity for map answers. These measures expose different failure modes and are not interchangeable.
3.4 Exploration Strategies
Active agents choose actions using their growing histories. Passive agents receive histories generated by scripted proxies: Scout sweeps cardinal views and visits rooms, while Strategist maintains feasible object positions and selects views to resolve the largest remaining uncertainty. The standard vision baseline uses Scout and text uses Strategist. This supplies useful reference histories, but active and passive agents receive different evidence, and the two modalities do not share an identical baseline policy.
4 Evaluation and Analysis
The study evaluates GPT-5.2, Gemini-3 Pro, Claude-4.5 Sonnet, GLM-4.6V, Qwen3-VL, and InternVL3.5; InternVL is omitted from vision because of its ten-image limit. There are 100 scenes and three questions for each of nine tasks, totaling 2,700 questions per setting. Reasoning models and other models use different decoding settings, so this is not a compute-matched model comparison. The nominal active budget is 20 turns.
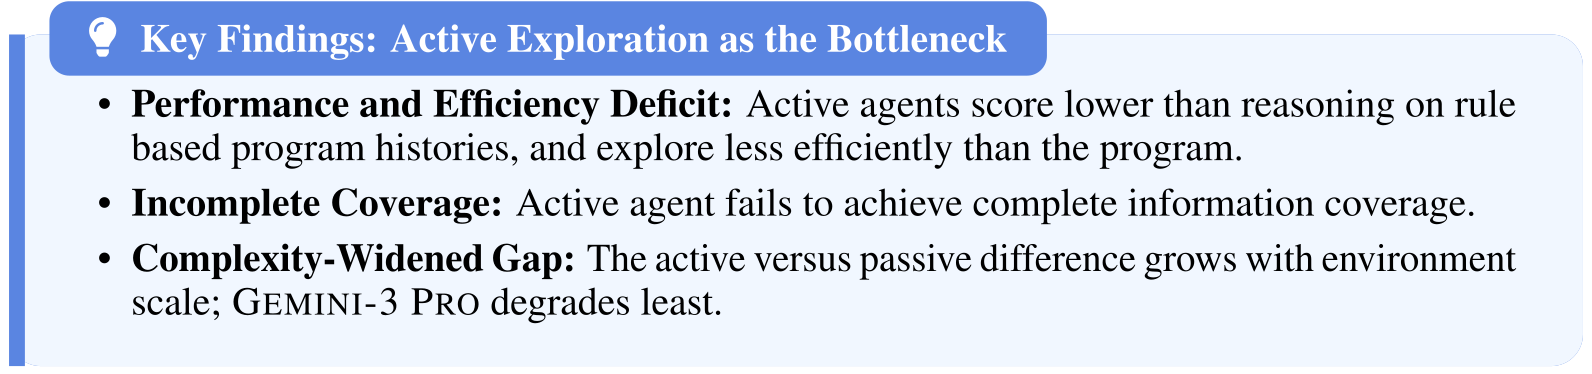
Gemini leads active average accuracy with 81.5% in text and 57.3% in vision; GPT scores 72.0% and 46.0%. On passive histories, GPT reaches 90.4% in text, while Gemini reaches 60.5% in vision. GPT and Gemini take 17.2 and 13.6 turns in active vision, versus roughly nine for the scripted baseline. Even alternate Scout text histories produce 83.9% and 86.7%, above these models’ own active histories. Three humans tested on only five scenes per modality score 86.7% in text and 96.4% in vision, rising to about 99% with instruments; this is a small reference sample.
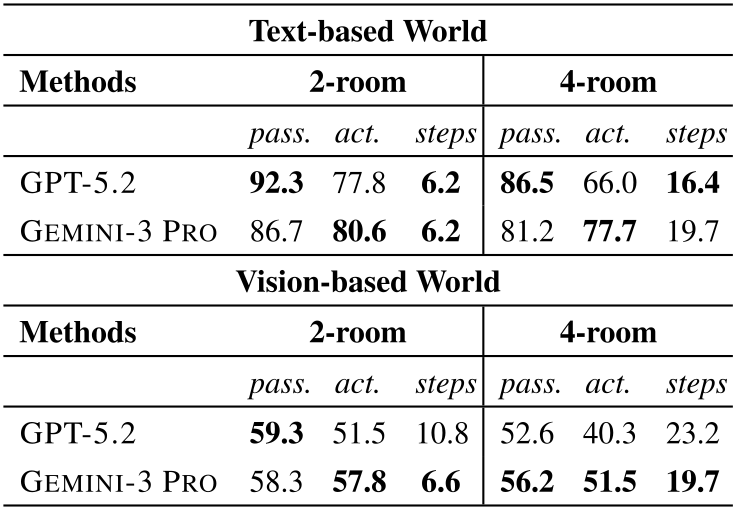
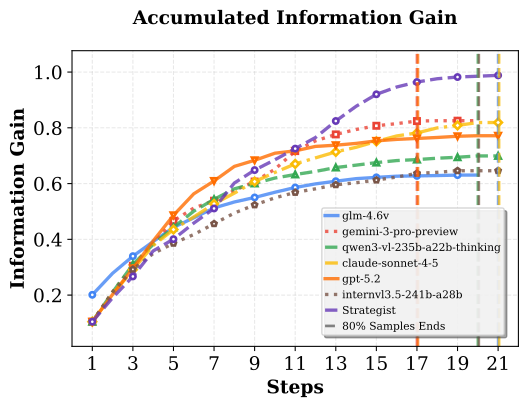
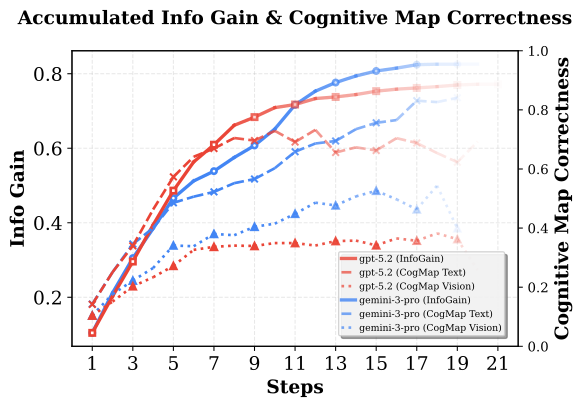
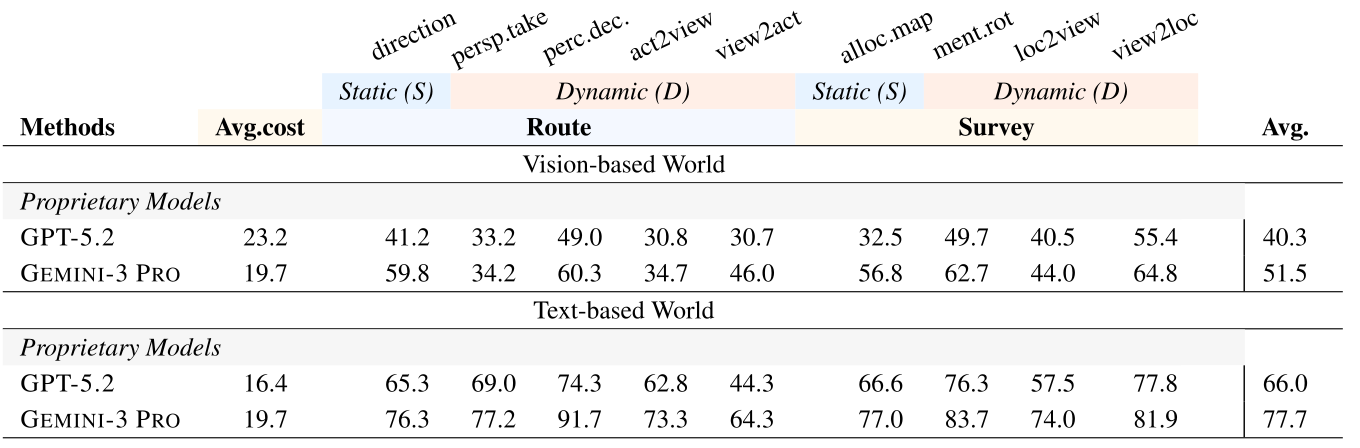
More rooms generally raise cost and lower accuracy, although not every individual comparison is monotonic. GPT’s four-room vision result reports 23.2 turns, exceeding the nominal 20-turn budget, without a clear reconciliation. Information-gain curves and selected trajectories illustrate redundant exploration, omissions, and varied sweeping behaviors. These examples help explain the aggregate pattern but do not establish a universal strategy for each model.

| Text-based World | ||||||
| Methods | 2-room | 4-room | ||||
| pass. | act. | steps | pass. | act. | steps | |
| GPT-5.2 | 92.3 | 77.8 | 6.2 | 86.5 | 66.0 | 16.4 |
| Gemini-3 Pro | 86.7 | 80.6 | 6.2 | 81.2 | 77.7 | 19.7 |
| Vision-based World | ||||||
| Methods | 2-room | 4-room | ||||
| pass. | act. | steps | pass. | act. | steps | |
| GPT-5.2 | 59.3 | 51.5 | 10.8 | 52.6 | 40.3 | 23.2 |
| Gemini-3 Pro | 58.3 | 57.8 | 6.6 | 56.2 | 51.5 | 19.7 |
5 How do Foundation Models Manage Internal Spatial Belief?
The analysis probes reported spatial representations during exploration, then tests awareness of unseen regions and revision after object changes. Local observations, a consolidated global map, and the agent’s estimated pose permit more specific diagnoses than downstream accuracy alone.

5.1 Cognitive Map Probing
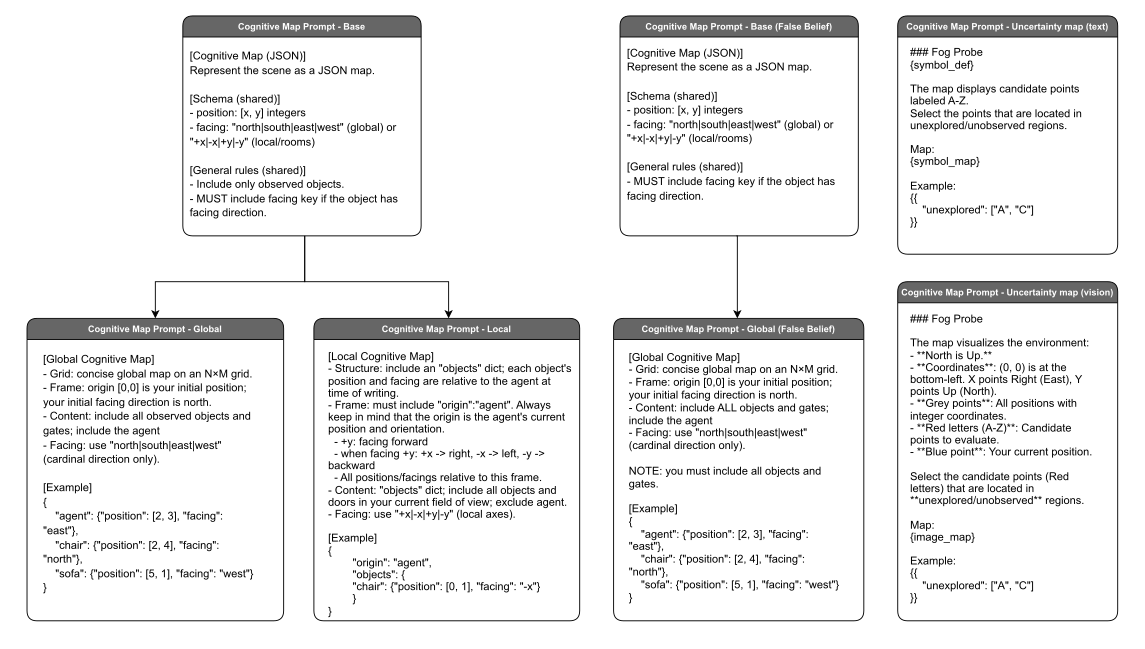
Global-map prompts request observed objects, doors, and the agent in a coordinate frame anchored at the initial position, with north as the initial heading. Local prompts describe only the current field of view in agent-centered coordinates. Position scores multiply coverage by an exponential penalty on normalized root-mean-square error; final correctness averages position, pairwise direction, and heading scores. Stability measures whether error worsens from one turn to the next: an unchanged wrong estimate can therefore count as stable. Consistency likewise does not guarantee truth.
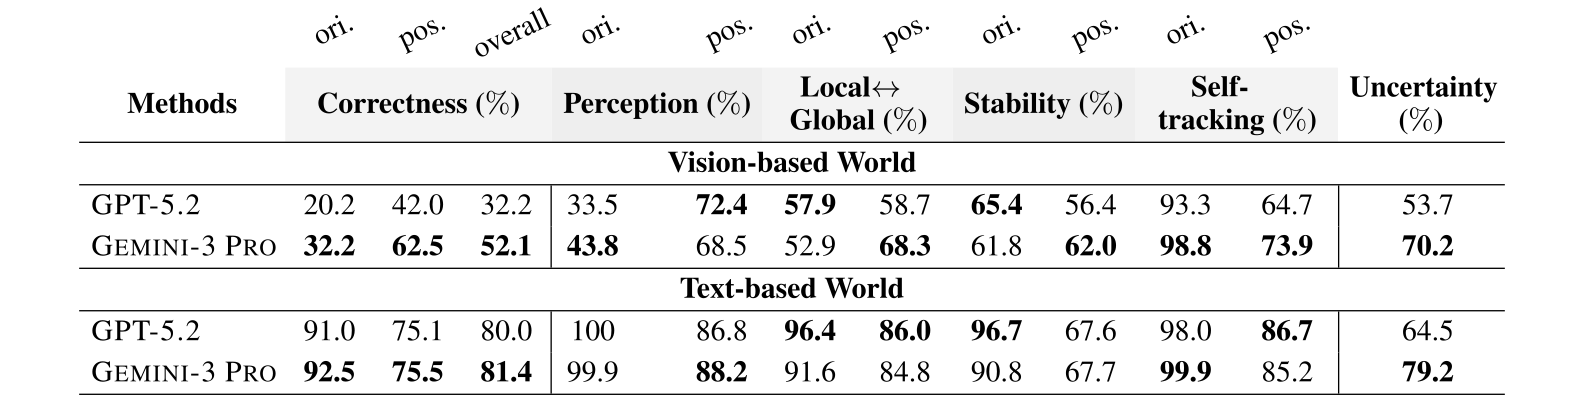
Final visual-map correctness is 32.2% for GPT and 52.1% for Gemini, versus 80.0% and 81.4% in text. Visual orientation scores fall to 20.2% and 32.2%, despite better first-observation orientation scores of 33.5% and 43.8%. Self-heading tracking is much stronger than object-heading estimation. The evolving maps suggest errors beyond first-view perception, but prompted readout error cannot be excluded.
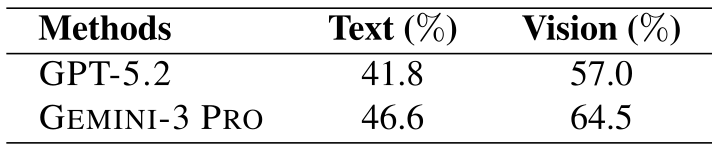
Providing an oracle map raises downstream performance to about 95% in both modalities. Asking models to first produce their own explicit map slightly reduces performance, which could reflect representation limits or additional prompting burden. Across five independent map-probe runs per sample, map correctness correlates with task accuracy: GPT/Gemini correlations are 0.418/0.466 in text and 0.570/0.645 in vision, all reported p<.001. This supports diagnostic association, not a causal account of internal storage.


5.2 Uncertainty Map Probing
The probe supplies an object-free top-down map with labeled candidate points and asks which remain unobserved. Text uses a symbolic grid; vision uses an image. GPT’s F1 is 64.5% in text and 53.7% in vision; Gemini reaches 79.2% and 70.2%. These are coverage-classification scores rather than calibrated uncertainty estimates. They align with the reported pattern of GPT gathering evidence quickly then plateauing, while Gemini continues improving, without isolating that strategy as the sole cause.
5.3 Belief Revision Task
After initial exploration, four objects are each moved or rotated. The prompt explicitly announces the number of changes, returns the agent to the starting position facing north, and preserves its history; object identities and change types remain to be discovered. The design draws on spatial belief revision. It measures change-identification F1, total turns, turns after the last changed object was observed, revised map quality, and attraction toward old estimates.
Positional inertia combines alignment of the new error with the old-location offset and a Gaussian weight for staying near the old prediction. Its noise scale is the root-mean-square error on first re-observed unchanged objects. Orientation inertia simply checks whether the reported heading remains unchanged. These operational indicators are useful, but persistence alone does not prove a particular cognitive mechanism.
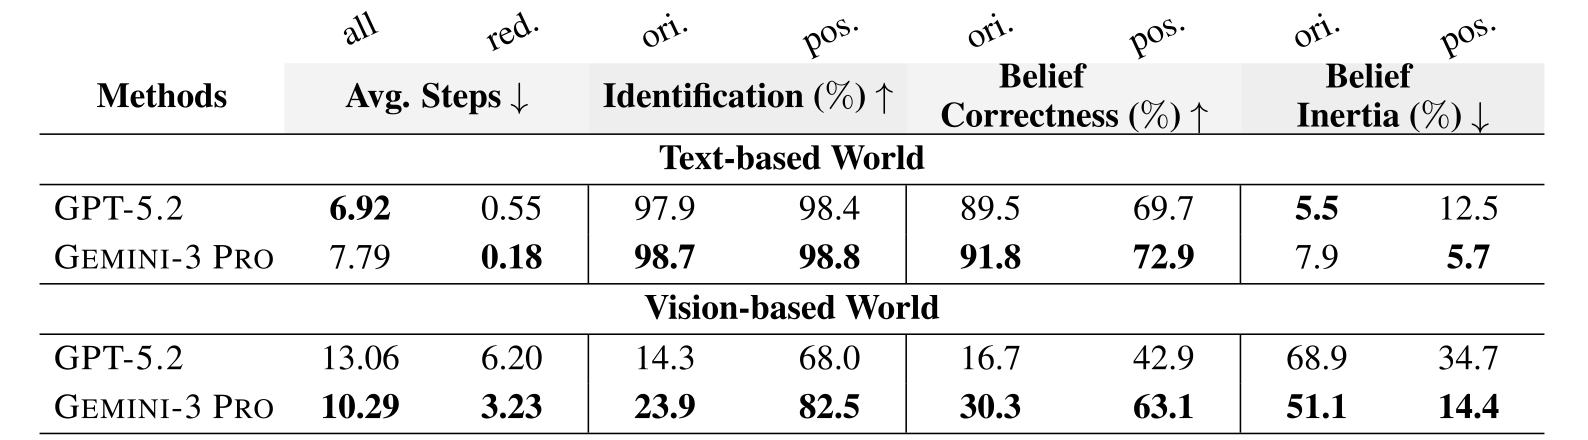
Text change-identification F1 is about 98% for both models and both change types. Vision is substantially weaker for rotations: GPT/Gemini orientation F1 is 14.3%/23.9%, versus position F1 of 68.0%/82.5%. They spend 6.20/3.23 redundant visual turns, compared with 0.55/0.18 in text. Visual orientation inertia is 68.9%/51.1%, and revised orientation correctness only 16.7%/30.3%, making facing estimation and revision major bottlenecks.
Equation

6 Related Work
Earlier textual, image, multi-view, and video benchmarks assess spatial reasoning from supplied evidence; task-driven embodied benchmarks require exploration for questions, navigation, or manipulation. Theory of Space instead evaluates zero-shot, task-agnostic exploration and explicit map reports. EXCALIBUR also studies task-agnostic exploration, using reinforcement learning; the distinction here is the training-free foundation-model setting and the process-level probes. Claims about possible goal leakage from training are methodological concerns, not demonstrated failures of every earlier agent.
7 Conclusions
The benchmark identifies information gathering, visual orientation, map stability, and updating after changes as weaknesses even when passive spatial reasoning is relatively strong. Its value is the linked examination of trajectories, reported maps, and downstream answers. Limits include synthetic tree-shaped layouts, high-level teleport-like movement, a known object inventory, different text/vision representations and proxies, a small human sample, and map probes that may themselves affect responses. The results do not establish real-robot navigation performance or directly reveal hidden beliefs. Multi-agent exploration and more robust uncertainty-guided mapping remain future directions.
Appendix
The appendix preserves implementation details, complete prompts, additional room-count experiments, and qualitative trajectories and analysis interfaces.
Appendix A Technical Details
Technical details specify the simulator, observation formats, constraint-based scoring, scripted explorers, and full task and probing prompts.
A.1 Benchmark Construction
A Gym-like interface exposes discrete interaction with a partially observed grid world and 384×384 rendered views. Objects occupy integer coordinates with north/east/south/west headings. Room adjacency is a connected tree, excluding loop closure through cyclic layouts. Randomized spawn poses and seeded scene generation provide controlled instances; the implementation abstracts away continuous motion.
Text-based World
Observe returns visible object identities, binned direction and distance, and facing when available. Visibility is confined to the current room; standing in a doorway opens views into both adjoining rooms. Optional observation-noise modules are described, without a corresponding main-result noise sweep. Figure 7(a)’s illustrative near/mid/far boundaries differ from the six-bin main specification and prompt, so they should not be silently treated as one consistent discretization.
Vision-based World
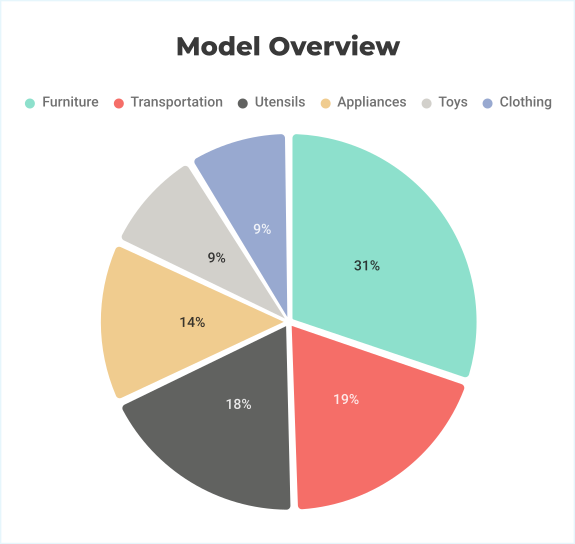
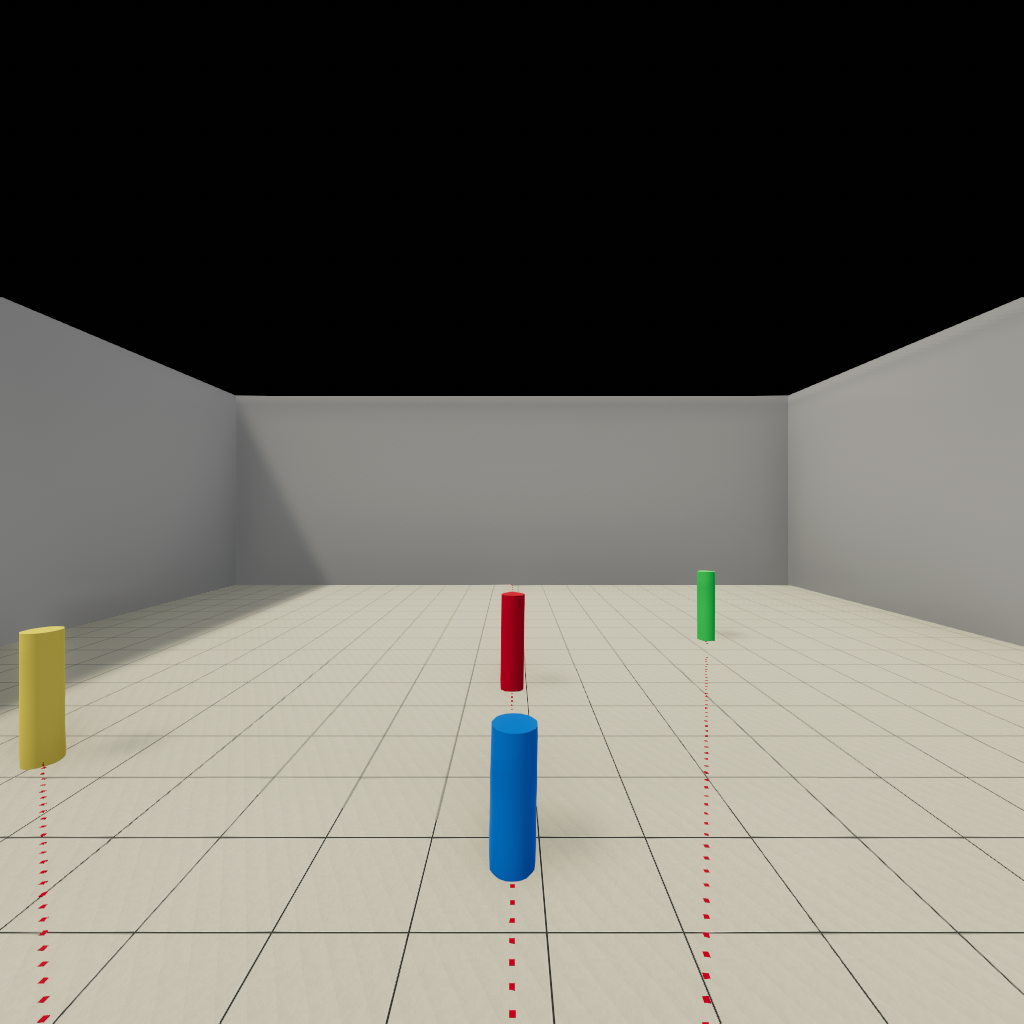
The visual scene library contains 293 models in six categories and 37 subtypes, with each object type used at most once per scene. Placement enforces spacing and collision constraints. Prompts include distance-calibration images and front/side object references to help infer appearance and heading. Shared random seeds control layouts, while images and symbolic observations remain different inputs.
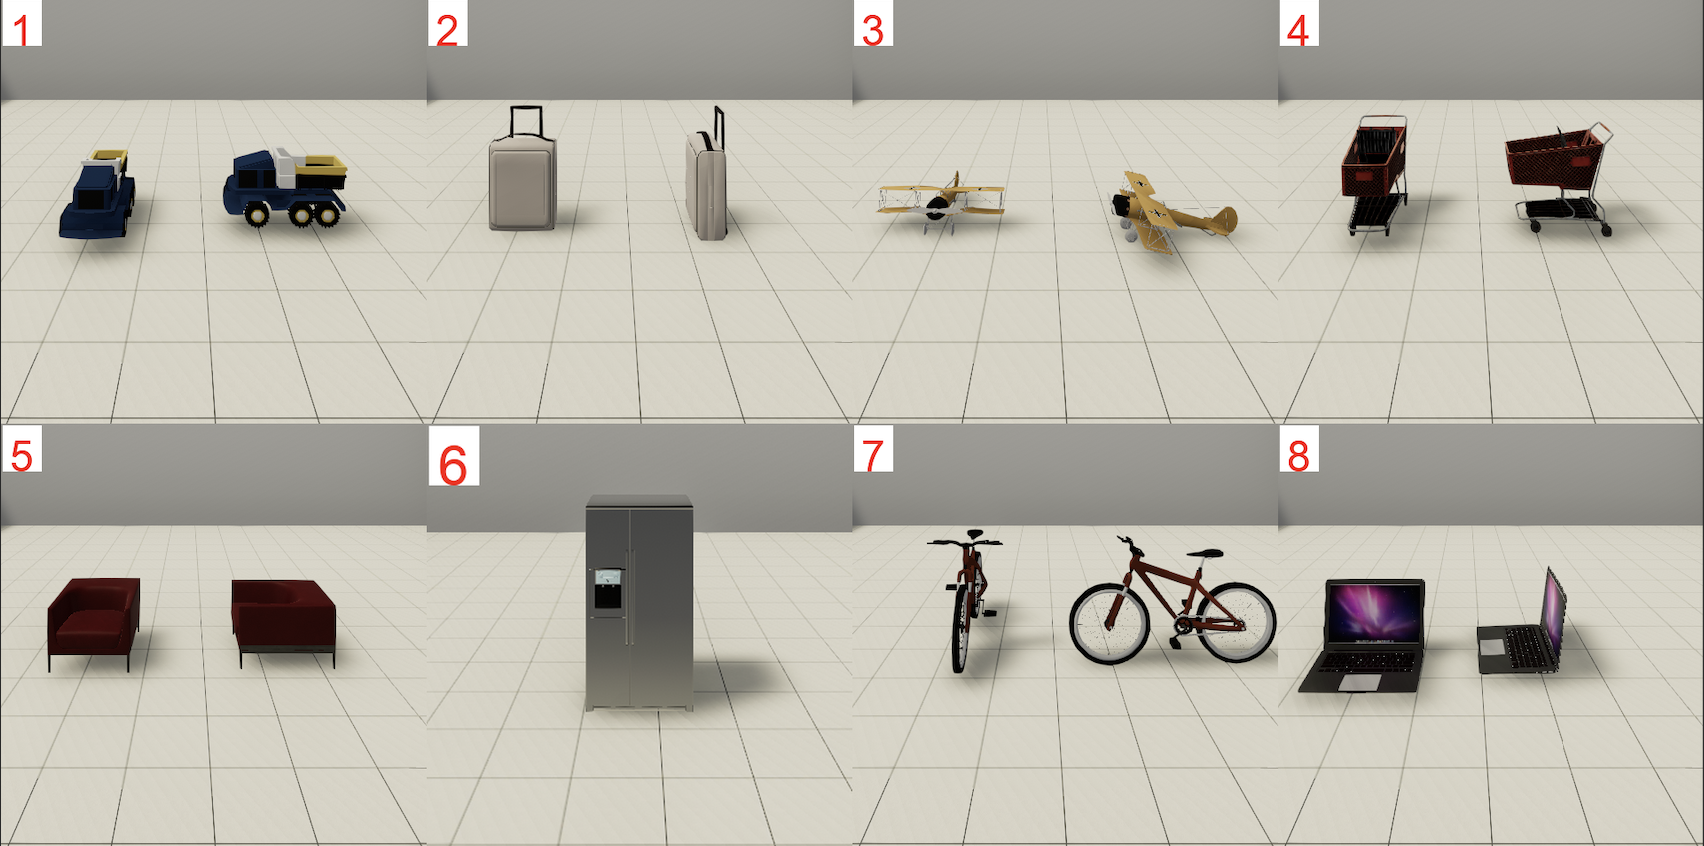
Information Gain Calculation
Each object initially has the whole 20×20 map as its candidate domain. Observations impose directional, distance, room-visibility, and collision constraints. AC-3 repeatedly removes candidates lacking support in related domains until reaching arc consistency. It does not guarantee a globally consistent joint assignment; in these valid, exact trajectories the authors argue that the true assignment remains supported, preventing empty domains. Domain reduction consequently measures information present in observations, rather than what the language model has actually inferred.
Proxy agents
Scout performs four cardinal observations at a location, then visits adjacent rooms in a fixed order and repeats. Strategist starts with a sweep, selects the object with the largest feasible-position domain, moves to a constraining viewpoint, and observes directions with unresolved pairwise relations. It continues until current-room domains become singletons before advancing. Both proxies have explicit procedural bookkeeping that the evaluated models must approximate through their histories.
Prompts
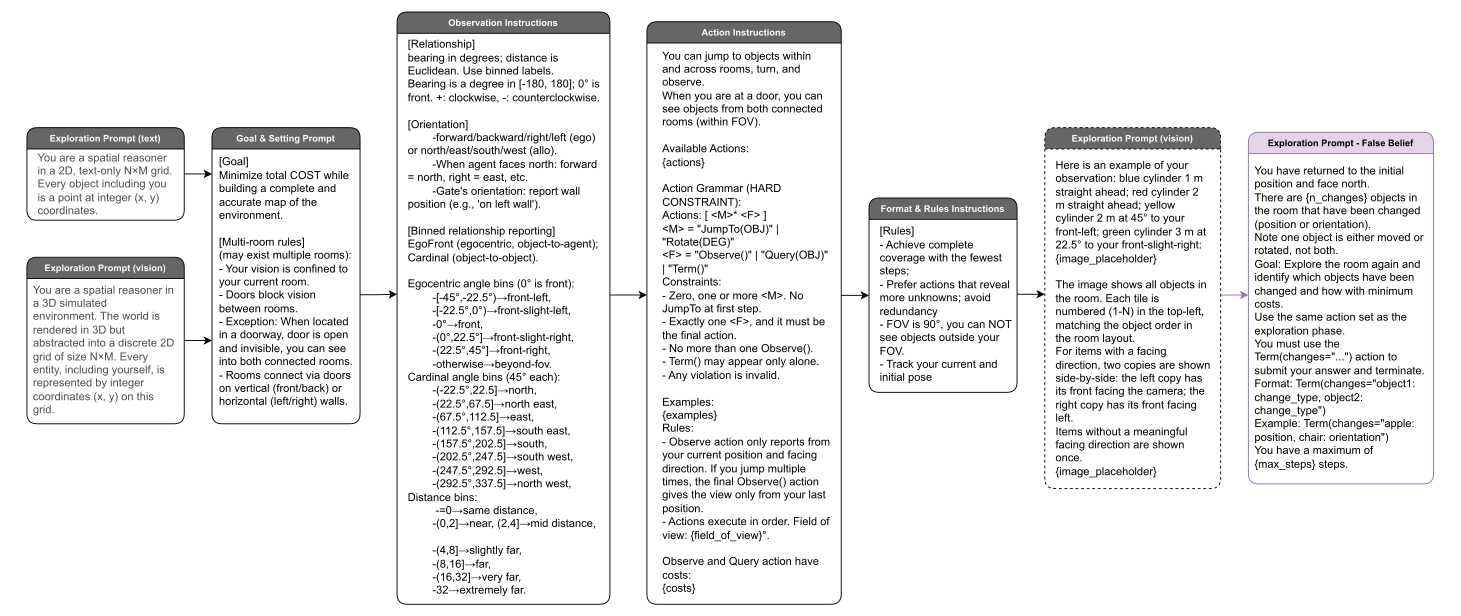
Figures 10–13 retain all exploration, task, global/local-map, changed-environment, and unseen-region prompts. Action syntax permits zero or more JumpTo/Rotate commands followed by exactly one Observe, Query, or Term; Term must stand alone, and the first turn forbids JumpTo. The revision prompt tells the agent how many objects changed and requests an object-and-change-type report. Global coordinates are anchored at the starting pose; local coordinates use +y forward and +x right. These details matter when interpreting cost, revision difficulty, and coordinate errors.
Appendix B Evaluation Setups
Evaluation instances use IDs 0–99 as random seeds for paired text and vision layouts and task sampling. The reproducibility claim concerns shared generated scenes; the actual observation streams differ by modality.
Additional Results
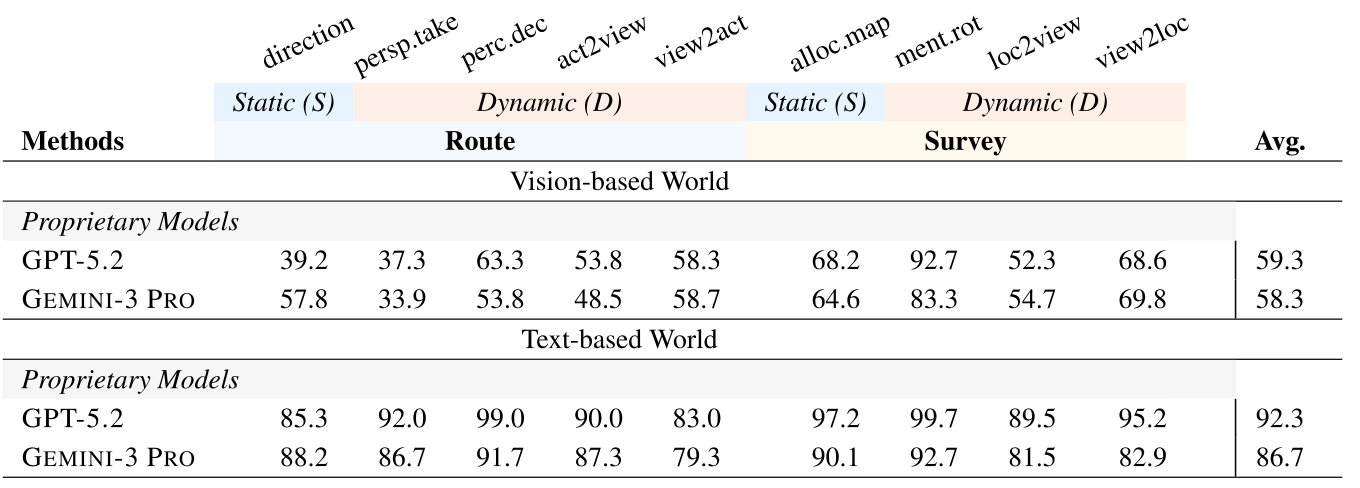
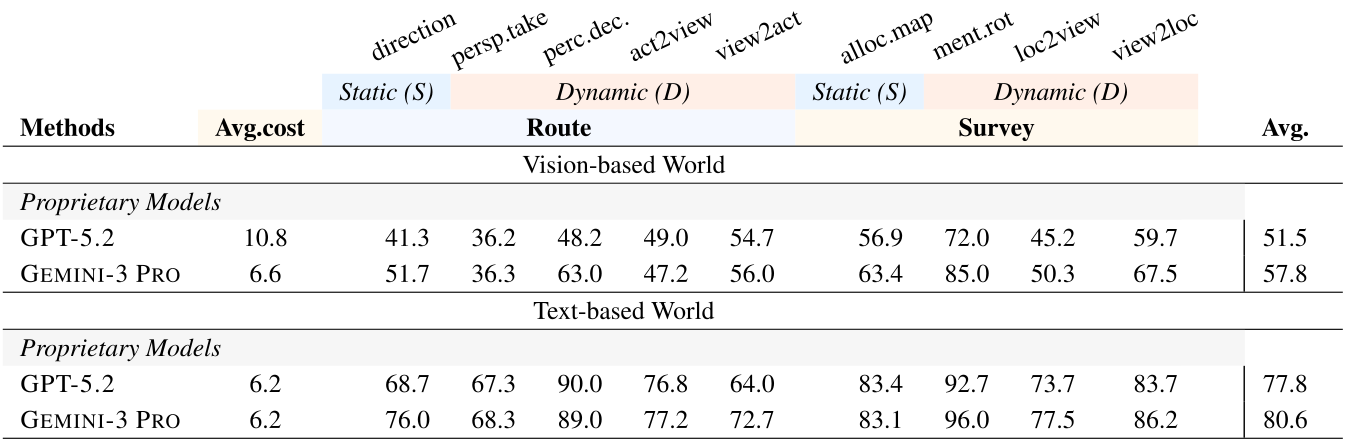
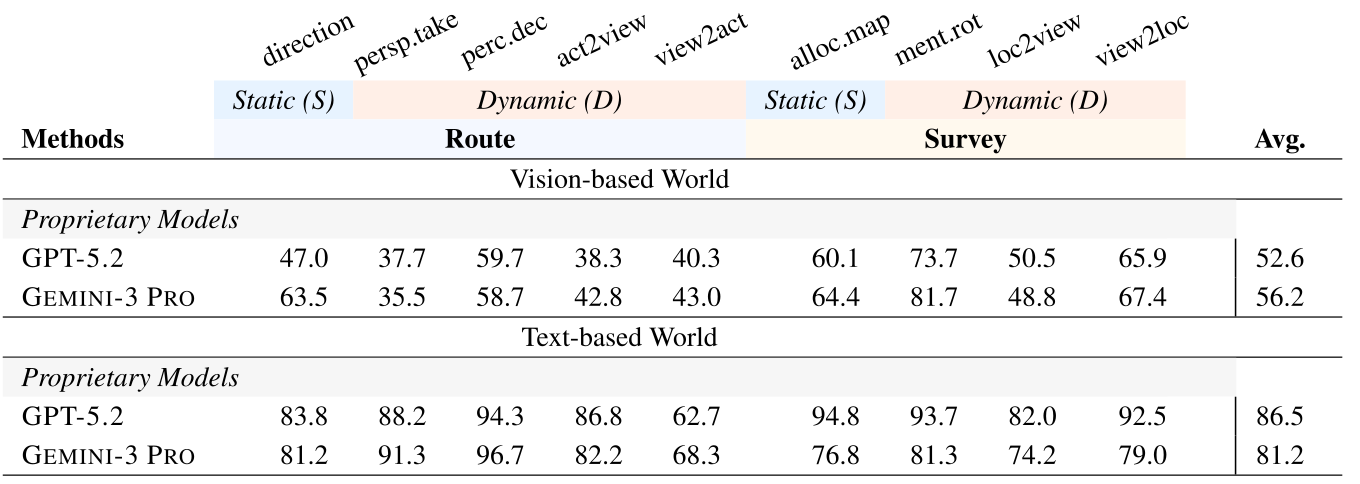
Two- and four-room tests keep the same room dimensions and objects per room; the four-room layout connects the main room to all others. Tables 8–9 report two rooms and Tables 10–11 report four rooms, despite a prose sentence incorrectly calling the latter three-room results. Higher resolution is said not to improve performance, but no detailed numerical resolution comparison is supplied here. The additional tables support increased exploration cost with room count and persistent active/passive gaps, with individual nonmonotonic accuracy changes.
| direction | persp.take | perc.dec | act2view | view2act | alloc.map | ment.rot | loc2view | view2loc | |||
| Static (S) | Dynamic (D) | Static (S) | Dynamic (D) | ||||||||
| Methods | Route | Survey | Avg. | ||||||||
| Vision-based World | |||||||||||
| Proprietary Models | |||||||||||
| GPT-5.2 | 39.2 | 37.3 | 63.3 | 53.8 | 58.3 | 68.2 | 92.7 | 52.3 | 68.6 | 59.3 | |
| Gemini-3 Pro | 57.8 | 33.9 | 53.8 | 48.5 | 58.7 | 64.6 | 83.3 | 54.7 | 69.8 | 58.3 | |
| Text-based World | |||||||||||
| Proprietary Models | |||||||||||
| GPT-5.2 | 85.3 | 92.0 | 99.0 | 90.0 | 83.0 | 97.2 | 99.7 | 89.5 | 95.2 | 92.3 | |
| Gemini-3 Pro | 88.2 | 86.7 | 91.7 | 87.3 | 79.3 | 90.1 | 92.7 | 81.5 | 82.9 | 86.7 | |
| direction | persp.take | perc.dec. | act2view | view2act | alloc.map | ment.rot | loc2view | view2loc | ||||
| Static (S) | Dynamic (D) | Static (S) | Dynamic (D) | |||||||||
| Methods | Avg.cost | Route | Survey | Avg. | ||||||||
| Vision-based World | ||||||||||||
| Proprietary Models | ||||||||||||
| GPT-5.2 | 10.8 | 41.3 | 36.2 | 48.2 | 49.0 | 54.7 | 56.9 | 72.0 | 45.2 | 59.7 | 51.5 | |
| Gemini-3 Pro | 6.6 | 51.7 | 36.3 | 63.0 | 47.2 | 56.0 | 63.4 | 85.0 | 50.3 | 67.5 | 57.8 | |
| Text-based World | ||||||||||||
| Proprietary Models | ||||||||||||
| GPT-5.2 | 6.2 | 68.7 | 67.3 | 90.0 | 76.8 | 64.0 | 83.4 | 92.7 | 73.7 | 83.7 | 77.8 | |
| Gemini-3 Pro | 6.2 | 76.0 | 68.3 | 89.0 | 77.2 | 72.7 | 83.1 | 96.0 | 77.5 | 86.2 | 80.6 | |
| direction | persp.take | perc.dec | act2view | view2act | alloc.map | ment.rot | loc2view | view2loc | |||
| Static (S) | Dynamic (D) | Static (S) | Dynamic (D) | ||||||||
| Methods | Route | Survey | Avg. | ||||||||
| Vision-based World | |||||||||||
| Proprietary Models | |||||||||||
| GPT-5.2 | 47.0 | 37.7 | 59.7 | 38.3 | 40.3 | 60.1 | 73.7 | 50.5 | 65.9 | 52.6 | |
| Gemini-3 Pro | 63.5 | 35.5 | 58.7 | 42.8 | 43.0 | 64.4 | 81.7 | 48.8 | 67.4 | 56.2 | |
| Text-based World | |||||||||||
| Proprietary Models | |||||||||||
| GPT-5.2 | 83.8 | 88.2 | 94.3 | 86.8 | 62.7 | 94.8 | 93.7 | 82.0 | 92.5 | 86.5 | |
| Gemini-3 Pro | 81.2 | 91.3 | 96.7 | 82.2 | 68.3 | 76.8 | 81.3 | 74.2 | 79.0 | 81.2 | |
| direction | persp.take | perc.dec. | act2view | view2act | alloc.map | ment.rot | loc2view | view2loc | ||||
| Static (S) | Dynamic (D) | Static (S) | Dynamic (D) | |||||||||
| Methods | Avg.cost | Route | Survey | Avg. | ||||||||
| Vision-based World | ||||||||||||
| Proprietary Models | ||||||||||||
| GPT-5.2 | 23.2 | 41.2 | 33.2 | 49.0 | 30.8 | 30.7 | 32.5 | 49.7 | 40.5 | 55.4 | 40.3 | |
| Gemini-3 Pro | 19.7 | 59.8 | 34.2 | 60.3 | 34.7 | 46.0 | 56.8 | 62.7 | 44.0 | 64.8 | 51.5 | |
| Text-based World | ||||||||||||
| Proprietary Models | ||||||||||||
| GPT-5.2 | 16.4 | 65.3 | 69.0 | 74.3 | 62.8 | 44.3 | 66.6 | 76.3 | 57.5 | 77.8 | 66.0 | |
| Gemini-3 Pro | 19.7 | 76.3 | 77.2 | 91.7 | 73.3 | 64.3 | 77.0 | 83.7 | 74.0 | 81.9 | 77.7 | |
Appendix C Additional Visualization Examples
Figure 14 gives concrete examples and strict answer formats for every route and survey task. The visual setting substitutes rendered views for textual scene descriptions; task outputs remain structured spatial answers.
Cognitive map output by models
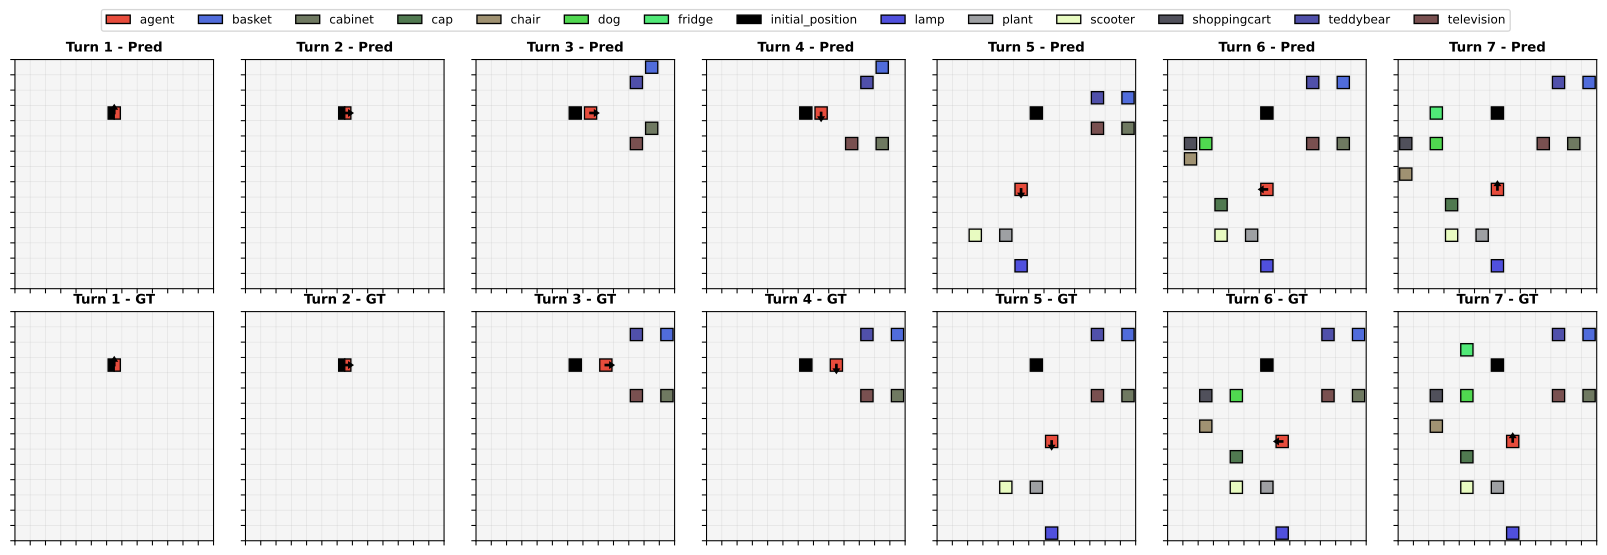
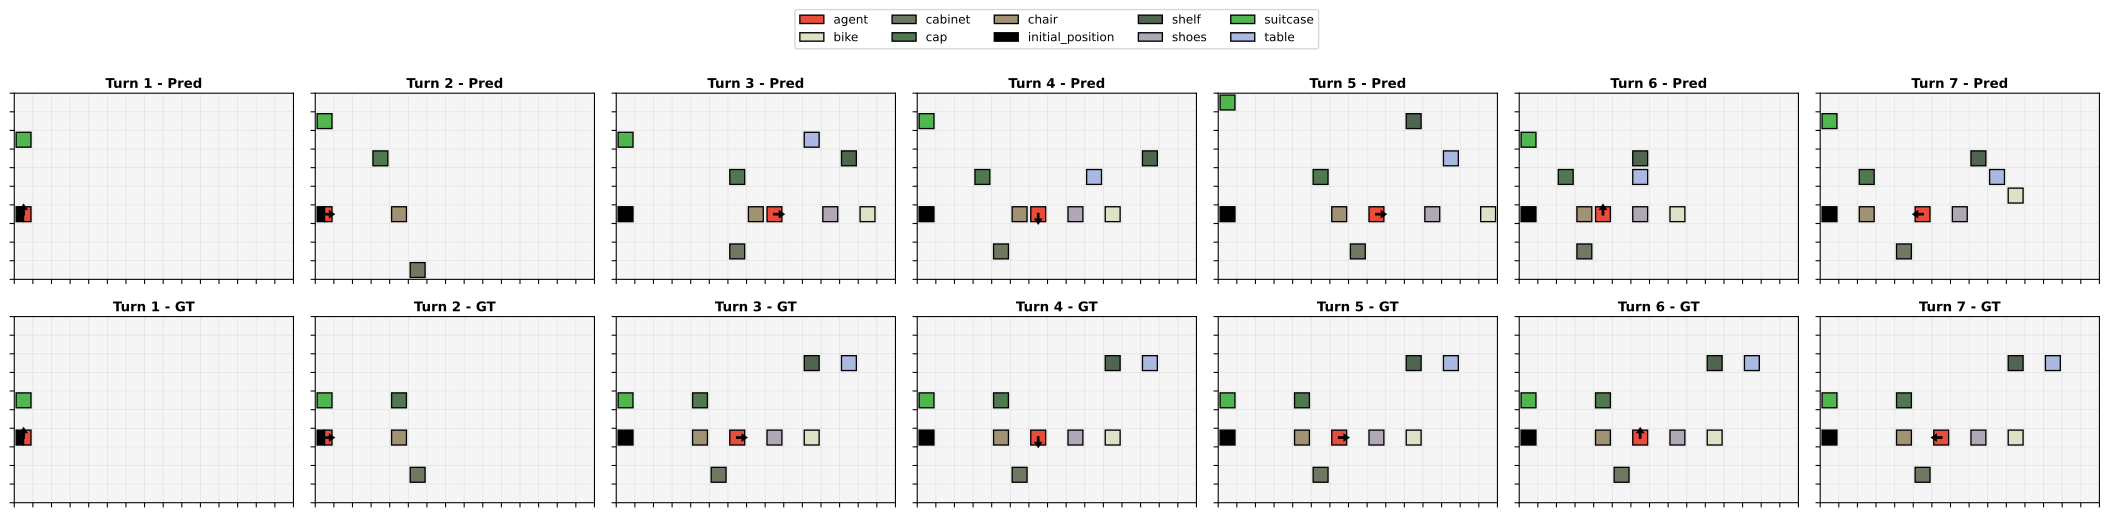
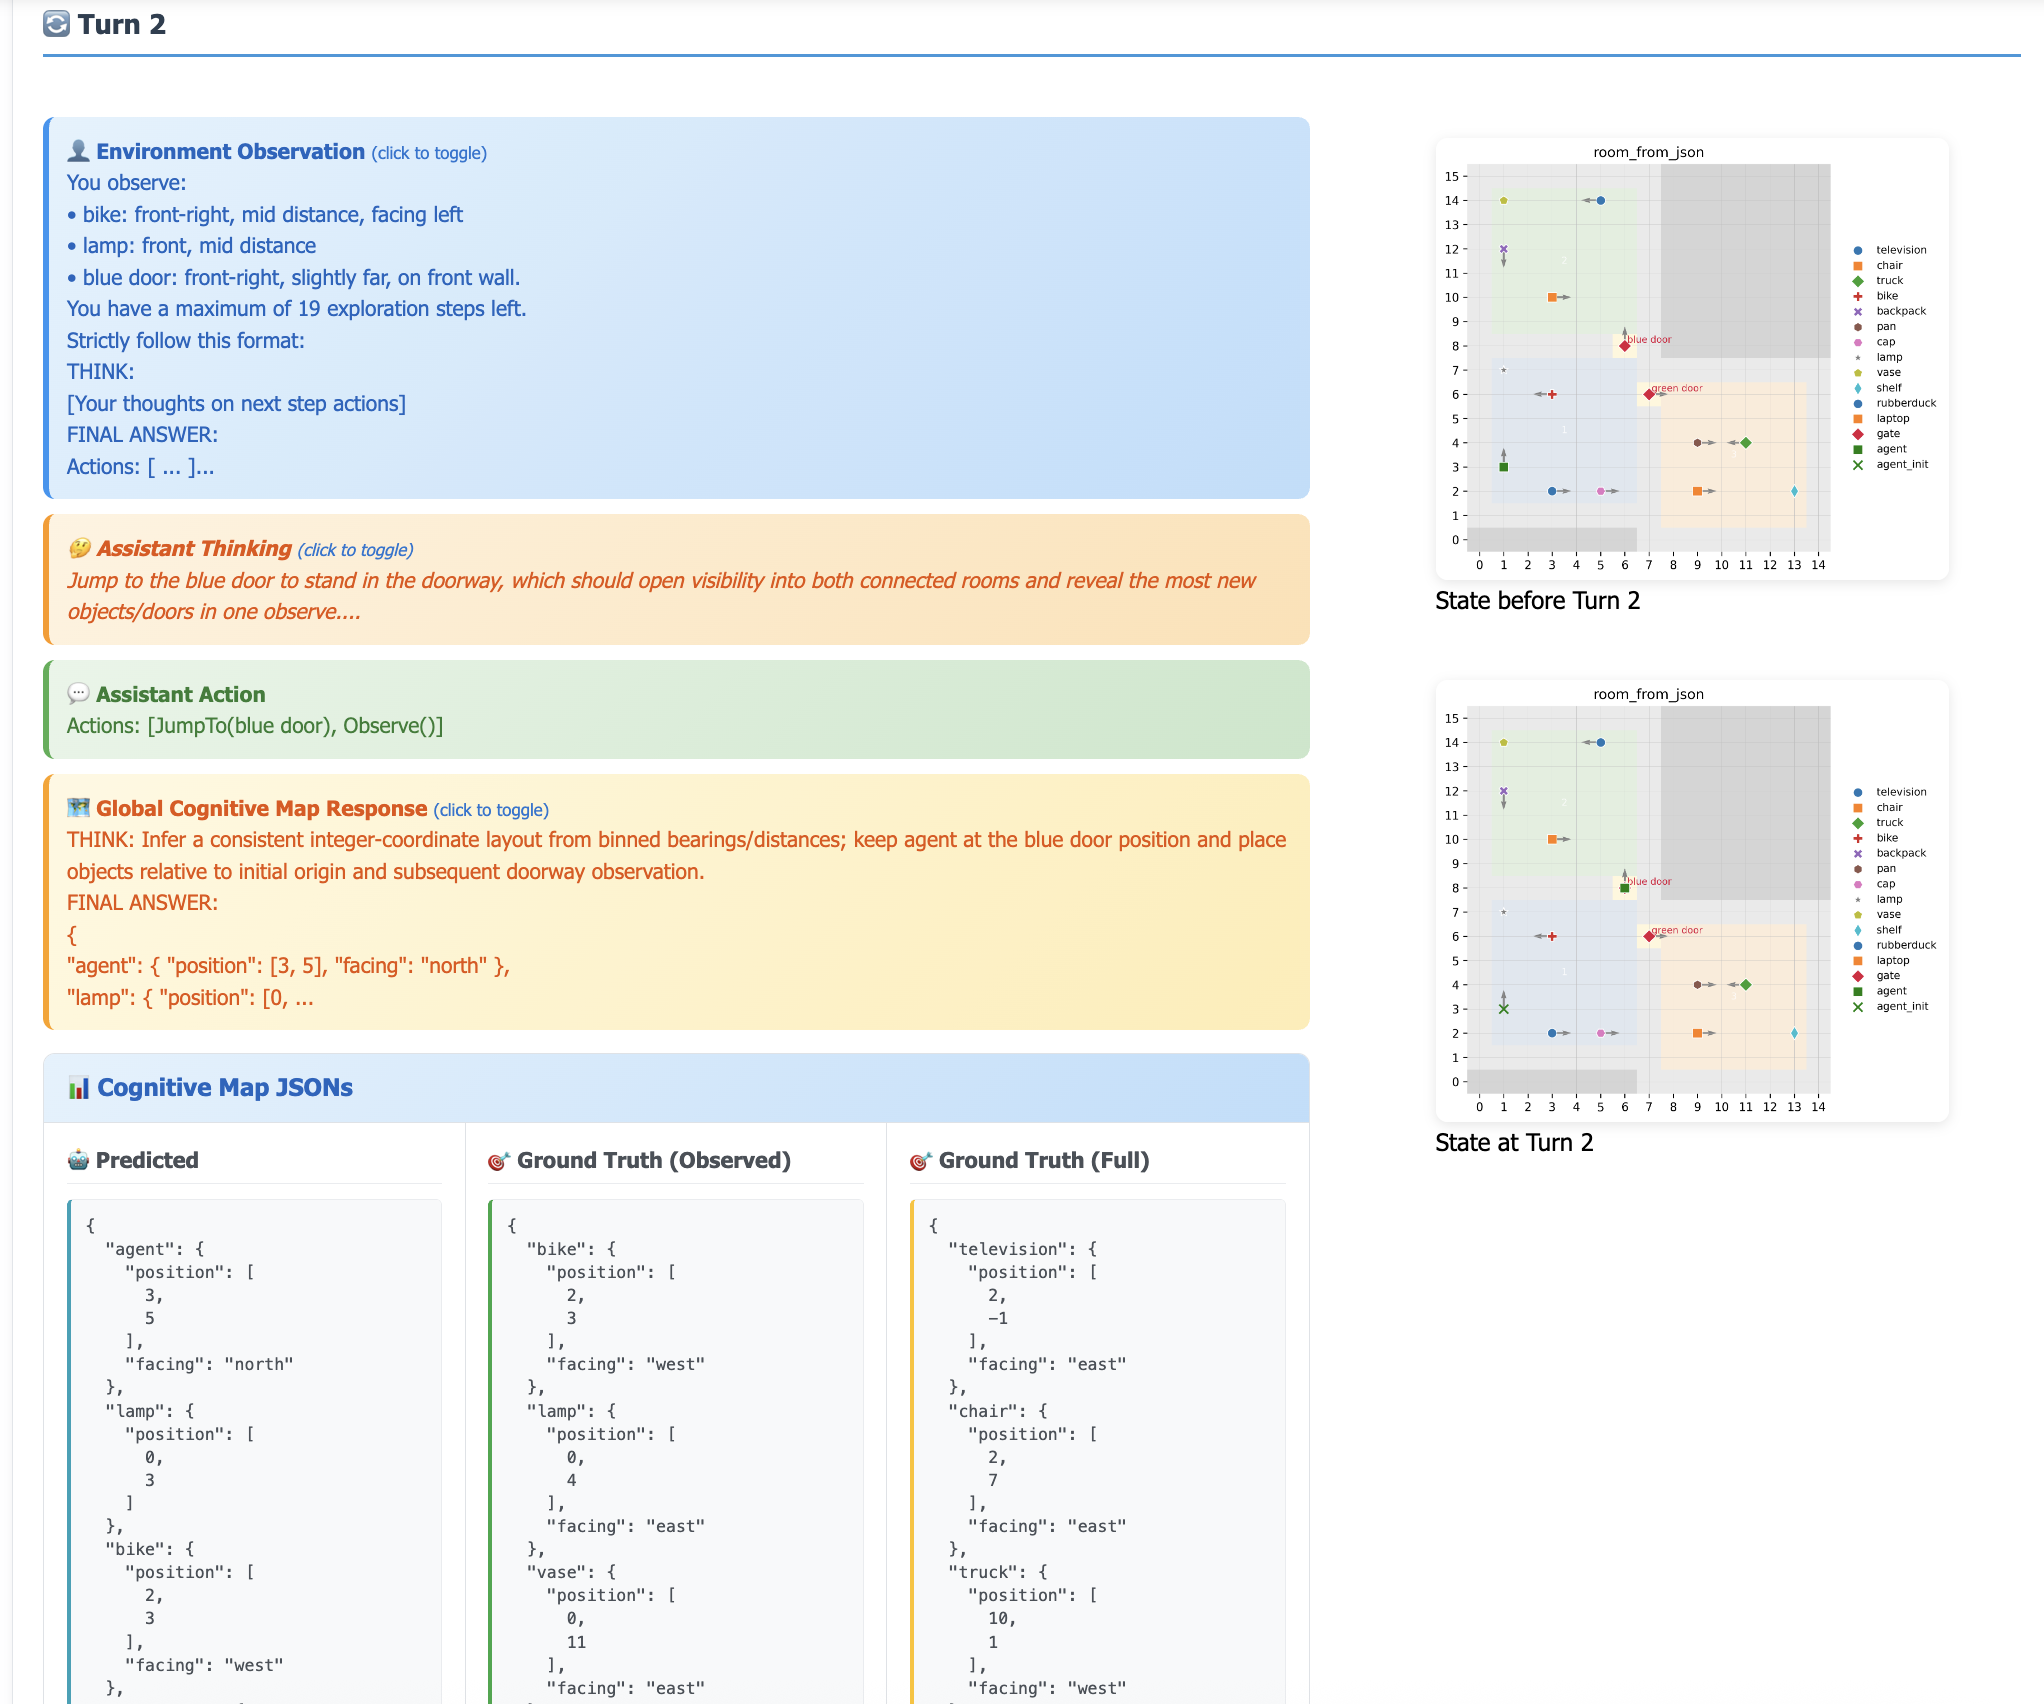
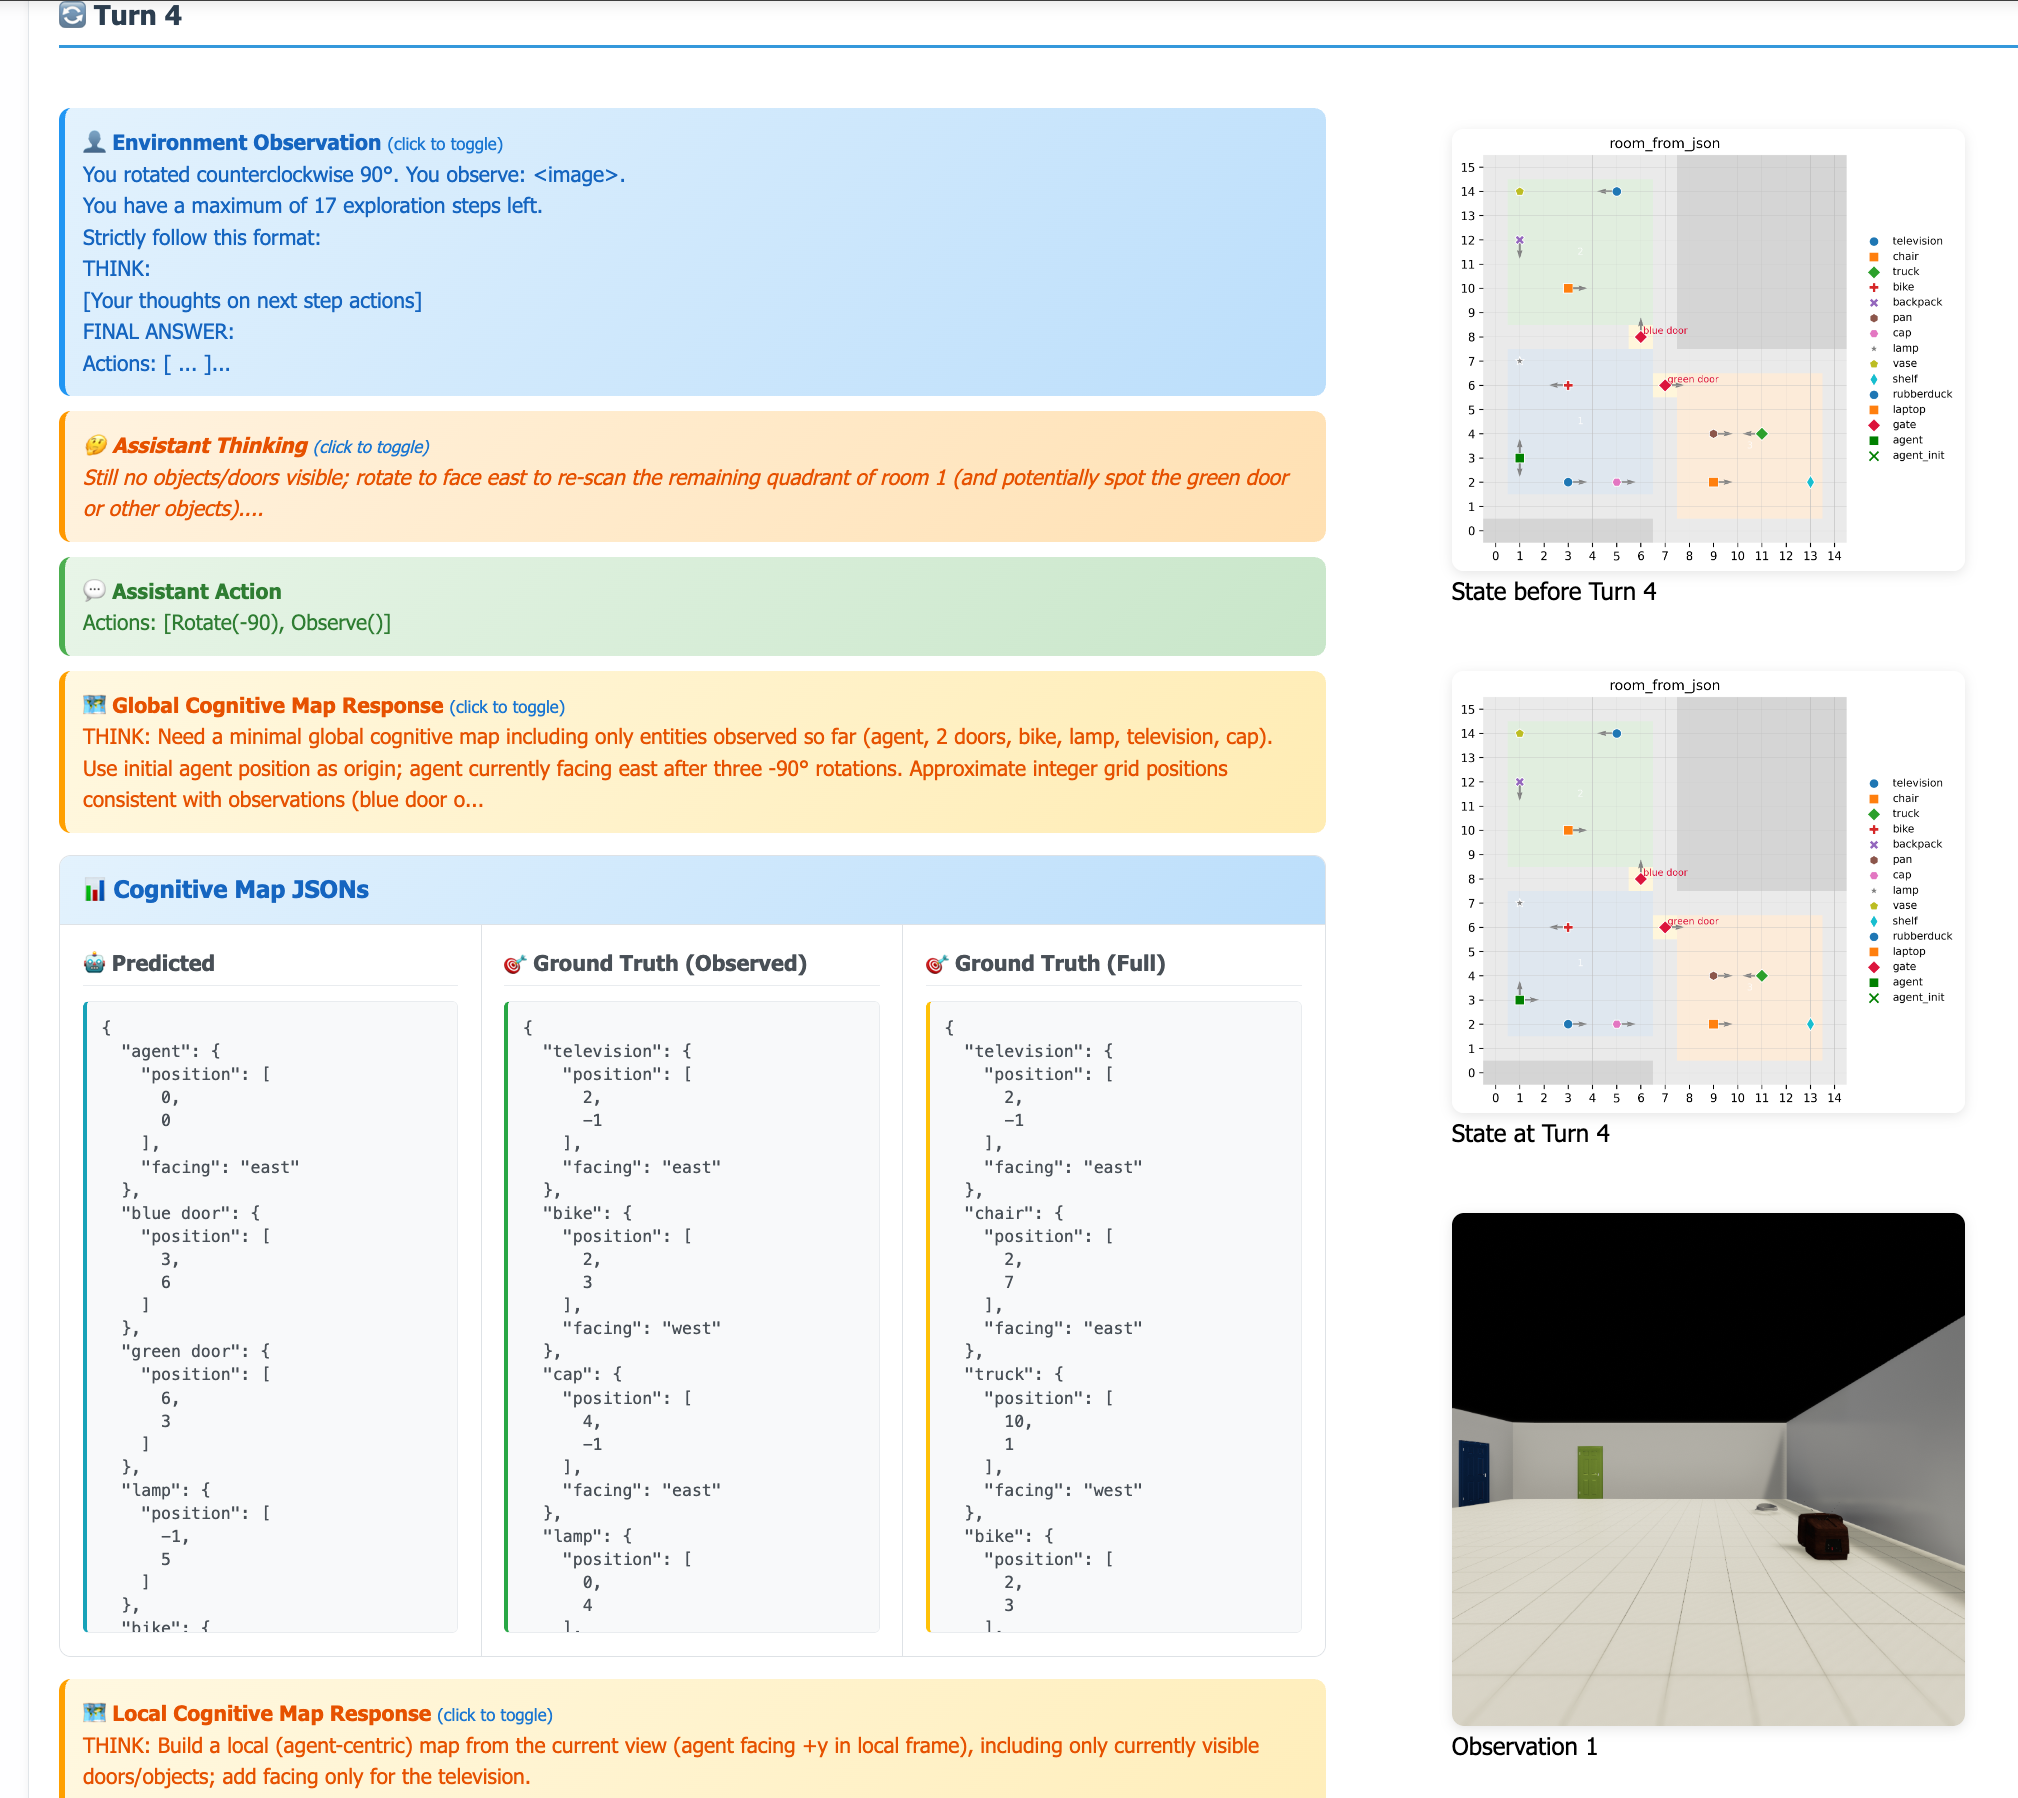
Figures 15–16 compare GPT’s predicted and ground-truth maps turn by turn in one text and one vision example. They make changing coordinate errors and retained or omitted objects visible, complementing aggregate correctness scores without constituting an additional systematic evaluation.
Exploration pattern examples by models
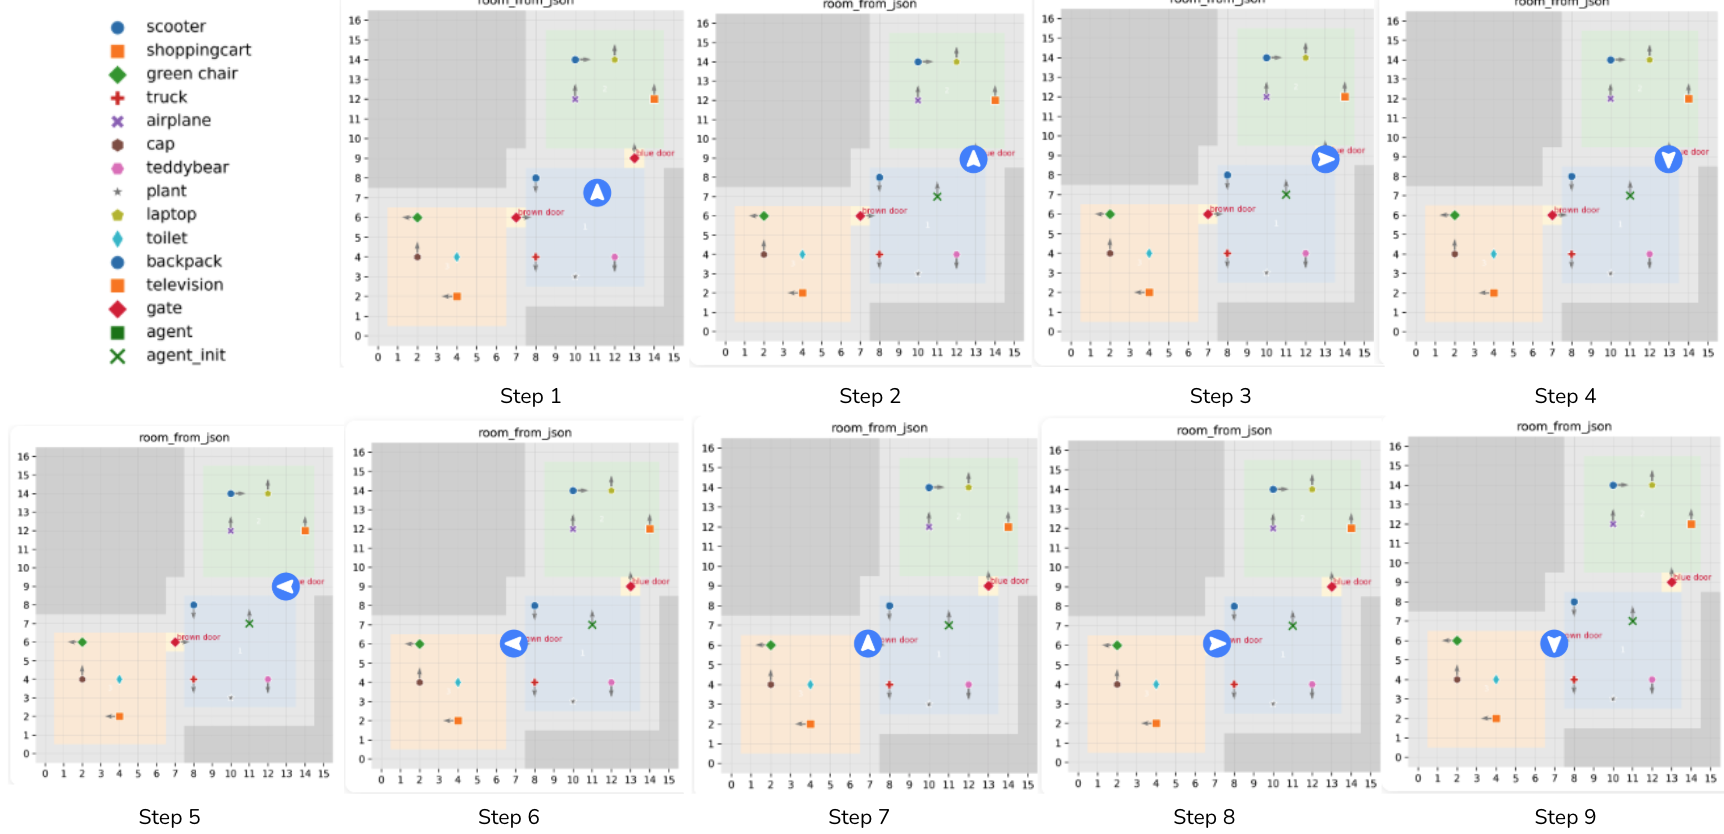
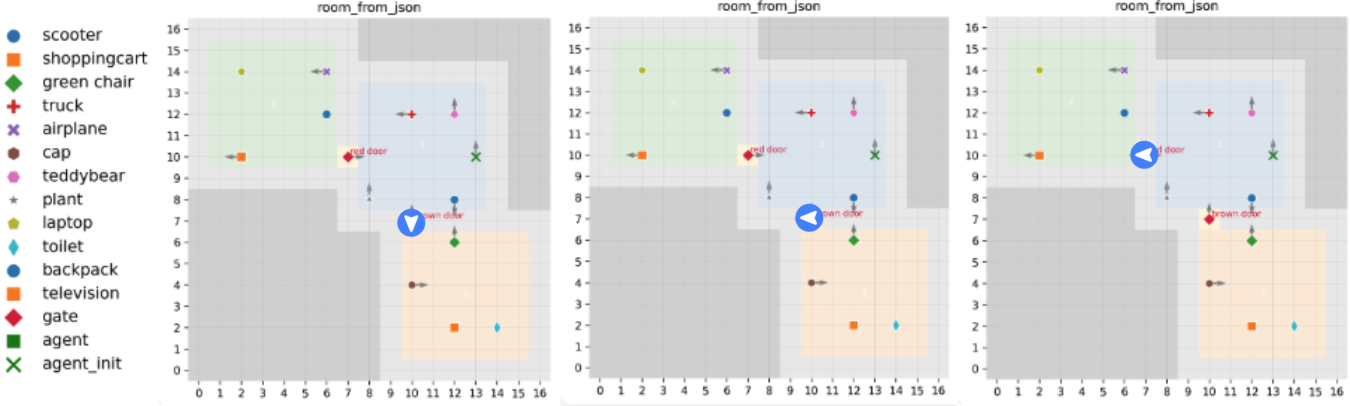
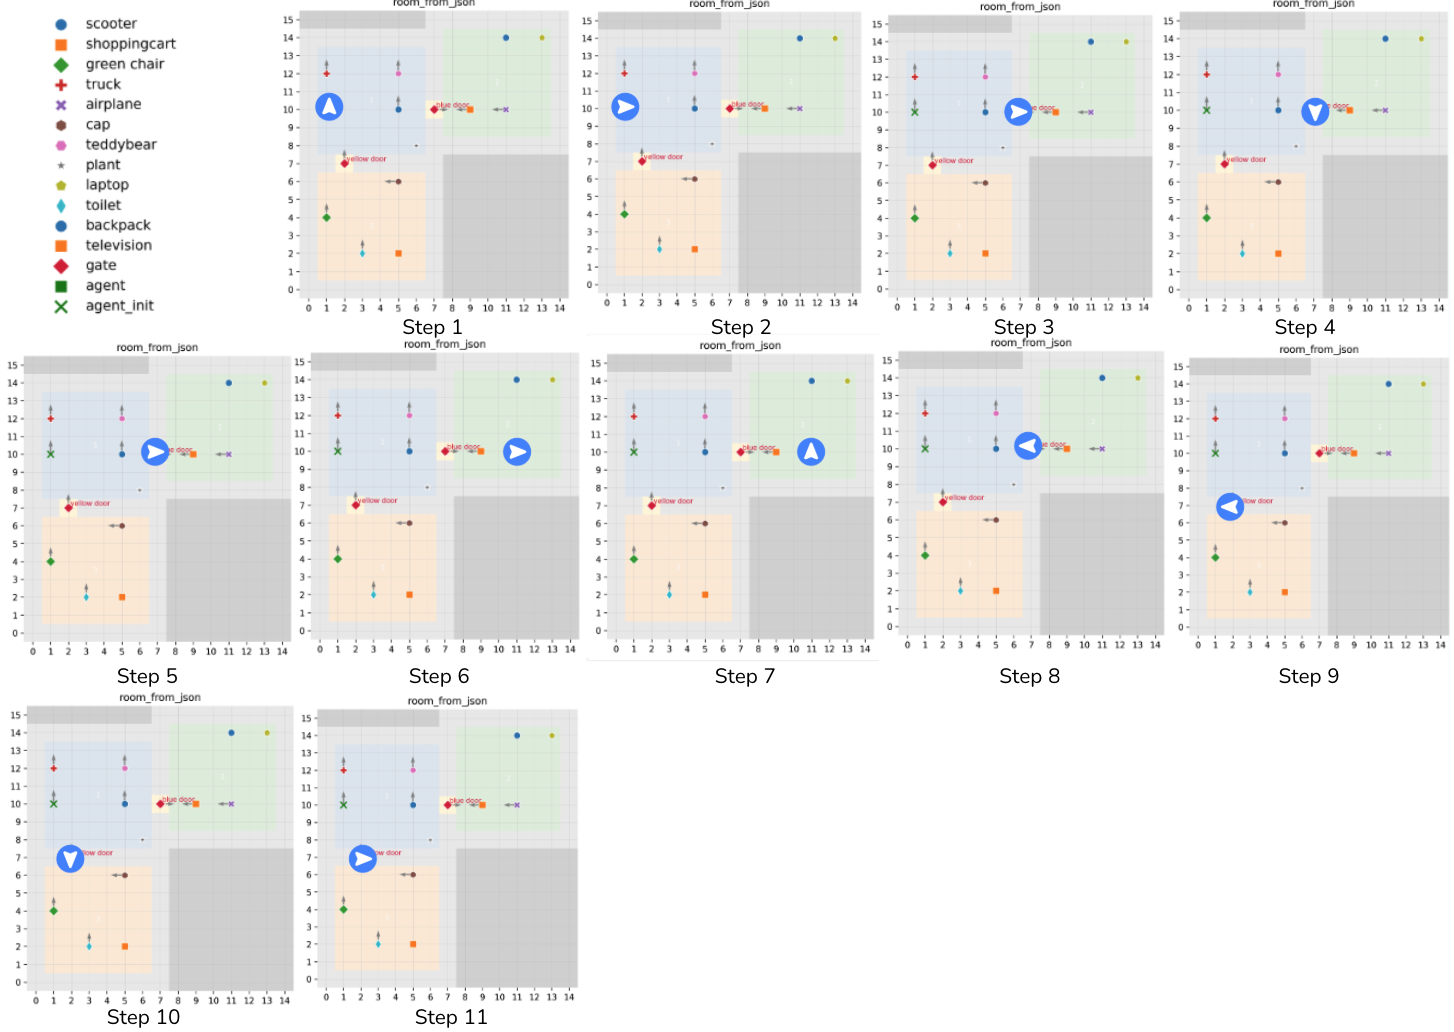
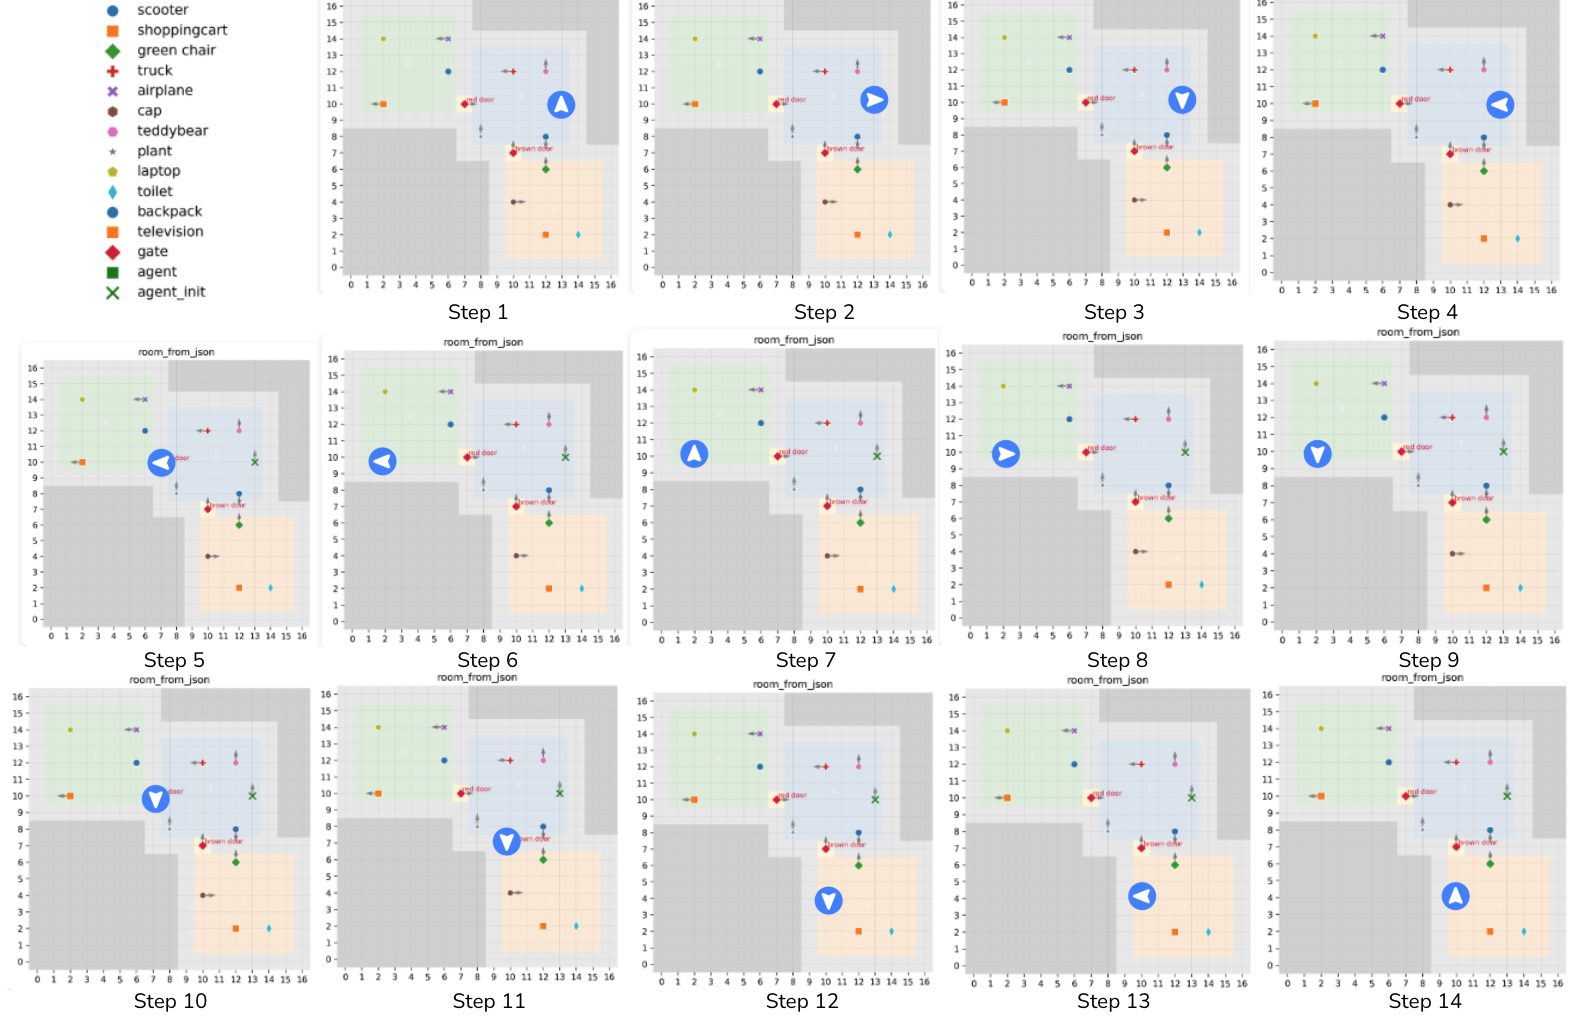
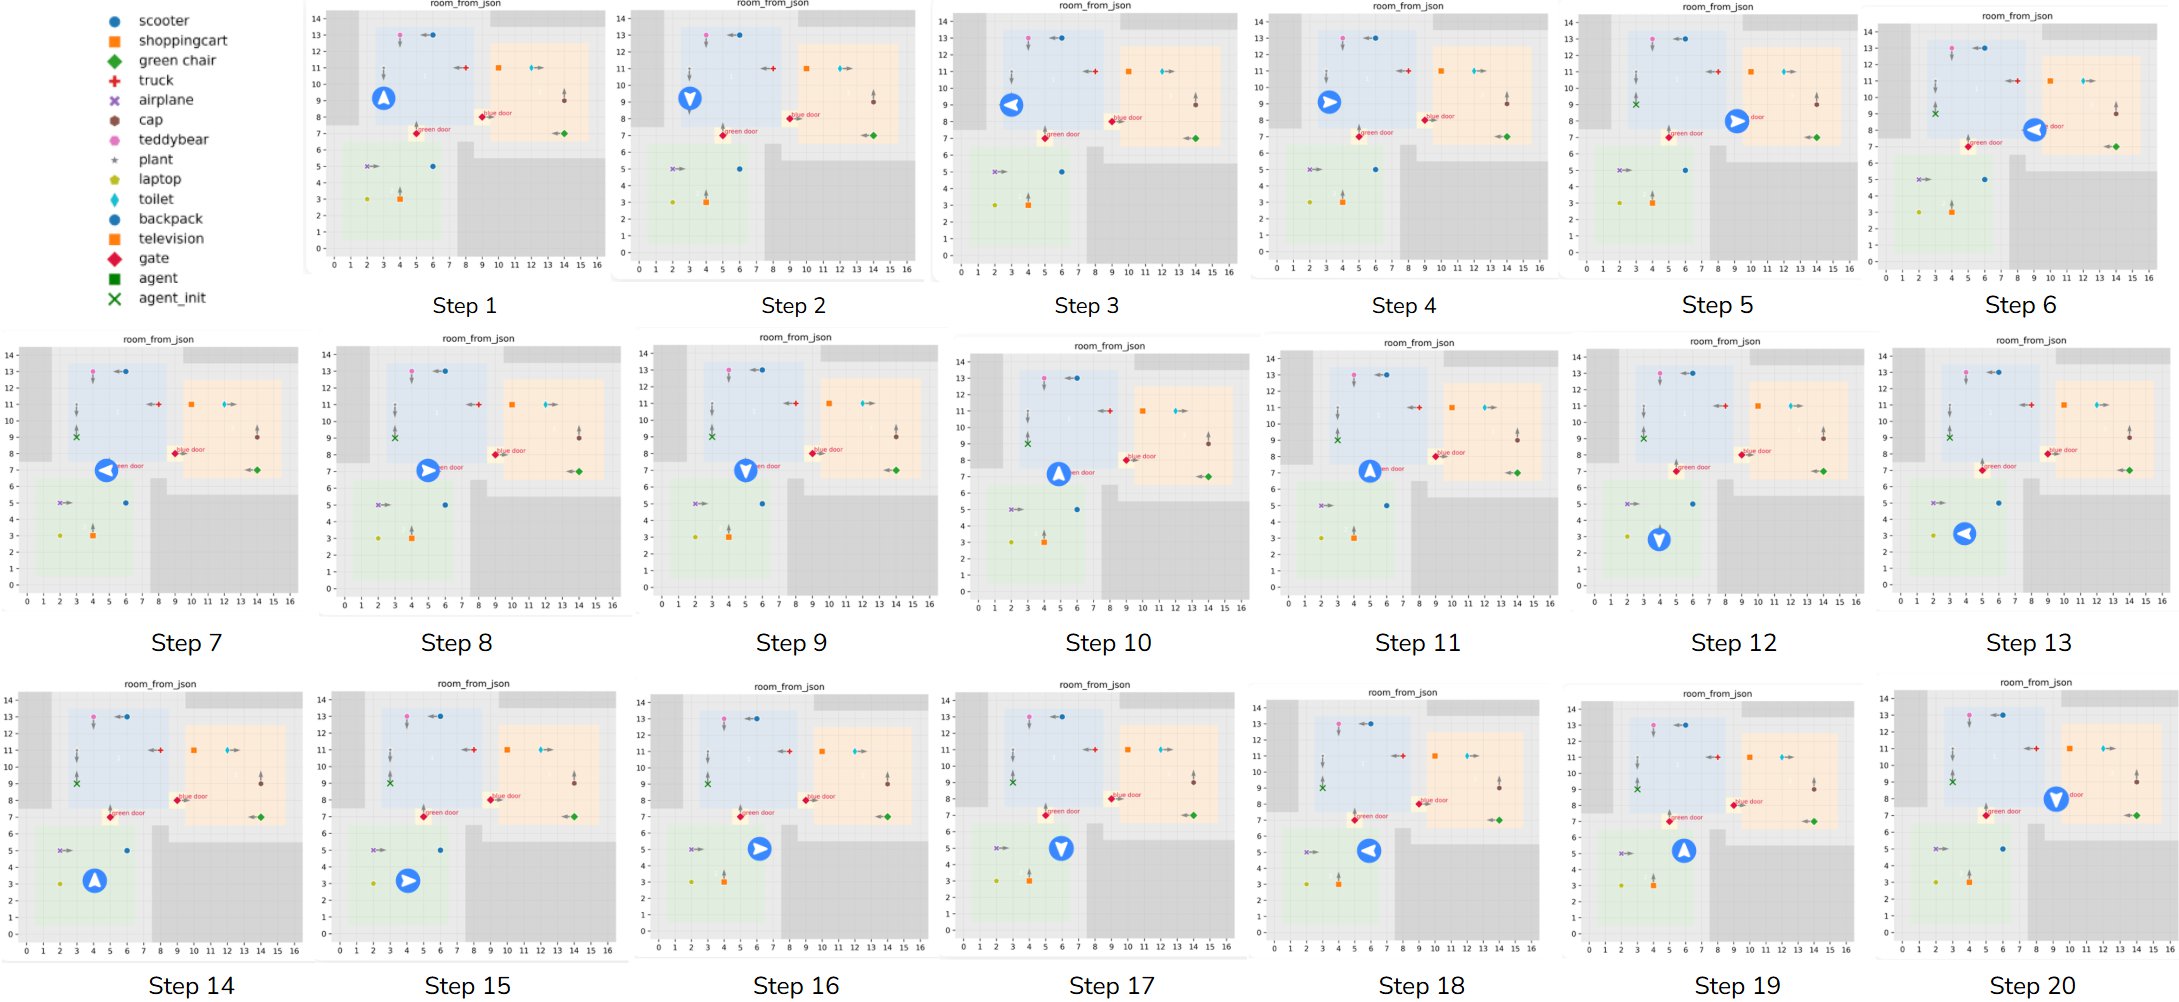
Figures 17–21 show successful room sweeping, premature door-driven omissions, and less organized exploration. Both GPT and Gemini have examples of door finding and systematic sweeping, while another Gemini trace pivots around objects. These are selected trajectory patterns, so the labels should not be interpreted as fixed model-wide policies.
Analysis Platform
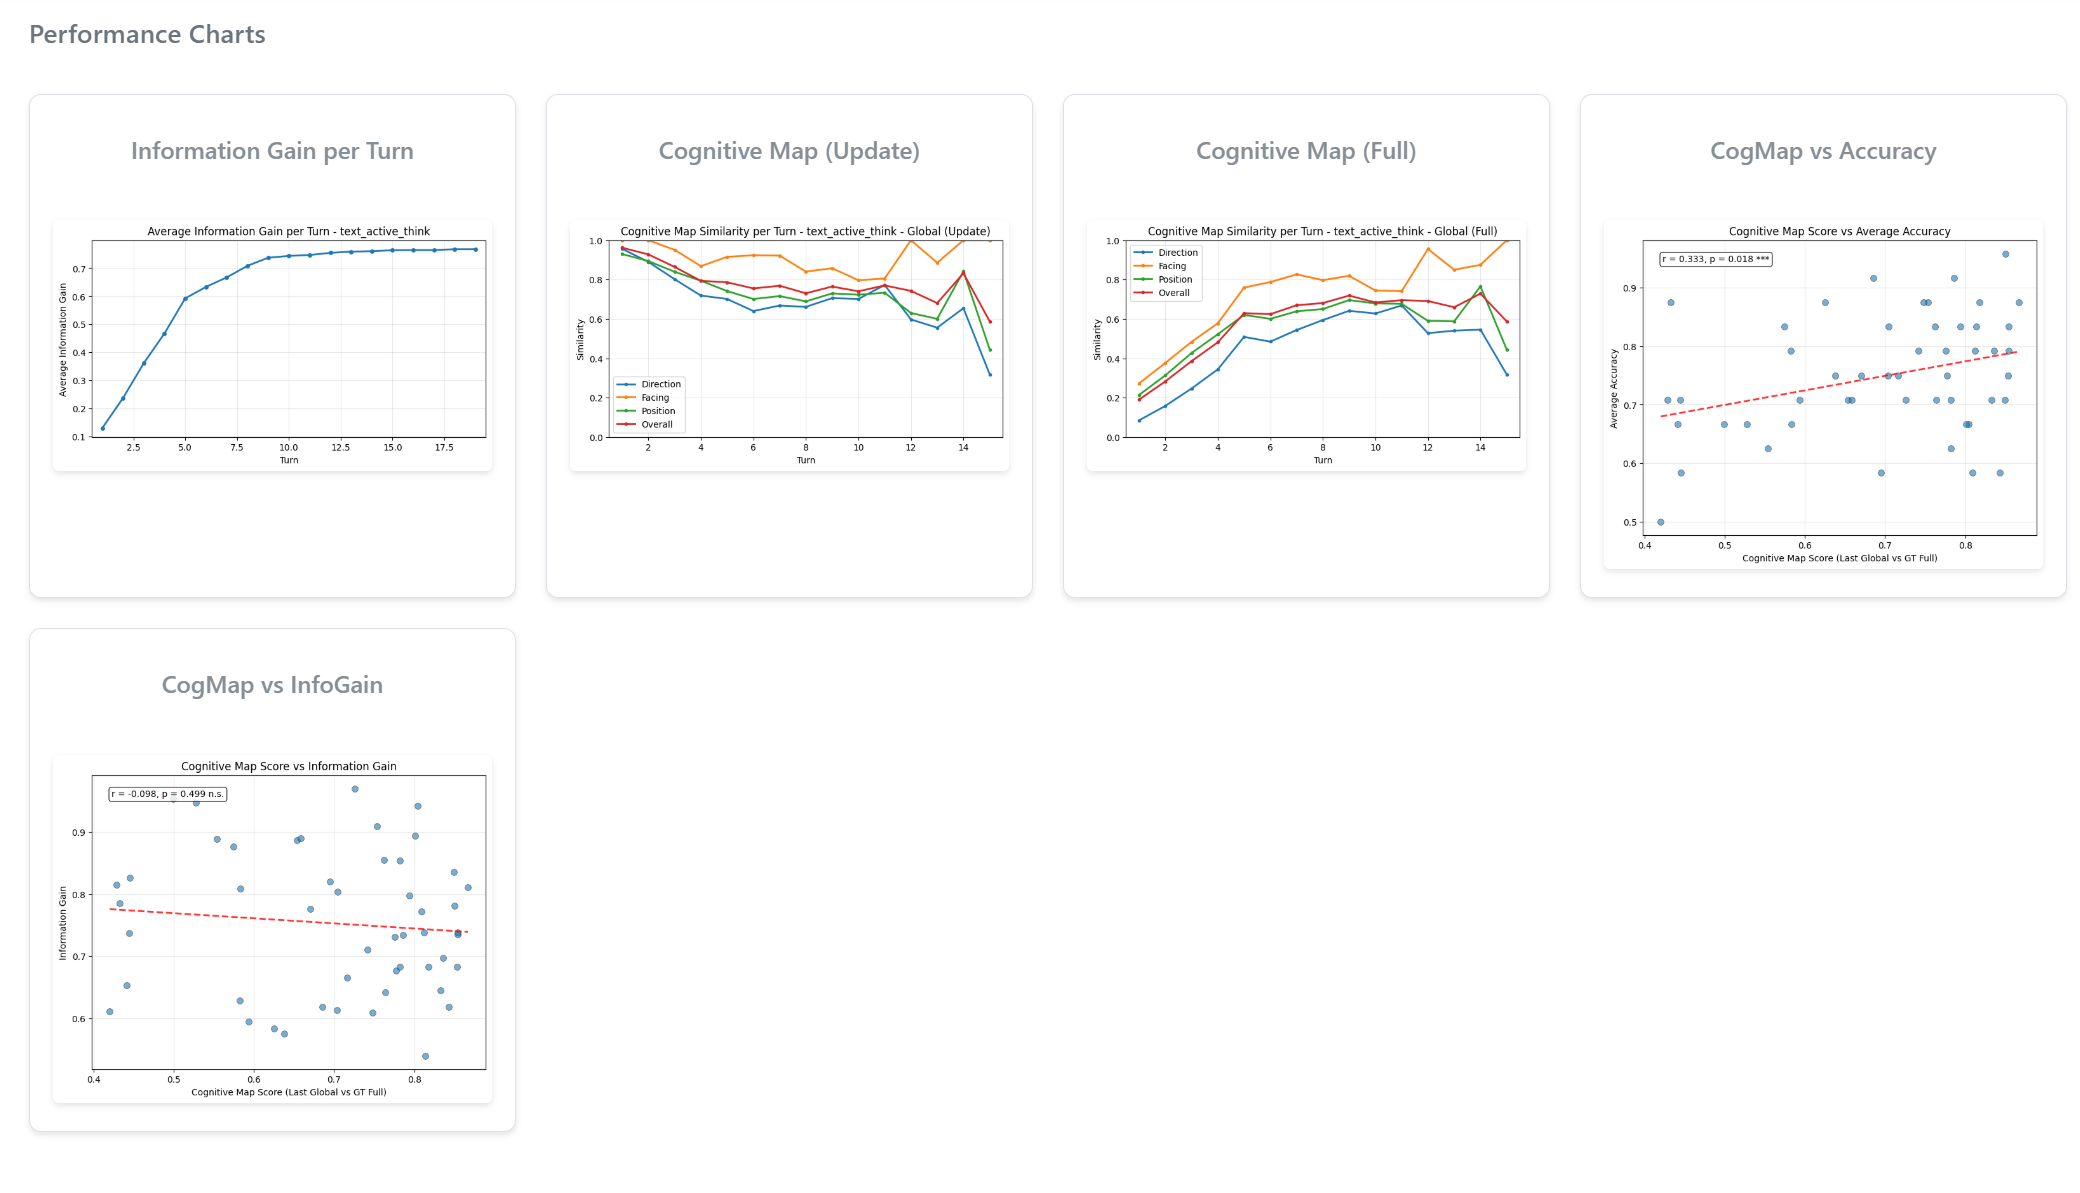
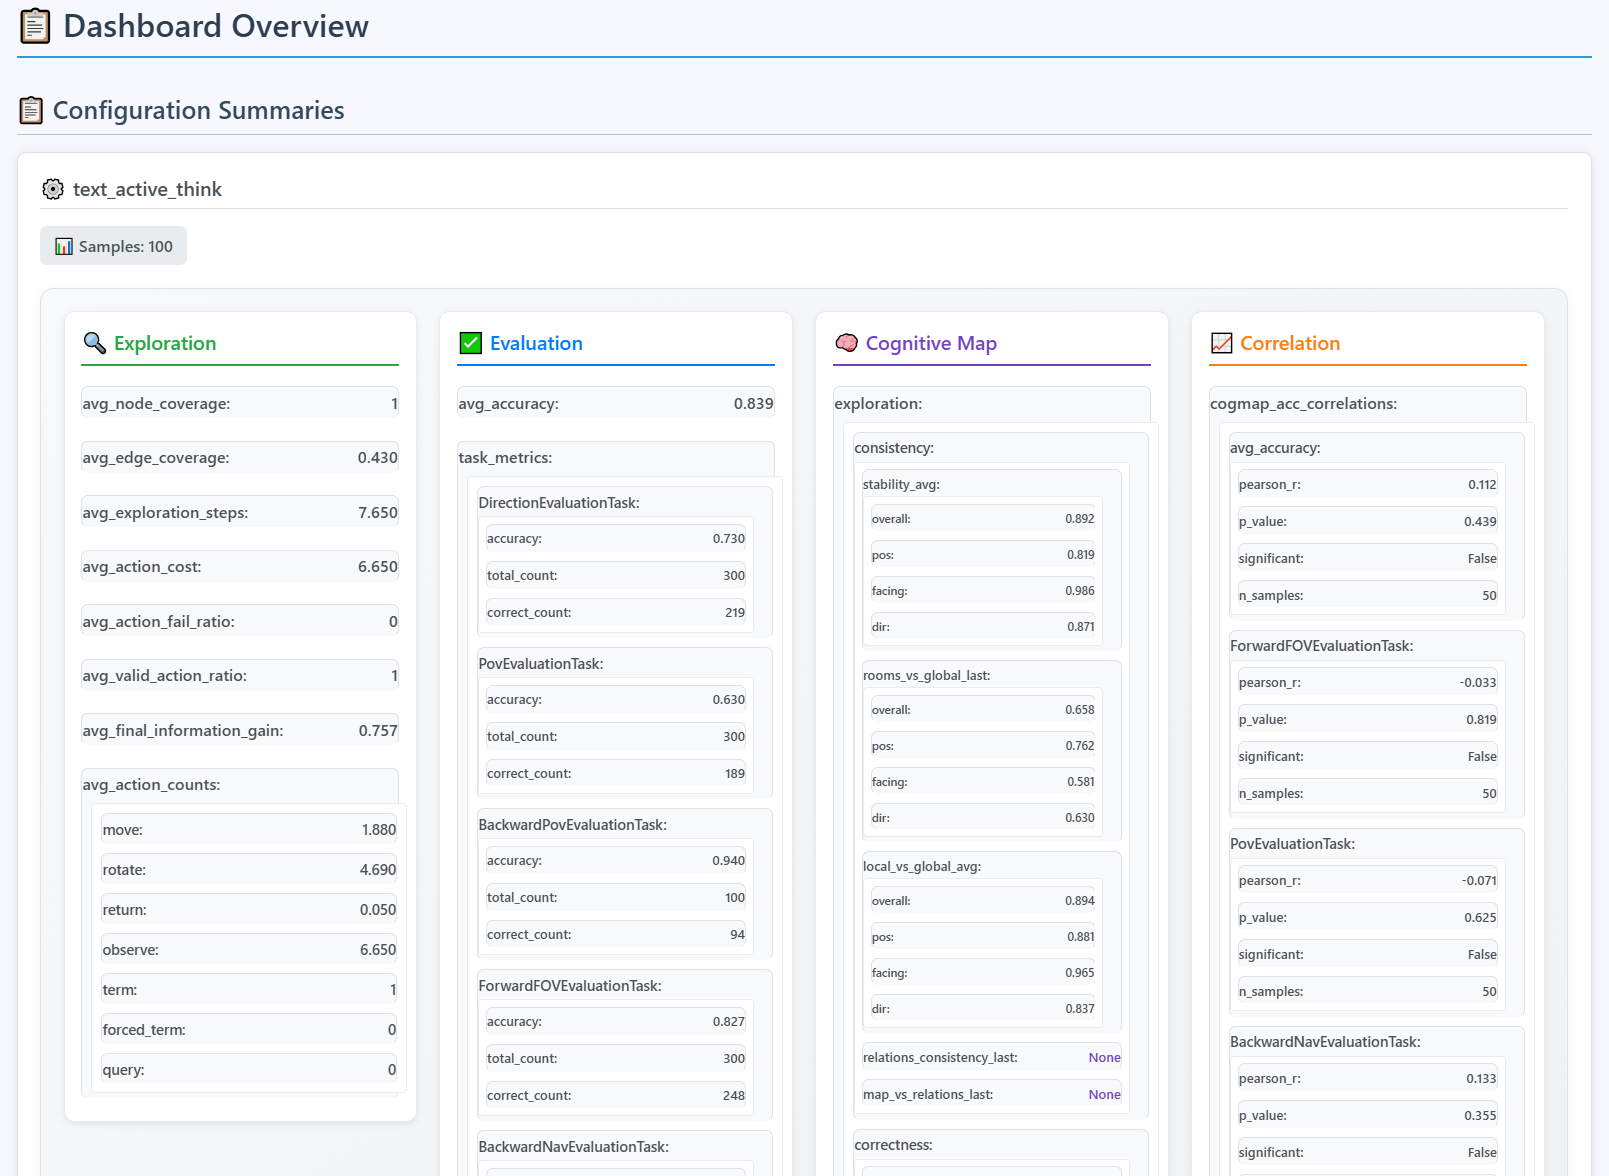
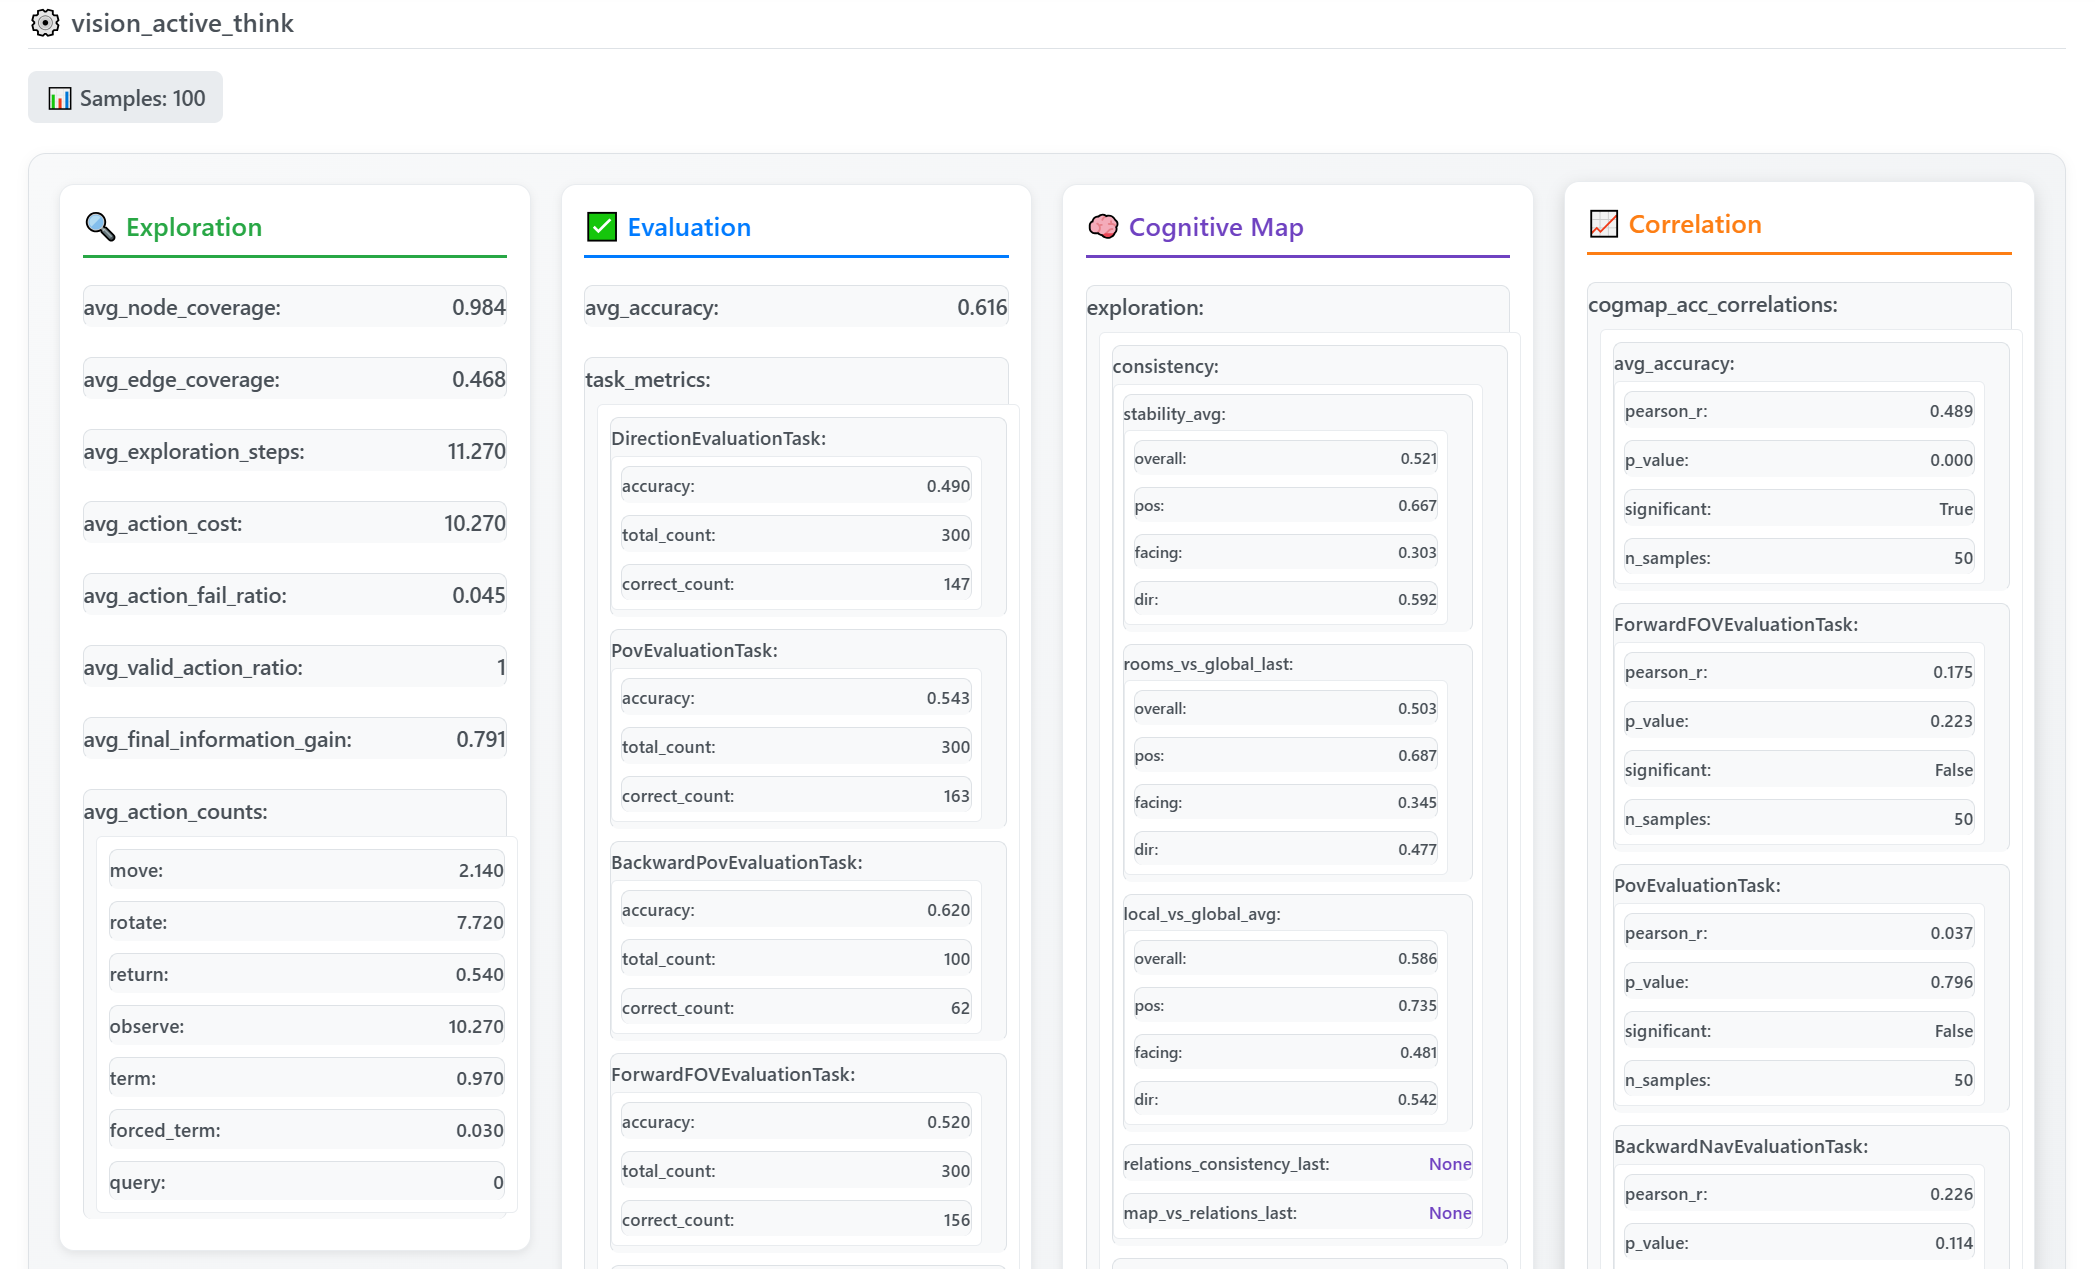
Figures 22–26 preserve the authors’ analysis interface: aggregate charts, text and vision exploration metrics, and individual turns with actions and cognitive maps. The screenshots illustrate how trajectories and reported state were inspected; they introduce no separate benchmark results.