Overview
At a glance
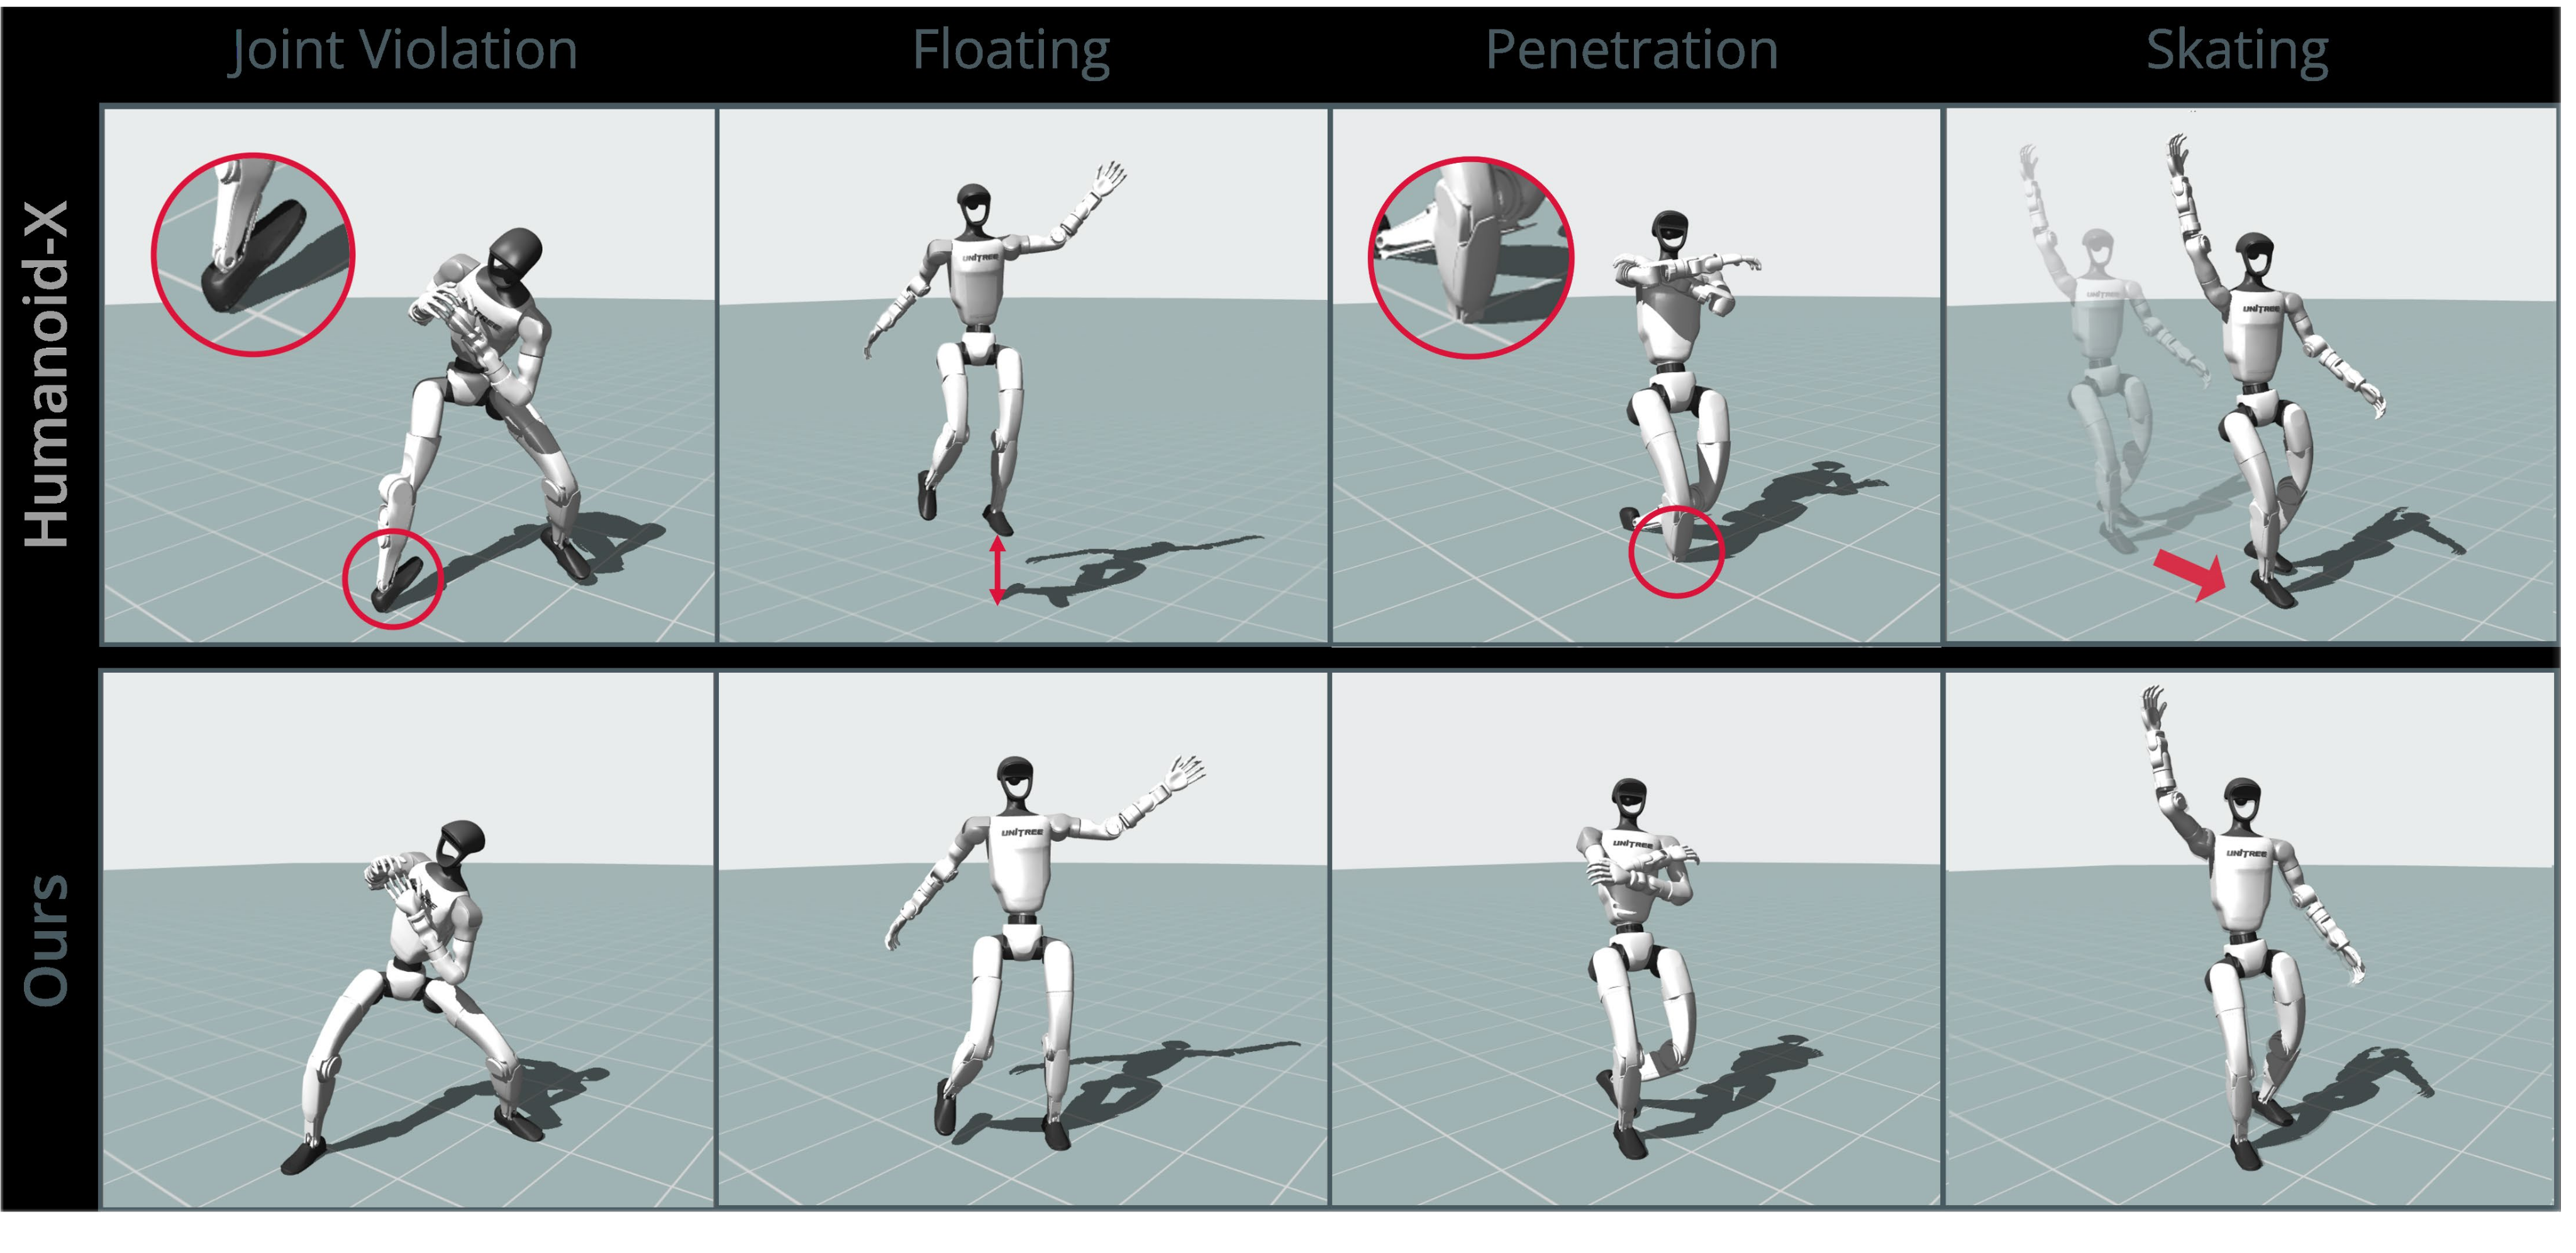
PHUMA combines physics-aware filtering of human motion with PhySINK, a shape-adaptive retargeting optimizer that penalizes joint-limit violations, poor foot grounding and skating. The resulting dataset contains about 76,000 clips and 73 hours. Policies trained on it improve aggregate tracking results on G1 and H1-2 in simulation, with a smaller hardware study on G1. These are kinematic quality checks and empirical tracking results, rather than a guarantee that every motion satisfies full robot dynamics.
1 Introduction
Motion imitation depends on both the coverage of the human demonstrations and their suitability for a different body. Motion capture is relatively clean but limited; internet-video reconstruction scales collection while introducing jitter, floating and penetration. PHUMA addresses both stages: reject unsuitable human trajectories, then optimize their transfer to the robot.
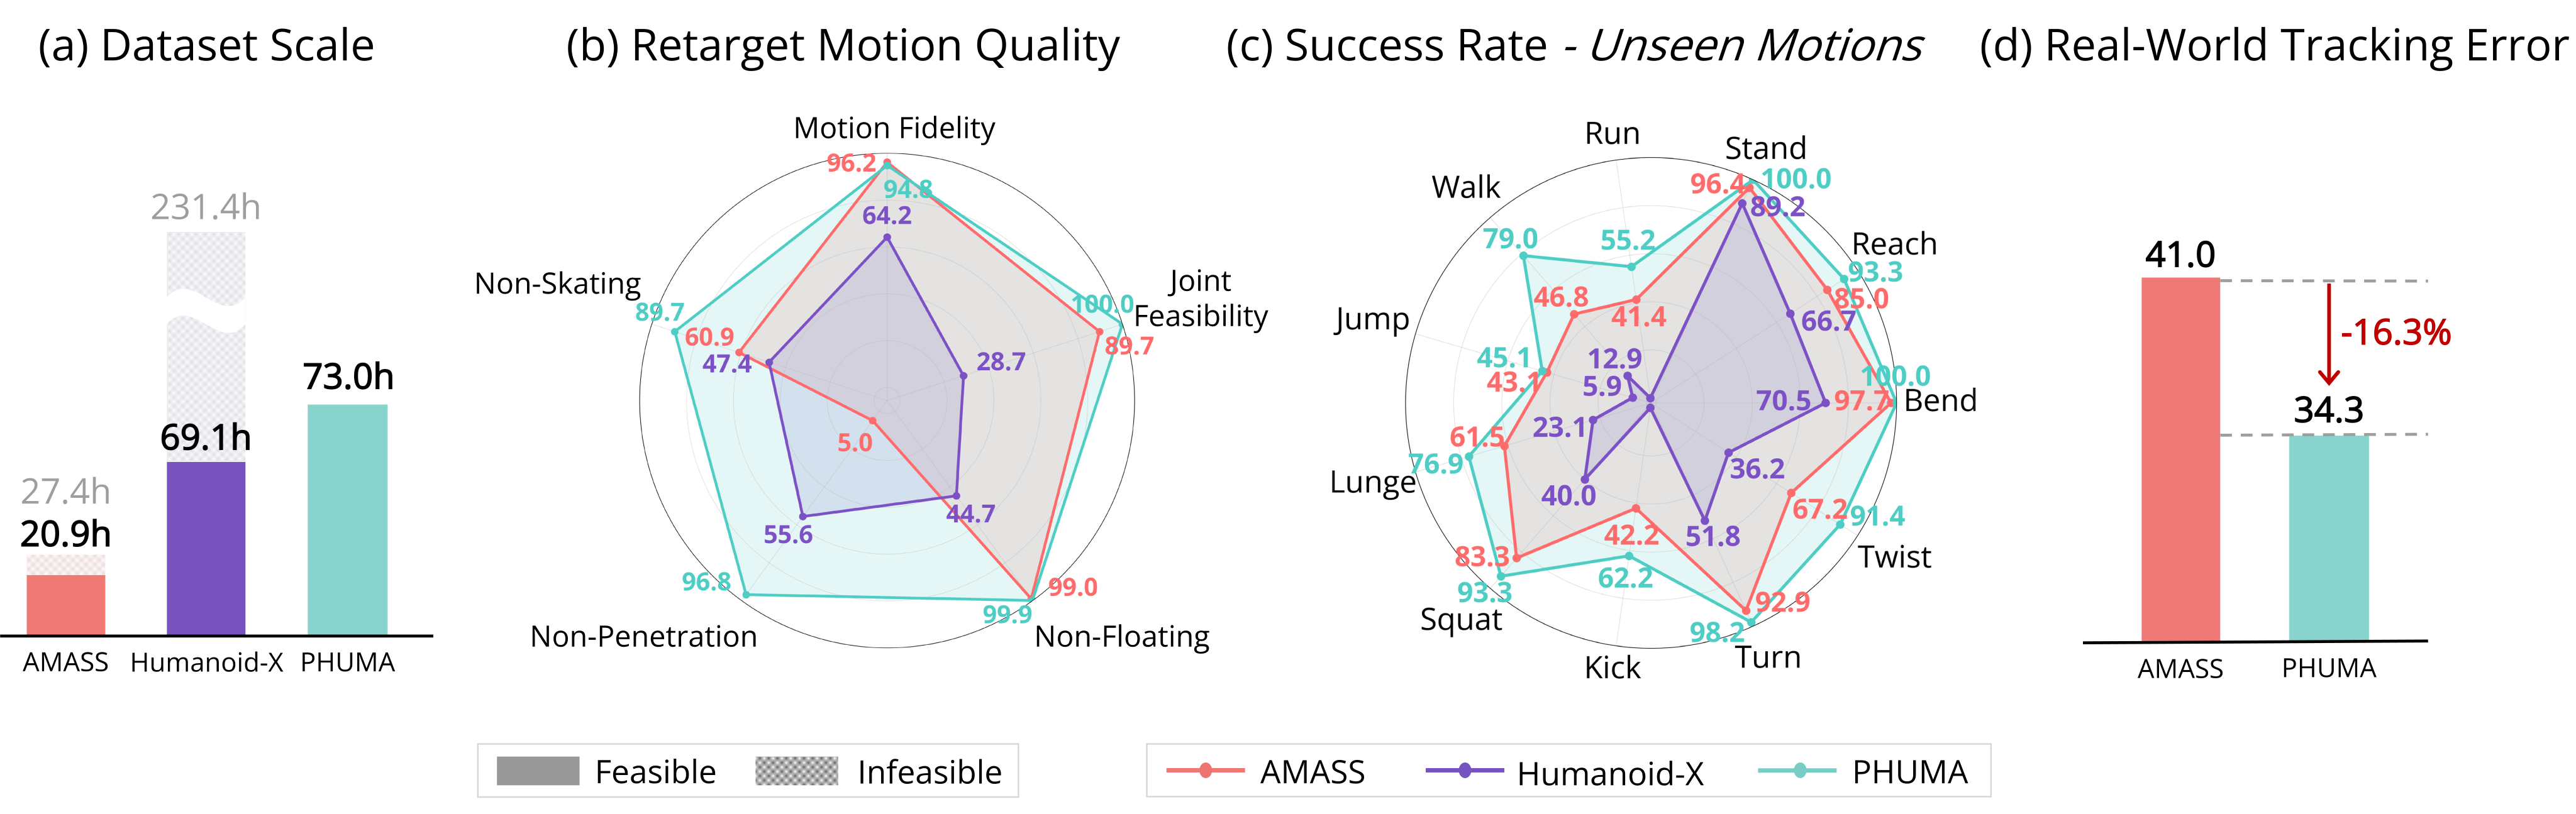
This edition follows the 35-page arXiv v3 dated 12 October 2026, including its expanded ablations. The catalog retains the original 2025 posting date. The reported 73 hours are roughly 3.5 times the 20.9 hours deemed feasible in AMASS; this comparison concerns the paper’s selected feasible portions, not the entirety of every original dataset.
2 Related Work
The work links human-motion datasets and robot retargeting. Its claim is that improving both the source trajectories and their morphology-dependent mapping gives more useful imitation targets.
2.1 Human Motion Data
AMASS and LaFAN1 supply motion-capture data; Humanoid-X illustrates video-driven scale. PHUMA filters motion directly using contact and balance-related heuristics, without requiring a pretrained tracking policy to decide which clips survive. This avoids one source of policy-dependent selection, but its hand-set flat-ground criteria can still exclude feasible behaviors outside the intended scope.
2.2 Humanoid Motion Retargeting
Rigid scaling and standard inverse kinematics can distort human-to-robot proportions. Shape adaptation improves matching but does not itself impose contact or joint constraints. GMR uses heuristic scaling and IK, while dynamics-aware approaches such as SPIDER add optimization beyond kinematic retargeting. PhySINK supplies a contact-aware kinematic initialization; it does not replace the latter dynamics optimization.
3 Method
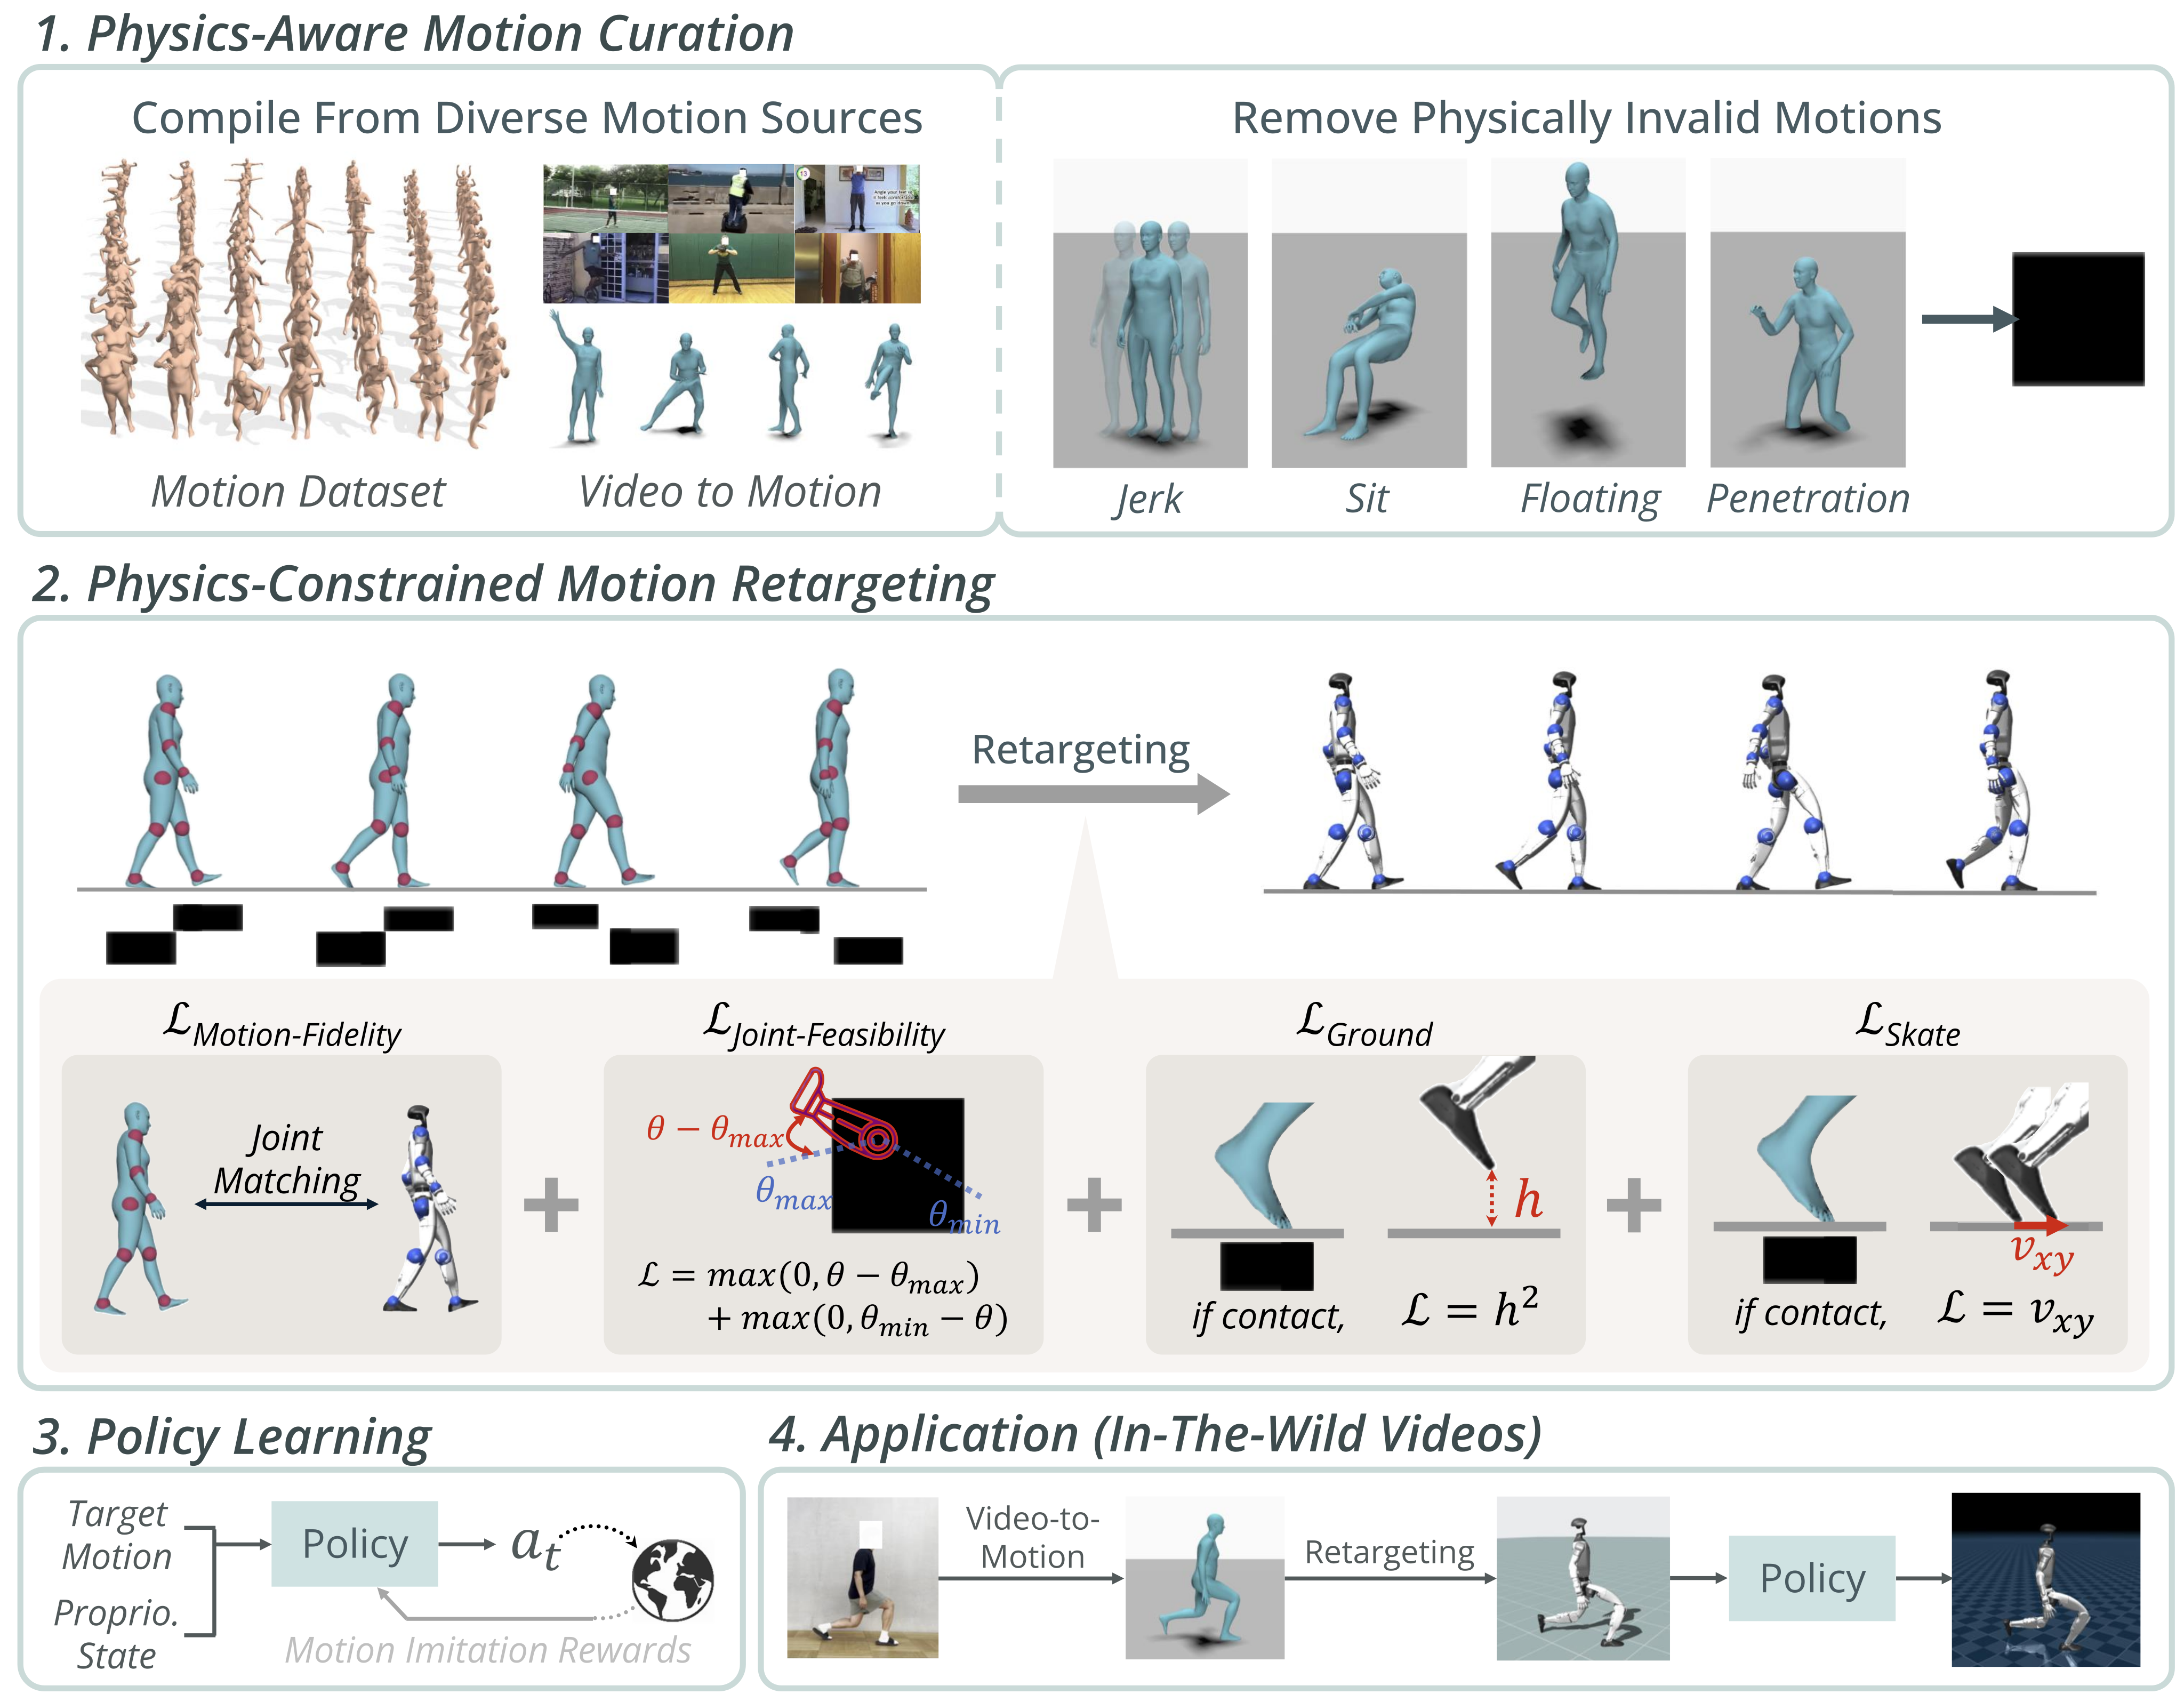
The pipeline collects human motion, smooths and filters it, retargets it with physical penalties, and trains tracking policies. LaFAN1, LocoMuJoCo and collected video supplement the Humanoid-X sources. Figure 3 preserves the complete four-stage diagram and loss illustrations.
3.1 Physics-Aware Motion Curation
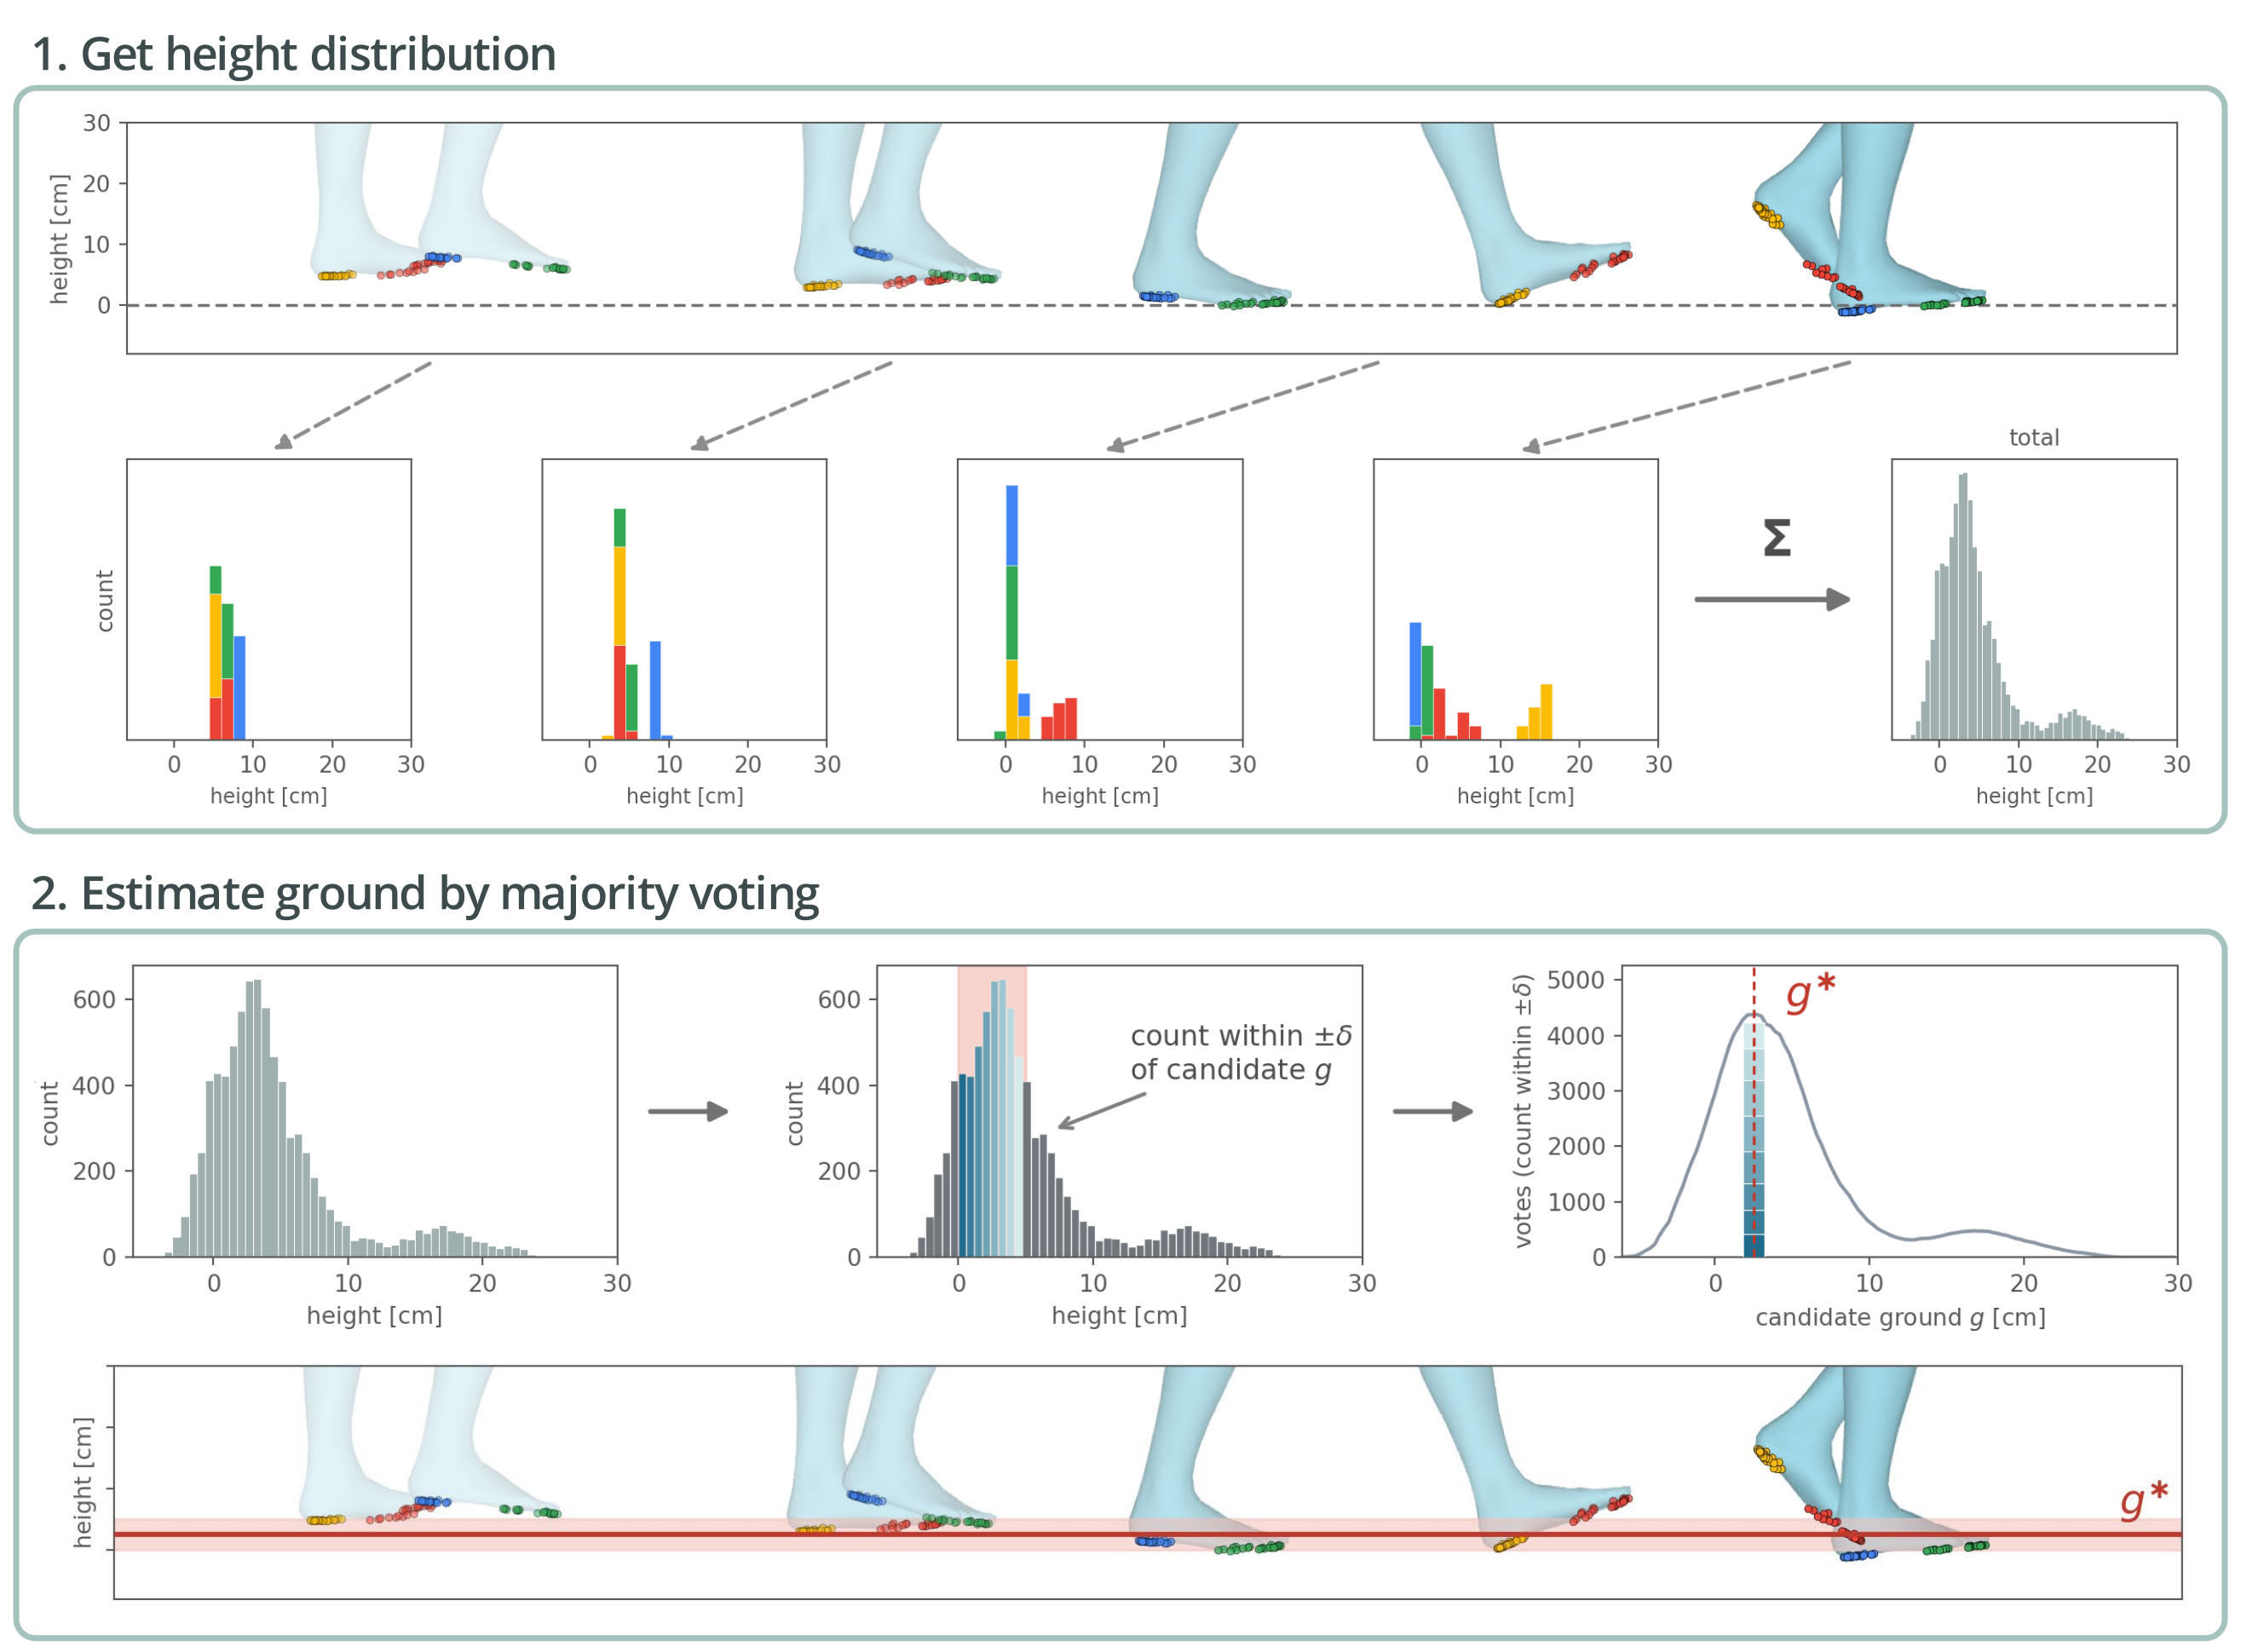
Curation. Smooth high-frequency noise, estimate one ground plane by majority voting over foot-vertex heights, and shift the whole trajectory to that plane. Four-second clips are checked for excessive root jerk, inadequate foot contact, implausible pelvis height and pelvis/spine displacement from the base of support; failing sub-clips are discarded.
These criteria target flat-ground locomotion. Pelvis and spine joints approximate the center of mass, and a horizontal foot/ankle hull approximates support. Such proxies do not constitute a dynamic balance test. Their exclusions deliberately include sitting and other scene-dependent motions as well as reconstruction errors.
3.2 Physics-Aware Motion Retargeting
Fidelity. Optimize robot joint positions and root translation against a robot-shaped SMPL-X target. The objective combines global position matching, local adjacent-joint relationships and temporal smoothness. The printed local “orientation” term uses displacement-vector inner products without an explicit normalization, so it should not be silently reinterpreted as a normalized angular error.
Physical penalties. Penalize joint positions and velocities beyond 98% of mechanical limits. Contact ratios weight squared foot-height error and horizontal foot speed. These soft losses reduce artifacts without guaranteeing exact contact or dynamic feasibility.
Evaluation. Report the fraction of frames satisfying fidelity (position under 10 cm and link orientation under 10°), joint limits, contact height within 1 cm above/below ground, or contact speed under 10 cm/s. On G1, PhySINK reaches 94.8% fidelity, 100% joint feasibility, 99.9% non-floating, 96.8% non-penetration and 89.7% non-skating. Thus residual penetration/skating remain. GMR’s 100% non-penetration accompanies only 14.7% non-floating.
Equations 1–8
| (1) |
| (2) | ||||
| (3) |
| (4) |
| (5) | ||||
| (6) | ||||
| (7) |
| (8) |
| Motion Fidelity (%) | Joint Feasibility (%) | Non-Floating (%) | Non-Penetration (%) | Non-Skating (%) | |
|---|---|---|---|---|---|
| IK | 27.6 | 91.7 | 55.6 | 47.8 | 59.7 |
| GMR | 56.3 | 81.8 | 14.7 | 100.0 | 67.7 |
| SINK | 94.8 | 95.9 | 96.4 | 14.9 | 55.4 |
| + Joint Feasibility Loss | 94.9 | 100.0 | 96.4 | 14.8 | 55.6 |
| + Grounding Loss | 94.9 | 100.0 | 99.9 | 97.2 | 53.6 |
| + Skating Loss = PhySINK | 94.8 | 100.0 | 99.9 | 96.8 | 89.7 |
Equations 9–10
| (9) |
| (10) |
4 Experiments
Experiments separately examine filtering, retargeting, complete datasets and hardware transfer. Their controls and evaluation thresholds differ, so each comparison answers a narrower question than a single universal benchmark ranking.
4.1 Experiment Setup
Train MaskedMimic tracking policies with PPO for simulation, and a modified BeyondMimic policy for hardware. G1 has 29 DoF; H1-2 uses 21, excluding wrists. Hold out about 7,500 PHUMA clips and evaluate another 504 collected videos reconstructed and retargeted into references.
Main simulation comparisons use a strict 0.15 m whole-body success threshold. Several later appendices use the conventional 0.5 m threshold and GMR references instead. Hardware lacks global-translation motion capture and therefore measures local MPJPE and joint velocity/acceleration errors; those results do not establish global path accuracy.
4.2 Effect of Physics-Aware Curation
To isolate curation, retarget every Humanoid-X variant with SINK and exclude pre-retargeted LaFAN1/LocoMuJoCo. Any individual filter improves tracking, while all filters reduce roughly 231 hours to 62 yet raise success from 50.6% to 87.0% on PHUMA Test and 39.1% to 79.6% on Unseen Video. This supports useful selection under the tested protocol, not an unconditional rule that less data is better.
| Curation Filter | PHUMA Test | Unseen Video | |||||||||||||
|---|---|---|---|---|---|---|---|---|---|---|---|---|---|---|---|
| Variant | Hours | Jerk | FC | Height | BoS | Total | Stat. | Ang. | Vert. | Horiz. | Total | Stat. | Ang. | Vert. | Horiz. |
| Humanoid-X | 231 | ✗ | ✗ | ✗ | ✗ | 50.6 | 78.4 | 43.0 | 26.0 | 31.8 | 39.1 | 78.0 | 39.6 | 23.0 | 6.5 |
| + Jerk only | 141 | ✓ | ✗ | ✗ | ✗ | 83.0 | 91.5 | 77.6 | 72.3 | 88.5 | 77.6 | 100.0 | 78.8 | 62.8 | 61.5 |
| + FC only | 123 | ✗ | ✓ | ✗ | ✗ | 82.9 | 91.3 | 77.8 | 70.4 | 89.1 | 78.2 | 99.1 | 79.3 | 61.7 | 65.9 |
| + Height only | 136 | ✗ | ✗ | ✓ | ✗ | 80.6 | 90.7 | 74.6 | 69.3 | 85.1 | 74.0 | 98.3 | 76.4 | 61.7 | 50.5 |
| + BoS only | 110 | ✗ | ✗ | ✗ | ✓ | 81.3 | 90.2 | 76.2 | 72.0 | 84.4 | 74.8 | 96.6 | 79.8 | 54.3 | 57.1 |
| All filters | 62 | ✓ | ✓ | ✓ | ✓ | 87.0 | 93.0 | 82.7 | 81.8 | 90.3 | 79.6 | 98.3 | 82.8 | 59.6 | 69.2 |
4.3 PhySINK Retargeting Method Effectiveness
Retarget identical AMASS motions using IK, GMR, SINK or PhySINK and train separate policies. PhySINK yields 79.5%/72.8% aggregate success on PHUMA Test/Unseen Video, versus SINK’s 76.2%/70.2%. The gains are strongest in some angular and vertical categories; the appendix checks that the advantage also appears with GMR-generated evaluation references.
| PHUMA Test | Unseen Video | |||||||||
|---|---|---|---|---|---|---|---|---|---|---|
| Retarget | Total | Stationary | Angular | Vertical | Horizontal | Total | Stationary | Angular | Vertical | Horizontal |
| IK | 52.8 | 75.3 | 43.9 | 24.3 | 44.2 | 54.6 | 89.3 | 54.6 | 32.7 | 43.3 |
| GMR | 61.7 | 80.2 | 51.7 | 32.5 | 74.0 | 59.3 | 87.1 | 64.5 | 31.9 | 40.7 |
| SINK | 76.2 | 88.5 | 72.1 | 56.8 | 66.8 | 70.2 | 90.7 | 75.0 | 62.7 | 44.1 |
| PhySINK | 79.5 | 89.9 | 76.1 | 61.1 | 69.5 | 72.8 | 93.3 | 78.2 | 65.6 | 47.3 |
4.4 PHUMA Dataset Effectiveness
PHUMA gives 92.7%/82.9% G1 success on the two test sets. This dataset comparison uses supplied LaFAN1/Humanoid-X targets and SINK-retargeted AMASS, so data volume, coverage and retargeting quality all differ. Appendix D.4 also compares AMASS retargeted with PhySINK, supporting an additional data benefit.
Table 4’s AMASS Unseen Video total is 78.2%, but Table 3 and Appendix Table 21 give 70.2% with the same category entries. The original values are preserved. PHUMA leads every G1 category in this table, but the broader claim of leading every category on both robots is contradicted by H1-2 horizontal results in Table 39.
| PHUMA Test | Unseen Video | ||||||||||
|---|---|---|---|---|---|---|---|---|---|---|---|
| Dataset | Hours | Total | Stationary | Angular | Vertical | Horizontal | Total | Stationary | Angular | Vertical | Horizontal |
| LaFAN1 | 2.4 | 46.1 | 66.1 | 36.2 | 24.0 | 42.5 | 28.4 | 46.9 | 28.4 | 19.6 | 10.5 |
| AMASS | 20.9 | 76.2 | 88.5 | 72.1 | 56.8 | 66.8 | 78.2 | 90.7 | 75.0 | 62.7 | 44.1 |
| Humanoid-X | 231.4 | 50.6 | 78.4 | 43.0 | 26.0 | 31.8 | 39.1 | 78.0 | 39.6 | 23.0 | 6.5 |
| PHUMA | 73.0 | 92.7 | 95.6 | 91.7 | 86.0 | 85.6 | 82.9 | 96.7 | 88.0 | 71.8 | 67.1 |
4.5 Real-World Experiment
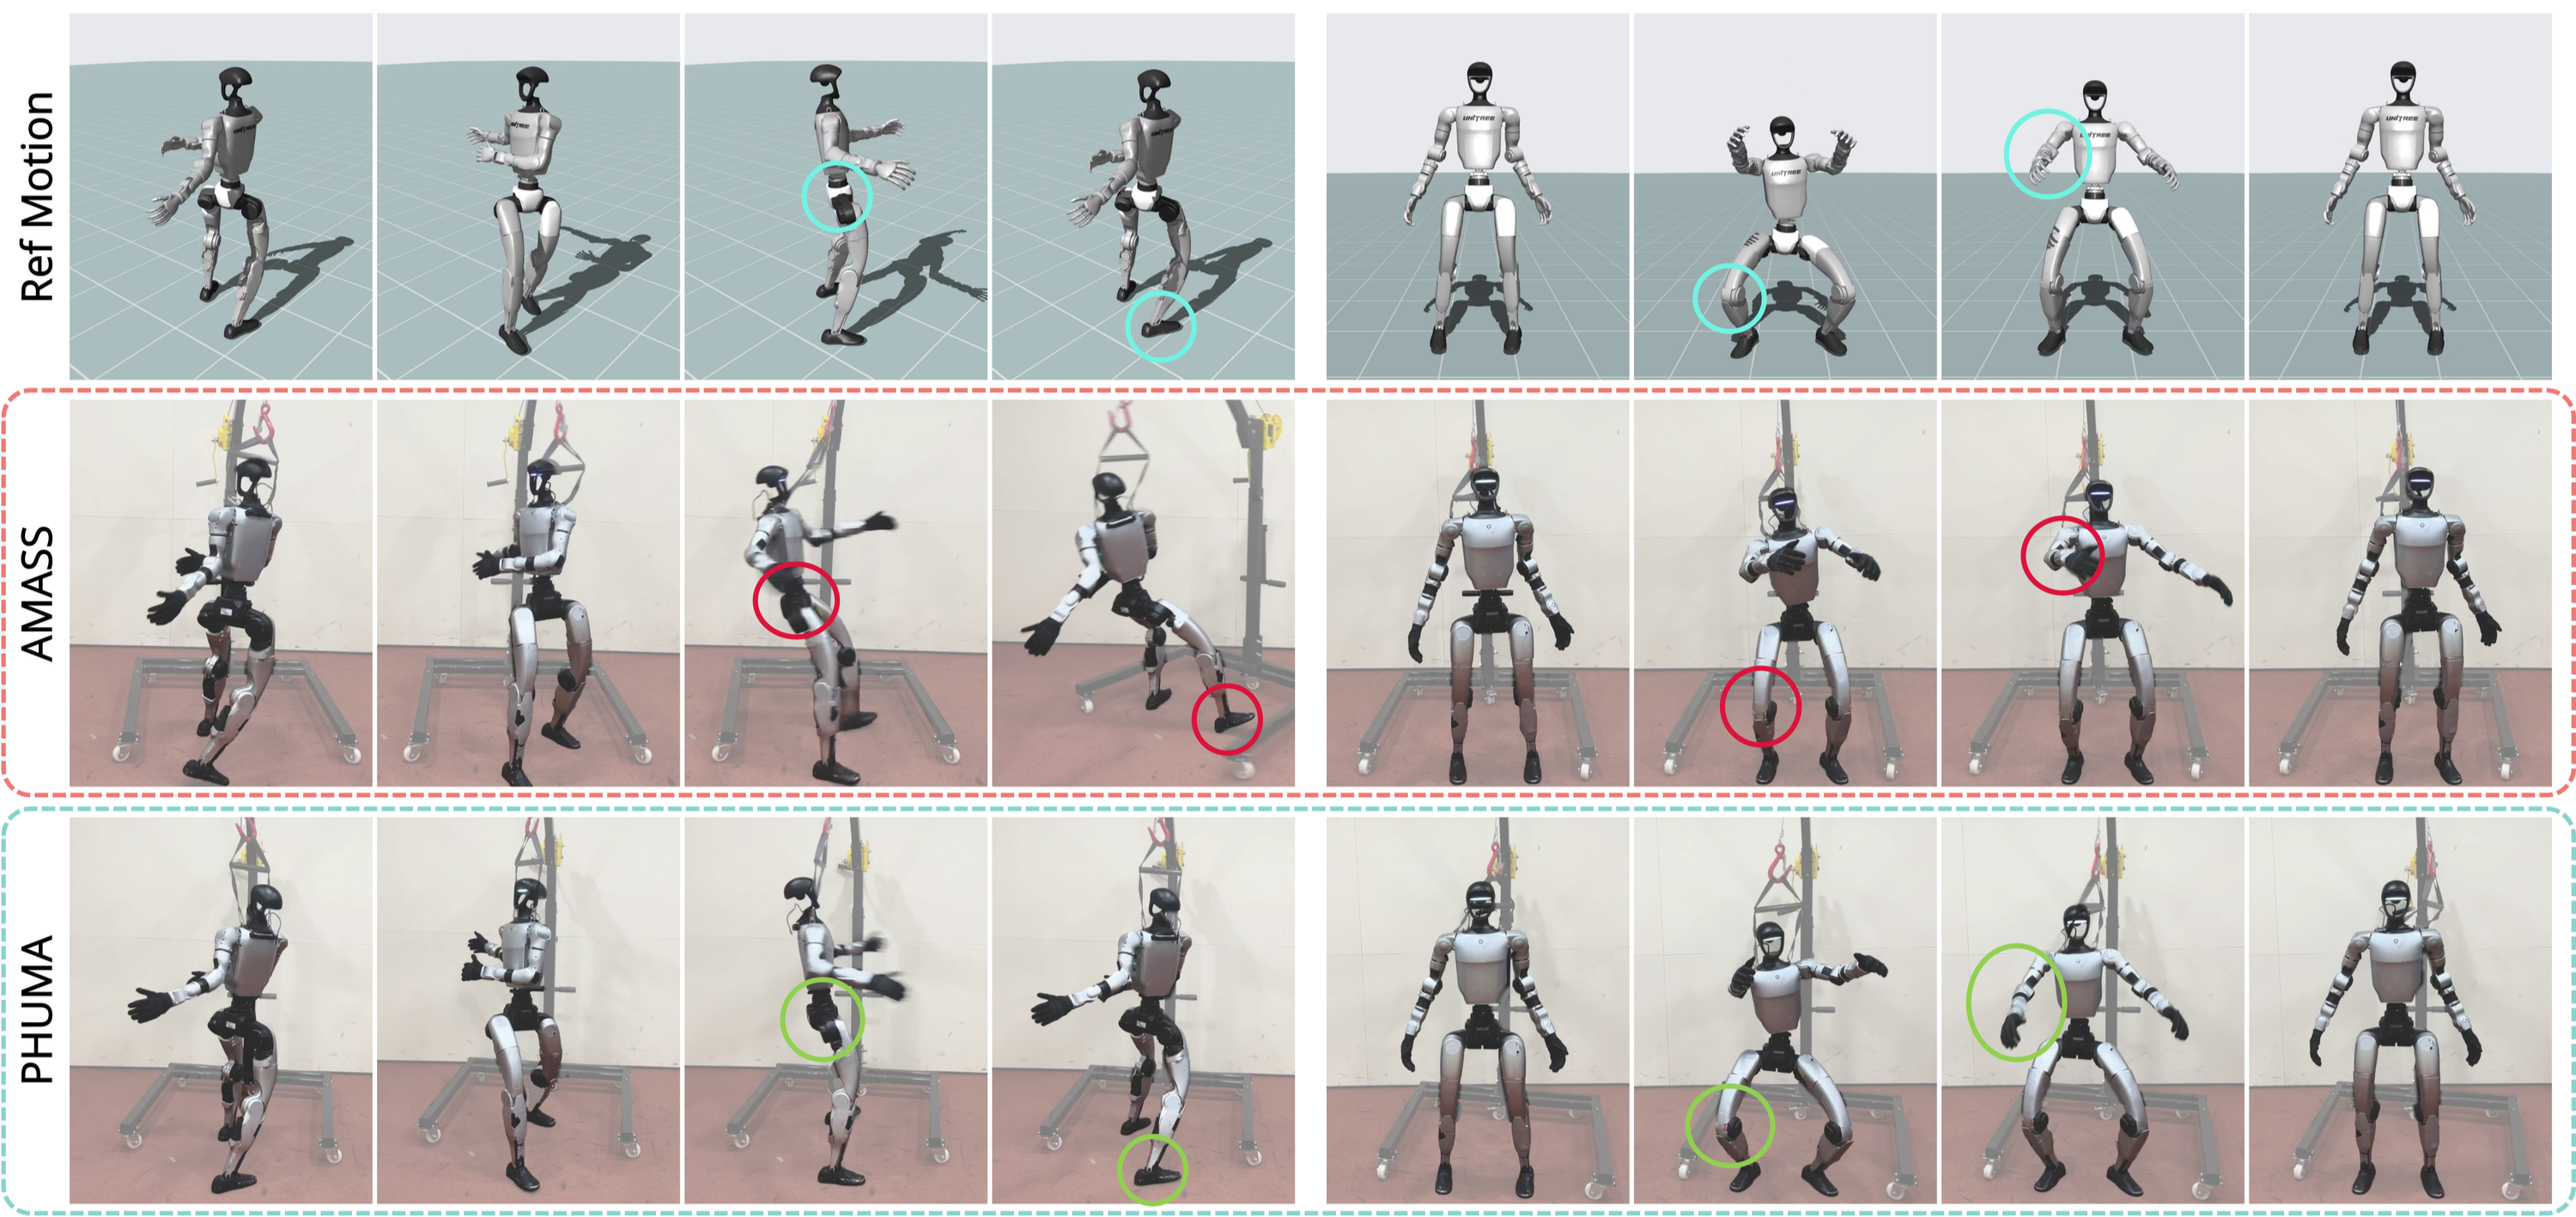
Extend BeyondMimic from single-motion tracking with an encoder of future reference frames. Train in IsaacSim and deploy zero-shot to G1 on six held-out motions from each of four categories. PHUMA reduces aggregate local MPJPE from 41.0 to 34.3 mm, a 16.3% relative reduction, and reduces aggregate velocity/acceleration errors from 3.20/1.50 to 2.69/1.29.
The units for the latter errors are degrees/frame and degrees/frame². Improvement is not universal: horizontal acceleration error increases from 1.80 to 1.96. Only AMASS is tested as a hardware baseline; this 24-motion comparison does not measure global translation or establish performance on scene interactions.
5 Limitations
The dataset focuses on flat terrain and excludes object interaction, sitting, climbing and uneven surfaces. Many video motions are discarded, constraining behavior coverage; the retained targets still contain artifacts. Hardware comparison is limited to AMASS because the Humanoid-X policy falls more often in simulation. Reliable kinematic references therefore remain one component of robust real-world control.
6 Conclusion
The evidence favors jointly curating source motion and improving retargeting for this locomotion setting. Simulation covers two humanoids and multiple policy/evaluation variants; hardware confirms aggregate local tracking gains on one robot and a small selected motion set. Extending the approach to environmental contacts and full dynamics remains open.
Acknowledgments
The authors acknowledge Korean government, research-institute and GPU-support funding. Bibliographic and attribution material is retained.
Appendix
The appendix supplies curation parameters, dataset composition, retargeting comparisons, policy configurations, evaluation variants, ablations and H1-2 results.
Appendix A PHUMA Dataset
Dataset construction depends on explicit filtering choices, rather than treating all reconstructed human motion as directly executable robot motion.
A.1 Data Preprocessing
Preprocessing smooths trajectories, derives contact signals from the human mesh, estimates a shared ground level and removes unsuitable sub-clips before retargeting.
A.1.1 Low-Pass Noise Filtering for Motion Data
Resample to 30 Hz and apply a zero-phase fourth-order Butterworth low-pass filter. Cutoffs are 3 Hz for root translation and 6 Hz for global orientation/body pose. This is offline trajectory preprocessing, not a causal real-time filter.
A.1.2 Extracting Ground Contact Information
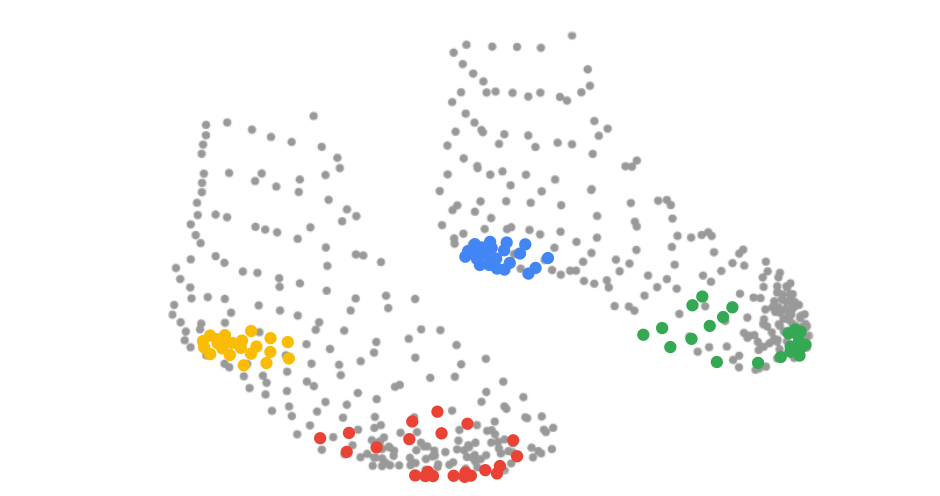
Select the 22 lowest SMPL-X vertices in each heel/toe region, 88 total; Table 6 retains every index. Choose the ground height maximizing vertex counts within ±2.5 cm across the sequence, then shift the whole motion to zero ground. This prevents frame-wise shifts from introducing jitter and avoids defining the plane solely by one extreme low point.
| Region | Vertex indices |
|---|---|
| Left heel | 8888, 8889, 8891, 8909, 8910, 8911, 8913, 8914, 8915, 8916, 8917, |
| 8918, 8919, 8920, 8921, 8922, 8923, 8924, 8925, 8929, 8930, 8934 | |
| Left toe | 5773, 5781, 5782, 5791, 5793, 5805, 5808, 5816, 5817, 5830, 5831, |
| 5859, 5860, 5906, 5907, 5908, 5909, 5912, 5914, 5915, 5916, 5917 | |
| Right heel | 8676, 8677, 8679, 8697, 8698, 8699, 8701, 8702, 8703, 8704, 8705, |
| 8706, 8707, 8708, 8709, 8710, 8711, 8712, 8713, 8714, 8715, 8716 | |
| Right toe | 8467, 8475, 8476, 8485, 8487, 8499, 8502, 8510, 8511, 8524, 8525, |
| 8553, 8554, 8600, 8601, 8602, 8603, 8606, 8608, 8609, 8610, 8611 |
Equation 11
| (11) |
A.1.3 Filtering Motion Data by Physical Information
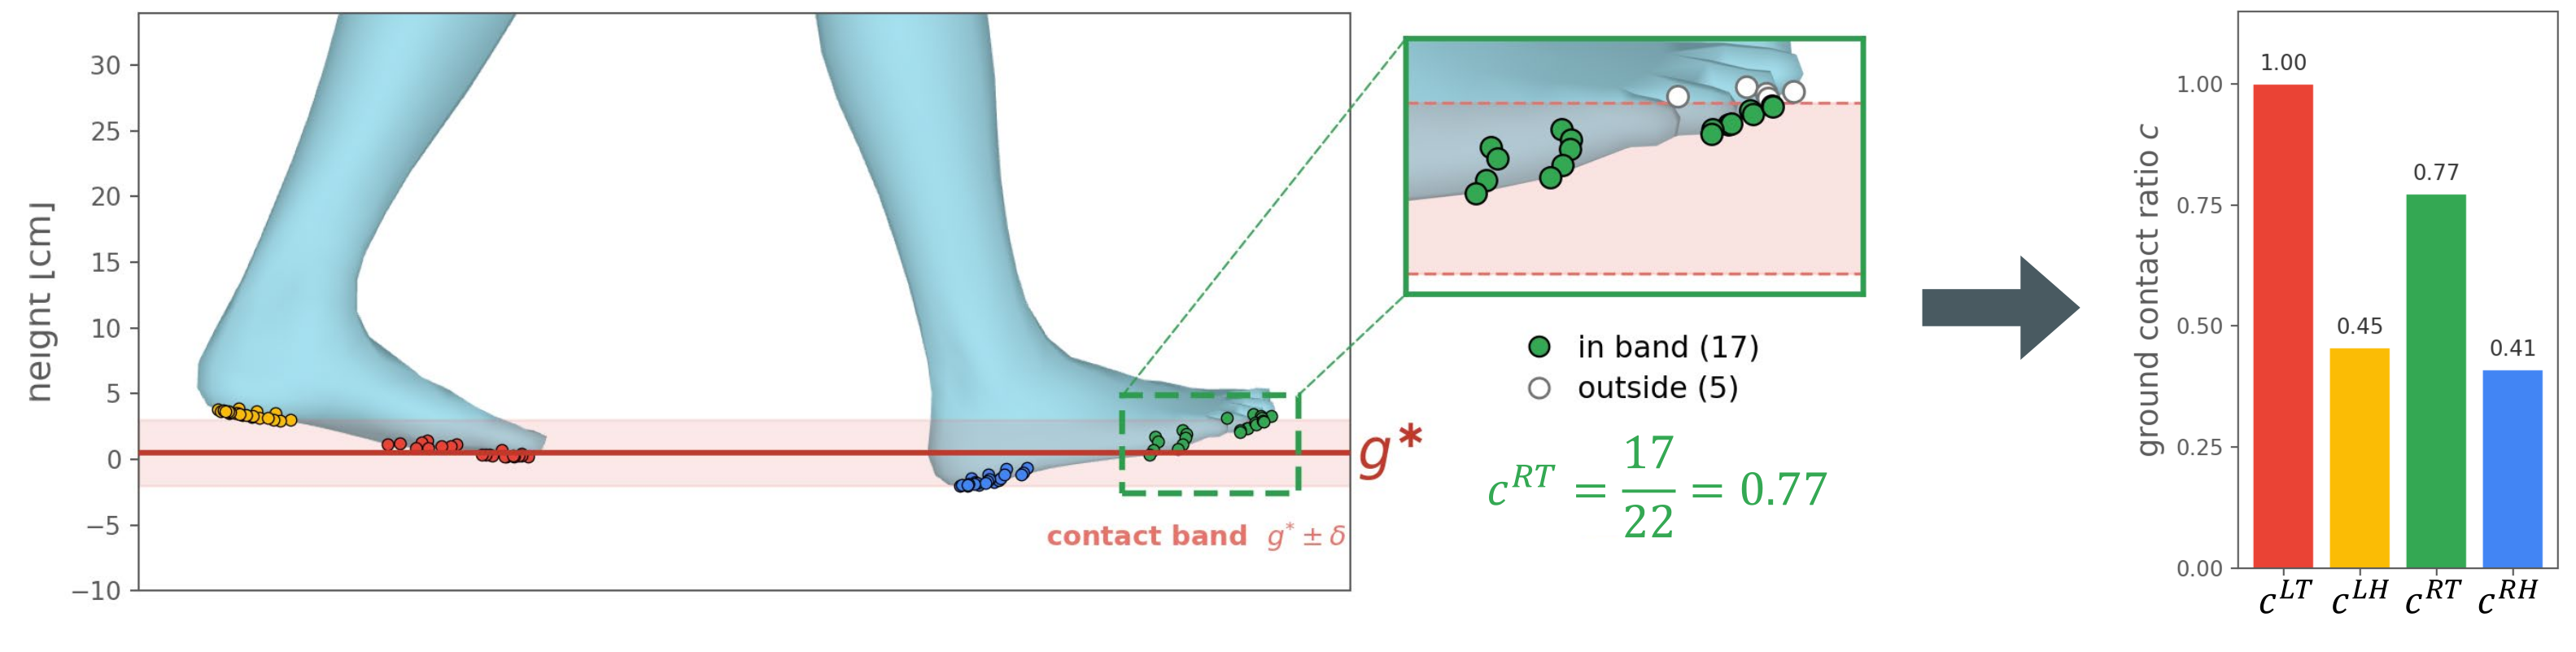
Require root jerk below 50 m/s³, mean maximum foot-region contact ratio above 0.6, pelvis height between 0.6 and 1.5 m, and horizontal pelvis/spine1 distances from the support hull below 6/11 cm. Airborne phases can survive if surrounding contact keeps the clip score high enough.
The appendix defines the support hull from projected left/right foot and ankle joints. Thresholds follow manual inspection of Humanoid-X metric distributions; jerk and maximum height correspond to the 94th/99th percentiles. Other thresholds also exclude motions outside the flat-ground scope. These are selected heuristics, not universally validated physical feasibility boundaries.
Equation 12
| (12) |
| Metric | Threshold |
|---|---|
| Root jerk | m/s3 |
| Foot contact score | |
| Minimum pelvis height | m |
| Maximum pelvis height | m |
| Pelvis distance to base of support | cm |
| Spine1 distance to base of support | cm |

A.2 Dataset Composition and Statistics
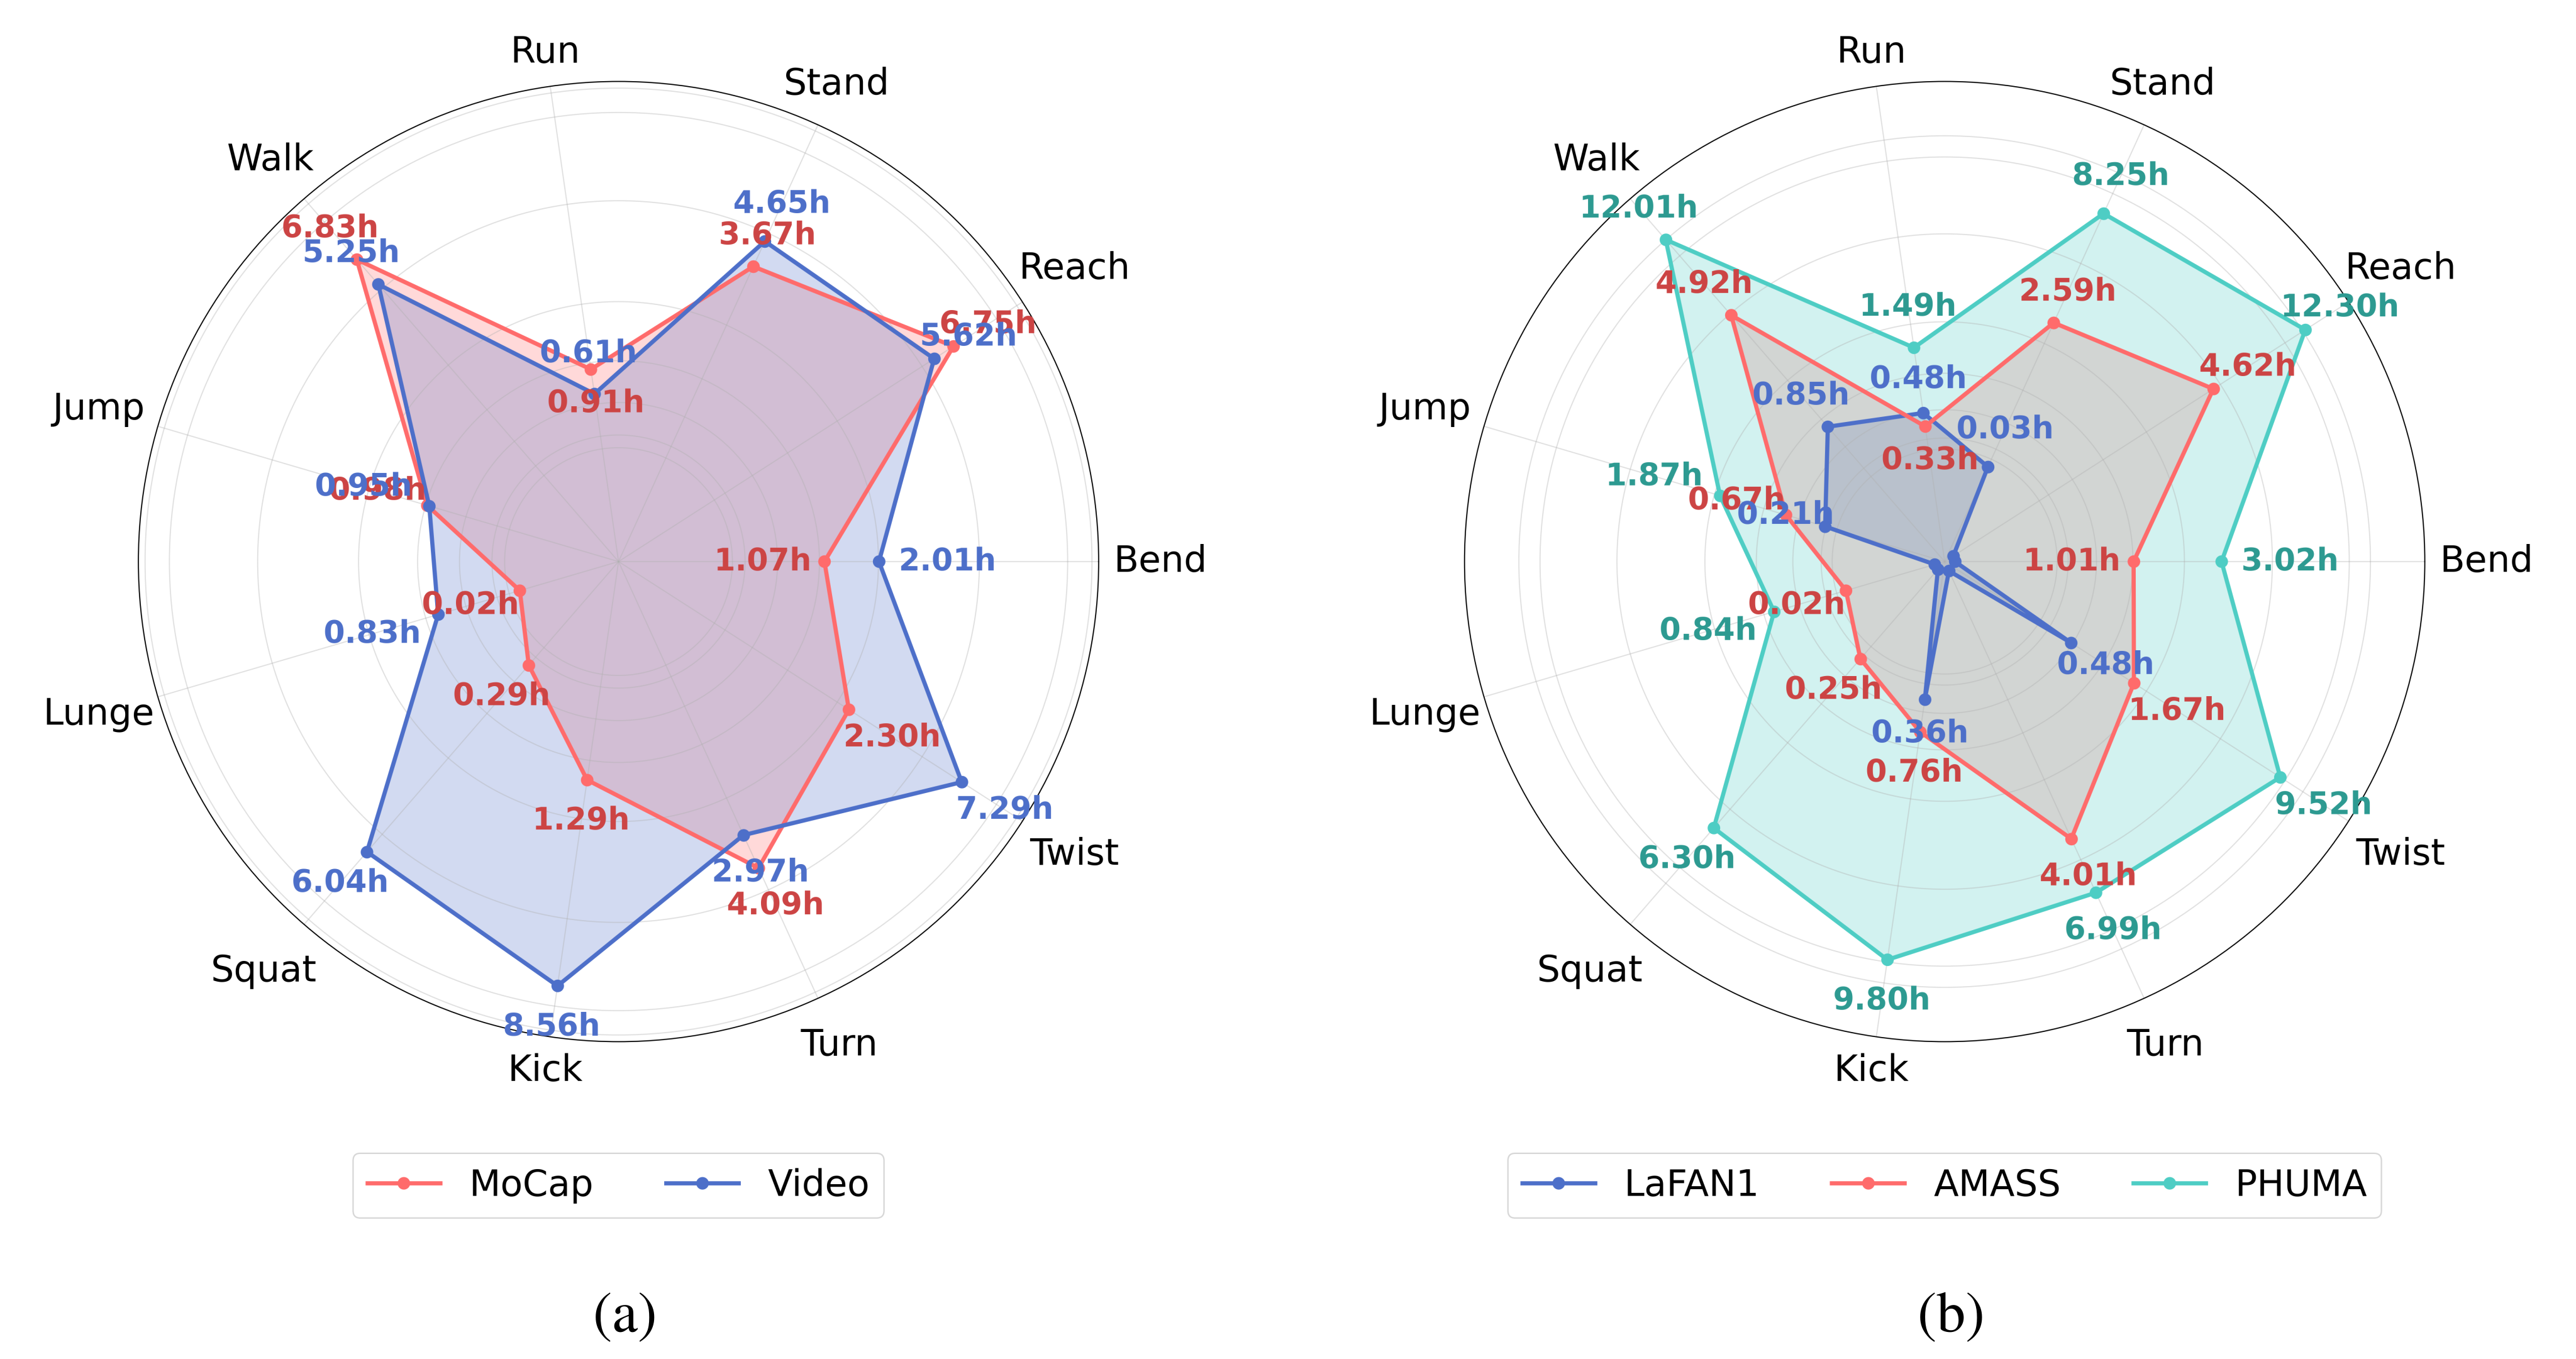
Table 8 totals 76.01K clips, 7.88M frames and 72.96 hours across mocap and video sources. Motion-X video contributes 31.98 hours and AMASS 20.86 hours; smaller sources broaden coverage. Figure 9 retains both complete source-distribution charts.
The LocoMuJoCo row lists 0.93M frames but 0.86 hours, inconsistent with 30 Hz and the total; that printed row is retained without guessing a correction. The aggregate duration also implies variable retained clip lengths, so 76,000 should not be multiplied by four seconds as if every surviving clip had identical duration.
| Dataset | # Clip | # Frame | Duration | Source | Scene |
|---|---|---|---|---|---|
| LocoMuJoCo [21] | 0.78K | 0.93M | 0.86h | Motion Capture | Indoor |
| GRAB [85] | 1.73K | 0.20M | 1.88h | Motion Capture | Indoor |
| EgoBody [20] | 2.12K | 0.24M | 2.19h | Motion Capture | Indoor |
| LAFAN1 [12] | 2.18K | 0.26M | 2.40h | Motion Capture | Indoor |
| AMASS [13] | 21.73K | 2.25M | 20.86h | Motion Capture | Indoor |
| HAA500 [29] | 1.76K | 0.11M | 1.01h | Human Video | Outdoor |
| Motion-X Video [27] | 33.04K | 3.45M | 31.98h | Human Video | Outdoor |
| HuMMan [30] | 0.50K | 0.05M | 0.47h | Human Video | Indoor |
| AIST [31] | 1.75K | 0.18M | 1.66h | Human Video | Indoor |
| IDEA400 [27] | 9.94K | 0.98M | 9.10h | Human Video | Indoor |
| PHUMA Video | 0.50K | 0.06M | 0.56h | Human Video | Outdoor |
| PHUMA | 76.01K | 7.88M | 72.96h |
Appendix B Motion Retargeting
The additional retargeting experiments compare morphology handling, offline throughput and initialization for a separate dynamics-aware optimizer.
B.1 Comparison of Retargeting Methods
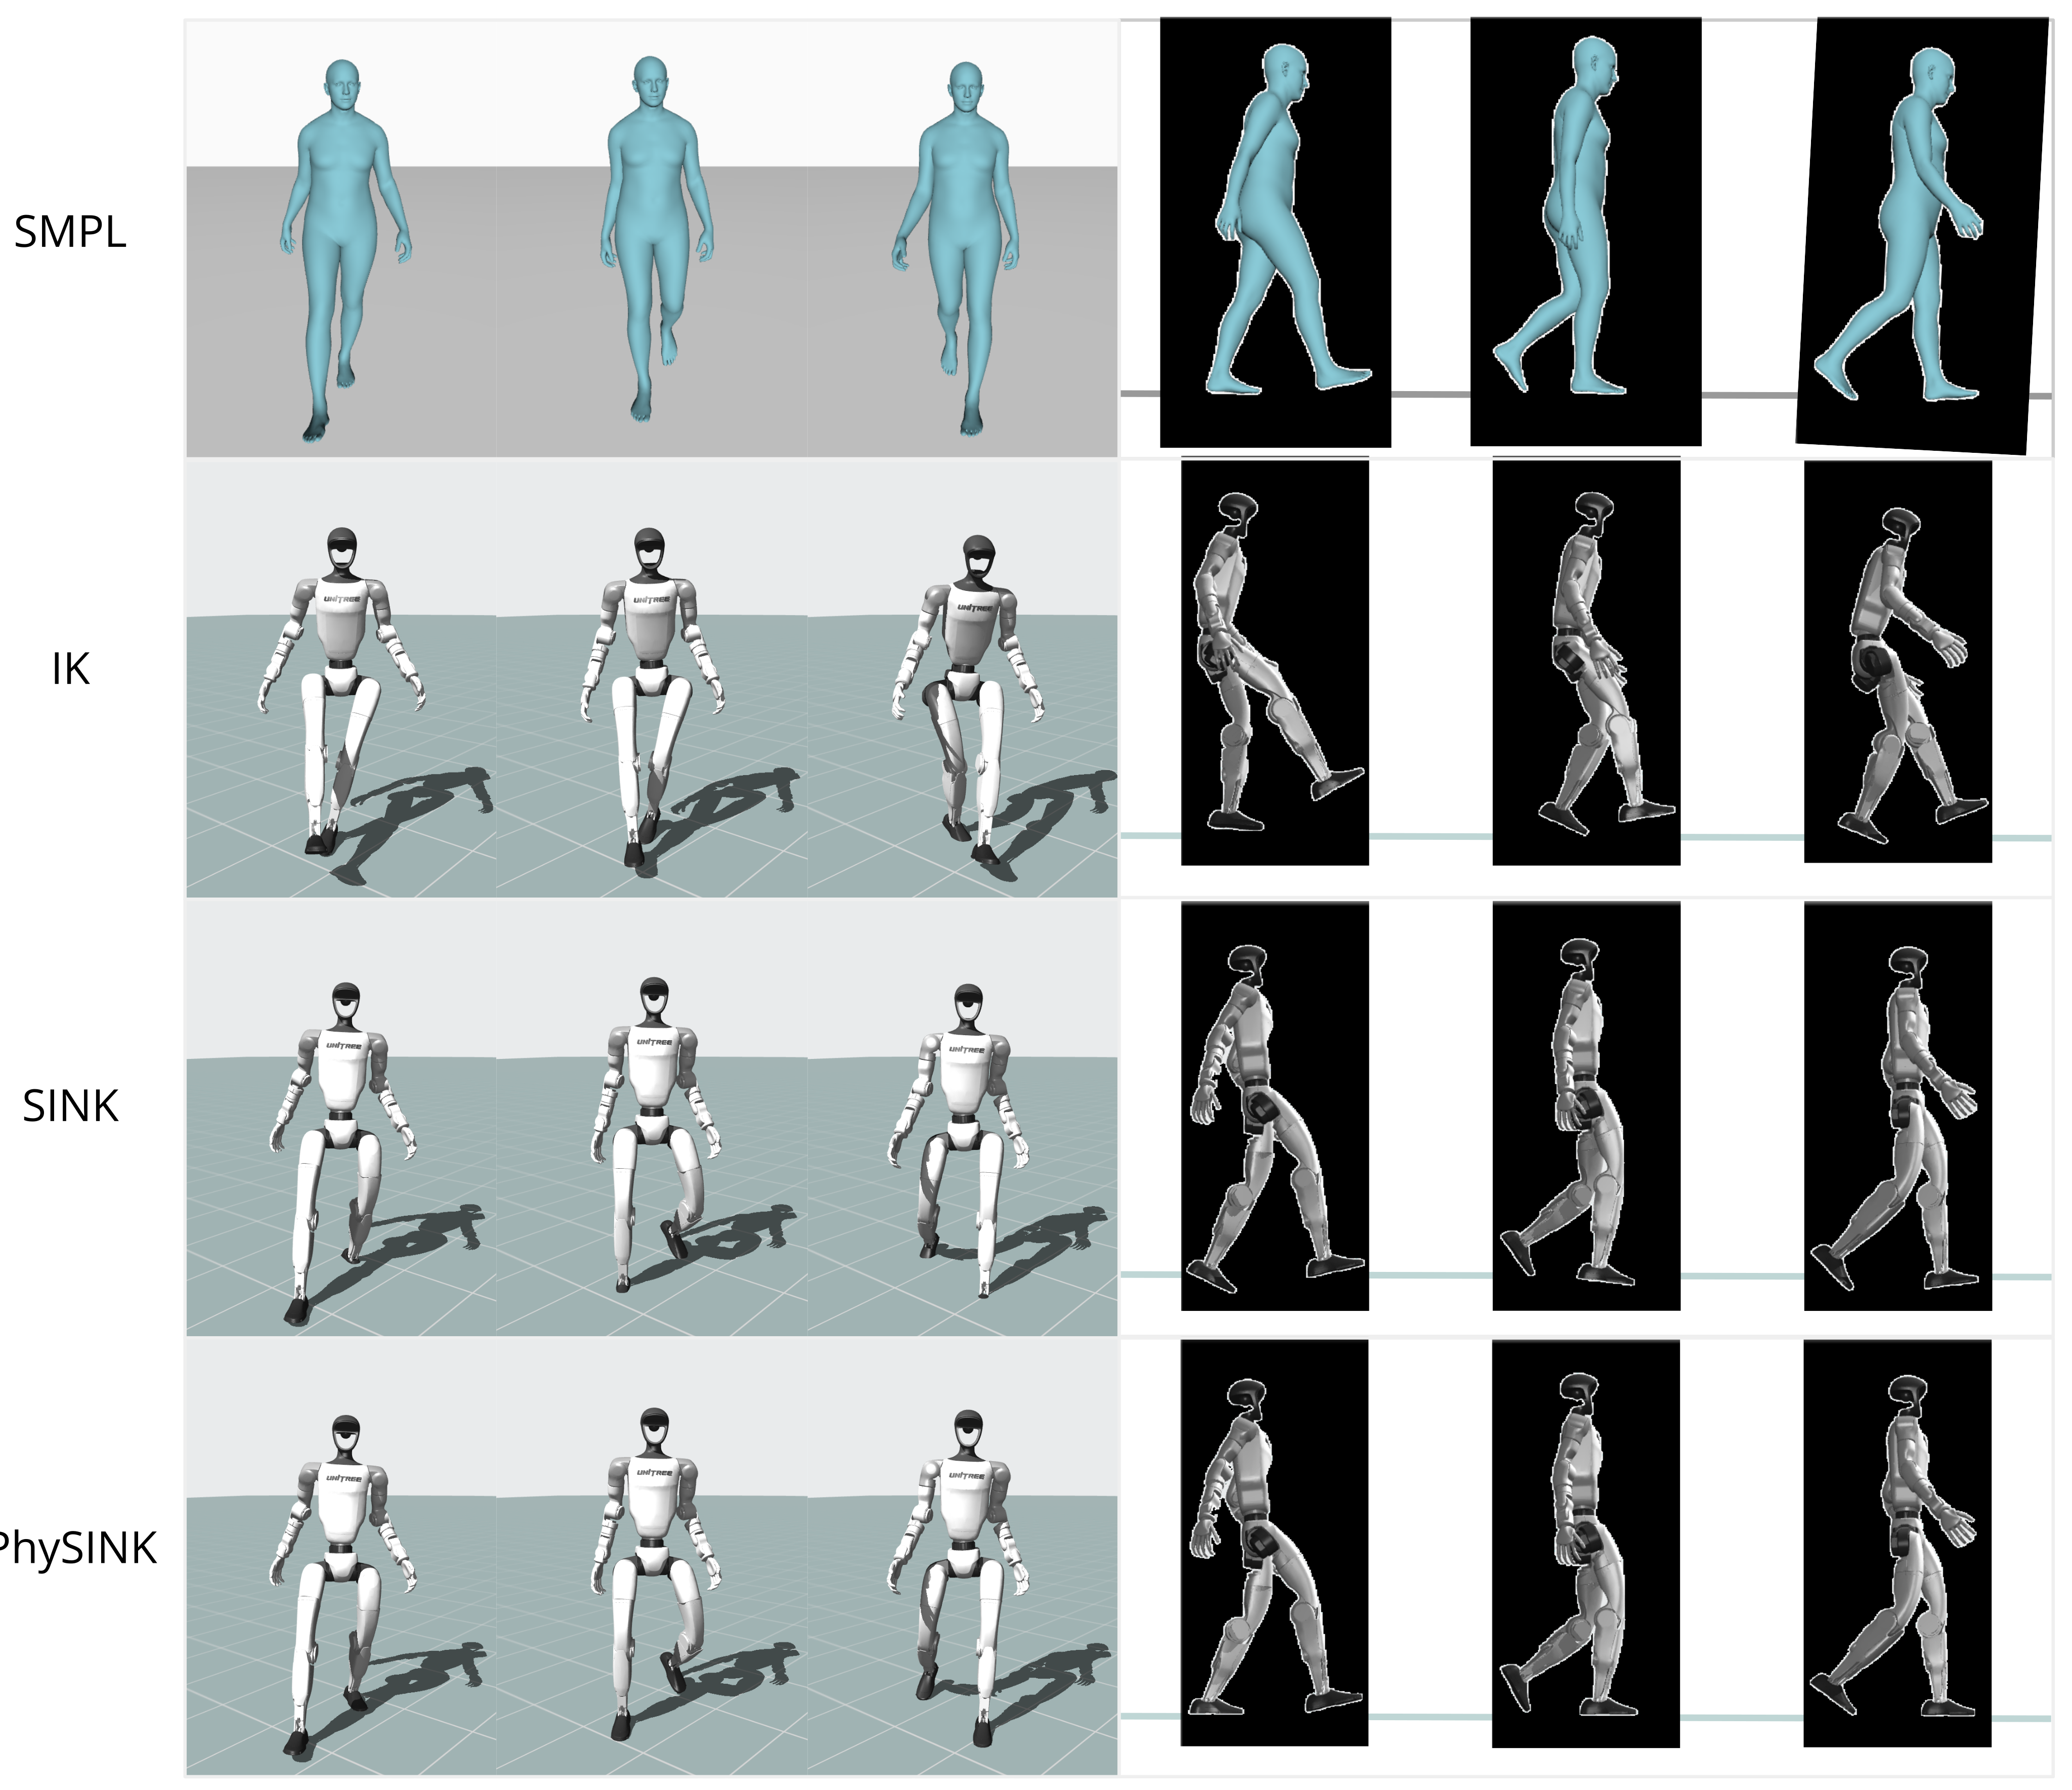
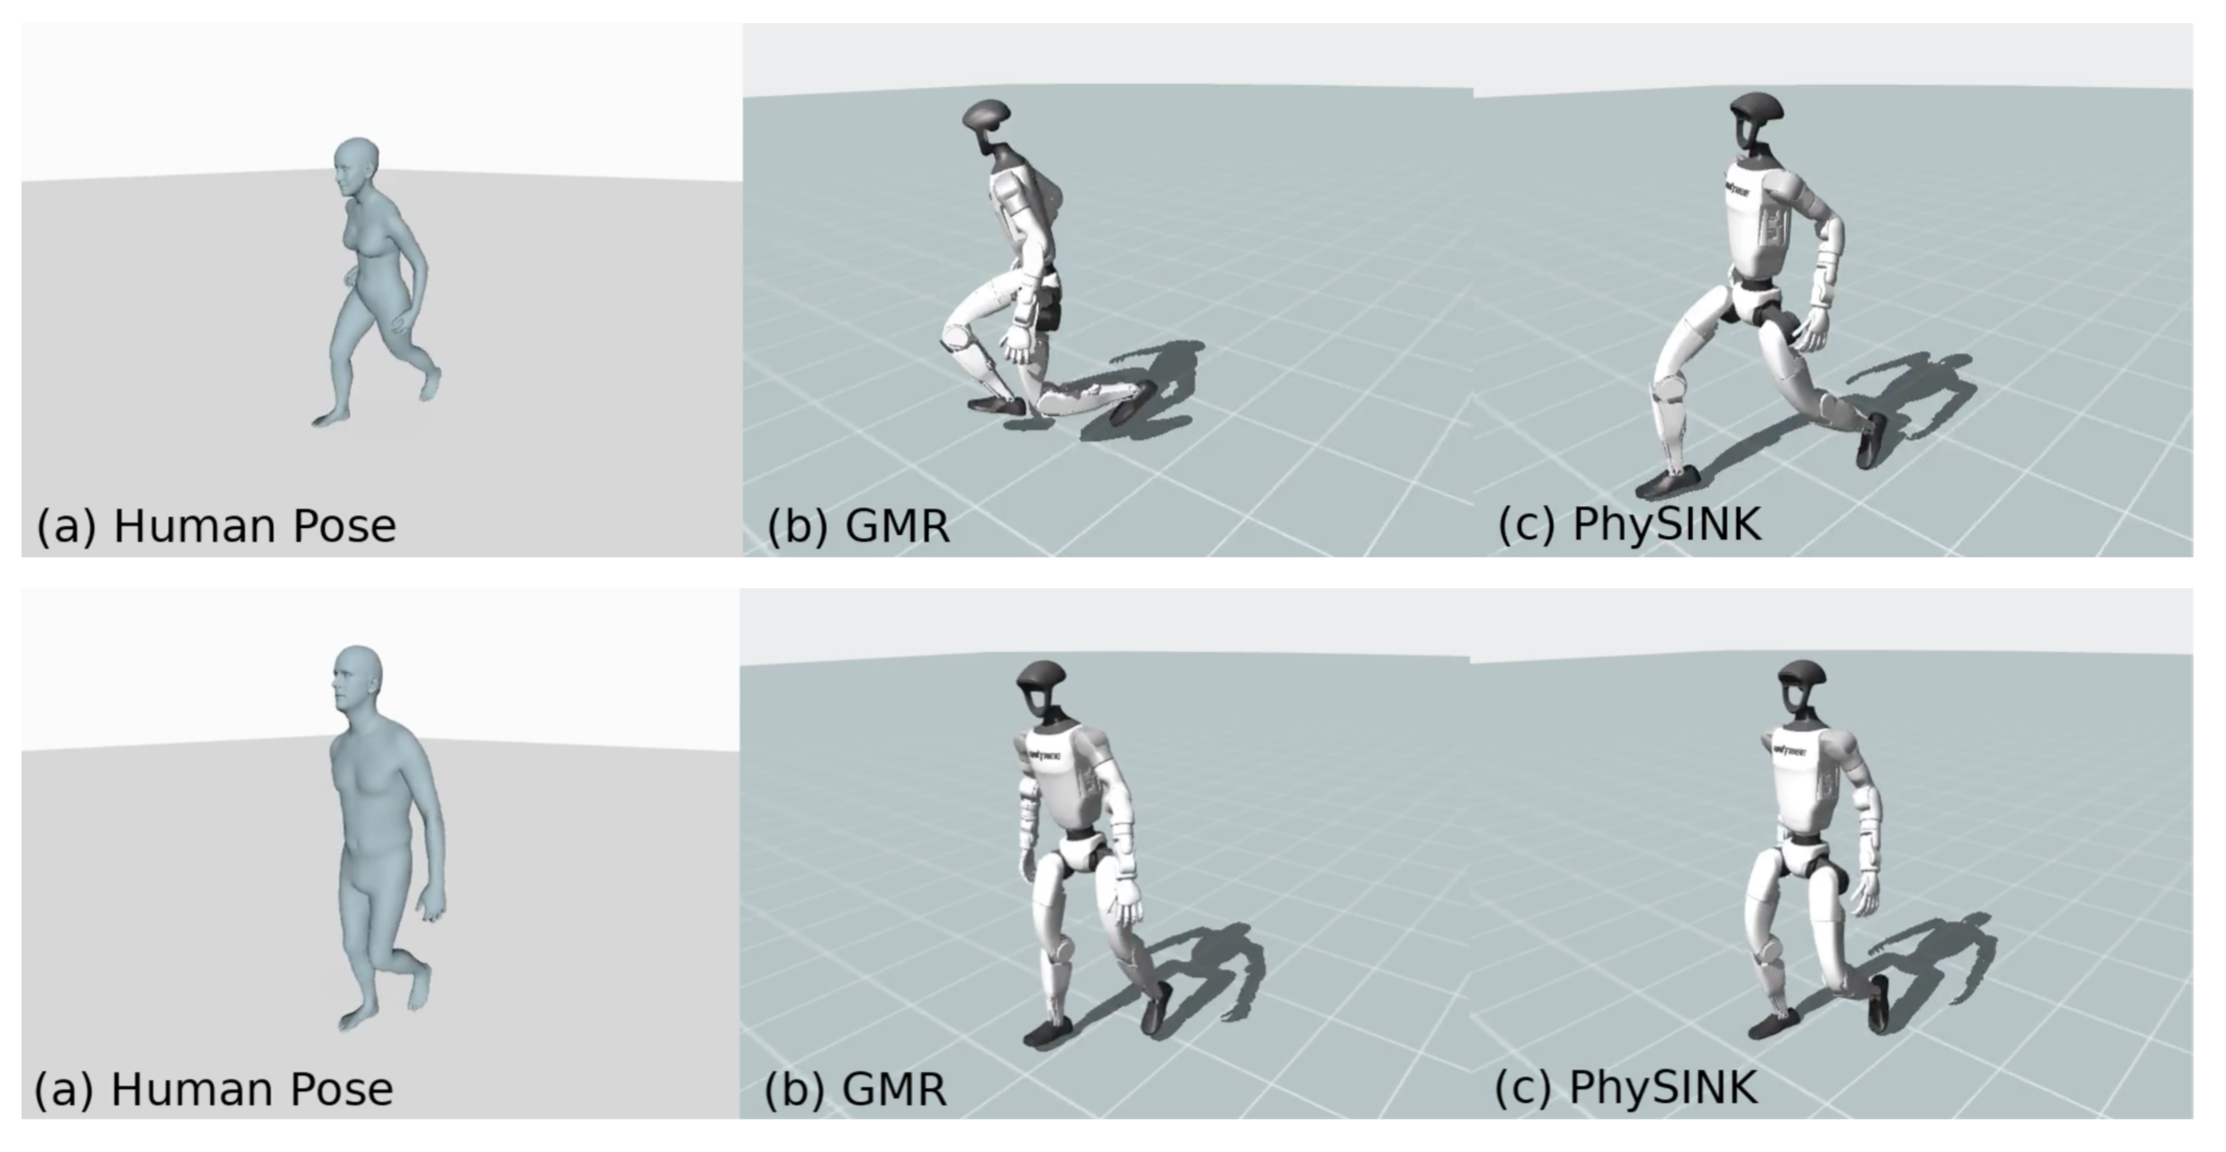
GMR uses a height-derived factor and hand-tuned per-limb scaling. PhySINK instead optimizes SMPL shape to a shared robot T-pose and applies the original joint angles to that shape. Figures 10–11 show selected walking and extreme-height cases; they illustrate the mechanism without proving morphology-independent performance for every subject.
On curated sources excluding pre-retargeted datasets, PhySINK versus GMR gives 89.9% versus 84.0% PHUMA Test success and 81.7% versus 75.2% Unseen Video success. Unseen stationary performance is lower (97.4% versus 99.1%), and vertical performance ties, so the aggregate gain is not a win in every cell.
B.2 Computational Cost
On one RTX 3090, throughput is 38.4 fps for IK, 25.3 for GMR, 0.95 for SINK and 0.92 for PhySINK. The latter optimize whole trajectories to handle temporal noise, making them suitable here for offline dataset preparation rather than real-time retargeting.
B.3 PhySINK as Initialization for Dynamics-Aware Retargeting
Replace GMR initialization in SPIDER with PhySINK while retaining sampling-based optimization. Open-loop Unseen Video success rises from 4.6% to 10.7%. This supports a better starting point, while the low absolute success underscores that kinematic improvements do not solve dynamics by themselves.
Appendix C Motion Imitation Learning
The policy details specify what each controller observes, optimizes and randomizes. Preserved tables provide complete dimensions, reward formulas, hyperparameters and randomization ranges.
C.1 Observation Space Compositions
Both controllers combine current proprioception with reference-motion information, but their representations and intended deployment differ.
C.1.1 MaskedMimic
MaskedMimic observes root height and body position, rotation, velocity and angular velocity. Its goal contains absolute/root-relative and current-state-relative targets for 15 future timesteps. G1/H1-2 have 33/25 modeled bodies and total observation dimensions 9,898/7,498.
| Dimension | ||
| State | G1 | H1-2 |
| (a) Proprioceptive State | ||
| Root height | 1 | 1 |
| Body position | ||
| Body rotation | ||
| Body velocity | ||
| Body angular velocity | ||
| (b) Goal State | ||
| Relative body position | ||
| Absolute body position | ||
| Relative body rotation | ||
| Absolute body rotation | ||
| Time | ||
| Total dim | 9898 | 7498 |
C.1.2 BeyondMimic
BeyondMimic observes previous action, base angular velocity and joint position/velocity, plus instantaneous reference joints and torso orientation. Twenty reference frames spaced across 95 control steps (1.9 seconds at 50 Hz) form a 20×78 tensor, encoded to 128 dimensions; the full input is 282 dimensions.
Future targets raise 0.5 m success from 47.15% to 78.77% in IsaacSim and 46.91% to 76.02% in MuJoCo on PHUMA Test. Tracking errors in Table 14 are averaged only over successful motions. Acceleration error slightly increases, so the larger success set does not imply improvement in every conditional error metric.
| State | Dimension (G1) |
|---|---|
| (a) Proprioceptive State | |
| Previous action | 29 |
| Base angular velocity | 3 |
| DoF position | 29 |
| DoF velocity | 29 |
| (b) Goal State | |
| (b.1) Instantaneous | |
| DoF position | 29 |
| DoF velocity | 29 |
| Torso rotation | 6 |
| (b.2) Future Motion Targets (motion-encoder input) | |
| Root height | |
| Root roll/pitch | |
| Base linear velocity | |
| Base yaw rate | |
| DoF position | |
| Local key-body position | |
| Total dim | 282 |
| Future | IsaacSim | MuJoCo | ||||||||
| SR | SR | |||||||||
| (a) PHUMA test | ||||||||||
| ✗ | 47.15 | 115.78 | 32.70 | 1.15 | 4.29 | 46.91 | 156.64 | 32.92 | 1.22 | 4.36 |
| ✓ | 78.77 | 112.00 | 28.28 | 1.18 | 4.14 | 76.02 | 142.79 | 28.98 | 1.24 | 4.18 |
| (b) Unseen Video | ||||||||||
| ✗ | 47.82 | 123.71 | 31.93 | 1.07 | 4.93 | 47.42 | 122.89 | 30.60 | 1.09 | 4.85 |
| ✓ | 71.63 | 121.69 | 24.87 | 1.11 | 4.78 | 70.44 | 122.68 | 23.79 | 1.14 | 4.73 |
C.2 Reward Function
Tracking rewards encourage agreement with the target, while regularization discourages unstable or abrupt actions. The exact formulas and weights are preserved in Tables 15–16.
C.2.1 MaskedMimic
MaskedMimic rewards global body positions, root height, rotations and linear/angular velocities with exponential error functions. Power consumption is penalized, and the added action-change squared penalty has weight −0.2 to encourage smooth control.
| Term | Expression | Weight |
| (a) Task | ||
| Global body position | 0.5 | |
| Root height | 0.2 | |
| Global body rotation | 0.3 | |
| Global body velocity | 0.1 | |
| Global body angular velocity | 0.1 | |
| (b) Regularization | ||
| Power consumption | -1e-05 | |
| Action rate | -0.2 | |
C.2.2 BeyondMimic
BeyondMimic combines global reference tracking with body targets re-anchored to the robot’s root after factoring out reference horizontal translation and heading. Regularizers penalize action changes, joint-position limit violations and undesired contacts. These controller rewards are distinct from the offline PhySINK losses.
| Term | Expression | Weight |
| (a) Motion Tracking | ||
| Reference body position | 0.5 | |
| Reference body rotation | 0.5 | |
| Global body linear velocity | 1.0 | |
| Global body angular velocity | 1.0 | |
| Relative body position | 1.0 | |
| Relative body rotation | 1.0 | |
| (b) Regularization | ||
| Action rate | -0.1 | |
| DoF position-limit violation | -100 | |
| Undesired contacts | -0.5 | |
C.3 PPO Hyperparameters
Both configurations use 8,192 environments. MaskedMimic uses Adam, a four-layer 512-dimensional transformer actor and a four-layer 1,024-wide critic. BeyondMimic uses AdamW, 768/512/256 MLPs, 24 rollout steps, eight epochs and a 60-hidden/128-output motion encoder. The complete source values remain in Tables 17–18, including the unusual printed MaskedMimic “Init noise std” of −2.9; its parameterization is not clarified here.
| Hyperparameter | Value |
|---|---|
| Optimizer | Adam |
| Num envs | 8192 |
| Mini Batches | 32 |
| Learning epochs | 1 |
| Entropy coefficient | 0.0 |
| Value loss coefficient | 0.5 |
| Clip param | 0.2 |
| Max grad norm | 50.0 |
| Init noise std | -2.9 |
| Actor learning rate | 2e-5 |
| Critic learning rate | 1e-4 |
| GAE decay factor() | 0.95 |
| GAE discount factor() | 0.99 |
| Actor Transformer dimension | 512 |
| Actor layers | 4 |
| Actor heads | 4 |
| Critic MLP size | [1024, 1024, 1024, 1024] |
| Activation | ReLU |
| Hyperparameter | Value |
|---|---|
| Optimizer | AdamW |
| Num envs | 8192 |
| Steps per env | 24 |
| Mini batches | 4 |
| Learning epochs | 8 |
| Entropy coefficient | 0.005 |
| Value loss coefficient | 1.0 |
| Clip param | 0.2 |
| Max grad norm | 1.0 |
| Init noise std | 1.0 |
| Actor learning rate | 1e-5 |
| Critic learning rate | 1e-5 |
| GAE decay factor() | 0.95 |
| GAE discount factor() | 0.99 |
| Actor MLP size | [768, 512, 256] |
| Critic MLP size | [768, 512, 256] |
| Motion encoder hidden dim | 60 |
| Motion encoder output dim | 128 |
| Activation | SiLU |
C.4 Domain Randomization
Domain randomization targets the simulation-to-hardware gap during training rather than changing the reference-motion dataset.
C.4.1 BeyondMimic
BeyondMimic varies actuator gains, joint bias, base center of mass, friction/restitution, pushes, initial state and actor-observation noise. The critic receives noiseless observations. Table 19 preserves ranges and schedules; the paper states that randomization and noise are disabled during evaluation, so these evaluations are not a stress test across all sampled disturbances.
| Parameter | Range |
|---|---|
| P-gain scale | |
| D-gain scale | |
| DoF position bias | |
| Base CoM offset | |
| Base CoM offset | |
| Static friction | |
| Dynamic friction | |
| Restitution | |
| Push interval | |
| Push linear velocity | |
| Push angular velocity | |
| Initial DoF position | |
| Initial root position | |
| Initial root rotation | |
| Initial root linear vel. | |
| Initial root angular vel. | |
| Obs. noise: base angular vel. () | |
| Obs. noise: DoF position () | |
| Obs. noise: DoF velocity () | |
| Obs. noise: motion ref orientation () |
Appendix D Experiment Details
Additional tests distinguish strict tracking, alternative reference construction, simulator transfer and falling frequency.
D.1 Self-Collected Video Dataset
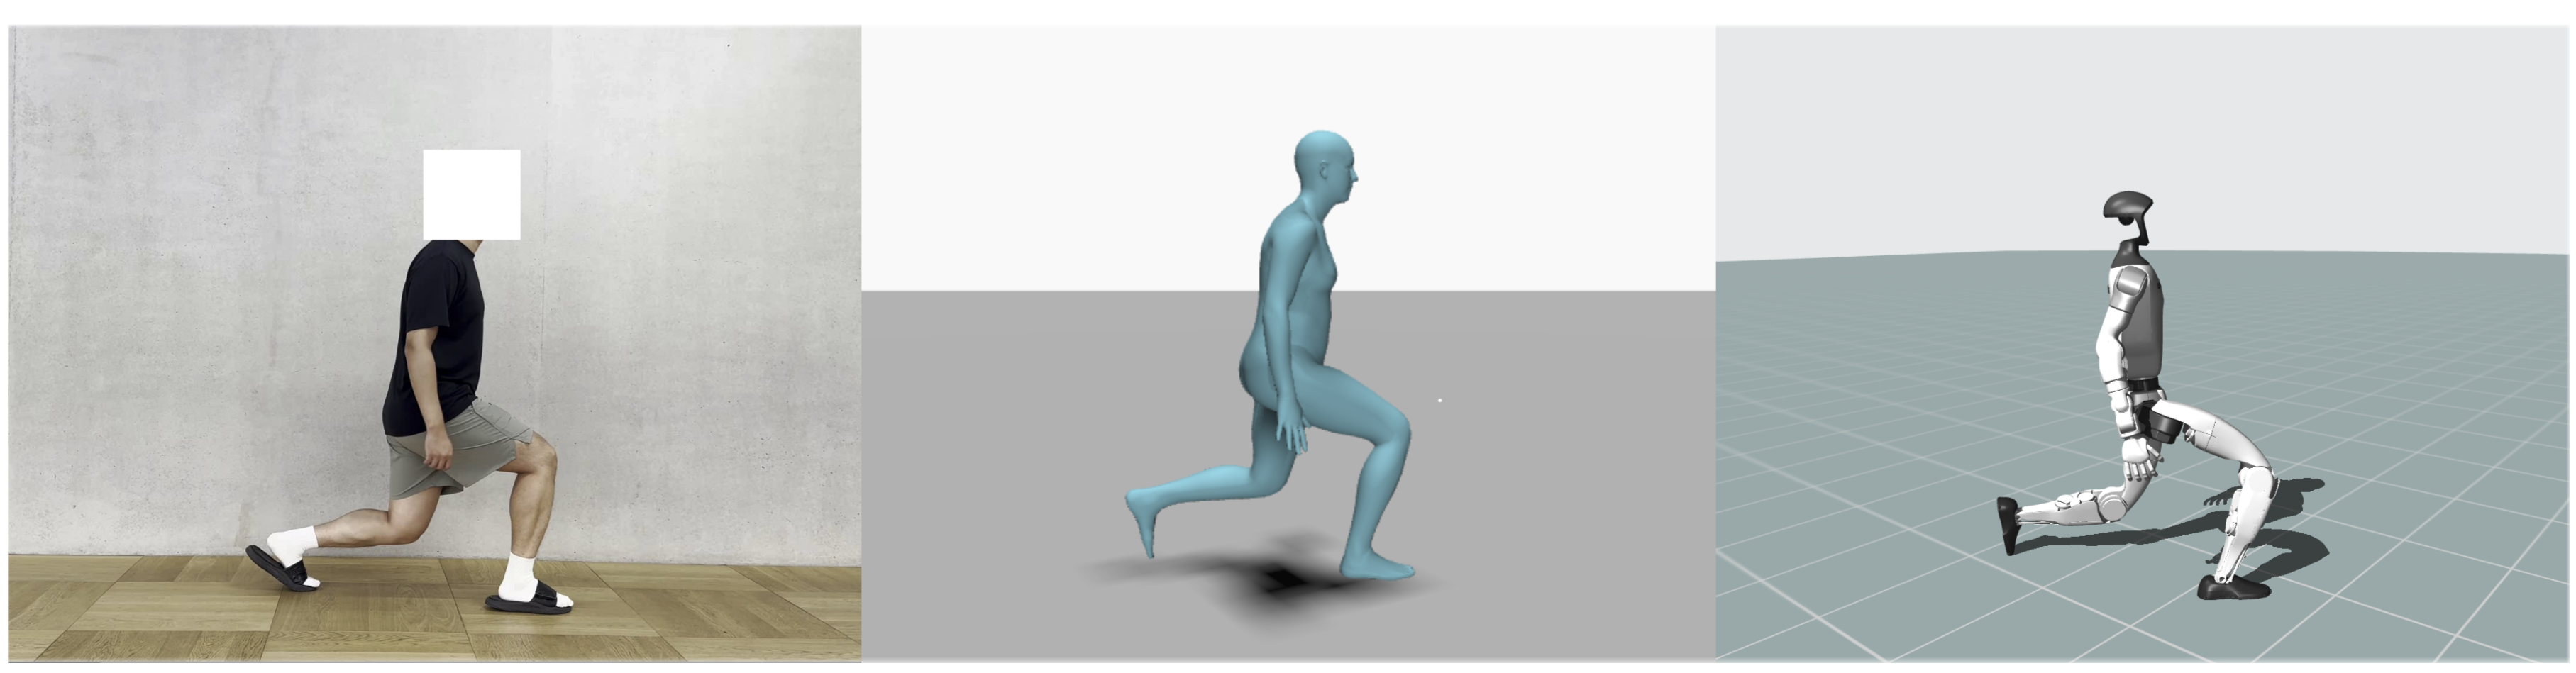
The 504 self-recorded videos span 11 motion types. TRAM extracts human motion and PhySINK maps it to robot references. These are reported as unseen recordings, although reconstruction and retargeting introduce their own errors. Appendix D.4 addresses dependence on the chosen retargeter.
D.2 Success Rate Threshold Analysis
Success depends strongly on tolerance. On G1 PHUMA Test, PHUMA/AMASS achieve 92.7%/76.2% at 0.15 m but 97.1%/90.2% at 0.5 m. On Unseen Video, the corresponding totals are 82.9%/70.2% and 93.7%/92.3%. The strict threshold separates tracking precision more clearly; changing the threshold also changes category rankings.
| Success Threshold=0.15m | Success Threshold=0.5m | ||||||||||
| Dataset | Hours | Total | Stationary | Angular | Vertical | Horizontal | Total | Stationary | Angular | Vertical | Horizontal |
| (a) G1 | |||||||||||
| LaFAN1 | 2.4 | 46.1 | 66.1 | 36.2 | 24.0 | 42.5 | 74.8 | 87.8 | 69.2 | 47.1 | 72.6 |
| AMASS | 20.9 | 76.2 | 88.5 | 72.1 | 56.8 | 66.8 | 90.2 | 95.0 | 87.9 | 81.1 | 83.7 |
| Humanoid-X | 231.4 | 50.6 | 78.4 | 43.0 | 26.0 | 31.8 | 78.4 | 91.3 | 72.9 | 59.5 | 65.9 |
| PHUMA | 73.0 | 92.7 | 95.6 | 91.7 | 86.0 | 85.6 | 97.1 | 98.7 | 96.5 | 94.4 | 92.5 |
| (b) H1-2 | |||||||||||
| LaFAN1 | 2.4 | 62.0 | 79.3 | 54.7 | 26.6 | 58.9 | 70.8 | 92.4 | 66.7 | 56.4 | 68.2 |
| AMASS | 20.9 | 54.4 | 74.9 | 45.9 | 17.2 | 49.6 | 70.4 | 86.3 | 62.6 | 41.4 | 65.9 |
| Humanoid-X | 231.4 | 49.7 | 74.6 | 40.4 | 17.0 | 37.3 | 54.8 | 78.5 | 45.2 | 22.1 | 43.2 |
| PHUMA | 73.0 | 82.7 | 91.5 | 79.5 | 68.1 | 68.4 | 92.0 | 96.6 | 89.7 | 85.6 | 79.4 |
| Success Threshold=0.15m | Success Threshold=0.5m | ||||||||||
| Dataset | Hours | Total | Stationary | Angular | Vertical | Horizontal | Total | Stationary | Angular | Vertical | Horizontal |
| (a) G1 | |||||||||||
| LaFAN1 | 2.4 | 28.4 | 46.9 | 28.4 | 19.6 | 10.5 | 78.2 | 85.5 | 70.8 | 76.3 | 80.8 |
| AMASS | 20.9 | 70.2 | 90.7 | 75.0 | 62.7 | 44.1 | 92.3 | 99.2 | 92.1 | 82.1 | 88.0 |
| Humanoid-X | 231.4 | 39.1 | 78.0 | 39.6 | 23.0 | 6.5 | 84.1 | 98.3 | 79.9 | 76.0 | 76.2 |
| PHUMA | 73.0 | 82.9 | 96.7 | 88.0 | 71.8 | 67.1 | 93.7 | 100.0 | 96.8 | 85.9 | 84.7 |
| (b) H1-2 | |||||||||||
| LaFAN1 | 2.4 | 70.8 | 92.4 | 66.7 | 56.4 | 68.2 | 85.5 | 97.5 | 79.0 | 77.5 | 90.0 |
| AMASS | 20.9 | 64.3 | 87.3 | 59.7 | 46.0 | 63.9 | 80.4 | 93.3 | 69.9 | 72.8 | 89.0 |
| Humanoid-X | 231.4 | 60.5 | 88.3 | 60.0 | 48.7 | 39.7 | 68.7 | 93.3 | 65.1 | 60.2 | 50.5 |
| PHUMA | 73.0 | 78.6 | 97.5 | 76.8 | 74.5 | 63.8 | 89.9 | 99.2 | 89.4 | 84.6 | 83.9 |
D.3 Cross-Simulator Generalization Analysis
Teacher/student policies using the KungfuBot2 reference are trained in Isaac Gym and transferred to MuJoCo. PHUMA improves aggregate teacher, student and transfer success. In MuJoCo, totals are 75.0%/70.0% versus AMASS 62.1%/64.3% on the two test sets. Some in-training category results tie or favor AMASS, and simulator transfer remains different evidence from hardware deployment.
D.4 Evaluation on GMR-Retargeted References
Retarget evaluation motions with GMR and use 0.5 m success, reporting mean ± standard deviation over three seeds. PhySINK-trained AMASS reaches 83.4±0.2%/83.7±0.4%; complete PHUMA reaches 95.5±0.2%/89.4±0.4%. Thus aggregate benefits persist with different references and after comparing against AMASS using the same improved retargeter. These uncertainties apply to this protocol, not automatically to every main-table result.
D.5 Fall Rate of Humanoid-X and AMASS Policies
A fall means pelvis height below 0.3 m. Humanoid-X versus AMASS falls in 18.6% versus 5.7% of PHUMA Test episodes and 13.1% versus 4.2% of Unseen Video episodes. This motivates omitting Humanoid-X hardware deployment, while limiting the range of baselines tested on the real robot.
Appendix E Ablation Studies
The ablations examine source modality, filtering, reconstruction quality and retargeting penalties. Several use different data subsets or evaluation references, so their totals should not be merged into one sequential improvement curve.
E.1 Mocap only and Video only data performance
Video-only training improves all listed tracking categories over mocap-only, while both yield high kinematic quality after retargeting. The video subset is larger and more varied, so this does not isolate modality from scale and coverage.
Adding all video to a mocap base gives the best 0.5 m GMR-reference results, 94.6±0.1%/90.2±0.9%. The trend is not monotonic: adding 33% video lowers Unseen Video success from 86.0% to 80.1% before larger additions improve it. Table 30 retains this exception.
| Motion Fidelity (%) | Joint Feasibility (%) | Non-Floating (%) | Non-Penetration (%) | Non-Skating (%) | |
|---|---|---|---|---|---|
| MoCap | 96.7 | 100.0 | 99.9 | 94.3 | 92.1 |
| Video | 93.8 | 100.0 | 99.9 | 98.0 | 88.3 |
| PHUMA Test | Unseen Video | |||||||||
|---|---|---|---|---|---|---|---|---|---|---|
| Dataset | Total | Stationary | Angular | Vertical | Horizontal | Total | Stationary | Angular | Vertical | Horizontal |
| MoCap | 75.2 | 88.2 | 68.4 | 49.0 | 86.9 | 73.0 | 96.6 | 73.9 | 56.4 | 58.2 |
| Video | 85.7 | 92.9 | 81.8 | 75.5 | 89.5 | 76.2 | 100.0 | 76.4 | 59.6 | 62.6 |
E.2 Physics-based Filtering
Filtering studies separate retained volume, retargeted kinematic quality and downstream controller performance. They answer related but different questions.
E.2.1 Data Distribution Based on Physics-based Filtering
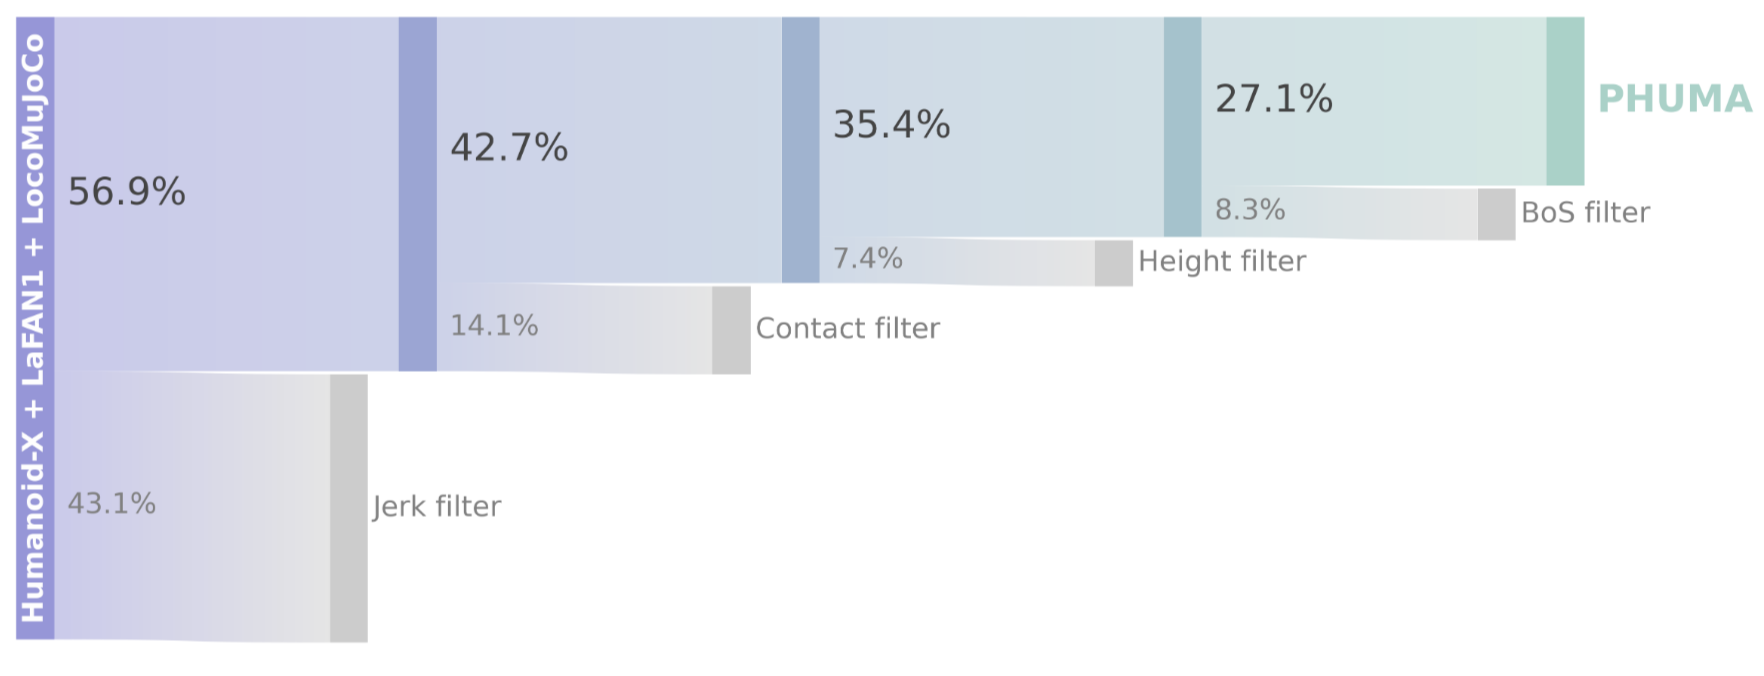
Sequential jerk, contact, height and support filters leave 27.1% in the illustrated flow. The prose describes Humanoid-X, whereas Figure 13’s caption and diagram name Humanoid-X plus LaFAN1/LocoMuJoCo. This source-scope discrepancy is preserved, so that percentage should not be treated as an exact audited yield for every source.
E.2.2 PhySINK’s Robustness to Noisy Motion Sources
PhySINK maintains 100% joint feasibility across listed input variants, but fidelity improves from 70.6% on raw data to 94.8% with all filters. Good retargeting therefore does not eliminate the need for clean inputs. The prose describes individual filters, consistent with nonmonotonic retained hours, while the caption says “sequentially”; raw hours also appear as 237.2 here versus 231.4 elsewhere. These reported values are retained without conflating the protocols.
| Motion Source | Hours | Motion Fidelity (%) | Joint Feasibility (%) | Non-Floating (%) | Non-Penetration (%) | Non-Skating (%) |
|---|---|---|---|---|---|---|
| Humanoid-X | 237.2 | 70.6 | 100.0 | 98.7 | 92.2 | 90.1 |
| Jerk Filter | 141.1 | 76.9 | 100.0 | 99.7 | 96.5 | 92.0 |
| Foot Contact Filter | 123.1 | 77.1 | 100.0 | 99.8 | 96.8 | 90.6 |
| Height Filter | 135.7 | 87.0 | 100.0 | 99.4 | 94.7 | 89.8 |
| BoS Filter | 110.3 | 90.7 | 100.0 | 99.4 | 94.9 | 90.0 |
| All Filter | 62.2 | 94.8 | 100.0 | 99.9 | 96.7 | 89.7 |
E.2.3 Leave-One-Out Ablation of Curation Filters
With PhySINK and 0.5 m GMR references, all filters yield 94.6±0.1%/90.2±0.9%. Removing any filter increases volume but reduces success; removing foot contact gives the largest decline, to 87.5±0.1%/80.0±0.5%. This supports contact-based selection within the chosen flat-ground criteria.
E.2.4 Sensitivity to the Video Reconstruction Model
GVHMR raises curation acceptance from TRAM’s 41.9% to 77.4%, yet PhySINK still improves joint feasibility and contact metrics over SINK. Non-skating is 93.8% for TRAM/PhySINK and 86.6% for GVHMR/PhySINK, so better acceptance is not improvement on every downstream quality metric. The comparisons concern the accepted subsets, which need not contain identical motions.
E.3 Impact of Motion Retargeting Quality on Policy Performance
Shape-adaptive SINK variants outperform IK/GMR in these aggregate policy tests. Adding physical penalties gives smaller, nonmonotonic gains: joint-feasibility-only lowers totals; grounding gives 90.0% PHUMA Test, while full PhySINK gives 89.9% there and the best 81.7% Unseen Video. The authors interpret fidelity as especially important, but these coupled-method comparisons do not establish that every other artifact is causally unimportant.
| PHUMA Test | Unseen Video | |||||||||
|---|---|---|---|---|---|---|---|---|---|---|
| Dataset | Total | Stationary | Angular | Vertical | Horizontal | Total | Stationary | Angular | Vertical | Horizontal |
| IK | 70.5 | 85.9 | 63.3 | 47.6 | 77.3 | 68.5 | 96.6 | 72.4 | 43.6 | 49.5 |
| GMR | 84.0 | 92.1 | 77.8 | 77.1 | 89.1 | 75.2 | 99.1 | 77.8 | 61.7 | 52.7 |
| SINK | 89.1 | 94.0 | 86.0 | 84.9 | 90.7 | 79.0 | 100.0 | 81.8 | 62.8 | 62.6 |
| + Joint Feasibility Loss | 87.0 | 92.1 | 83.6 | 79.8 | 90.9 | 78.6 | 94.8 | 84.7 | 56.4 | 67.0 |
| + Grounding Loss | 90.0 | 93.5 | 87.9 | 85.6 | 92.0 | 80.4 | 98.3 | 86.2 | 60.6 | 64.8 |
| + Skating Loss | 89.9 | 94.2 | 87.6 | 84.2 | 91.8 | 81.7 | 97.4 | 86.7 | 61.7 | 71.4 |
E.4 Leave-One-Out Ablation of PhySINK Losses
The separate leave-one-loss-out test uses 0.5 m GMR references and three seeds. Full PhySINK is best; dropping grounding lowers success to 90.5±0.1%/84.5±0.8% and non-penetration to 14.6%. Dropping skating reduces non-skating from 89.7% to 53.6%. This demonstrates meaningful contact penalties under that protocol, despite diminishing or mixed gains in the earlier cumulative ablation.
| Retarget | Retargeting Quality | Motion Tracking Performance | |||||
|---|---|---|---|---|---|---|---|
| MF (%) | JF (%) | NF (%) | NP (%) | NS (%) | PHUMA Test (GMR) | Unseen Video (GMR) | |
| PhySINK | 94.8 | 100.0 | 99.9 | 96.8 | 89.7 | 94.6 (0.1) | 90.2 (0.9) |
| No Joint Feasibility Loss | 91.7 | 95.8 | 99.9 | 96.4 | 89.4 | 91.0 (0.1) | 85.8 (0.6) |
| No Grounding Loss | 91.8 | 100.0 | 96.4 | 14.6 | 91.7 | 90.5 (0.1) | 84.5 (0.8) |
| No Skating Loss | 94.9 | 100.0 | 99.9 | 97.2 | 53.6 | 94.2 (0.1) | 88.2 (0.8) |
Appendix F Pelvis-Only Path Following Control Performance
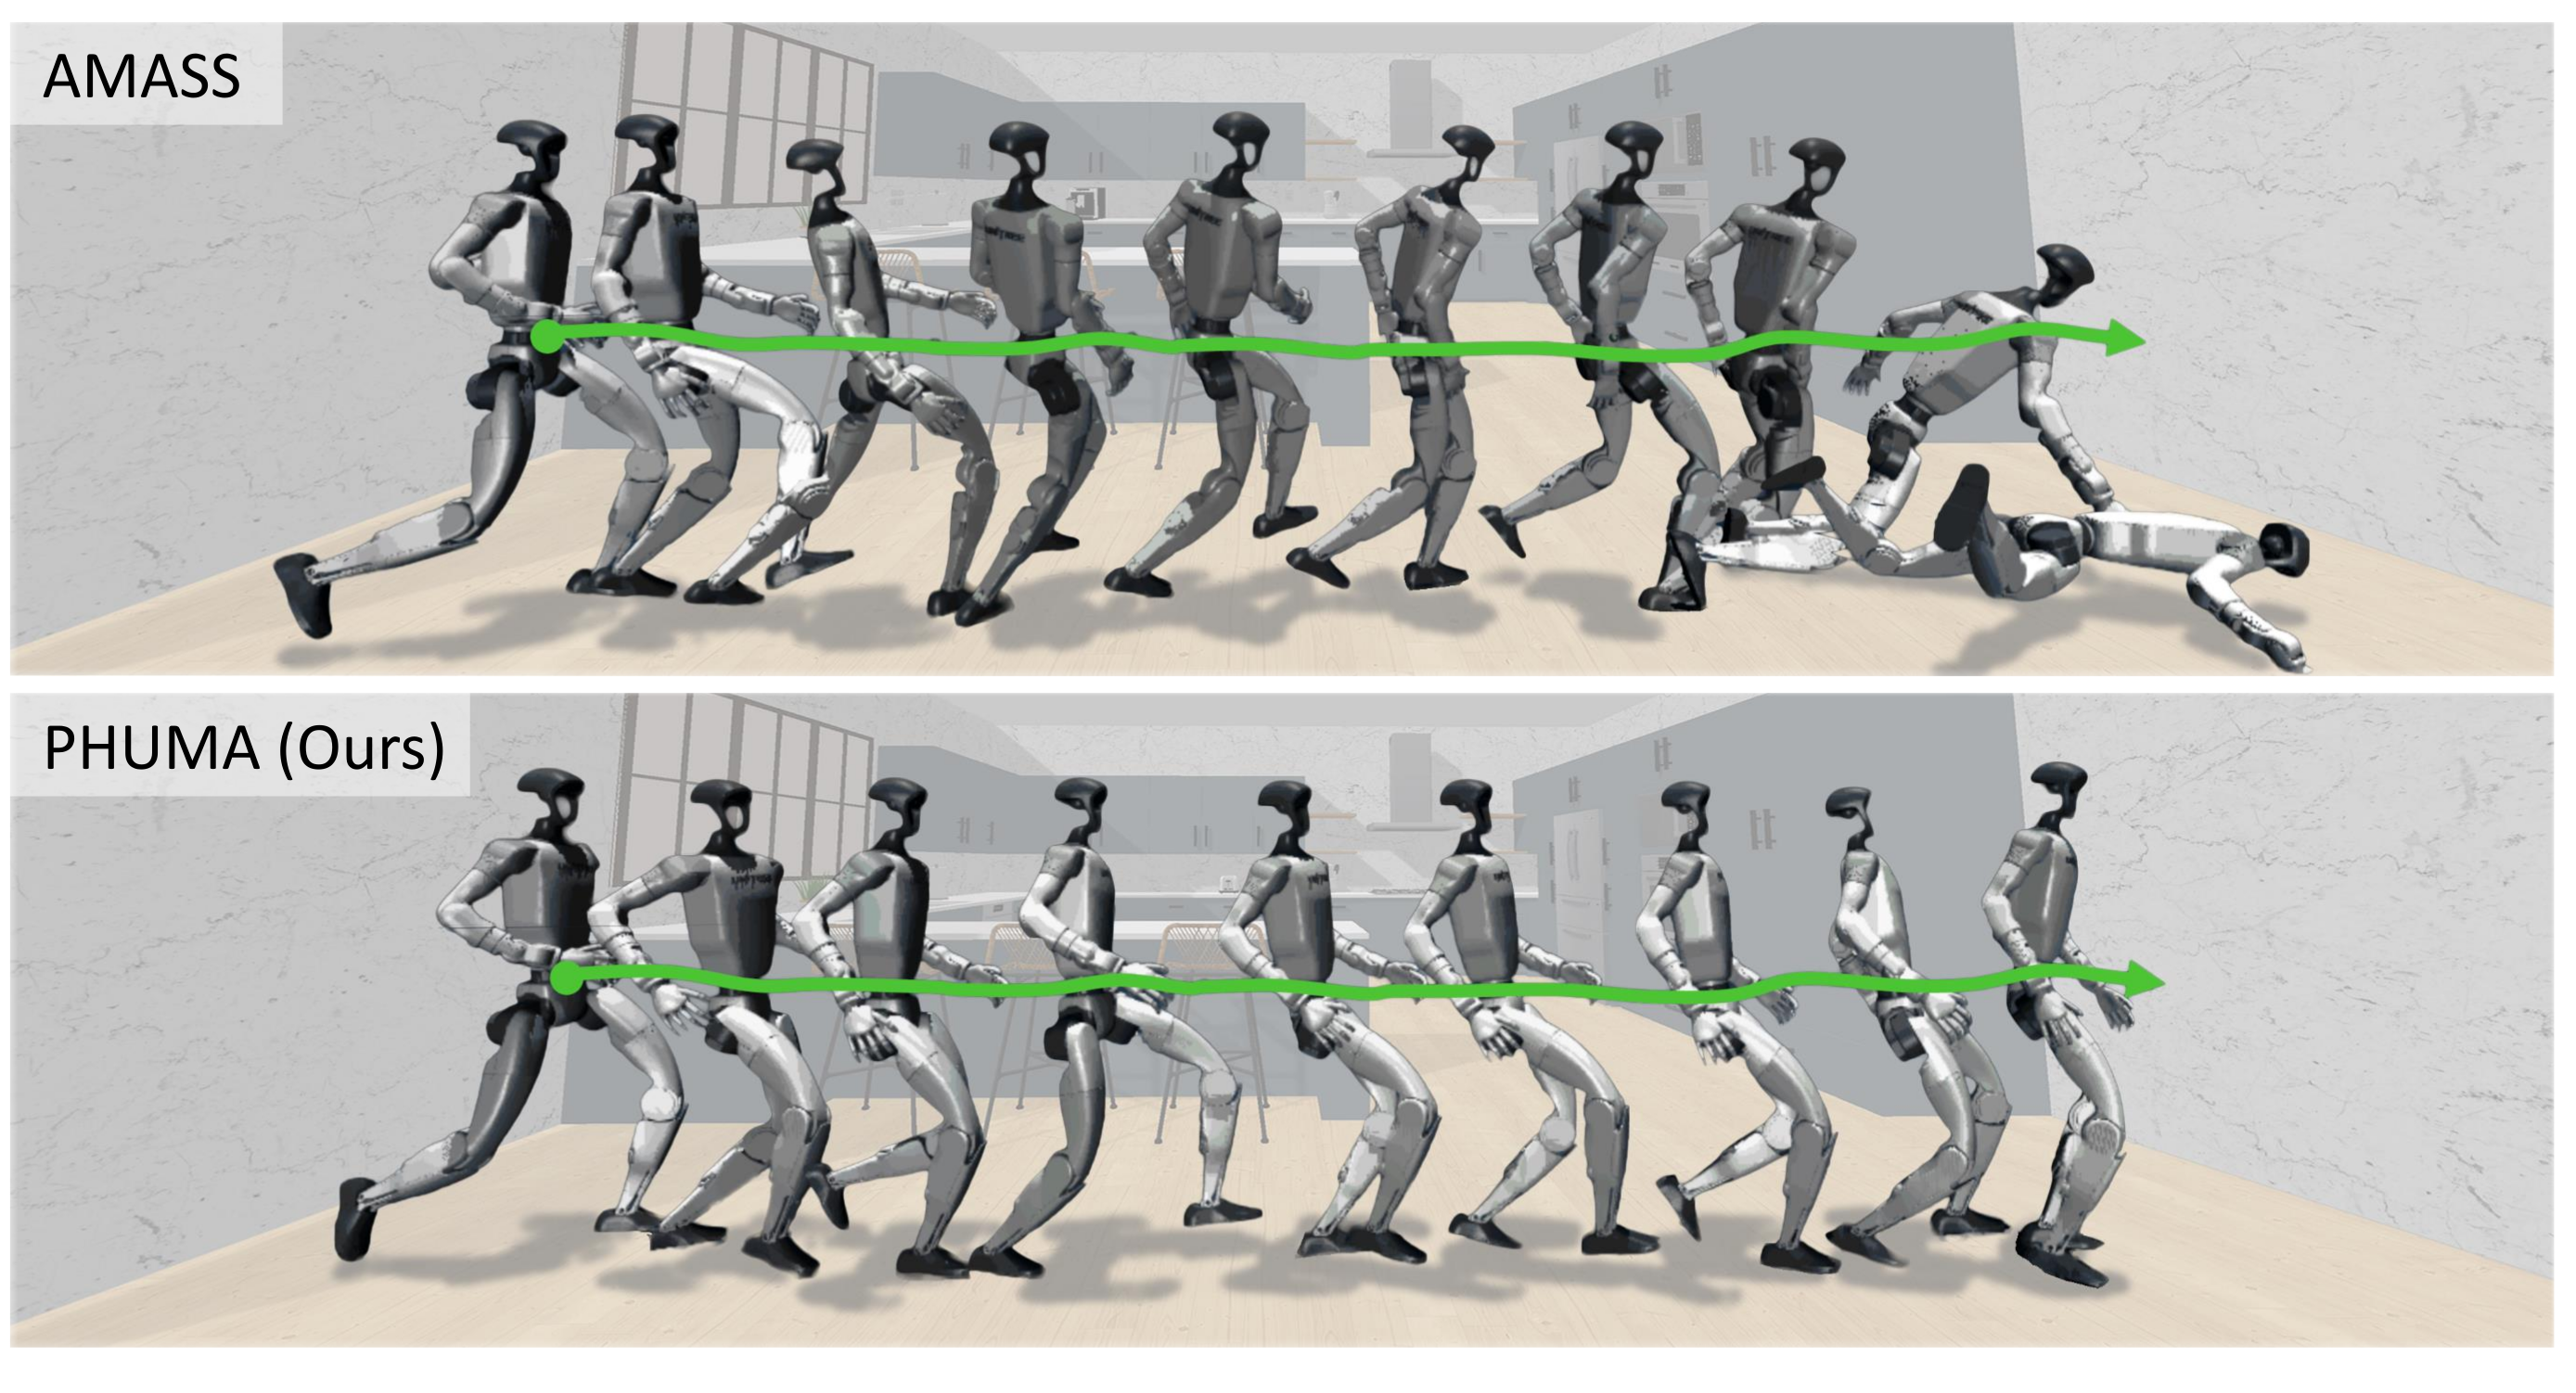
Distill MaskedMimic students whose motion goal is only pelvis position/rotation. PHUMA improves aggregate path-following success on both robots: G1 reaches 84.5%/74.6% versus AMASS 60.5%/54.8%, and H1-2 reaches 73.9%/78.1% versus 60.4%/72.3%. Figure 14 preserves the running example and target path. This reduced goal does not mean the controller lacks proprioception, nor does the example establish arbitrary-path generalization.
| PHUMA Test | Unseen Video | |||||||||
| Dataset | Total | Stationary | Angular | Vertical | Horizontal | Total | Stationary | Angular | Vertical | Horizontal |
| (a) G1 | ||||||||||
| AMASS | 60.5 | 85.6 | 60.1 | 51.4 | 66.5 | 54.8 | 83.6 | 66.5 | 33.0 | 27.5 |
| PHUMA | 84.5 | 94.6 | 86.1 | 83.7 | 90.2 | 74.6 | 98.3 | 83.3 | 54.3 | 57.1 |
| (a) H1-2 | ||||||||||
| AMASS | 60.4 | 84.0 | 62.8 | 43.6 | 78.7 | 72.3 | 96.6 | 77.3 | 52.1 | 72.5 |
| PHUMA | 73.9 | 91.2 | 76.5 | 66.9 | 84.8 | 78.1 | 96.6 | 77.8 | 60.6 | 78.0 |
Appendix G Results on H1-2 Robot
H1-2 results test a second morphology in simulation. The real-world results in the main text remain G1-only.
G.1 PhySINK Ablation on H1-2
SINK alone has only 15.3% joint feasibility on H1-2. PhySINK raises this to 99.9%, with 93.9% fidelity, 97.7% non-floating, 99.7% non-penetration and 87.7% non-skating. The large feasibility change highlights morphology dependence, while remaining artifacts preclude claiming perfect retargeting.
| Motion Fidelity (%) | Joint Feasibility (%) | Non-Floating (%) | Non-Penetration (%) | Non-Skating (%) | |
|---|---|---|---|---|---|
| IK | 36.3 | 80.9 | 57.7 | 45.2 | 56.1 |
| GMR | 58.0 | 71.8 | 6.0 | 100.0 | 62.3 |
| SINK | 93.9 | 15.3 | 42.2 | 81.4 | 47.9 |
| + Joint Feasibility Loss | 94.0 | 99.5 | 44.4 | 79.9 | 50.7 |
| + Grounding Loss | 93.9 | 99.9 | 99.8 | 98.1 | 49.3 |
| + Skating Loss = PhySINK | 93.9 | 99.9 | 97.7 | 99.7 | 87.7 |
G.2 Retargeting Method Comparison on H1-2
AMASS retargeted with PhySINK yields the best aggregate H1-2 success, 64.3%/72.4%. Individual horizontal categories favor GMR on PHUMA Test (65.9% versus 55.9%) and SINK on Unseen Video (63.9% versus 63.1%). The aggregate gain does not establish category-wise dominance.
| PHUMA Test | Unseen Video | |||||||||
|---|---|---|---|---|---|---|---|---|---|---|
| Retarget | Total | Stationary | Angular | Vertical | Horizontal | Total | Stationary | Angular | Vertical | Horizontal |
| IK | 45.3 | 70.9 | 35.7 | 15.2 | 35.0 | 54.2 | 78.0 | 60.7 | 30.1 | 28.6 |
| GMR | 56.6 | 75.7 | 48.1 | 24.8 | 65.9 | 64.3 | 80.2 | 65.5 | 52.1 | 53.8 |
| SINK | 54.4 | 74.9 | 45.9 | 17.2 | 49.6 | 64.3 | 87.3 | 59.7 | 46.0 | 63.9 |
| PhySINK | 64.3 | 83.6 | 57.0 | 27.7 | 55.9 | 72.4 | 99.2 | 66.3 | 57.4 | 63.1 |
G.3 Dataset Effectiveness on H1-2
PHUMA yields 82.7%/78.6% aggregate H1-2 success versus AMASS 54.4%/64.3%. However, Unseen Video horizontal success is 63.8%, below LaFAN1’s 68.2% and slightly below AMASS’s 63.9%. Table 39 therefore qualifies the main text’s claim that PHUMA wins across every category on both humanoids.
| PHUMA Test | Unseen Video | ||||||||||
|---|---|---|---|---|---|---|---|---|---|---|---|
| Dataset | Hours | Total | Stationary | Angular | Vertical | Horizontal | Total | Stationary | Angular | Vertical | Horizontal |
| LaFAN1 | 2.4 | 62.0 | 79.3 | 54.7 | 26.6 | 58.9 | 70.8 | 92.4 | 66.7 | 56.4 | 68.2 |
| AMASS | 20.9 | 54.4 | 74.9 | 45.9 | 17.2 | 49.6 | 64.3 | 87.3 | 59.7 | 46.0 | 63.9 |
| Humanoid-X | 231.4 | 49.7 | 74.6 | 40.4 | 17.0 | 37.3 | 60.5 | 88.3 | 60.0 | 48.7 | 39.7 |
| PHUMA | 73.0 | 82.7 | 91.5 | 79.5 | 68.1 | 68.4 | 78.6 | 97.5 | 76.8 | 74.5 | 63.8 |