At a glance
RELIC adapts video-based manipulation plans using failed physical interactions. It retrieves and refines a latent dynamics embedding, generates candidate futures, and selects a plan unlike previously failed plans. Across eight simulation tasks it lowers reported replanning counts. Across four real tasks, single-replan success rises from 30.0% to 63.8%, conditioned on an initial failure; this is not first-attempt success or an unrestricted deployment success rate.
I Introduction
This edition follows the 20-page arXiv version 3, dated 5 October 2026, titled Video Replanning via Latent Embedding Refinement and Rejection-Based Sampling. Its first-page footnote explicitly identifies the earlier title, Implicit State Estimation via Video Replanning, and the earlier method name ISE. The stable library record is retained; the notes describe the revised RELIC method. All original figures, tables, displayed equations, and references are preserved, with displaced filmstrips reunited with their captions.
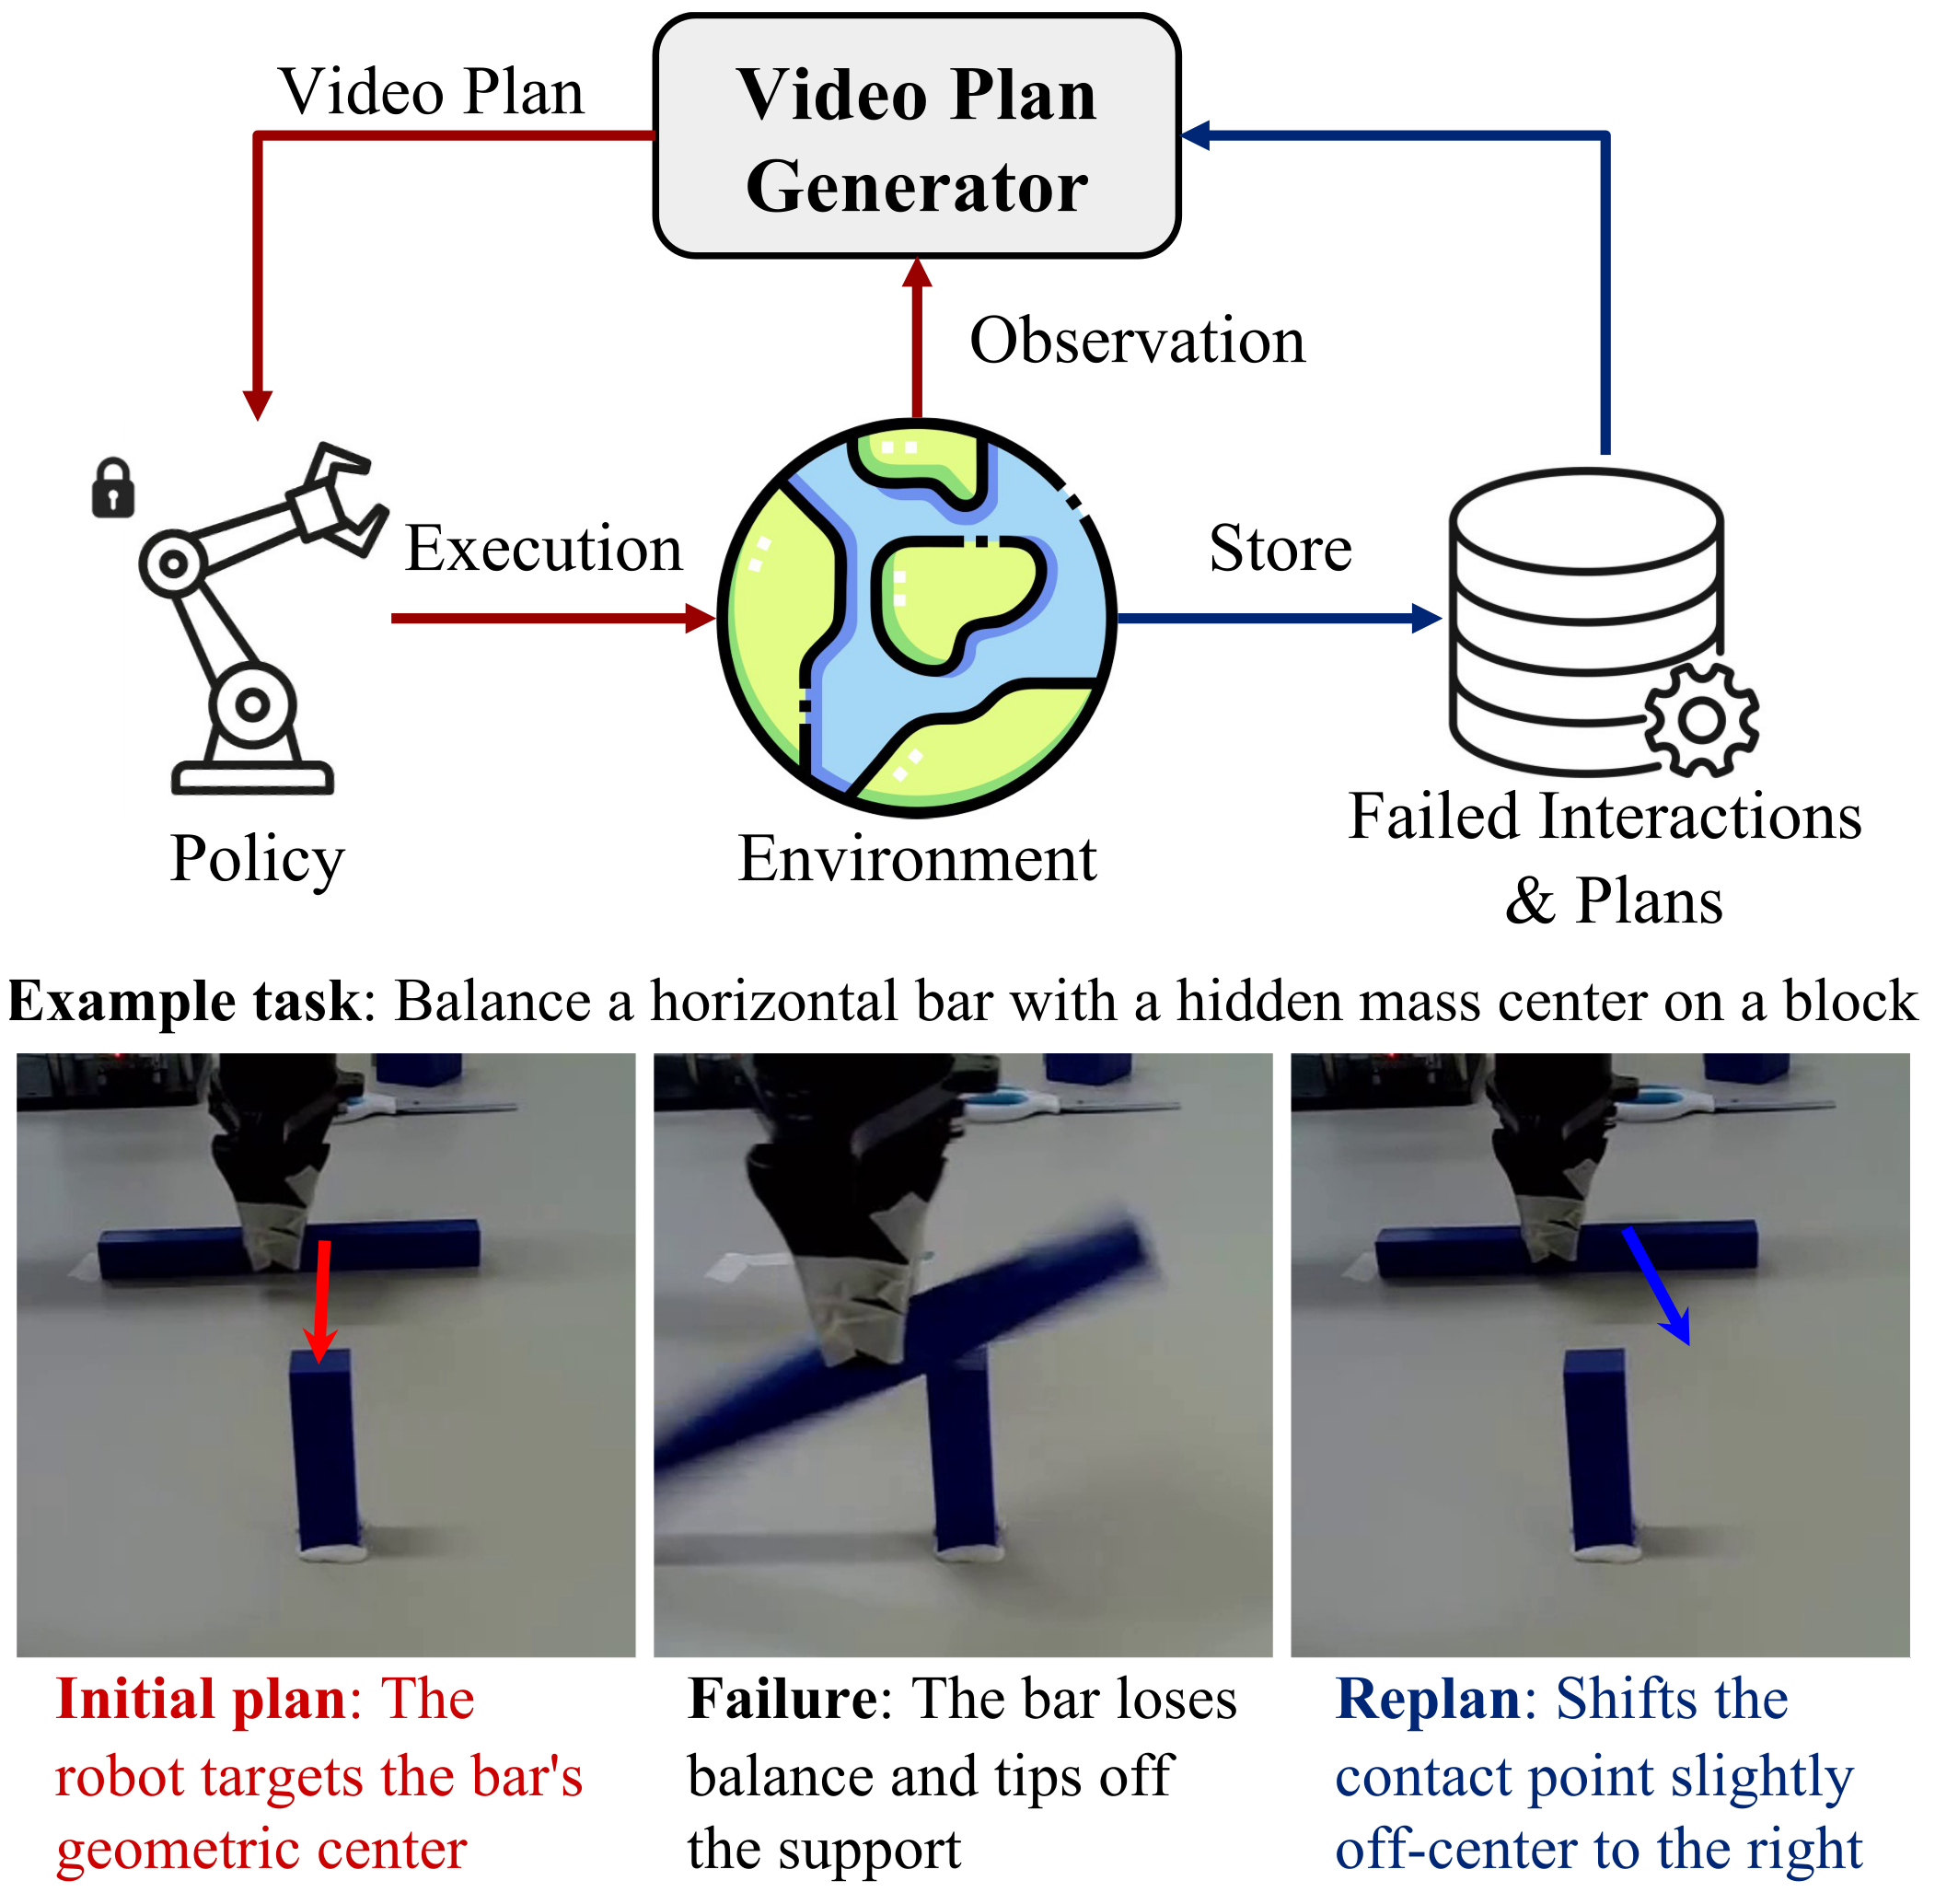
A plan can be executed accurately yet fail because it assumes the wrong friction, mass distribution, or opening direction. The failed interaction supplies evidence that the original observation lacks. RELIC extends executable video planning such as AVDC by updating the latent hypothesis used to generate the next plan, then avoiding candidates resembling previous failures. It uses interaction evidence without assigning named physical-parameter labels to its learned representation.
II Related Work
Related work connects executable video prediction, system identification, and adaptation through latent context.
Video planning
Video planners predict frames, correspondences, or point tracks for a downstream controller. RELIC retains that separation but conditions generation on a hypothesis revised after unsuccessful execution.
System identification
Classical system identification estimates dynamics from experiments, sometimes selecting informative actions explicitly. RELIC instead infers a latent representation from task attempts. Its history-based rejection complements verifiers such as HAVE; it does not optimize an active information-gathering objective.
Few-shot adaptation and latent context inference
Hidden-parameter MDPs and PEARL represent task variation through latent context. RELIC uses that broad idea to condition a video generator, while optimizing its embedding at test time rather than directly adapting a control policy.
III Approach
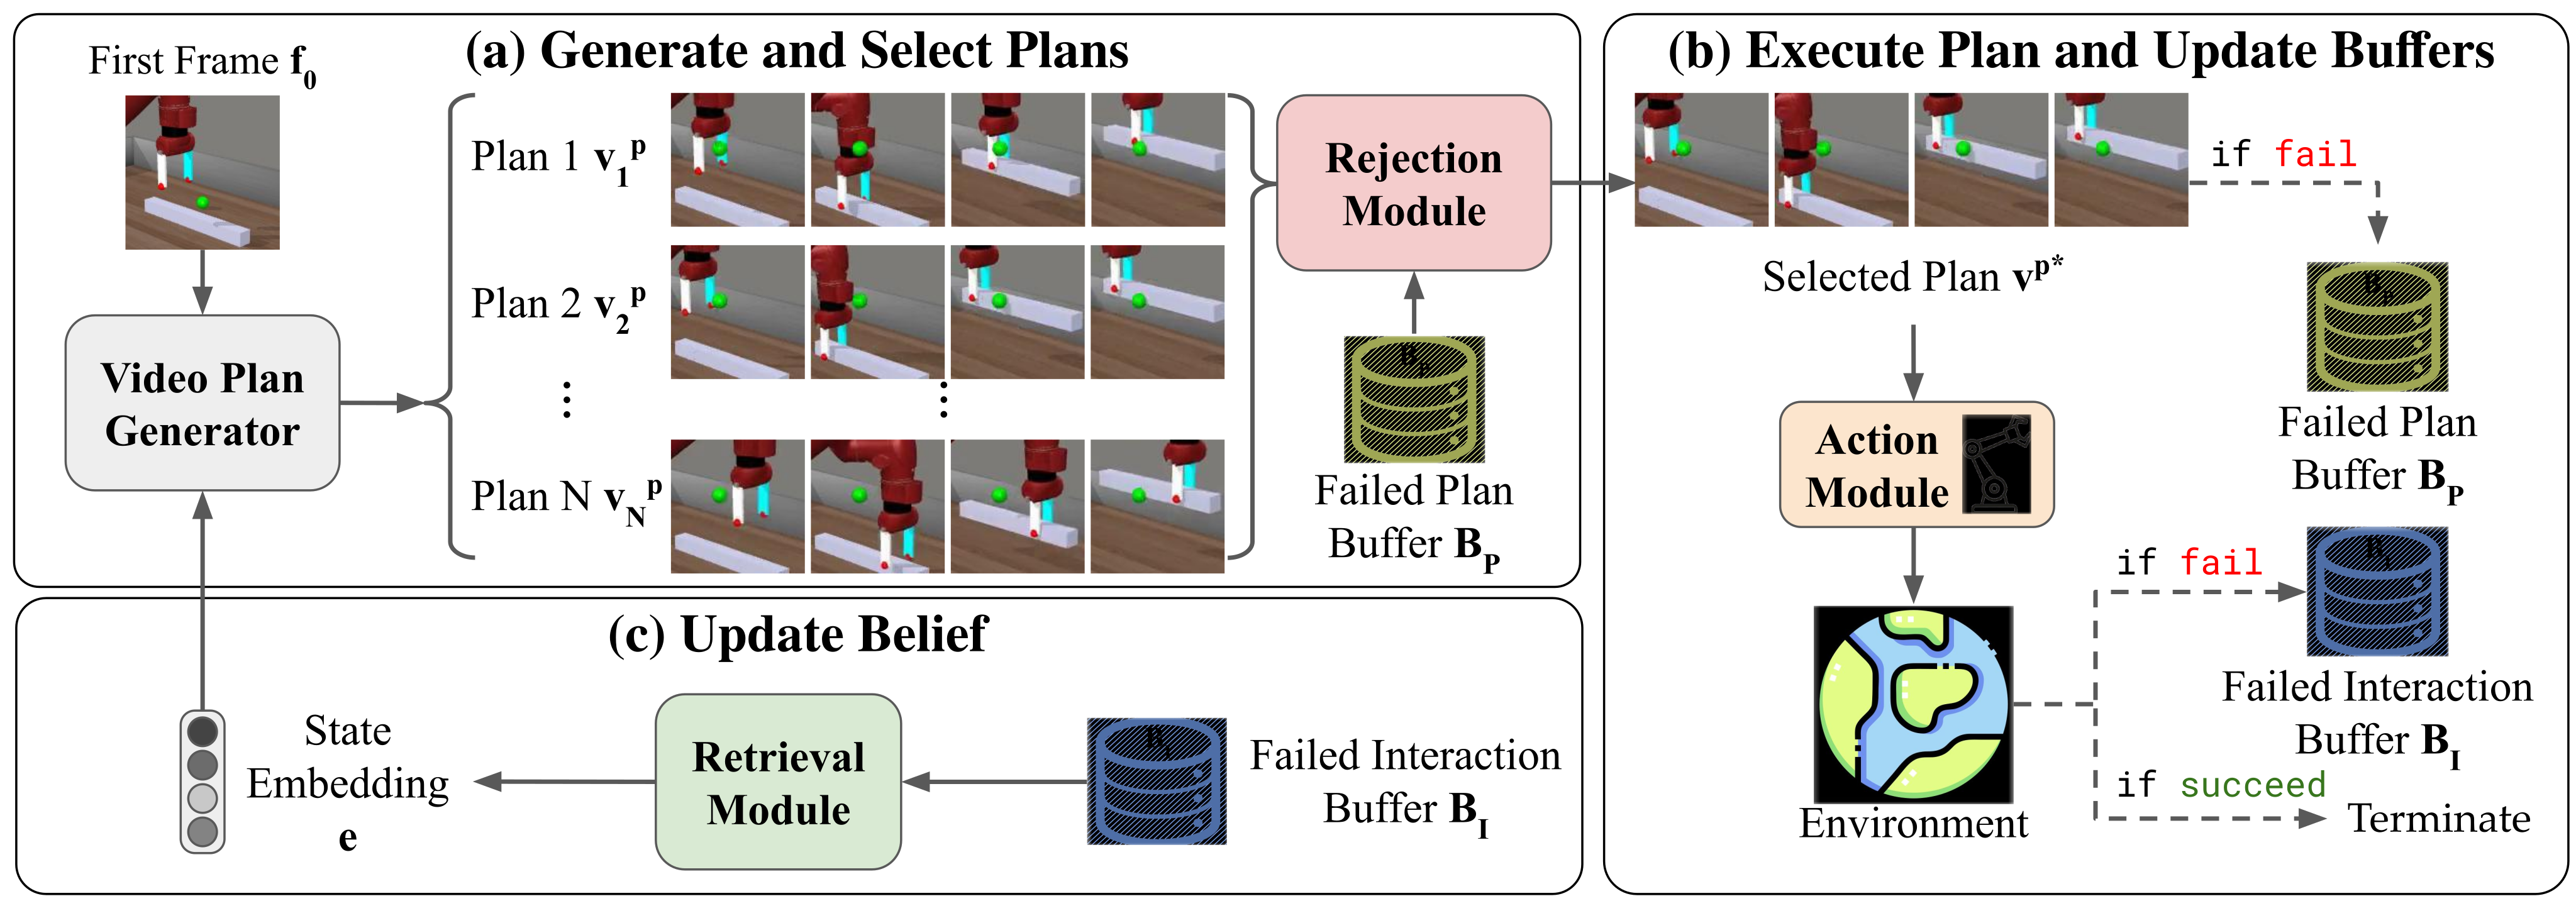
An offline dataset contains interaction videos, configuration IDs grouping trials with shared dynamics, and success flags. Numeric hidden-parameter labels are not input to the learned method, but configuration grouping and outcome supervision are available. A fixed action module executes generated videos. Two separate buffers retain failed physical interactions and the corresponding failed generated plans.
Plans vs. interactions
Generated plans can depict physically impossible successes under a wrong hypothesis. Actual interactions reveal what the environment did. Consequently, interaction videos guide embedding refinement, while failed plan videos identify hypotheses that should not be repeated.
III-A Video-based Planning with State Embeddings
The planner conditions on an embedding obtained from interaction-video features. Retrieval supplies a plausible successful canonical embedding; refinement adapts it to the current observed failure before generating new plans.
State embeddings
Frozen image-encoder features are concatenated across video frames. Each known configuration receives one canonical embedding taken from a successful trial. The generator learns to produce successful futures from the current image and that configuration embedding. Before any interaction, a learned null embedding supplies the initial hypothesis.
Retrieval and refinement
The latest failed interaction retrieves similar recorded interaction features, then returns the associated successful canonical embedding. A shared identification model is trained on successful and failed outcomes. With model weights frozen, 100 Adam steps at learning rate 0.001 optimize the embedding to denoise the observed interaction. The loss compares the clean prediction from a noisy observed video with that observation; it does not compare an independently sampled rollout with the observation.
Video plan generation
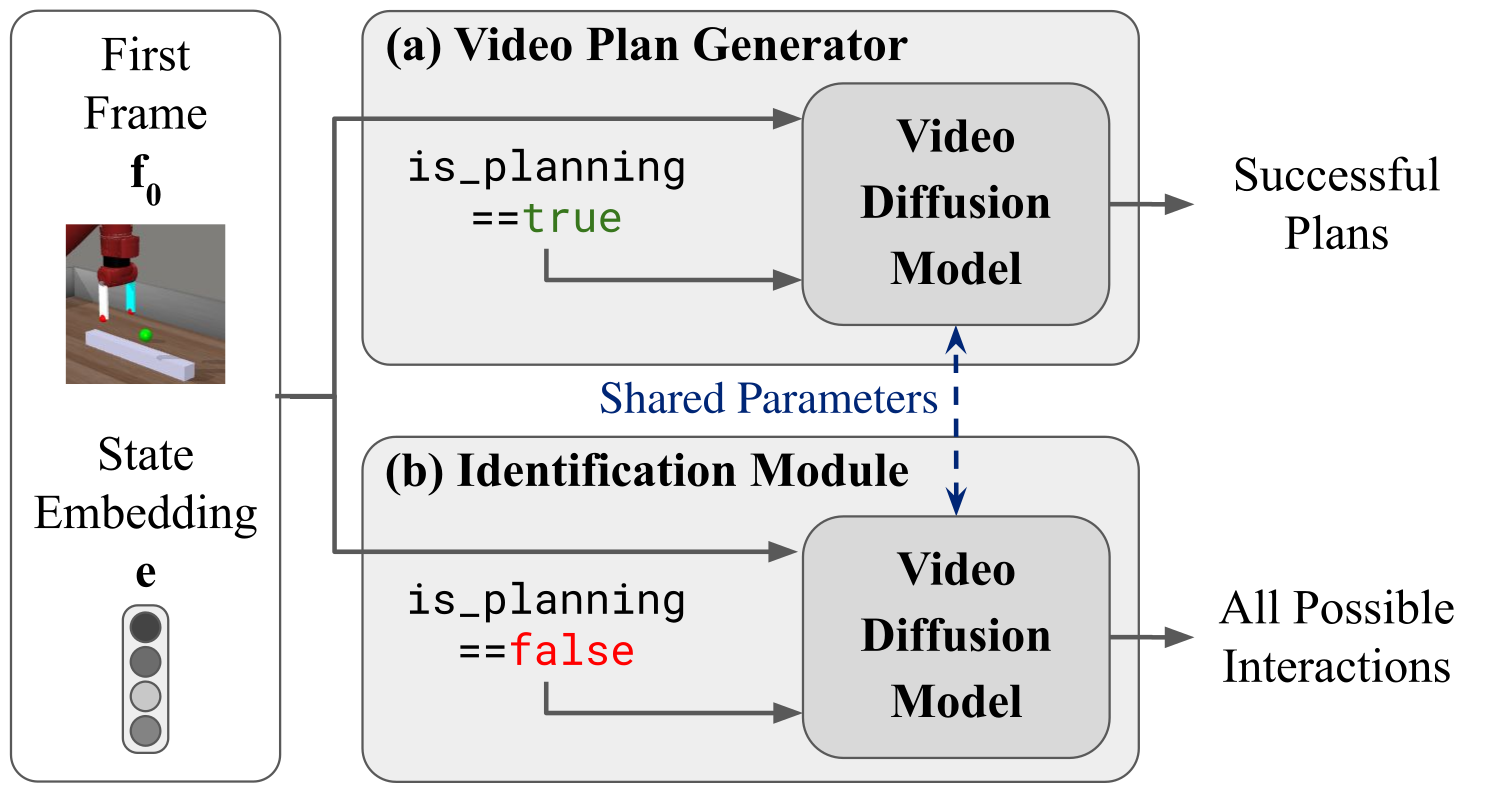
An AVDC-style diffusion model generates an eight-frame plan conditioned on the current image, language, and state embedding. The planner and identification model share parameters and switch roles through an is_planning flag: planning uses successful outcomes, whereas identification learns all interaction outcomes.
| Meta-World | ManiSkill3 | ||||||||
| Method | PushBar | PickBar | SlideBrick | OpenBox | TurnFaucet | Seesaw | Bounce | Strike | Overall (all 8, norm.) |
| CQL | 0.20 | 0.19 | 0.18 | 0.18 | 0.21 | 0.18 | 0.68 | 0.37 | 0.08 |
| BC | 0.30 | 0.32 | 0.33 | 0.19 | 0.27 | 0.09 | 0.71 | 0.20 | 0.06 |
| AVDC | 0.27 | 0.22 | 0.27 | 0.16 | 0.16 | 0.47 | 0.48 | 0.76 | 0.06 |
| VLM verifier | 0.40 | 0.38 | 0.45 | 0.36 | 0.16 | 0.48 | 0.43 | 0.41 | 0.06 |
| RELIC (Refine FS) | 0.23 | 0.21 | 0.26 | 0.16 | 0.15 | 0.37 | 0.38 | 0.26 | 0.04 |
| RELIC (Ours) | 0.20 | 0.18 | 0.26 | 0.10 | 0.14 | 0.37 | 0.40 | 0.29 | 1.00 |
III-B Rejection-based Sampling
The method samples and refines multiple embedding hypotheses, generates their plans, and chooses the candidate whose closest previously failed plan is farthest away in raw-pixel L2 distance. This max–min selection encourages departure from past mistakes. It is not a literal probability-calibrated rejection threshold or a guarantee of physical correctness. Two candidates are the default.
Equation
III-C Action Module
The fixed AVDC action module tracks dense object correspondences, or the wrist when object motion leaves grasp location ambiguous, and converts tracks into robot actions with a handcrafted controller. No action labels are required for the video model, but success still depends on this execution module.
IV Experiments
Evaluation separates replanning efficiency, video prediction, latent-state evidence, component ablations, and a small real-robot study. The retained tables include both mean results and reported uncertainty.
IV-A Experimental Setup
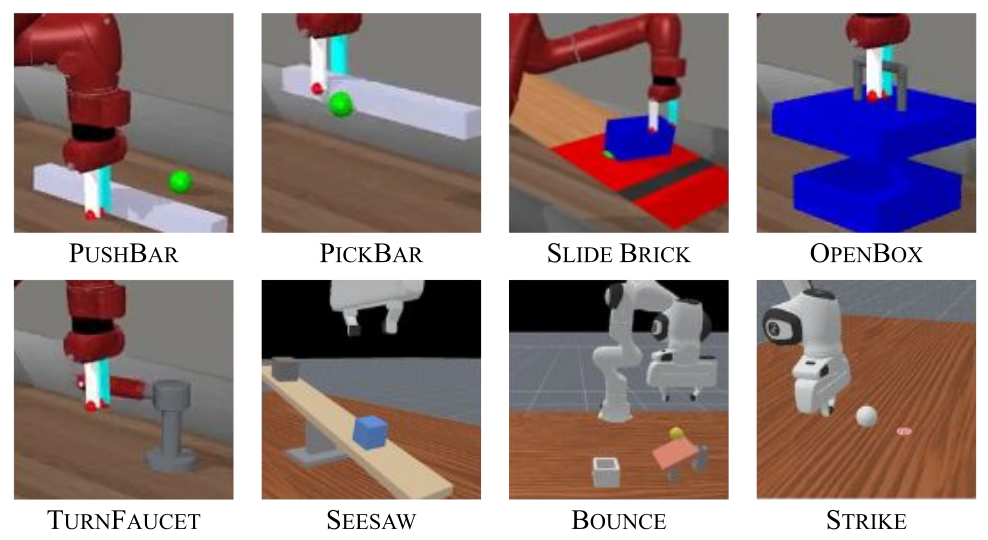
Five Meta-World tasks vary center of mass, friction, or opening/rotation mode; three ManiSkill3 tasks vary mass, elasticity, or friction. Training uses discrete physical parameters; continuous test values lie within the same intervals. Each task has 400 trials and at most 14 replans. Main counts are described as replans per successful attempt, with cap handling not fully specified; they should not imply universal success. The offline suites contain 14,270/18,750 trials and 670/750 successes. Test-time features occupy at most 346 MB per task. BC and CQL additionally use action labels. The VLM baseline changes both embedding conditioning and plan selection, so it is not an isolated replacement of the distance metric.
| Suite | Tasks | Videos | Successful |
|---|---|---|---|
| Meta-World | 5 | 14,270 | 670 |
| ManiSkill3 | 3 | 18,750 | 750 |
| Method | PSNR | LPIPS | CLIP | DINO |
|---|---|---|---|---|
| AVDC | 19.426 | 0.271 | 0.870 | 0.705 |
| RELIC (R3M) | 19.632 | 0.261 | 0.875 | 0.705 |
| RELIC (CLIP) | 19.584 | 0.262 | 0.871 | 0.707 |
| RELIC (DINOv2, Ours) | 19.817 | 0.255 | 0.882 | 0.717 |
IV-B Main Results
RELIC has the lowest mean replanning count among the main baselines on all eight tasks: 4.26, 3.84, 6.69, 1.25, 1.39, 4.88, 5.12, and 2.72, versus AVDC’s 6.83, 4.41, 7.36, 1.82, 1.67, 5.62, 5.80, and 4.13. Overall scores average per-task count ratios, rather than pooling trials; their delta-method uncertainty assumes independent method estimates. DINO-conditioned videos also improve PSNR/LPIPS from 19.426/0.271 to 19.817/0.255. Latent-policy comparisons have different action/reward supervision and should be interpreted with those differences.
| Latent-conditioned policy | Latent in RELIC pipeline | ||||
|---|---|---|---|---|---|
| Task | HiP-MDP | PEARL | HiP-MDP | PEARL | RELIC |
| PushBar | 0.24 | 0.23 | 0.24 | 0.21 | 0.20 |
| PickBar | 0.23 | 0.24 | 0.23 | 0.21 | 0.18 |
| SlideBrick | 0.22 | 0.13 | 0.23 | 0.23 | 0.26 |
| OpenBox | 0.15 | 0.14 | 0.13 | 0.04 | 0.10 |
| TurnFaucet | 0.14 | 0.09 | 0.14 | 0.05 | 0.14 |
| Overall | 0.26 | 0.18 | 0.26 | 0.04 | 1.00 |
IV-C What Does the State Embedding Capture?
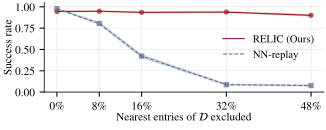
Five-fold probes grouped by configuration ID recover continuous parameters from frozen video embeddings with R² of 0.77–0.84, while first-frame controls are below zero. Binary accuracies are 100%/92.5%, versus 65%/55% for first frames, on only 40 samples. This supports the value of interaction information without proving causal disentanglement in every setting. An oracle parameter-conditioned planner succeeds on 88–100% of first attempts with the same controller. Removing up to 48% of nearby configurations from the inference retrieval bank barely changes PushBar success, while nearest-neighbor replay collapses; its caption specifies a 16-attempt cap, unlike the main 14-replan protocol. This is an inference-bank stress test, not retraining on a new physical mechanism.
| Task | Hidden | Metric | Post | Pre |
|---|---|---|---|---|
| PushBar | center of mass | 0.77 | ||
| PickBar | center of mass | 0.82 | ||
| SlideBrick | friction | 0.84 | ||
| OpenBox | push vs. pull | acc. (%) | 100 | 65 |
| TurnFaucet | CW vs. CCW | acc. (%) | 92.5 | 55 |
IV-D Ablation Studies
Ablations test retrieval initialization, rejection, distance metrics, and candidate count. The evidence supports their combined practical contribution within the tested suites.
Retrieval initialization reduces replans
Refinement from a random prior is competitive, but retrieval plus refinement performs better across all eight tasks. The main text describes a fitted multivariate Gaussian over canonical embeddings, while Appendix D describes unit-variance Gaussian initialization; that discrepancy is retained. A no-retrieval test still relies on an offline-trained model and prior.
Removing either module costs replans
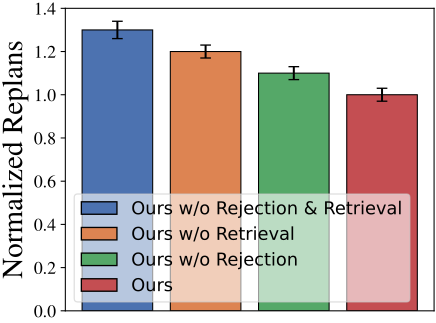
Removing either retrieval or rejection raises normalized replanning counts. Their roles differ: retrieval proposes dynamics-compatible embeddings, and rejection discourages returning to previously unsuccessful plans.
Distance choice matters little
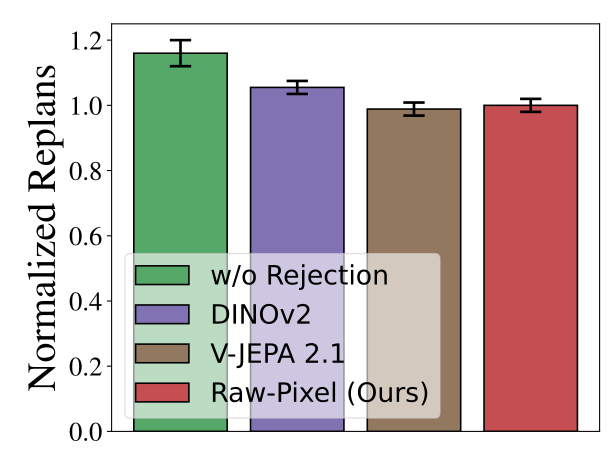
Raw pixels, DINOv2, and V-JEPA 2.1 distances all improve over no rejection, with comparable error bars. More elaborate features do not show a clear advantage in these relatively controlled visual settings.
Two candidates capture most of the gain
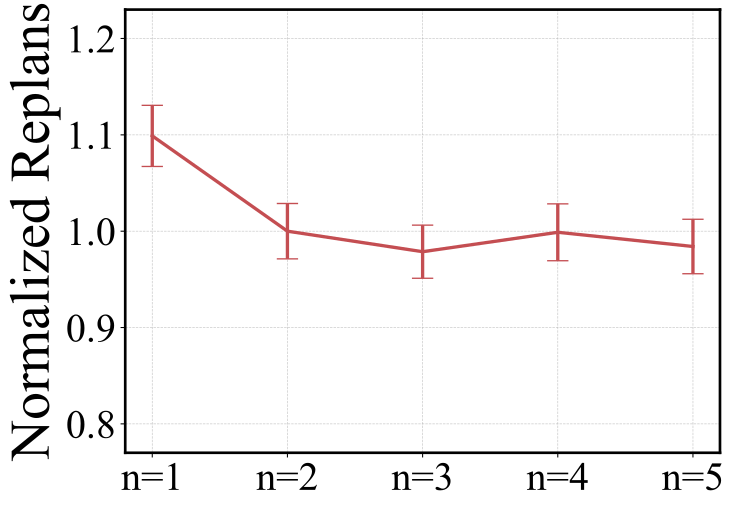
Increasing candidates from one to two reduces replans by roughly 10% across the five Meta-World tasks; additional candidates provide little further gain. This motivates the two-candidate default rather than establishing a universal optimal sample count.
Why does raw-pixel rejection suffice?
The authors interpret the small candidate and metric sensitivity as elimination of repeated wrong hypotheses. Similarity to failure is a useful heuristic here, but it neither measures information gain nor proves that the selected alternative is feasible.
IV-E Real-world Evaluation
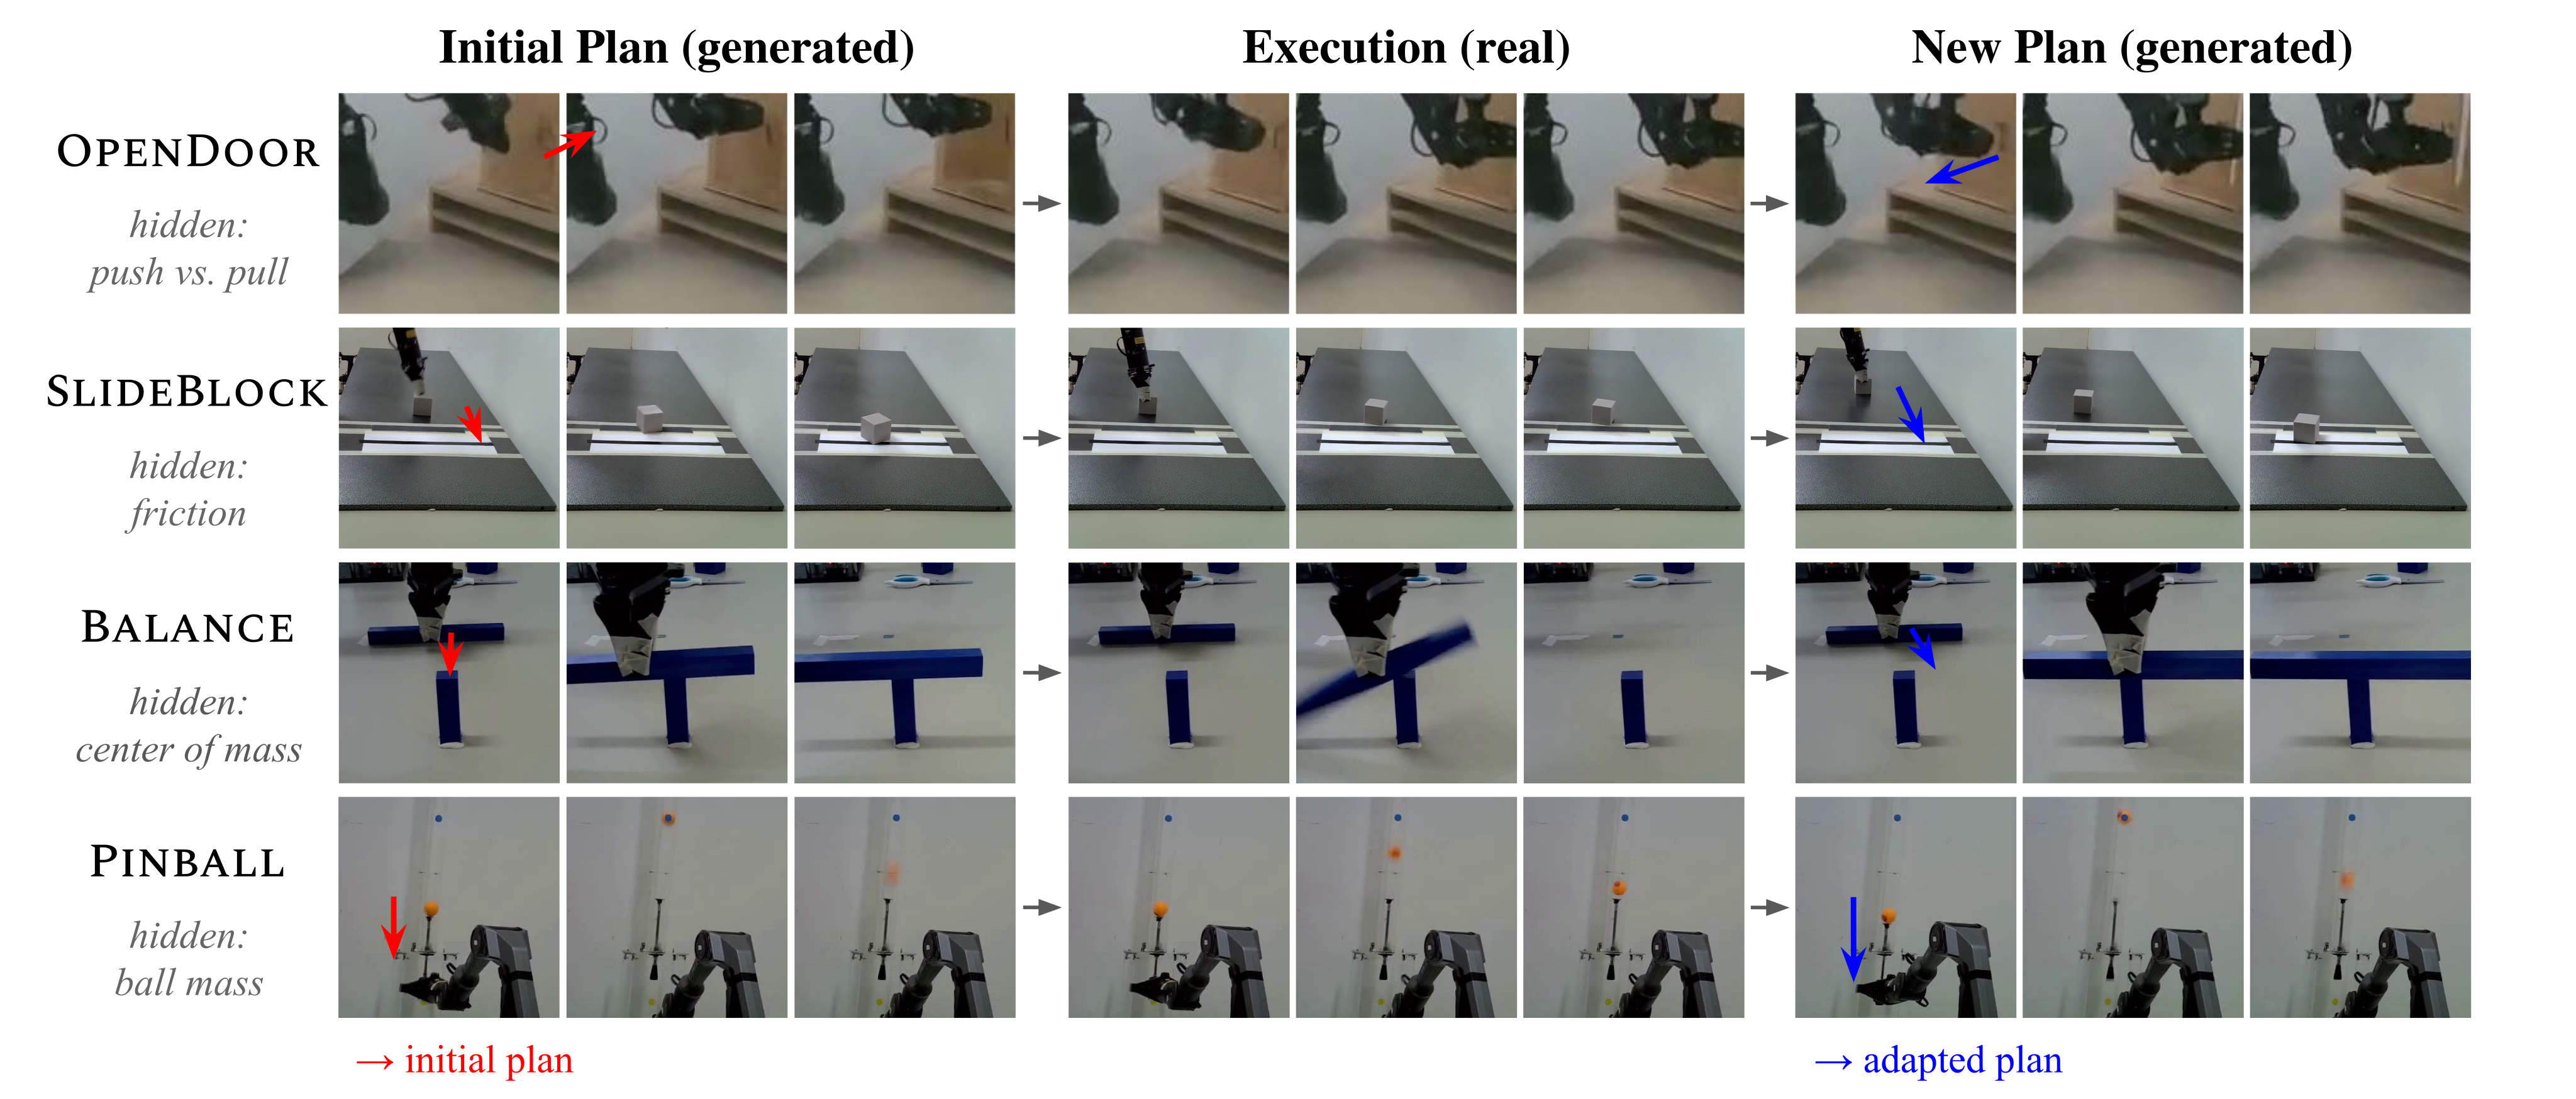
Twenty postfailure trials per real task compare AVDC with RELIC after one physical interaction. Successes change from 8 to 14 for OpenDoor, 4 to 7 for SlideBlock, 7 to 17 for Balance, and 5 to 13 for Pinball: 24/80 versus 51/80. Thus 63.8% is conditional one-replan success. Initial-failure frequency and uncertainty intervals are not reported, and the small task-specific samples limit precision.
| Method | OpenDoor | SlideBlock | Balance | Pinball | Overall |
|---|---|---|---|---|---|
| AVDC | 8/20 | 4/20 | 7/20 | 5/20 | 30.0% |
| RELIC (Ours) | 14/20 | 7/20 | 17/20 | 13/20 | 63.8% |
V Limitations
The action module is assumed reliable and is not adapted; even oracle dynamics leave up to 12% failure on some tasks. Refinement is substantially slower than plain video generation. The method depends on visually informative interaction, prior experience coverage, and a fixed representation, and does not actively choose diagnostic probes. Properties invisible in video or requiring tactile evidence remain outside the demonstrated capability.
VI Conclusion
The experiments support using failed interactions to refine video-planning hypotheses and reduce repeated mistakes. They do not establish unrestricted dynamics identification, safe autonomous exploration, or general real-world reliability.
Acknowledgment
The authors acknowledge Taiwan research and industrial funding, institutional support, and computing resources. These acknowledgments are separate from the experimental evidence.
Appendix A Supplementary materials
Supplementary material supplies source links, benchmark definitions, hardware, implementation details, and additional analyses.
A-A Website and Code
The original paper links its project website and the RELIC-video/relic code repository. This edition retains those links; externally hosted demonstration videos are not represented as having been downloaded or independently reviewed.
Appendix B Benchmark Details of the Meta-World Suite
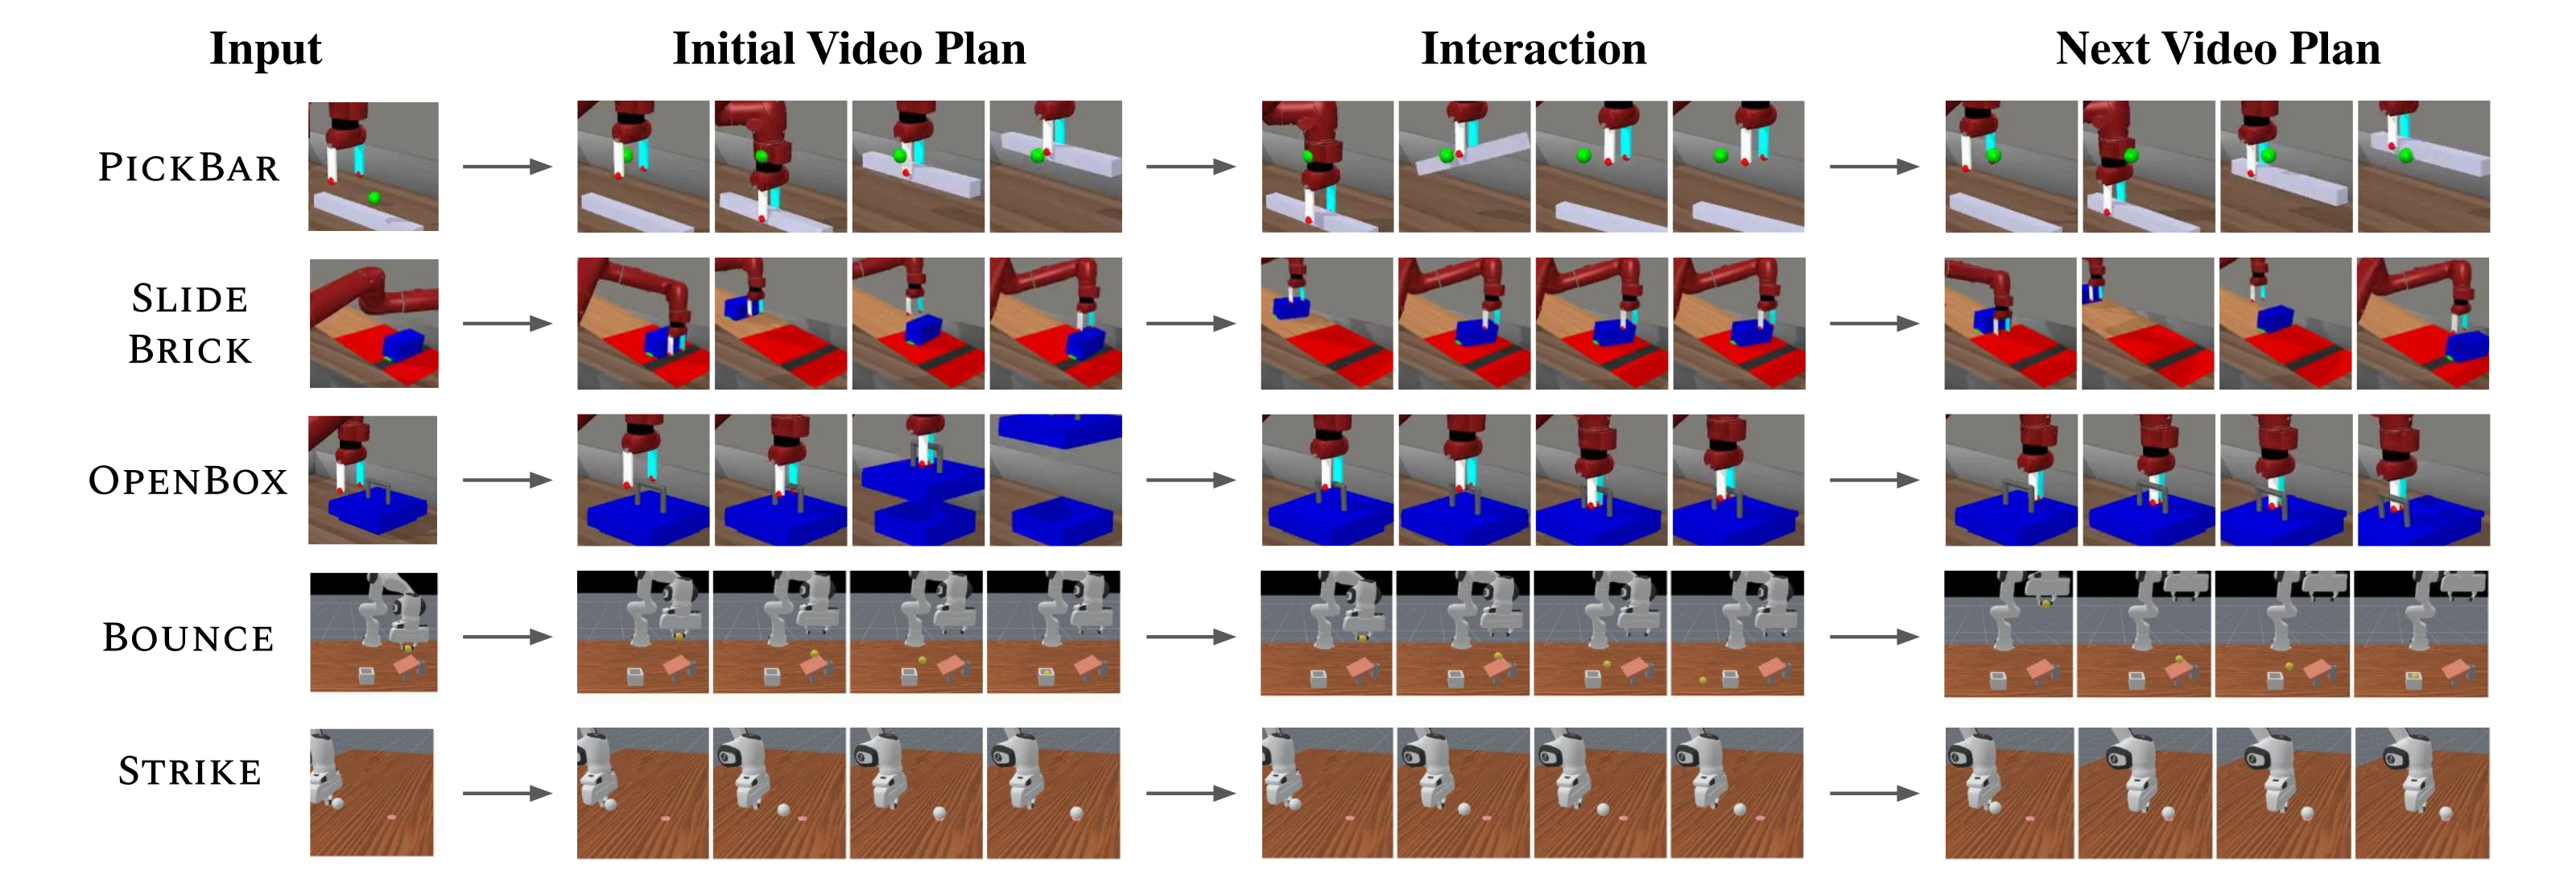
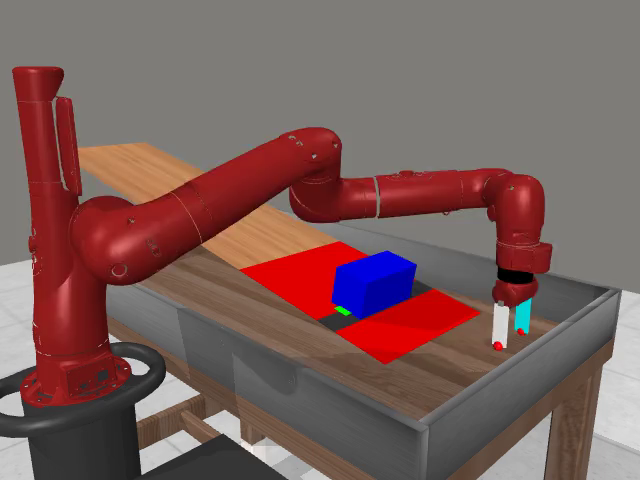
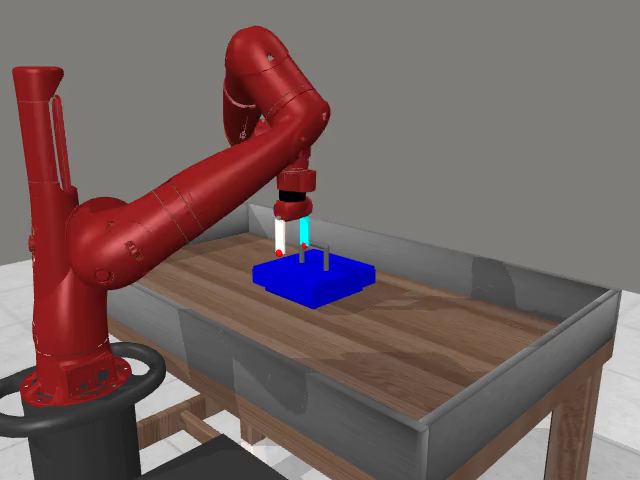
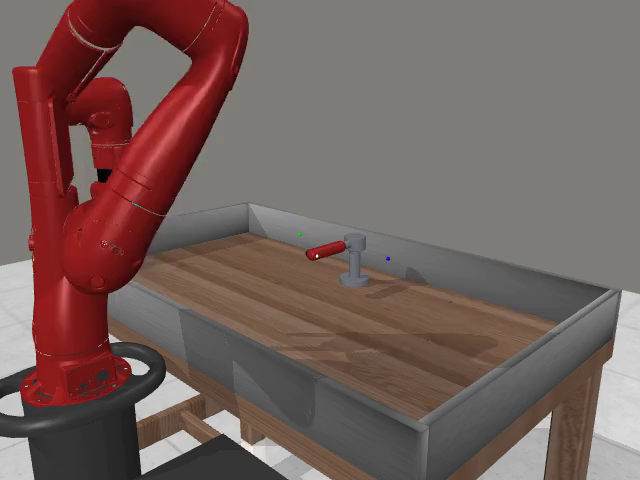
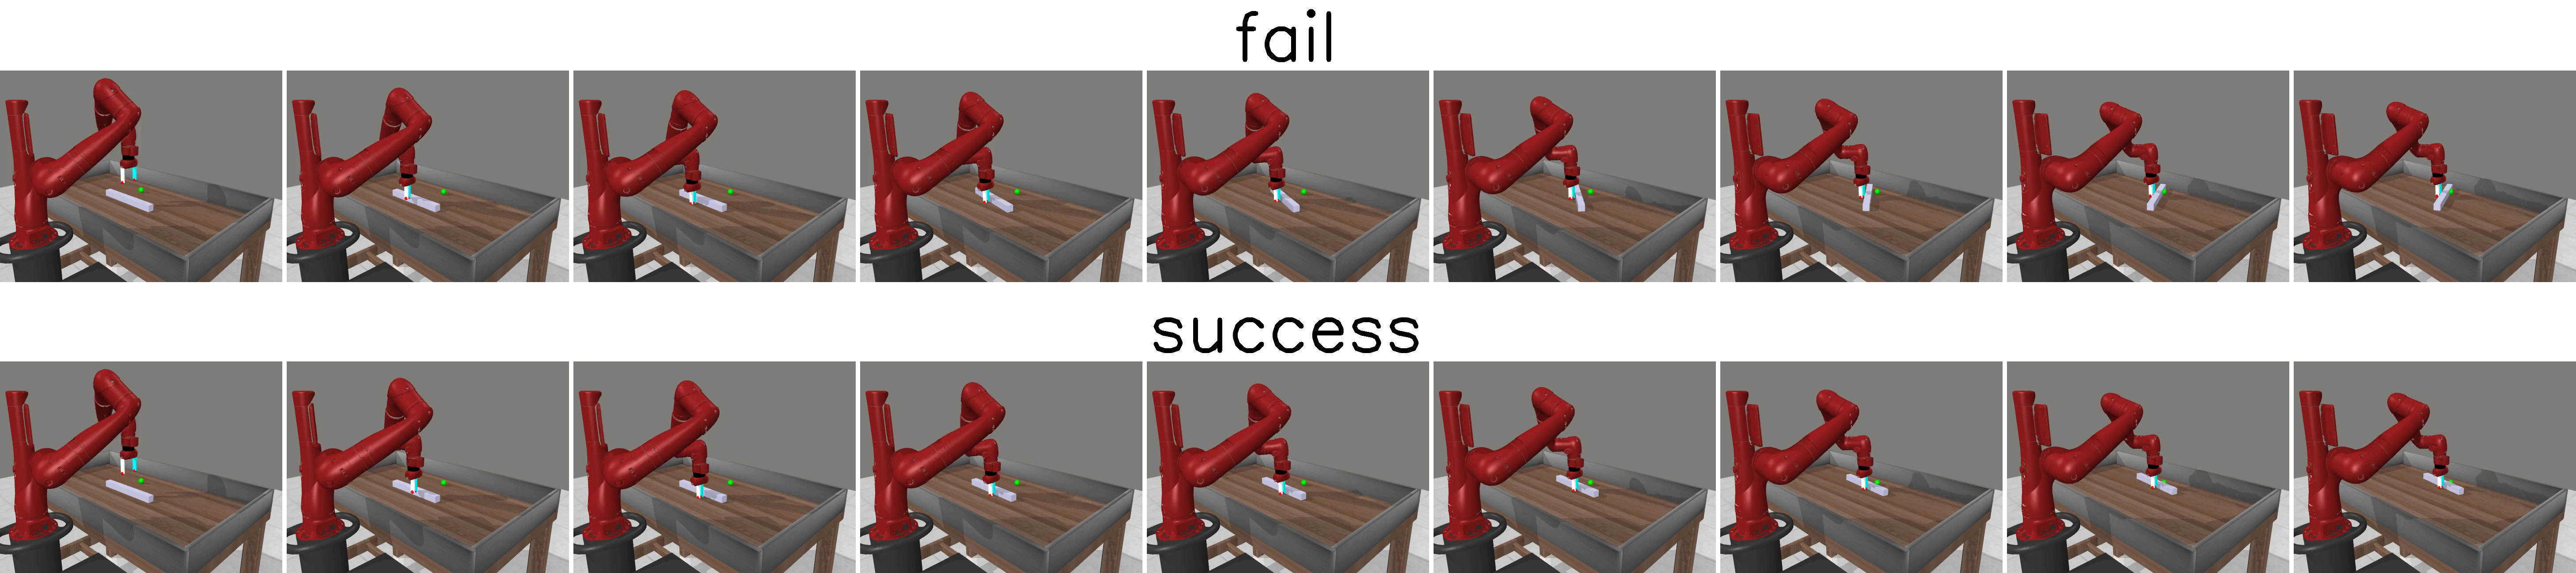
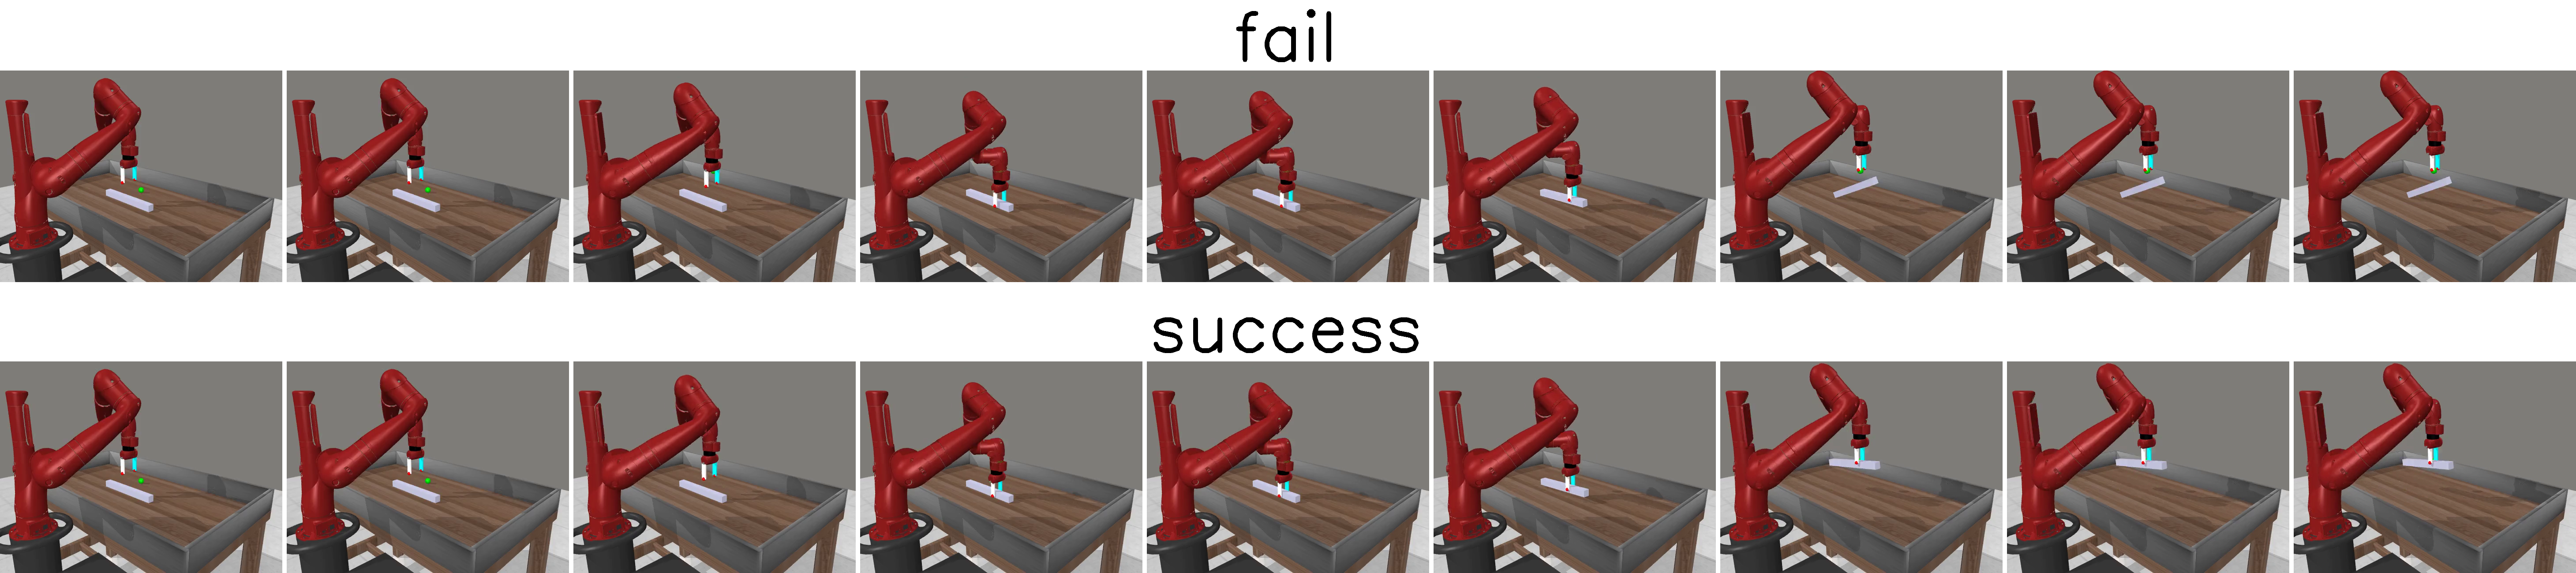
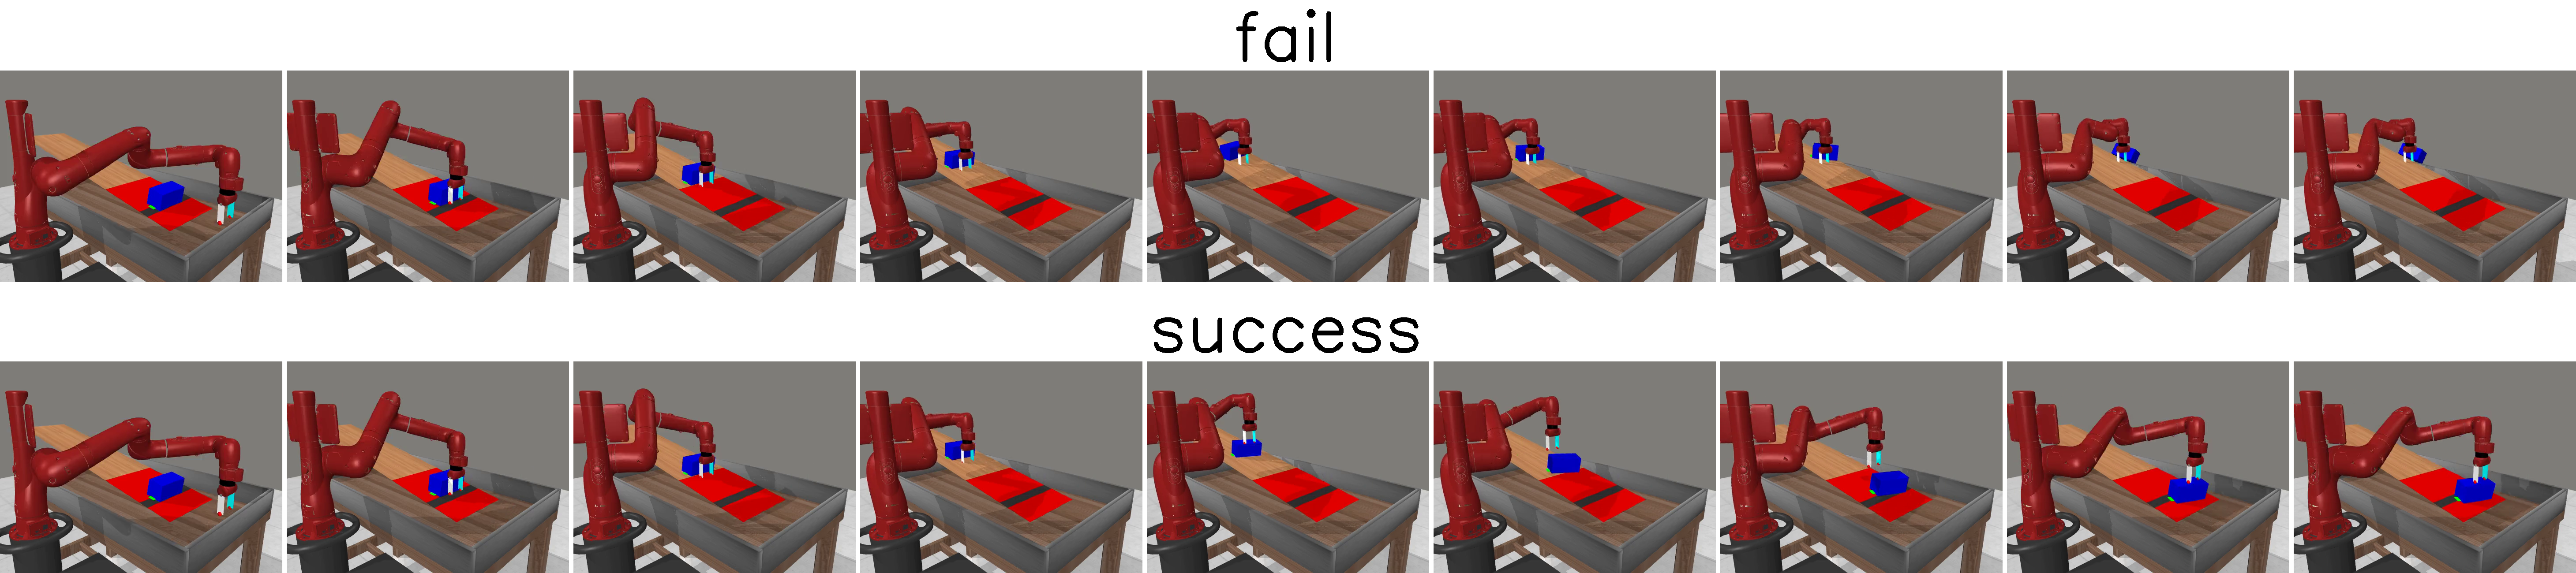
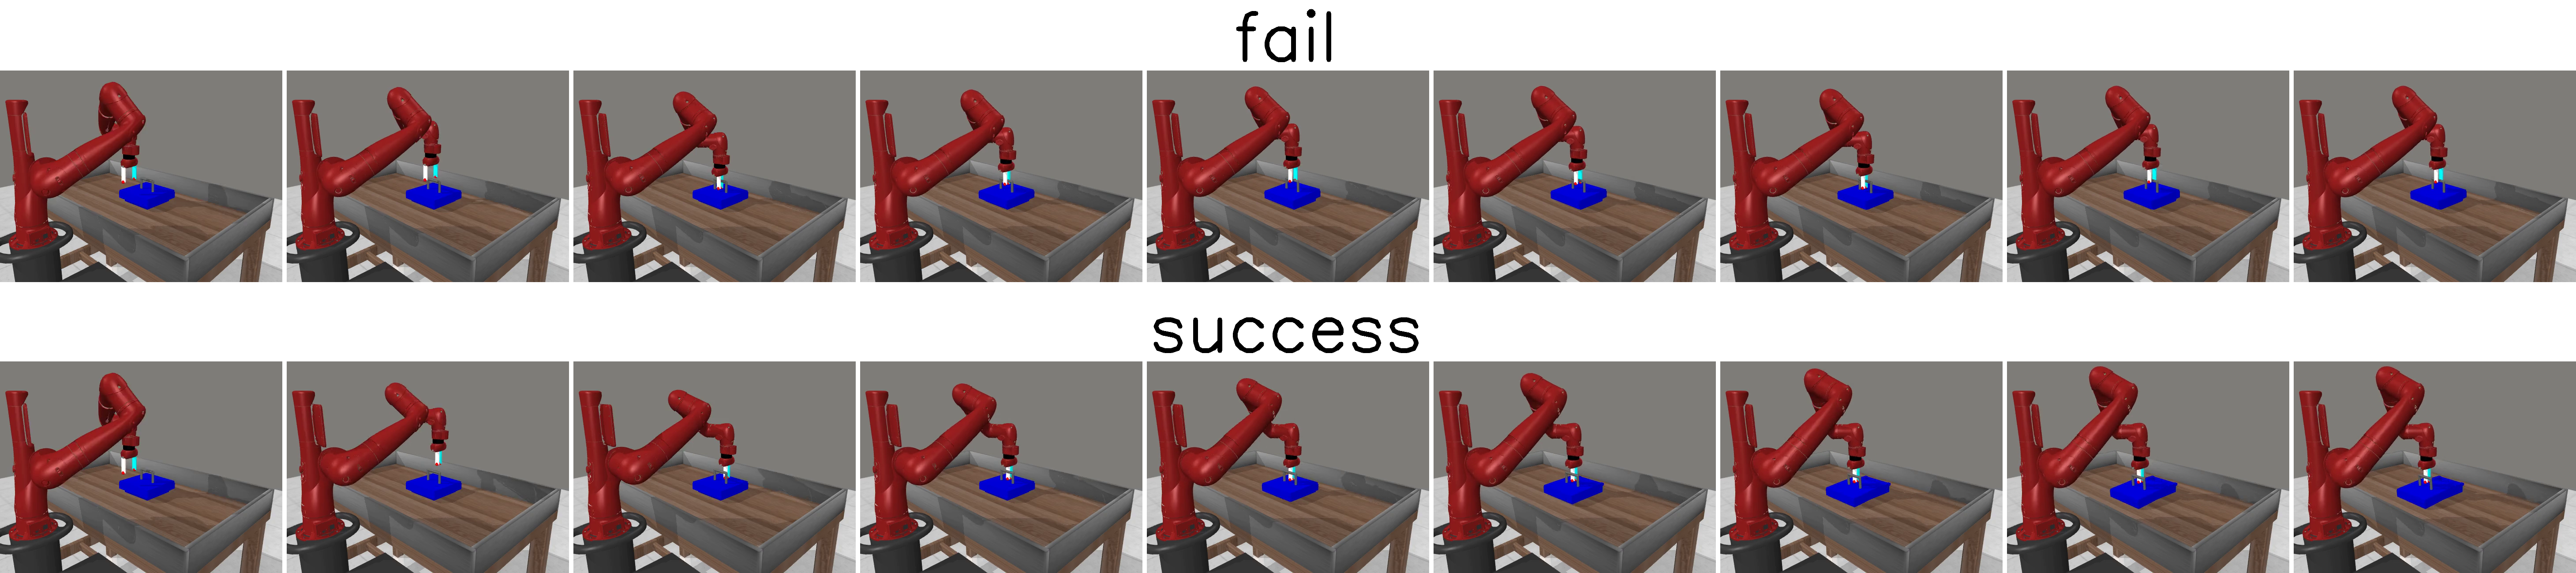
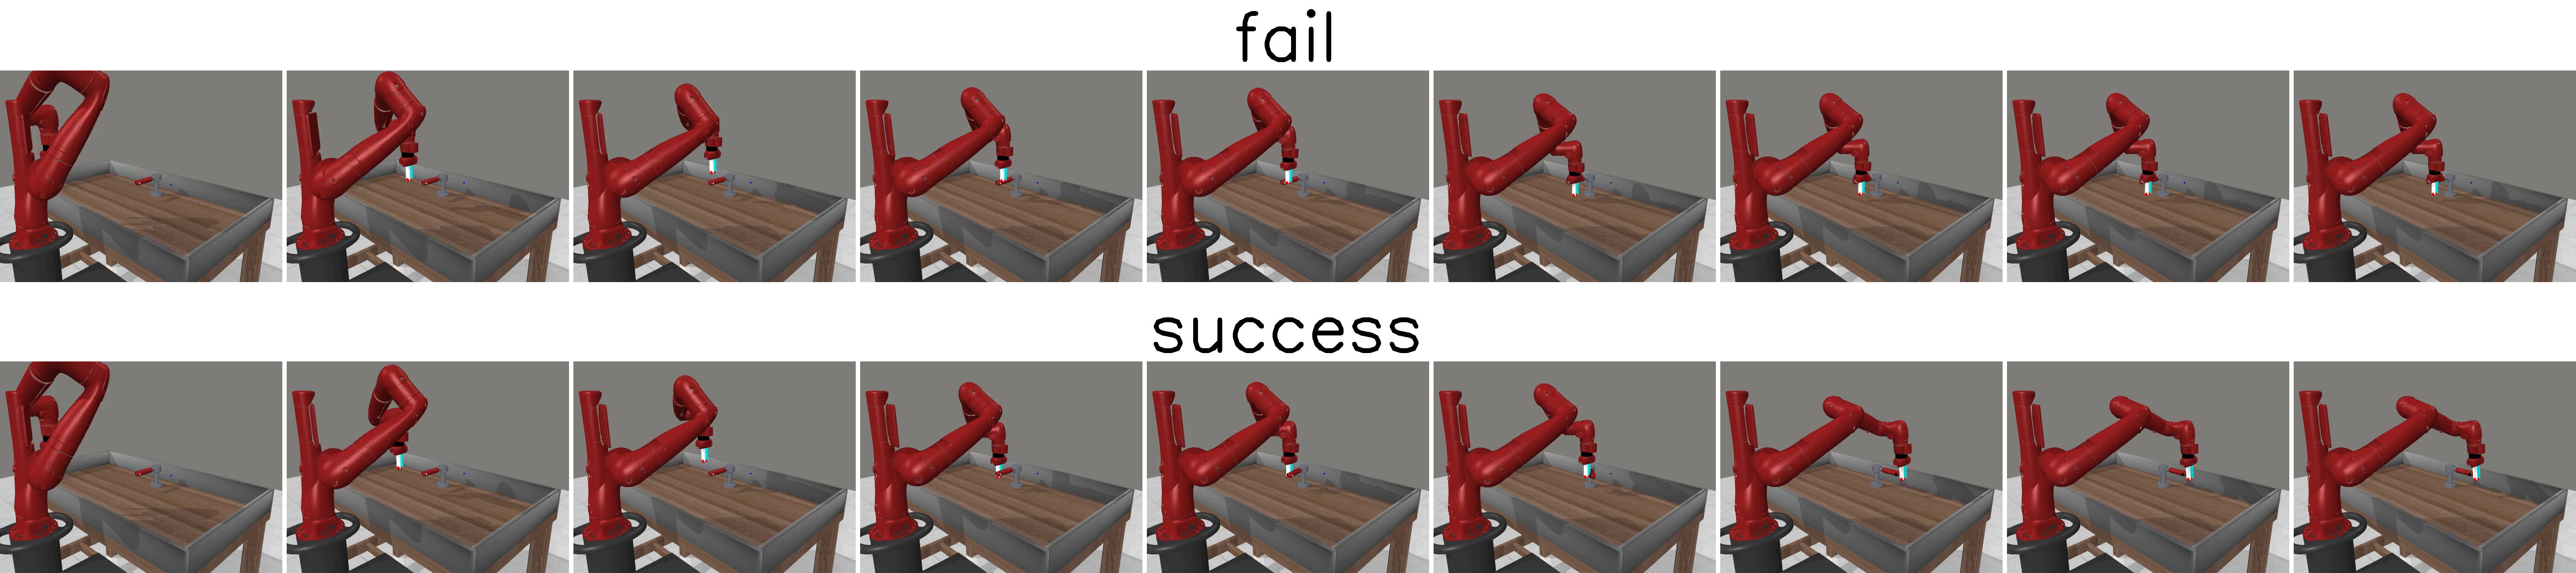
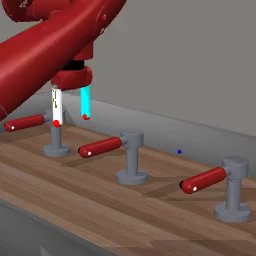
The Meta-World suite makes interaction necessary by hiding physical properties from initial appearance. The complete environment images and restored success/failure filmstrips are retained.
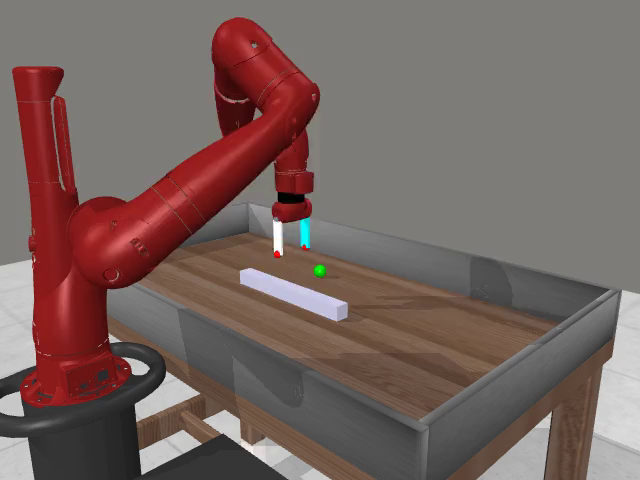
PushBar
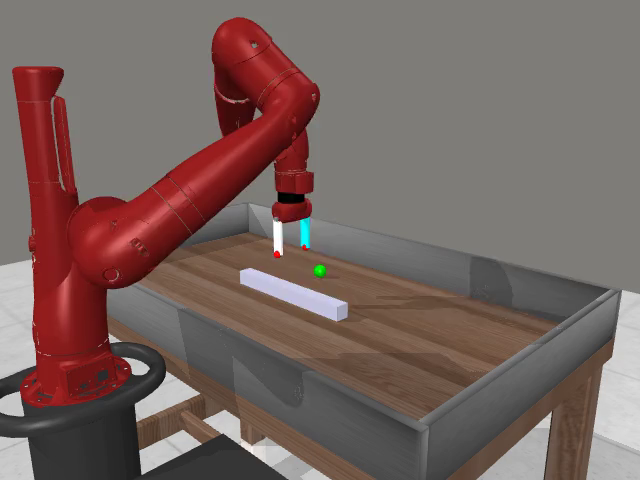
PickBar
SlideBrick
OpenBox
TurnFaucet
B-A PushBar
PushBar requires applying force at the hidden center of mass to move the bar without unwanted rotation. The 0.4 m bar has 25 training mass locations from −0.18 to 0.18 m in 0.015 m increments; test locations are continuously sampled within that interval.
B-B PickBar
PickBar uses the same hidden mass-location construction. A grasp away from the center of mass causes the bar to rotate, so the interaction reveals how to shift the next grasp. Training locations are discrete and testing interpolates continuously within their range.
B-C SlideBrick
The robot pushes a brick up a slope, then lets it slide freely toward a target. The required push height depends on hidden friction. Wood friction is fixed at zero; red-surface training friction ranges from 0.24 to 0.40 in 0.01 steps, with continuous test values in the same range.
B-D OpenBox
The visually ambiguous box lid either lifts or slides. An unsuccessful attempt identifies a wrong interaction mode, making the next plan a discrete hypothesis correction.
B-E TurnFaucet
The faucet must rotate either clockwise or counterclockwise, with direction hidden before interaction. The complete two-row filmstrip shows an unsuccessful direction and a successful alternative.
Appendix C Real-world experiment
Real-world experiments use small task-specific video datasets and fixed robot setups. Appendix details clarify both success criteria and the conditional evaluation protocol.
C-A Tasks and Hardware Setup
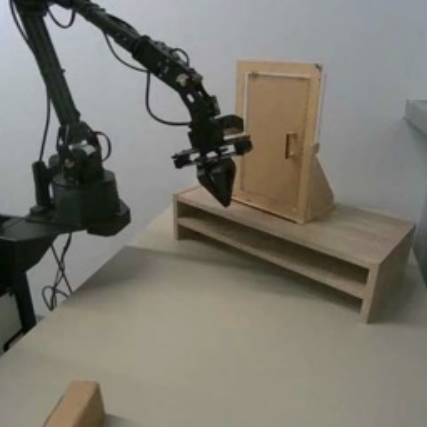
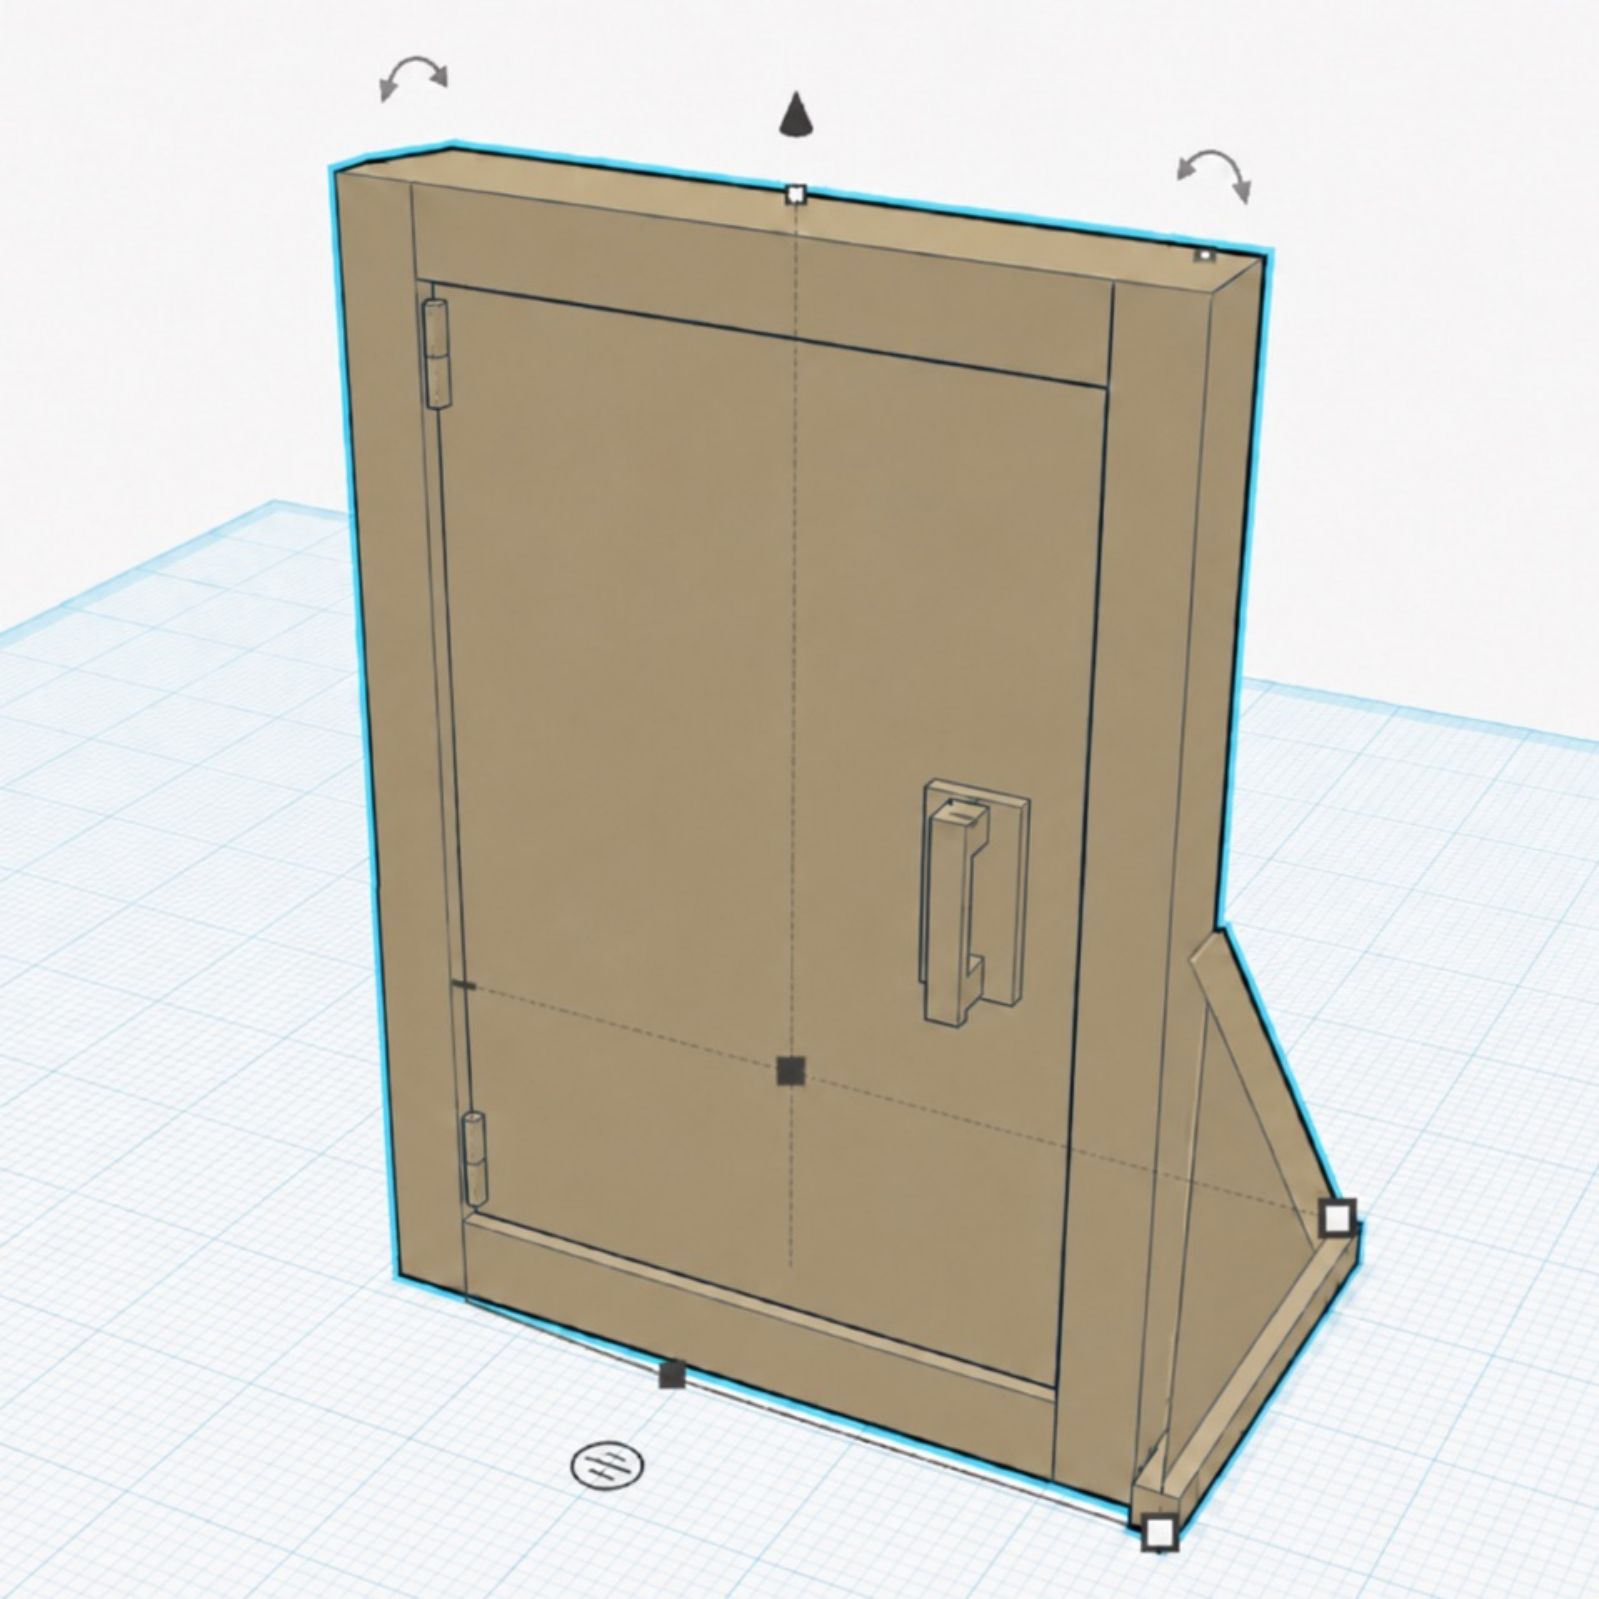
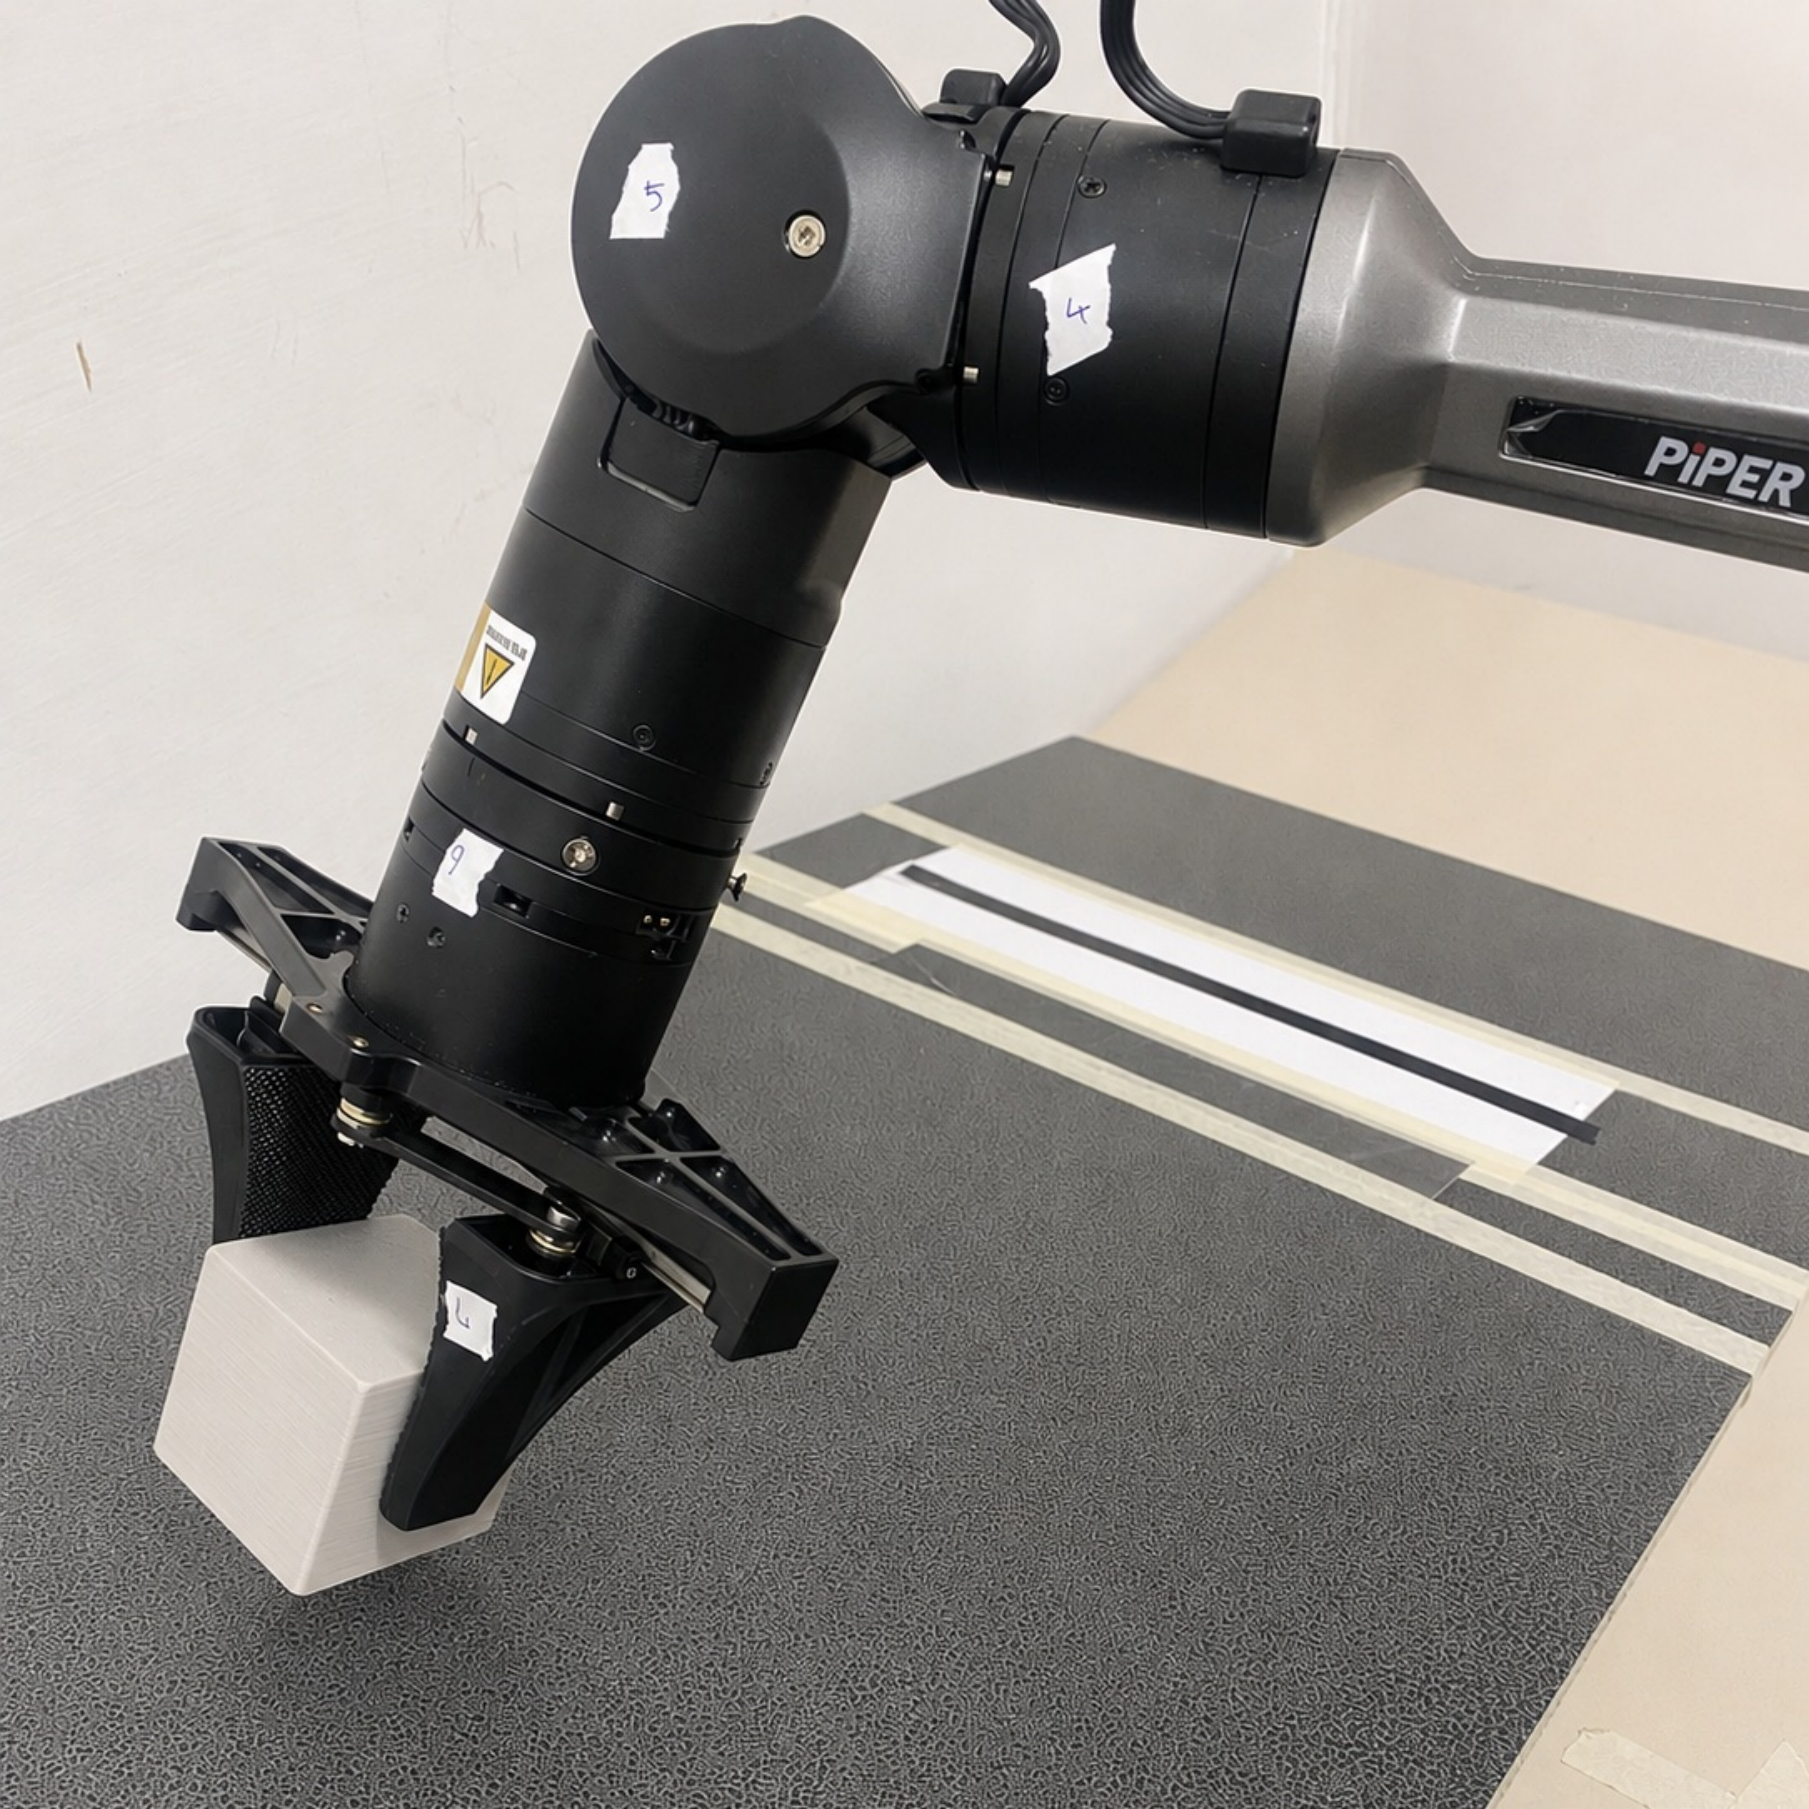
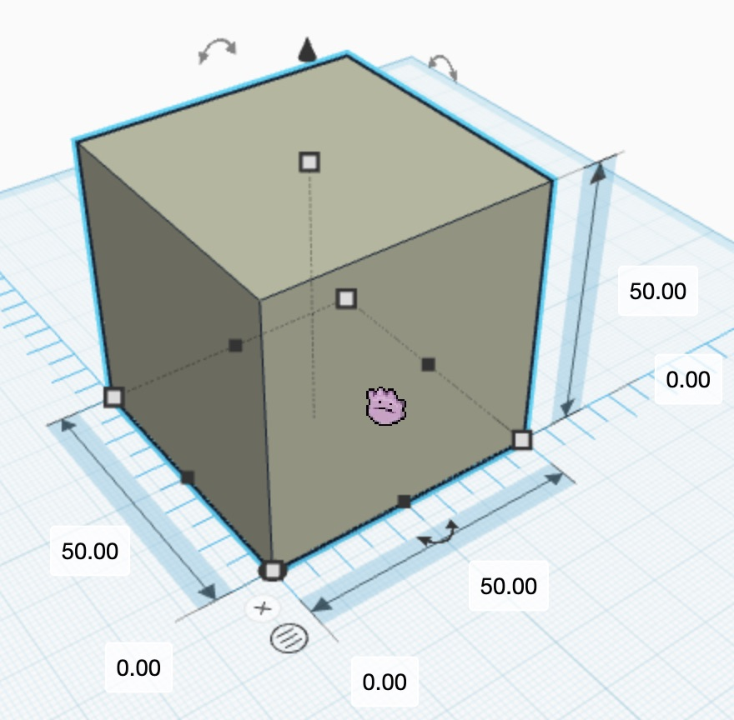
OpenDoor uses an ALOHA WidowX arm; the other tasks use a PiperX arm. A single Logitech C270 camera supplies observations. Training videos contain 20 door trials, 25 sliding trials, 18 balance trials, and 18 pinball trials, with 10, 5, 6, and 6 successes respectively.
| OpenDoor | SlideBlock | ||
 |
 |
 |
 |
| Balance | Pinball | ||
 |
 |
 |
 |
OpenDoor .
The cabinet door opens by pushing or pulling depending on a hidden hinge configuration. Success requires at least ten degrees of opening; the wrong direction jams. The robot starts from a fixed home pose.
SlideBlock .
The robot releases a block from a chosen point on an incline so it stops overlapping a target line. Friction depends on block face and orientation. Lateral placement and contact variability make a simple one-dimensional friction explanation incomplete.
Balance .
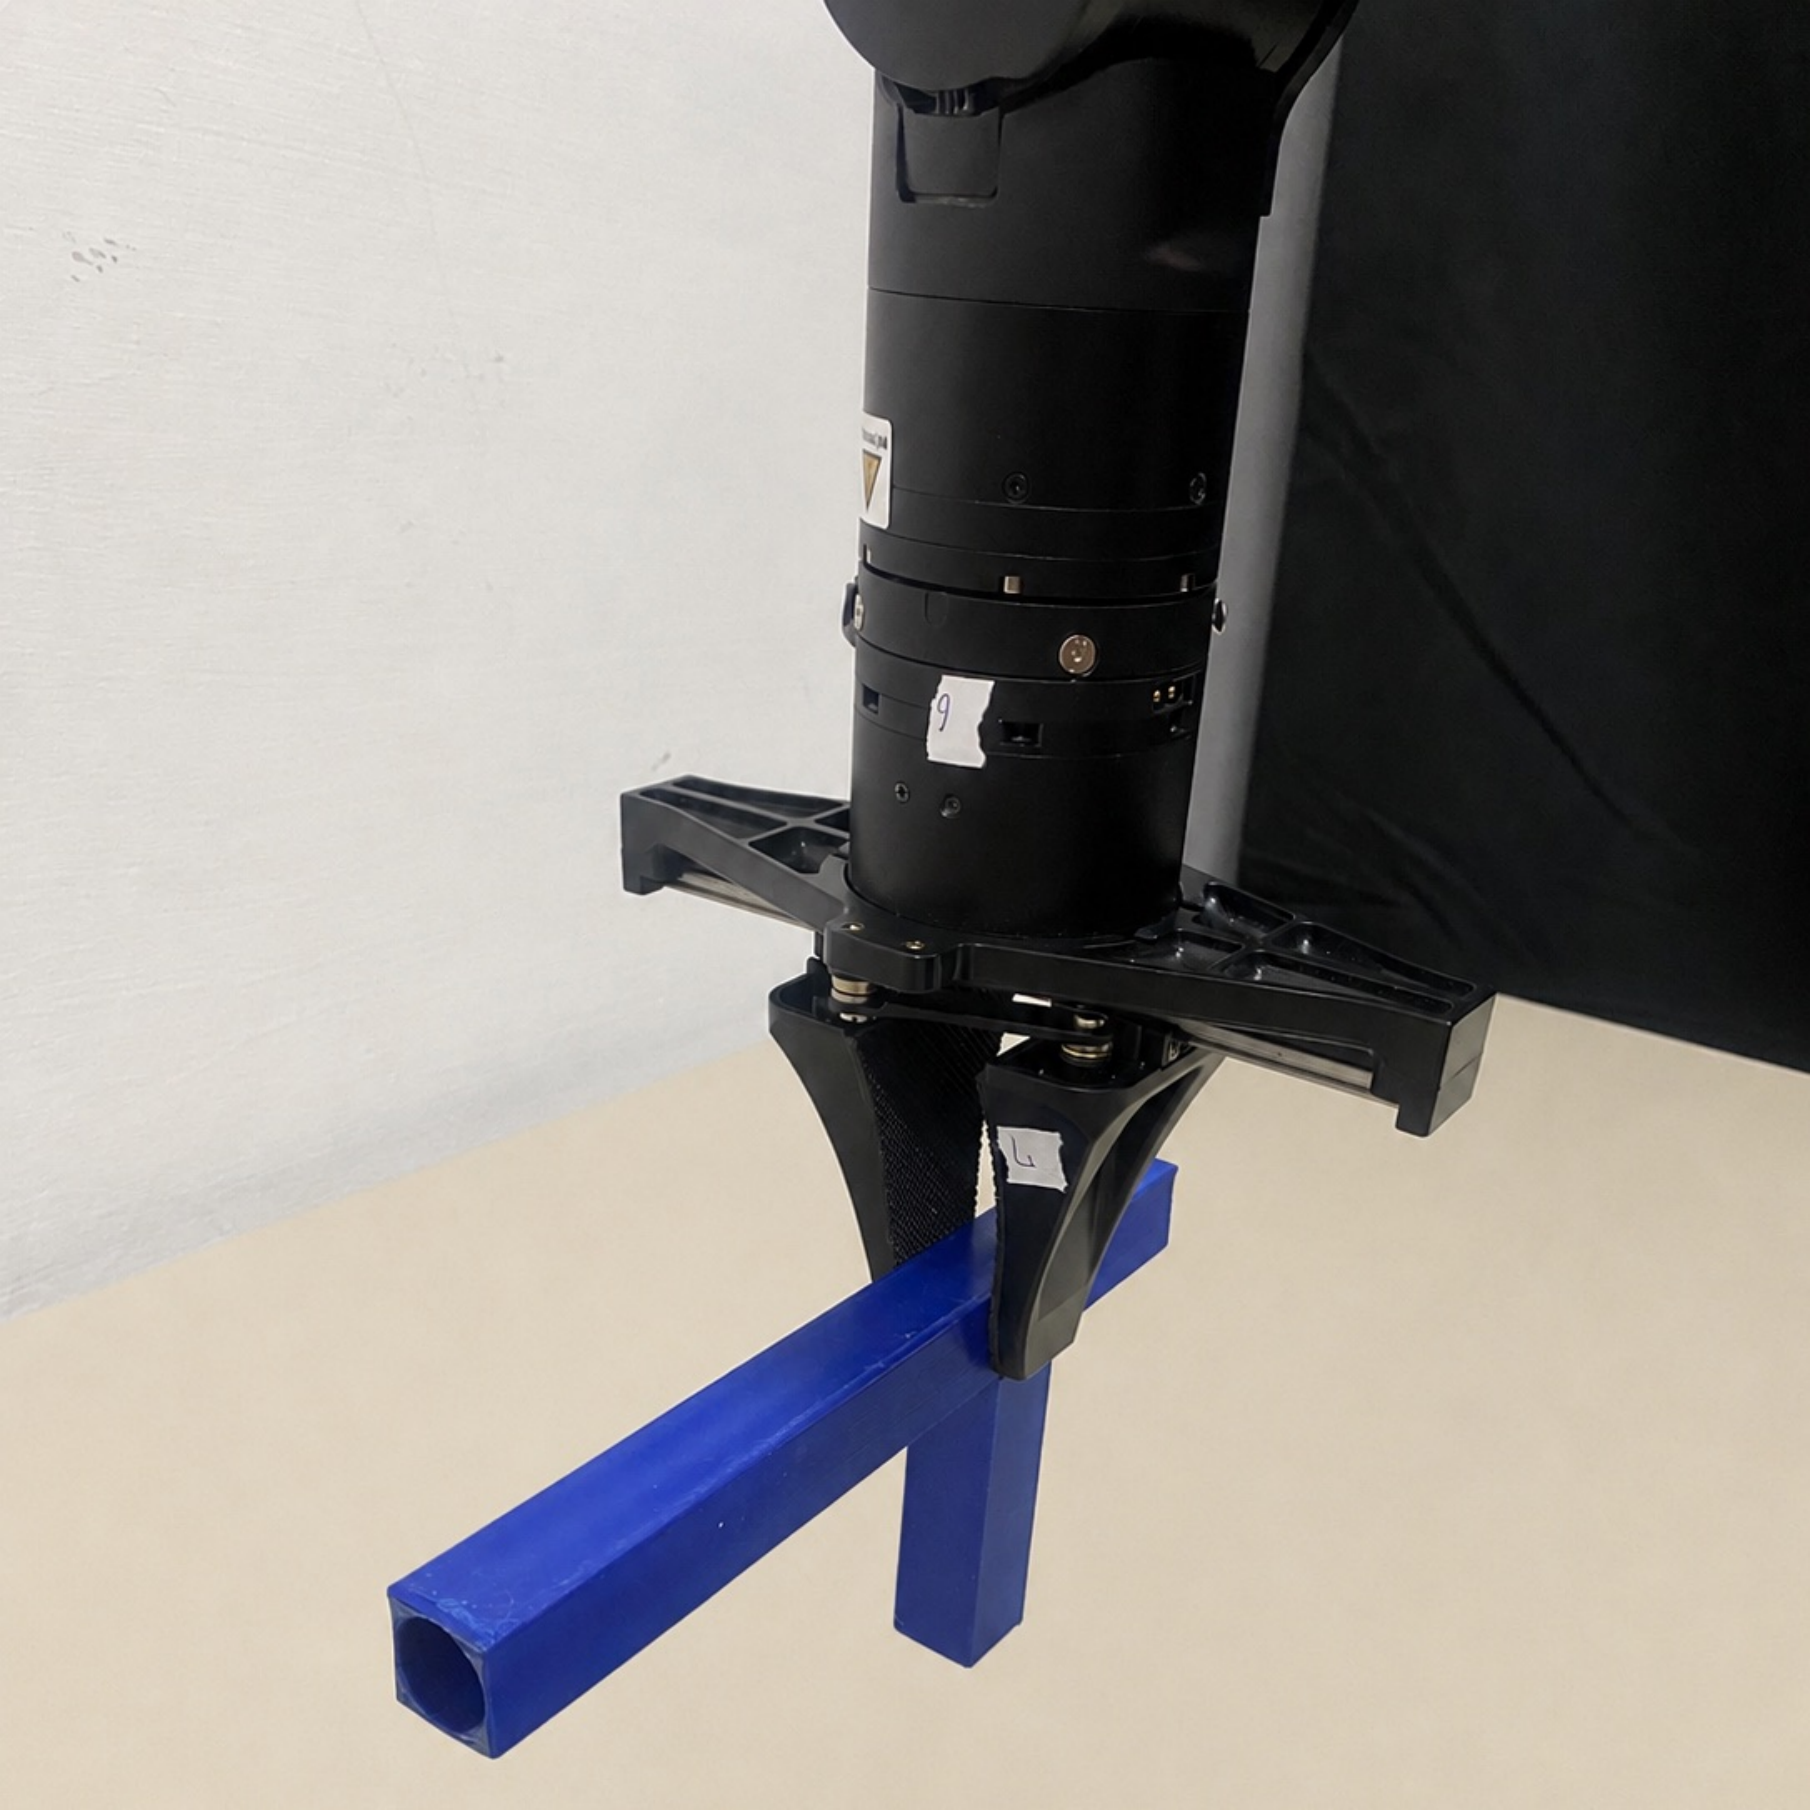
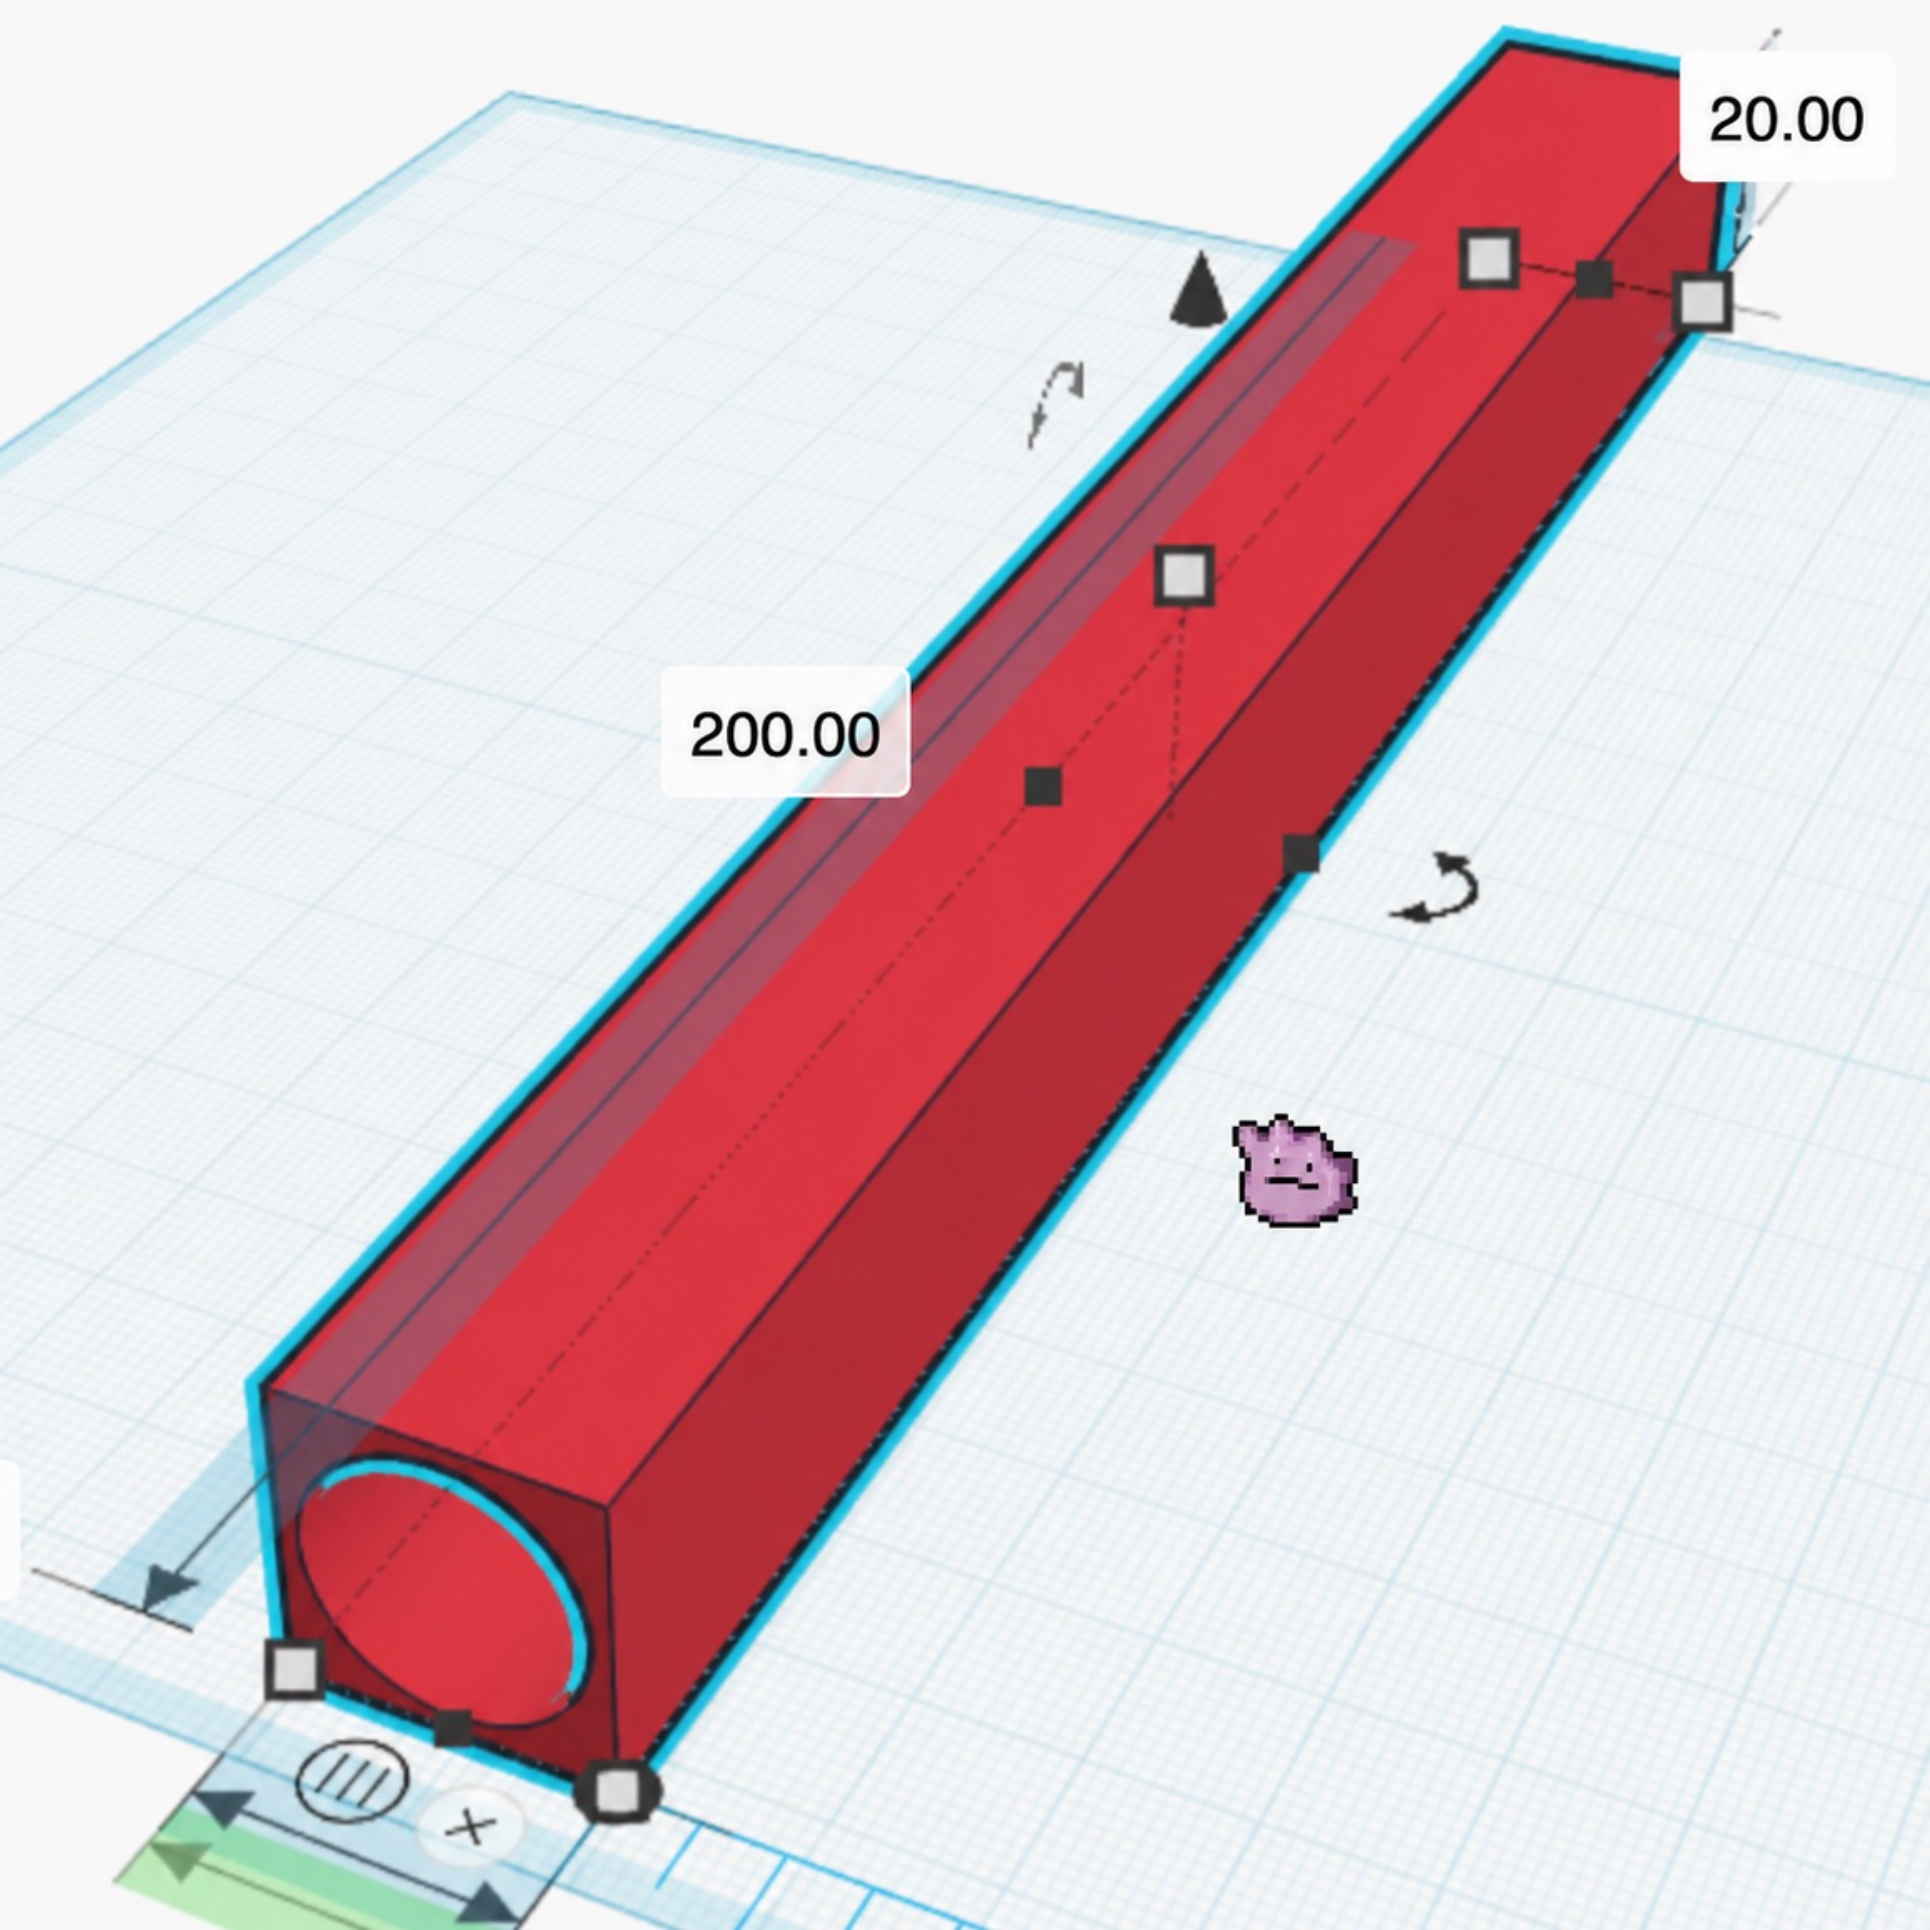
A hollow bar contains an unseen weight fixed with clay. The robot must release it on a narrow pivot without falling. The direction of a failed tip provides evidence for moving the contact point toward the actual center of mass.
Pinball .
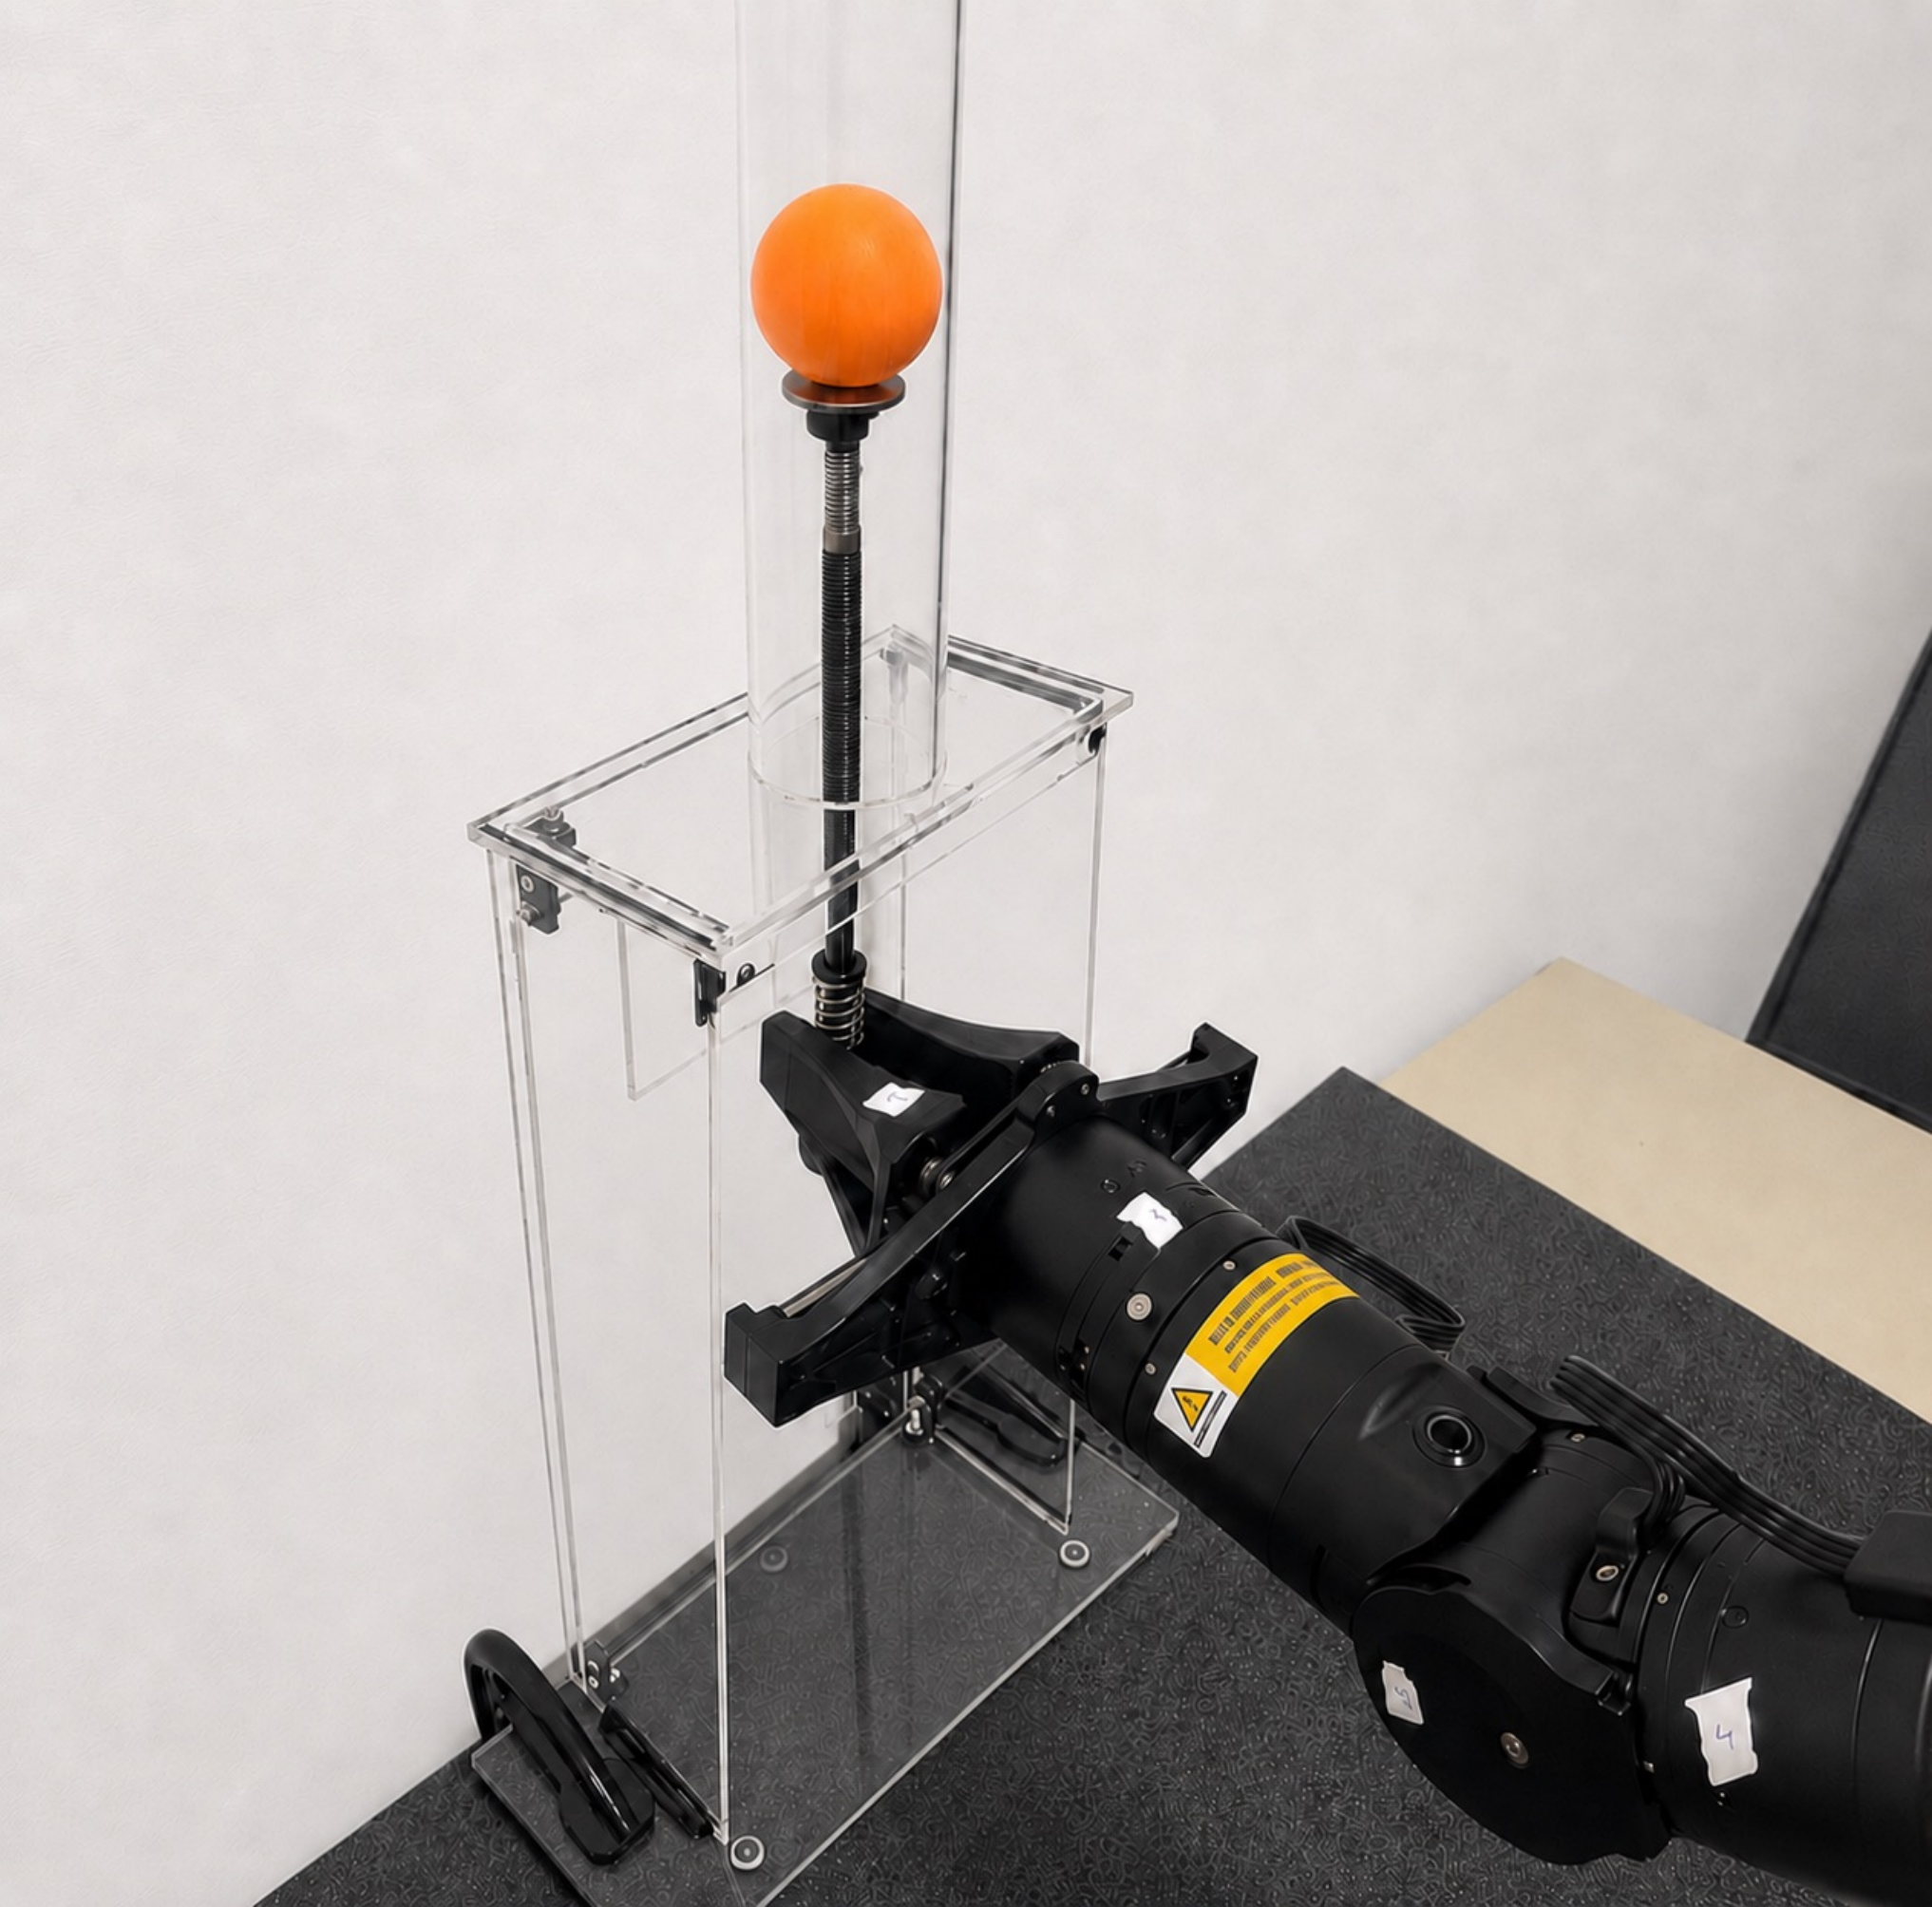
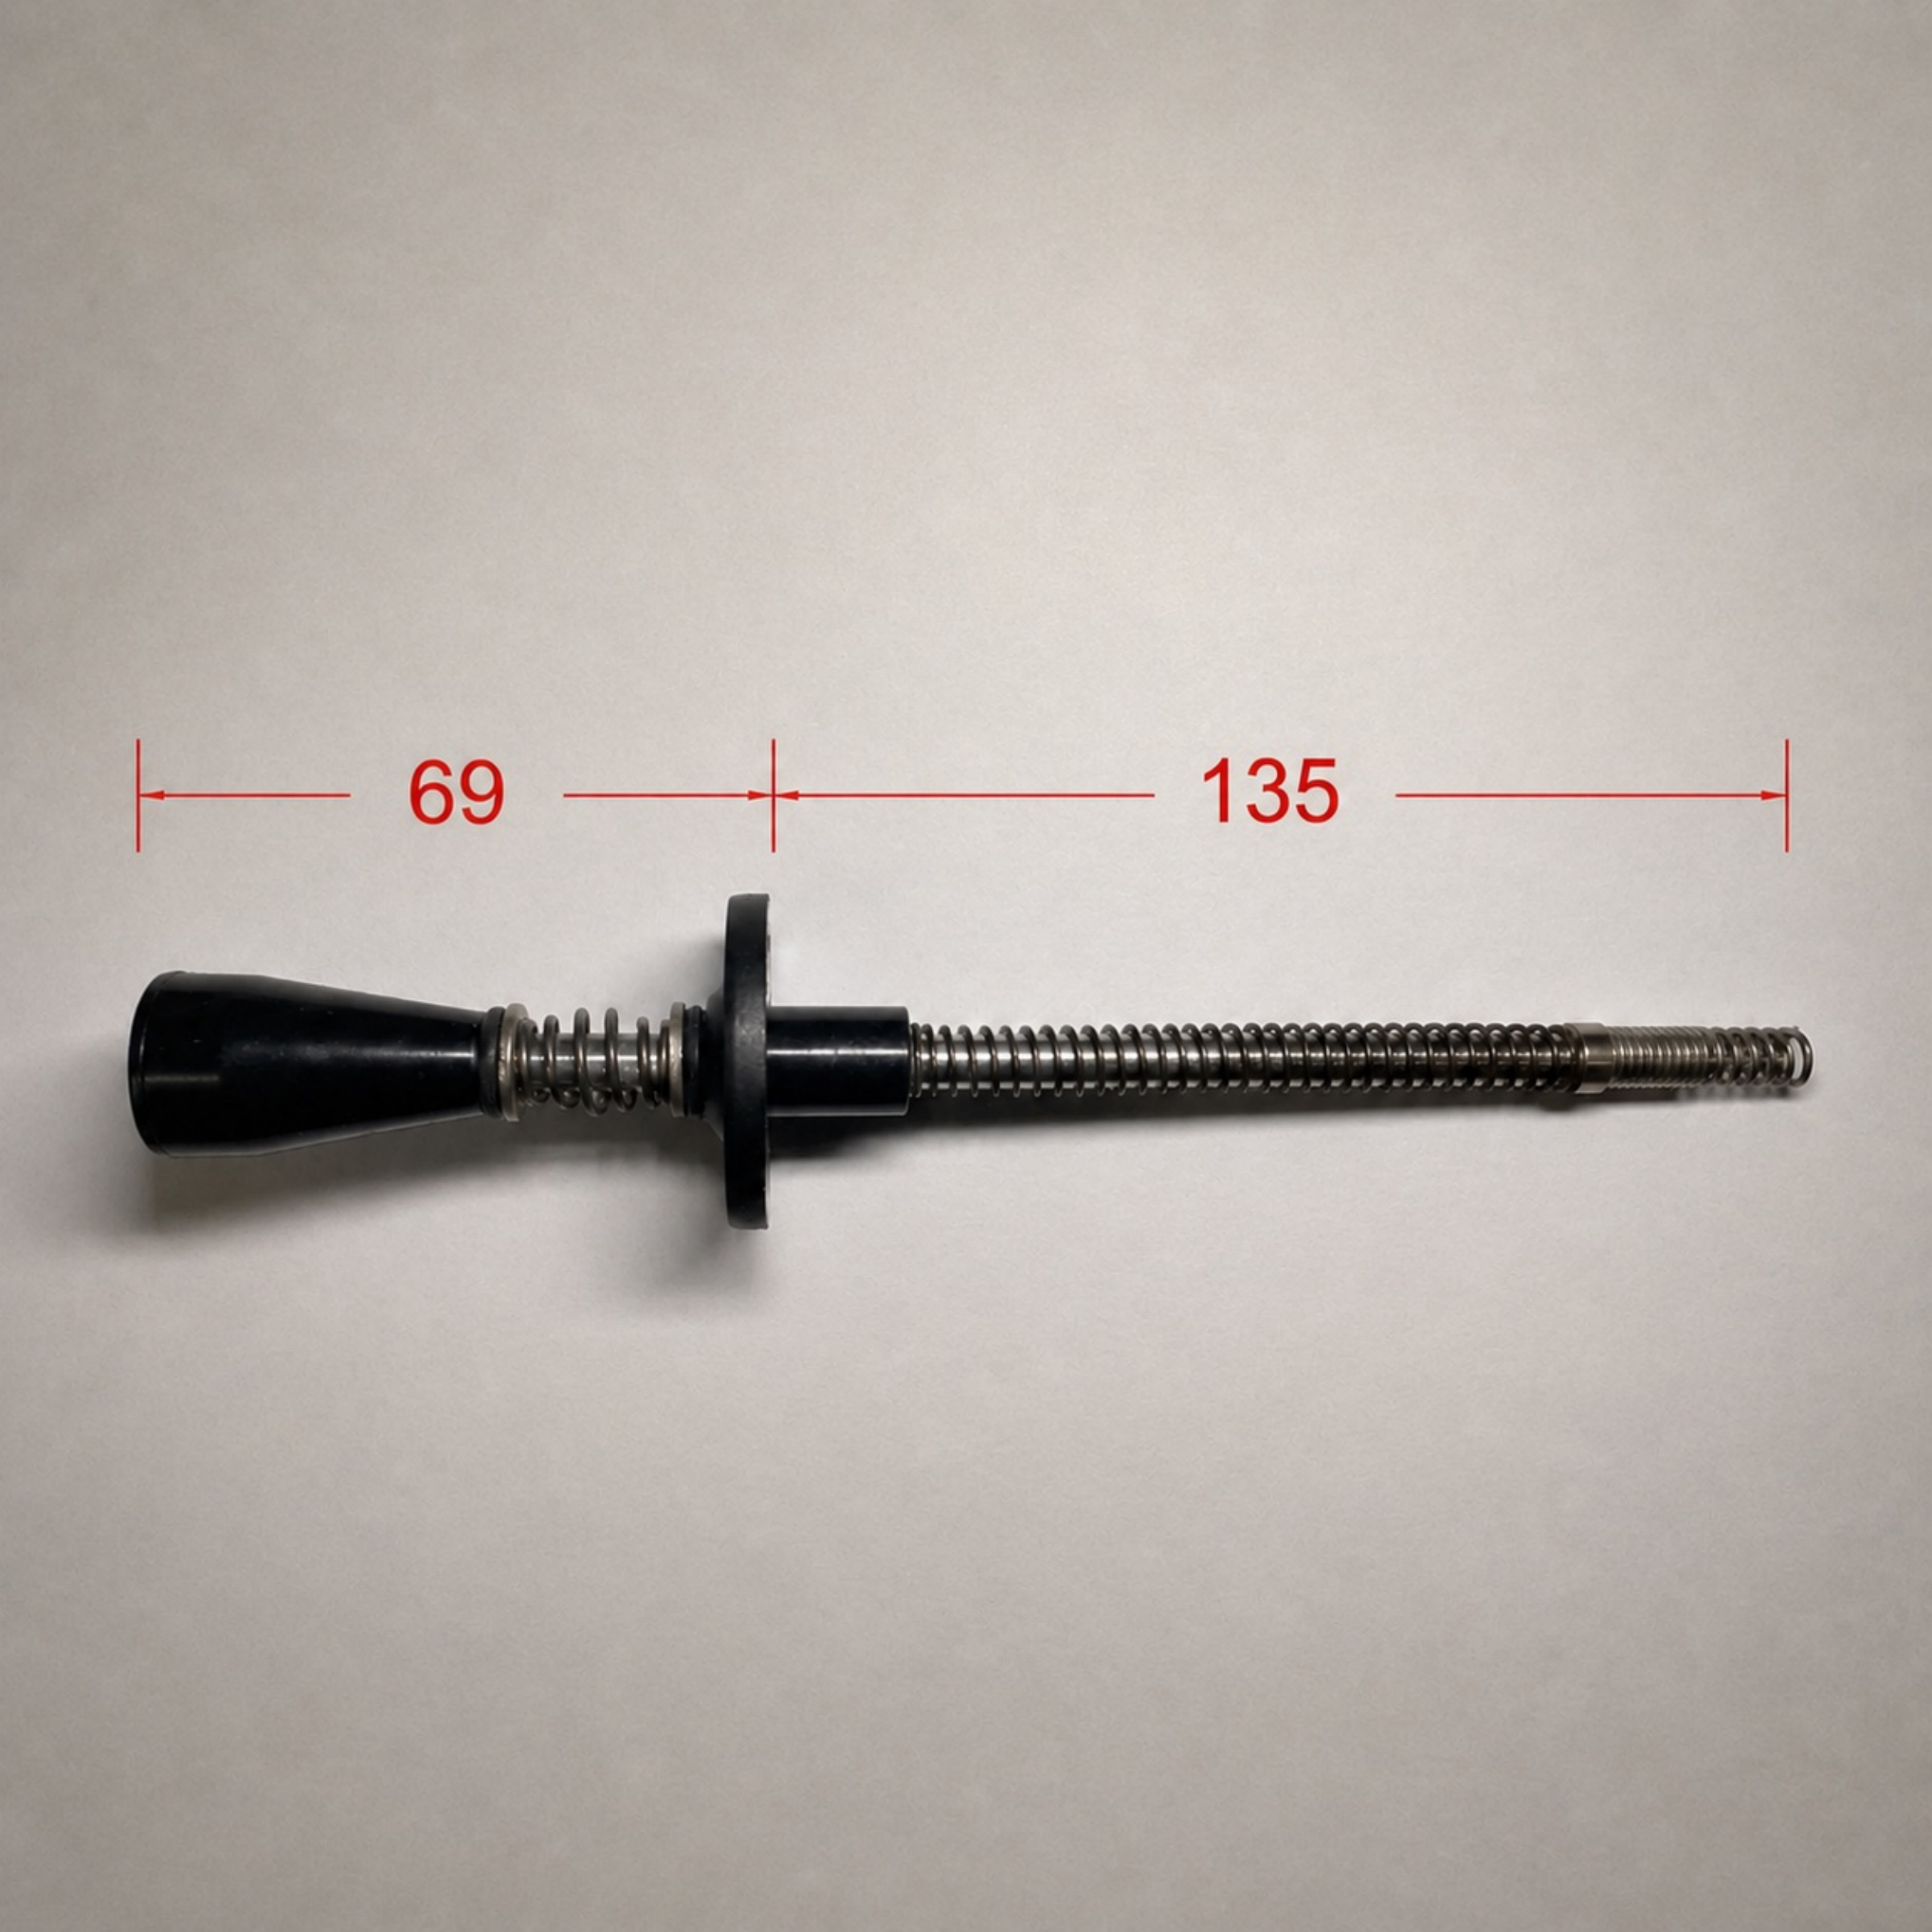
A spring launcher must send a ball to a marker 22 cm above it. Three balls range from 2 to 89 g, and the lightest requires the deepest pull in this setup. The authors suggest air resistance and internal distribution as explanations, but do not isolate these causal effects experimentally.
| Task | Hidden parameter | Robot | Trials (S/F) |
|---|---|---|---|
| Open Door | Push vs. pull direction | WidowX (Mobile ALOHA) | 10/10 |
| Slide Block | Block friction coefficient | Piper-X | 5/20 |
| Balance | Bar’s center of mass | Piper-X | 6/12 |
| Pinball | Ball mass | Piper-X | 6/12 |
C-B Inference hyperparameters.
Real trials use two candidate plans and Gaussian noise with standard deviation 0.1 on the first frame for both methods, intended to mitigate nearly deterministic plans with sparse training. A ten-trial Pinball ablation yields 4/10, 7/10, and 3/10 success at noise levels 0, 0.1, and 0.3; it is a small task-specific check.
| Success Rate | |
|---|---|
| 4/10 | |
| (default) | 7/10 |
| 3/10 |
C-C Evaluation protocol.
Each reported trial begins with a randomly configured task and a failed initial execution, then permits one replanning attempt using that interaction. Twenty such trials are evaluated per task. The denominator therefore excludes successful initial attempts and does not quantify overall episode success from a fresh start.
Appendix D Method Details
Implementation details distinguish feature extraction, canonical retrieval, test-time embedding optimization, failure-aware selection, action execution, and data collection.
D-A Video plan generator and retrieval module
A shared video diffusion network alternates between predicting successful plans and modeling arbitrary interaction outcomes. The same latent embedding space connects these two roles.
D-A 1 State embedding
Each video is encoded frame by frame and concatenated into a single feature vector. A successful trial provides the canonical vector for its configuration. Configuration IDs bind successful and failed examples with the same hidden dynamics without exposing their numeric parameter to the learner.
D-A 2 Video plan generator
The 125M-parameter 3D U-Net uses projected 512-channel state features and CLIP language features. It predicts seven future frames plus the current frame, diffuses at 32×32 then super-resolves to 128×128, and uses 25 DDIM inference steps. Training uses 100 diffusion timesteps, v-parameterization, learning rate 10⁻⁴, batch size 128, and 12K steps. The binary role flag separates successful-plan generation from all-outcome identification.
| num_parameters | 125M |
|---|---|
| diffusion_resolution | (32, 32) |
| target_resolution | (128, 128) |
| base_channels | 128 |
| num_res_block | 2 |
| attention_resolutions | (2, 4, 8) |
| channel_mult | (1, 2, 3, 4) |
| batch_size | 128 |
| training_timesteps | 12k |
| denoising_timestep | 100 |
| sampling_timestep | 25 |
D-A 3 Retrieval module
PCA aligns video-feature dimensions. Negative distances to stored interactions become softmax logits at temperature 0.3; a sampled interaction returns its configuration’s canonical successful embedding. CLIP/DINO use cosine distance and other encoders use L2. Retrieval alone returns a stored embedding, but the subsequent continuous refinement can leave that bank, so the appendix’s no-out-of-distribution claim does not directly cover the full refined system.
D-A 4 Refining state embedding
The identification network receives a noise-corrupted observed interaction and predicts its clean video. Squared reconstruction error updates only the state embedding, leaving shared network weights frozen. The preserved equation is a denoising objective, not independently sampled trajectory matching. Appendix initialization uses a unit-variance Gaussian description, differing from the fitted-prior description in the main text.
Equation
D-A 5 Latent feature space
The experiments use frozen DINOv2, R3M, and CLIP representations. Concatenated image features form video vectors; they need not be explicitly supervised on physical parameters to contain interaction-dependent information.
D-B Rejection module
Each candidate is scored by its distance to the most similar plan in the failed-plan buffer. Maximizing that minimum distance avoids repeating known failures. Diversity in image space is a heuristic for different physical hypotheses, not a calibrated posterior over environment parameters.
Equations
D-C Action module
Dense point tracks from predicted videos guide object or wrist motion through the existing AVDC controller. Wrist tracking is necessary when otherwise similar object videos correspond to different grasp positions. Control quality remains a separate source of failure.
D-D Data collection process
Scripted simulation policies receive a guessed physical parameter. Correct and deliberately wrong guesses generate successes and failures; data collection can access the true parameter, although the learned representation receives configuration groupings and outcomes rather than numeric labels. Real tasks use manually collected interaction videos.
Appendix E Additional Experiment Results
Additional analyses test history aggregation, progressive state correction, feature structure, latency, data scale, multi-object retrieval, alternative selection, distractors, and appearance changes. Their metrics differ and should not all be read as robot task success.
E-A Retrieval from Multiple Failed Interactions
Using all failed interactions averages retrieval scores before softmax rather than performing explicit Bayesian belief updates. Compared with the latest interaction, it improves PushBar success from 95.8% to 98.0% and PickBar from 98.0% to 99.0%, but reduces SlideBrick from 82.8% to 77.2%, with 69 versus 91 failures. The proposed explanation involving missed informative frames is a hypothesis, not an isolated causal test.
E-B Hidden State Optimization Performance
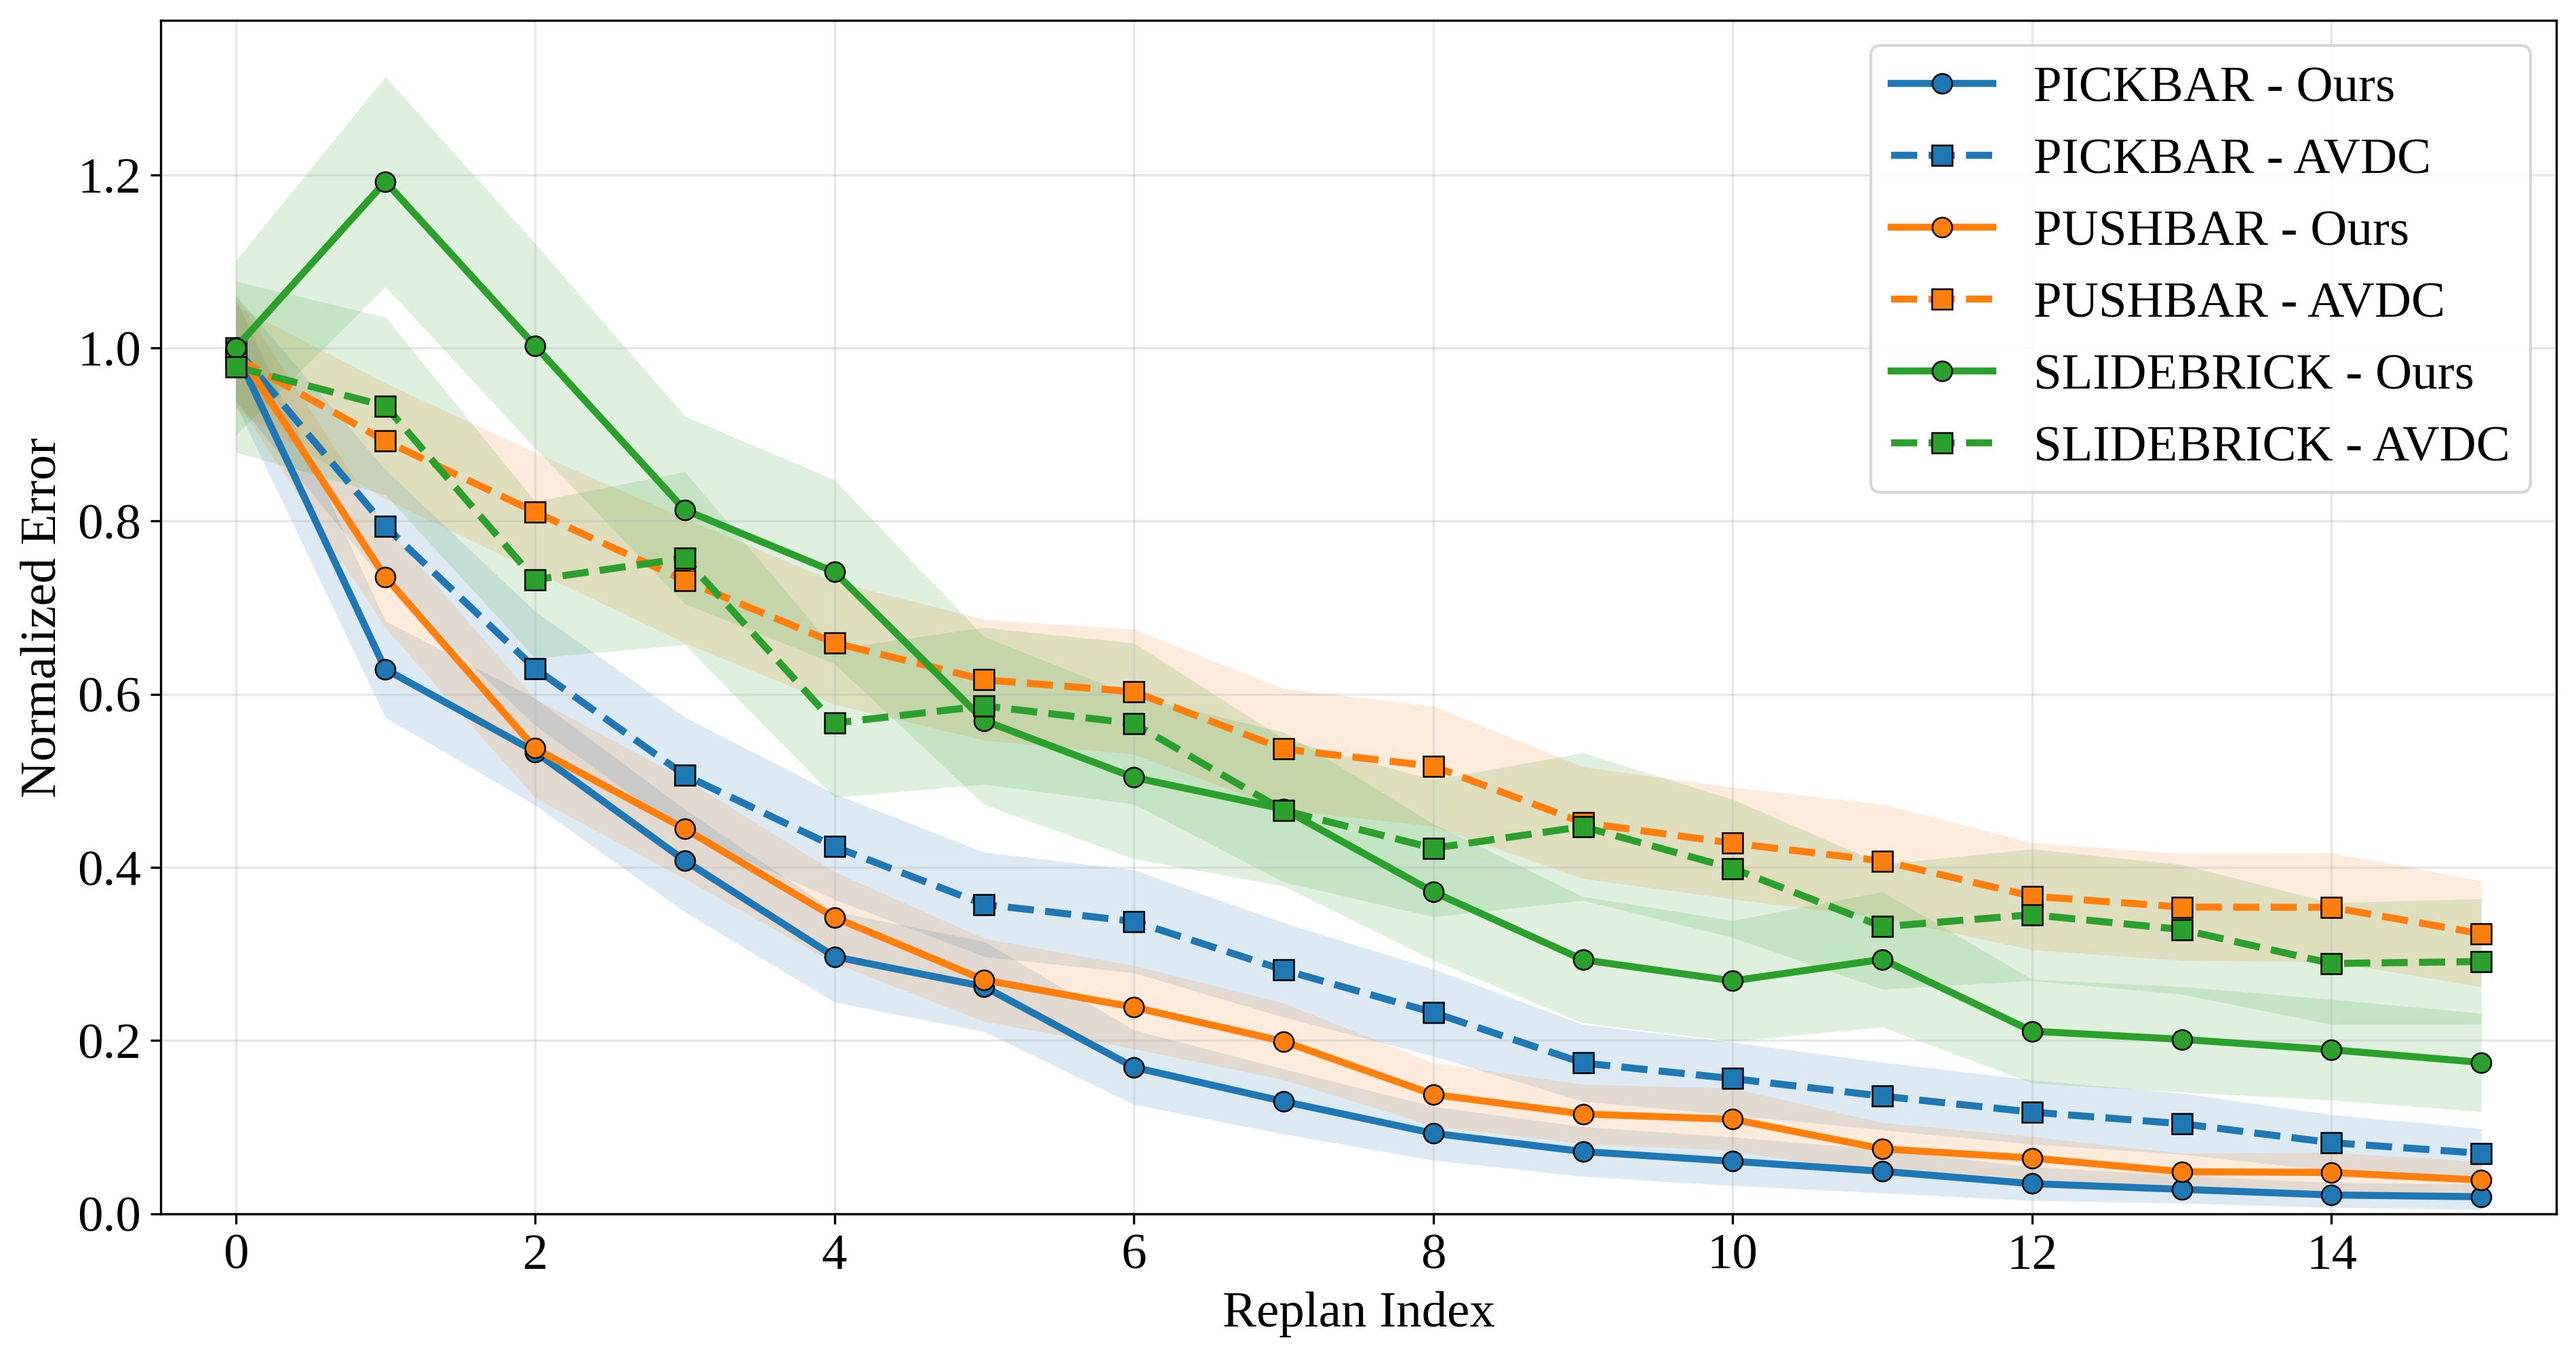
Across replanning rounds, Figure 16 tracks normalized position-prediction error with 95% confidence intervals over 400 trials. Bar tasks measure center-of-mass position, whereas SlideBrick measures required push height rather than friction directly. Later interaction generally improves estimates, though improvement is not uniform at every early step.
E-C State Embedding Feature Space
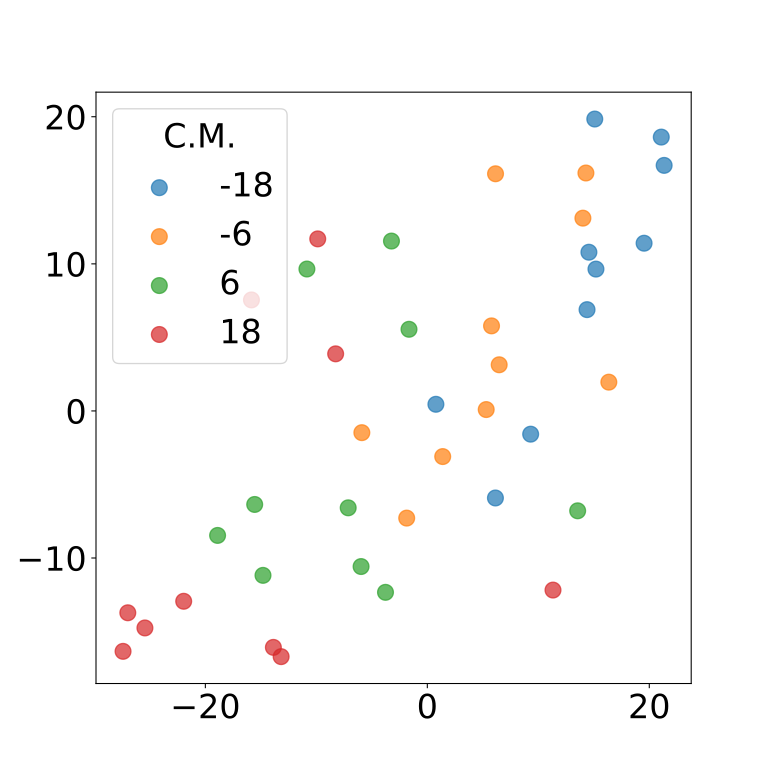
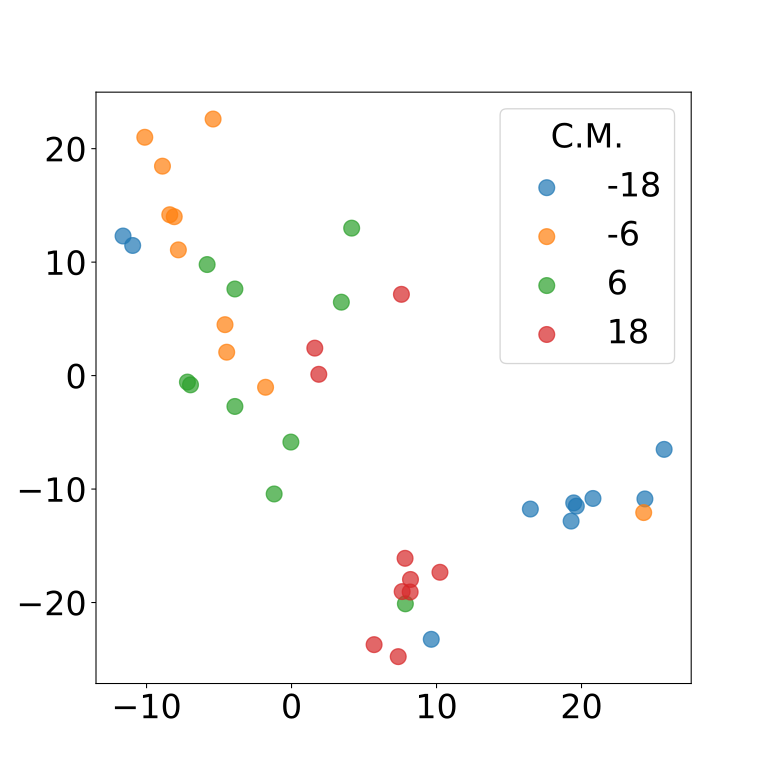
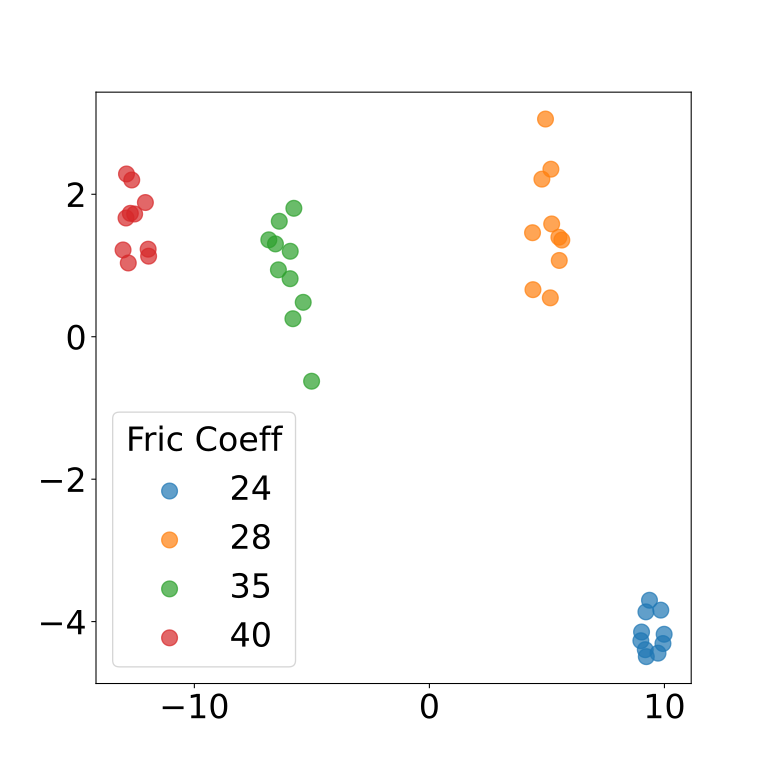
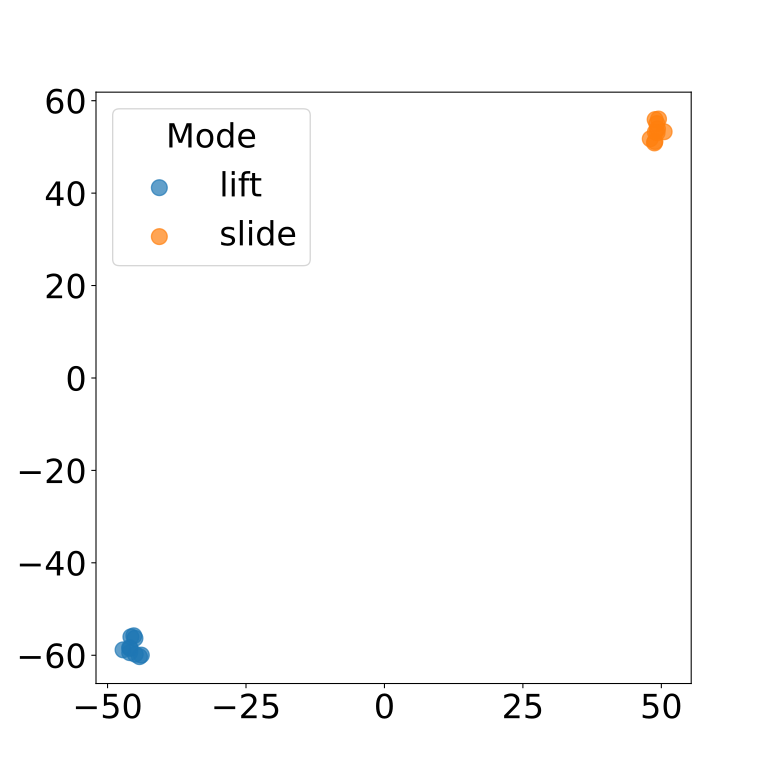
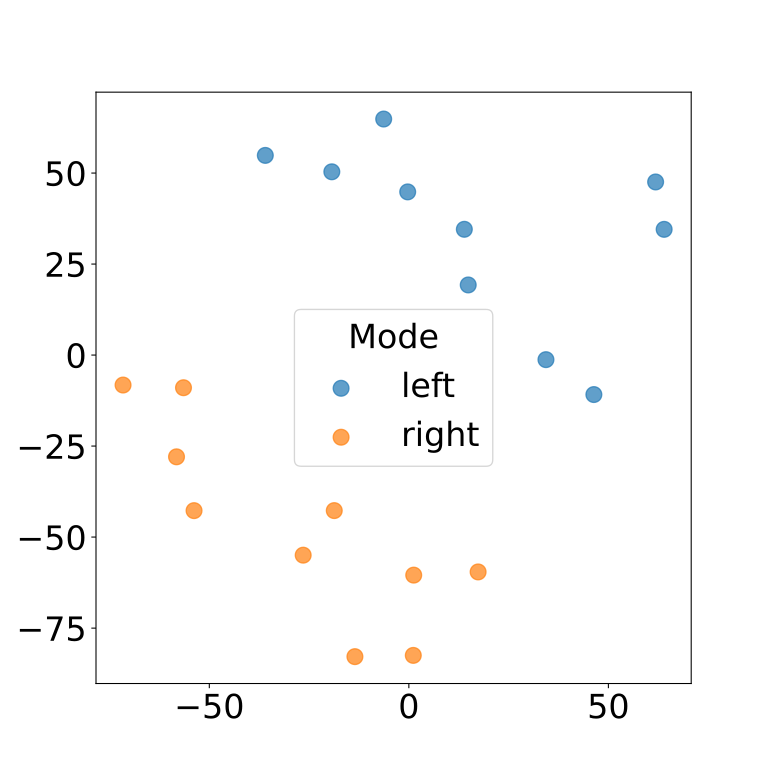
t-SNE plots illustrate structure for four selected continuous parameter values and the two discrete modes. These embeddings look clustered by configuration; such projections are descriptive and complement, rather than replace, the grouped linear-probe evidence.
E-D Runtime analysis
On a Xeon Platinum 8480/H100 node, 100 iterations average 3.496 seconds for RELIC versus 0.639 for AVDC; embedding refinement alone takes 2.713 seconds. The claimed 121.4 versus 175.1 seconds to success multiplies mean replans by planning time plus an assumed 25-second failed execution. This is a back-of-envelope estimate, with initial/successful execution duration and censoring not separately resolved. Reusing an identified embedding is a proposed amortization benefit, not a separately reported reuse experiment.
E-E Training Data and Scaling Effects.
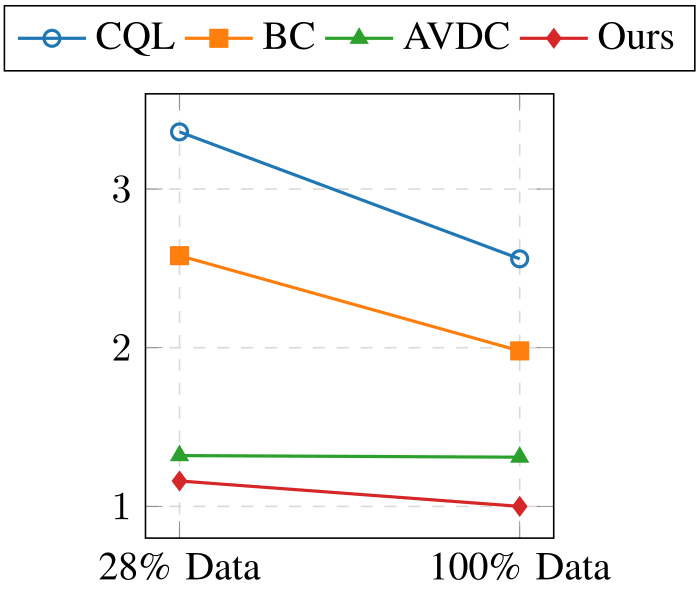
Increasing data from 28% to 100% improves the aggregate normalized replanning ratio from 1.16 to 1.00, but not every task: PushBar changes from 3.91 to 4.26 and PickBar from 3.56 to 3.84. Table XII has inconsistent outcome totals. Its full-data rows sum to 13,600 failures/670 successes, but print 13,620/650; reduced rows sum to 3,340/670, but print 3,360/650. Grand totals remain 14,270 and 4,010. These discrepancies are preserved rather than silently corrected.
| PushBar | PickBar | SlideBrick | OpenBox | TurnFaucet | Total | |
| Main exp (100%) | 6000/250 | 6000/250 | 1560/130 | 20/20 | 20/20 | 13620/650 |
| 28% | 1000/250 | 1000/250 | 1300/130 | 20/20 | 20/20 | 3360/650 |
| Method Dataset Size | ||||
|---|---|---|---|---|
| (Successful, Failed) | (2, 14) | (10, 70) | (40, 280) | (120, 840) |
| Random | 11.87 1.28 | 11.87 1.28 | 11.87 1.28 | 11.87 1.28 |
| Ours (Retrieval) | 18.59 1.54 | 30.94 1.83 | 53.12 1.97 | 67.66 1.85 |
E-F Multi-Faucet Environment and Robustness of State Embedding
Three faucets yield eight joint direction configurations. Exact-configuration retrieval accuracy rises from 18.59% with 2 successes/14 failures to 67.66% with 120/840, versus a reported random baseline of 11.87%. This is a retrieval evaluation with increasing dataset coverage, not demonstrated long-horizon robot execution success.
E-G Alternative plan selection strategy
An alternative attracts candidates toward a retrieved successful video instead of rejecting past failed plans. In 80 trials per task, attraction is better on the two bar tasks, while rejection is better on sliding, box, and faucet; normalized aggregate counts are 1.07 versus 1.00. These smaller experiments support the selected default without establishing that rejection is best for every task.
| Method | PushBar | PickBar | SlideBrick | OpenBox | TurnFaucet | Overall (Normalized) |
|---|---|---|---|---|---|---|
| Attract | ||||||
| Reject (Ours) |
E-H Robustness to Task-Irrelevant Visual Distractors
Randomized backgrounds and visual distractors test selection on SlideBrick and OpenBox. Rejection still improves over no rejection; object segmentation can help, but no metric wins every condition. For example, segmented pixel distance gives 4.53/1.65 replans versus 6.09/1.91 without rejection. Suggested segmentation infrastructure does not constitute a broad real-world clutter evaluation.
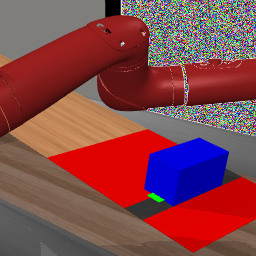
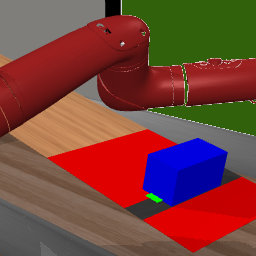
E-I Generalization of state embeddings to Objects Variance
Appearance variations preserve geometry and the underlying physical mechanism. The reported metric is parameter-estimation error from raw retrieval, not completed-task success. Much of the retrieval advantage over random persists; for example, PushBar error is 0.0694 for seen and 0.0693 for unseen appearance, versus 0.0954 random. This supports visual robustness within these controlled variations.
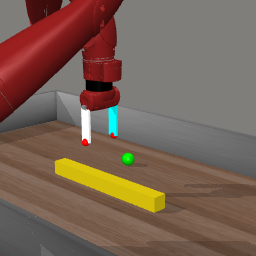
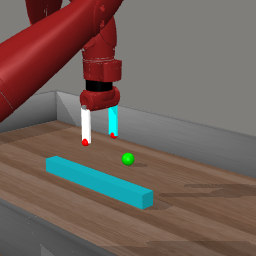
Appendix F Probabilistic intuition for rejection.
If independent hypotheses contain the correct mode with probability q, N samples include it with probability 1−(1−q)ᴺ. This exceeds q only for 0<q<1 and N≥2, with equality at the endpoints. Translating inclusion into successful plan selection requires a reliable discriminator; further multi-attempt failure claims require assumptions about repeated sampling and adaptation. Correlated generations and imperfect image distances prevent this argument from being a guarantee.