Overview
This edition follows the complete eighteen-page arXiv v2, including the appendix’s task definitions, standard deviations, retrieval-budget control and implementation details. The work studies few-shot imitation learning through task-specific data selection.
At a glance
COLLAGE augments five target demonstrations with data retrieved independently through visual, motion, shape and language similarity. It trains a reference policy on each retrieved subset, scores how well that policy explains the target actions, and converts those scores into sampling weights for final policy training.
Average LIBERO-10 success is 50.5%, versus 45.4% for the reproduced visual-retrieval baseline. Across six physical tasks, it completes 41 of 90 trials, versus 26 of 90 for visual retrieval. These are average improvements; some individual tasks favor a simpler baseline. The project page provides further resources.
1 Introduction
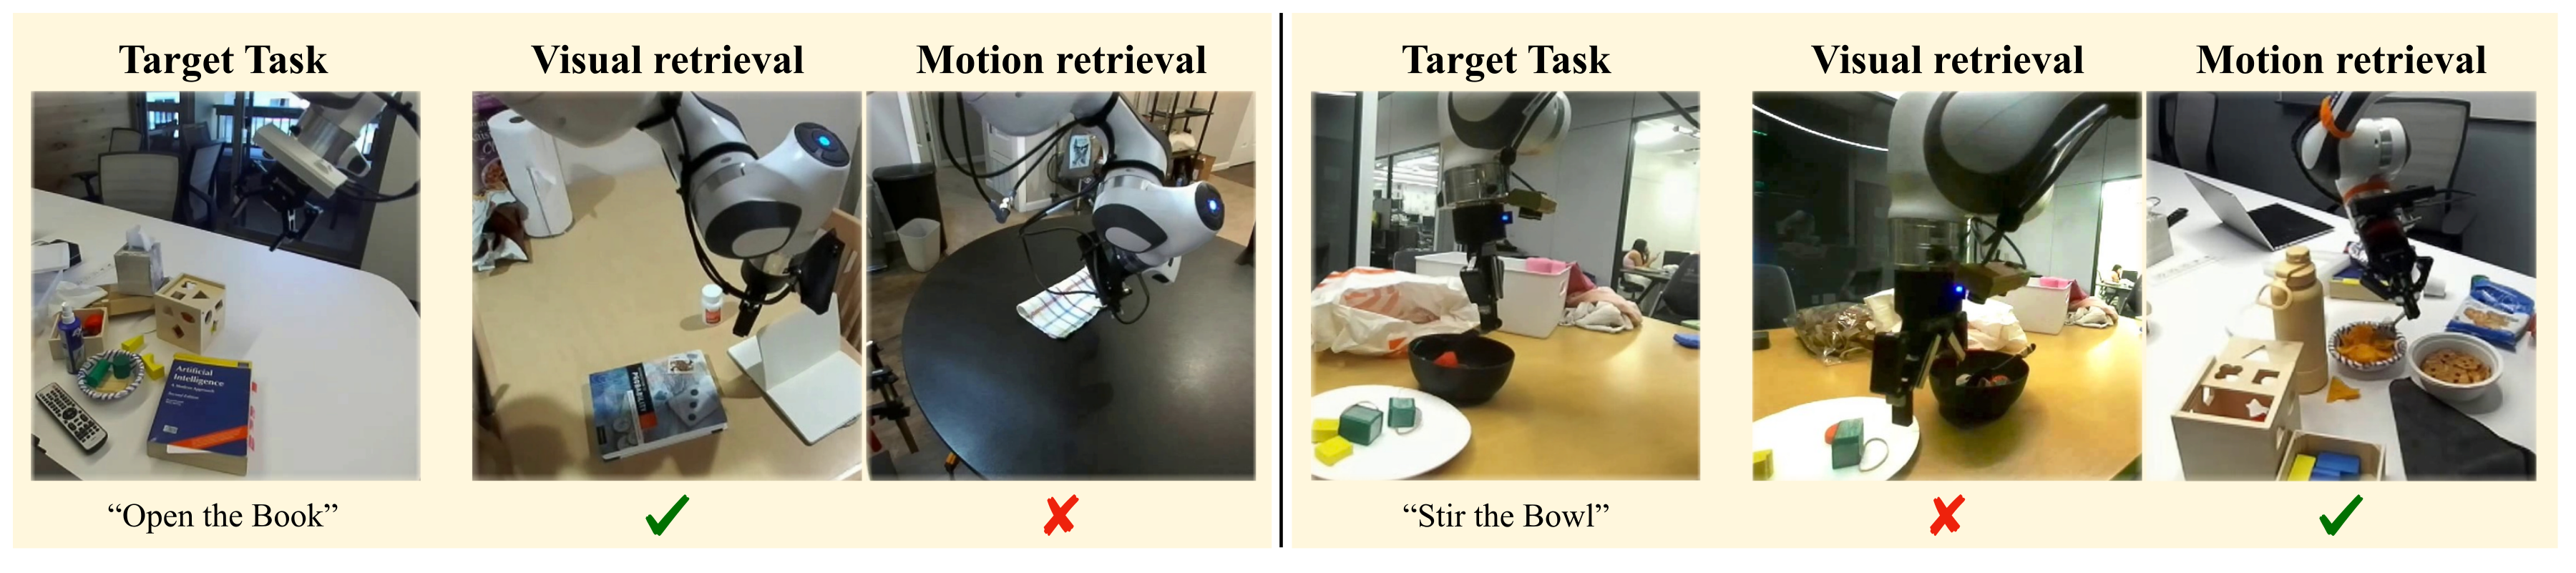
A large prior dataset may contain transferable skills and conflicting examples. Single-modality retrieval can confuse shared appearance with shared goals, or similar motion with the correct object interaction. Figure 1 illustrates this with book opening and bowl stirring.
COLLAGE combines retrieved subsets after retrieval, using target-action likelihood under separately trained reference policies as a proxy for training utility. This removes the need for policy rollouts to estimate weights, but still requires training those reference policies and a final task policy.
2 Related Work
Earlier few-shot methods retrieve by state/action, optical-flow, language or visual similarity. STRAP retrieves visual sub-trajectories; COLLAGE retains that matching structure while combining multiple retrieval signals. Concurrent DataMIL learns data utility through a different supervised approach and could supply another candidate subset.
Zero-shot replay methods seek demonstrations directly executable in the target setting; COLLAGE instead learns from retrieved data plus target demonstrations. Its late fusion combines datasets, not raw sensor representations. The weights resemble importance-based sampling, but are likelihood-derived heuristics rather than a demonstrated unbiased density-ratio correction.
3 Collage
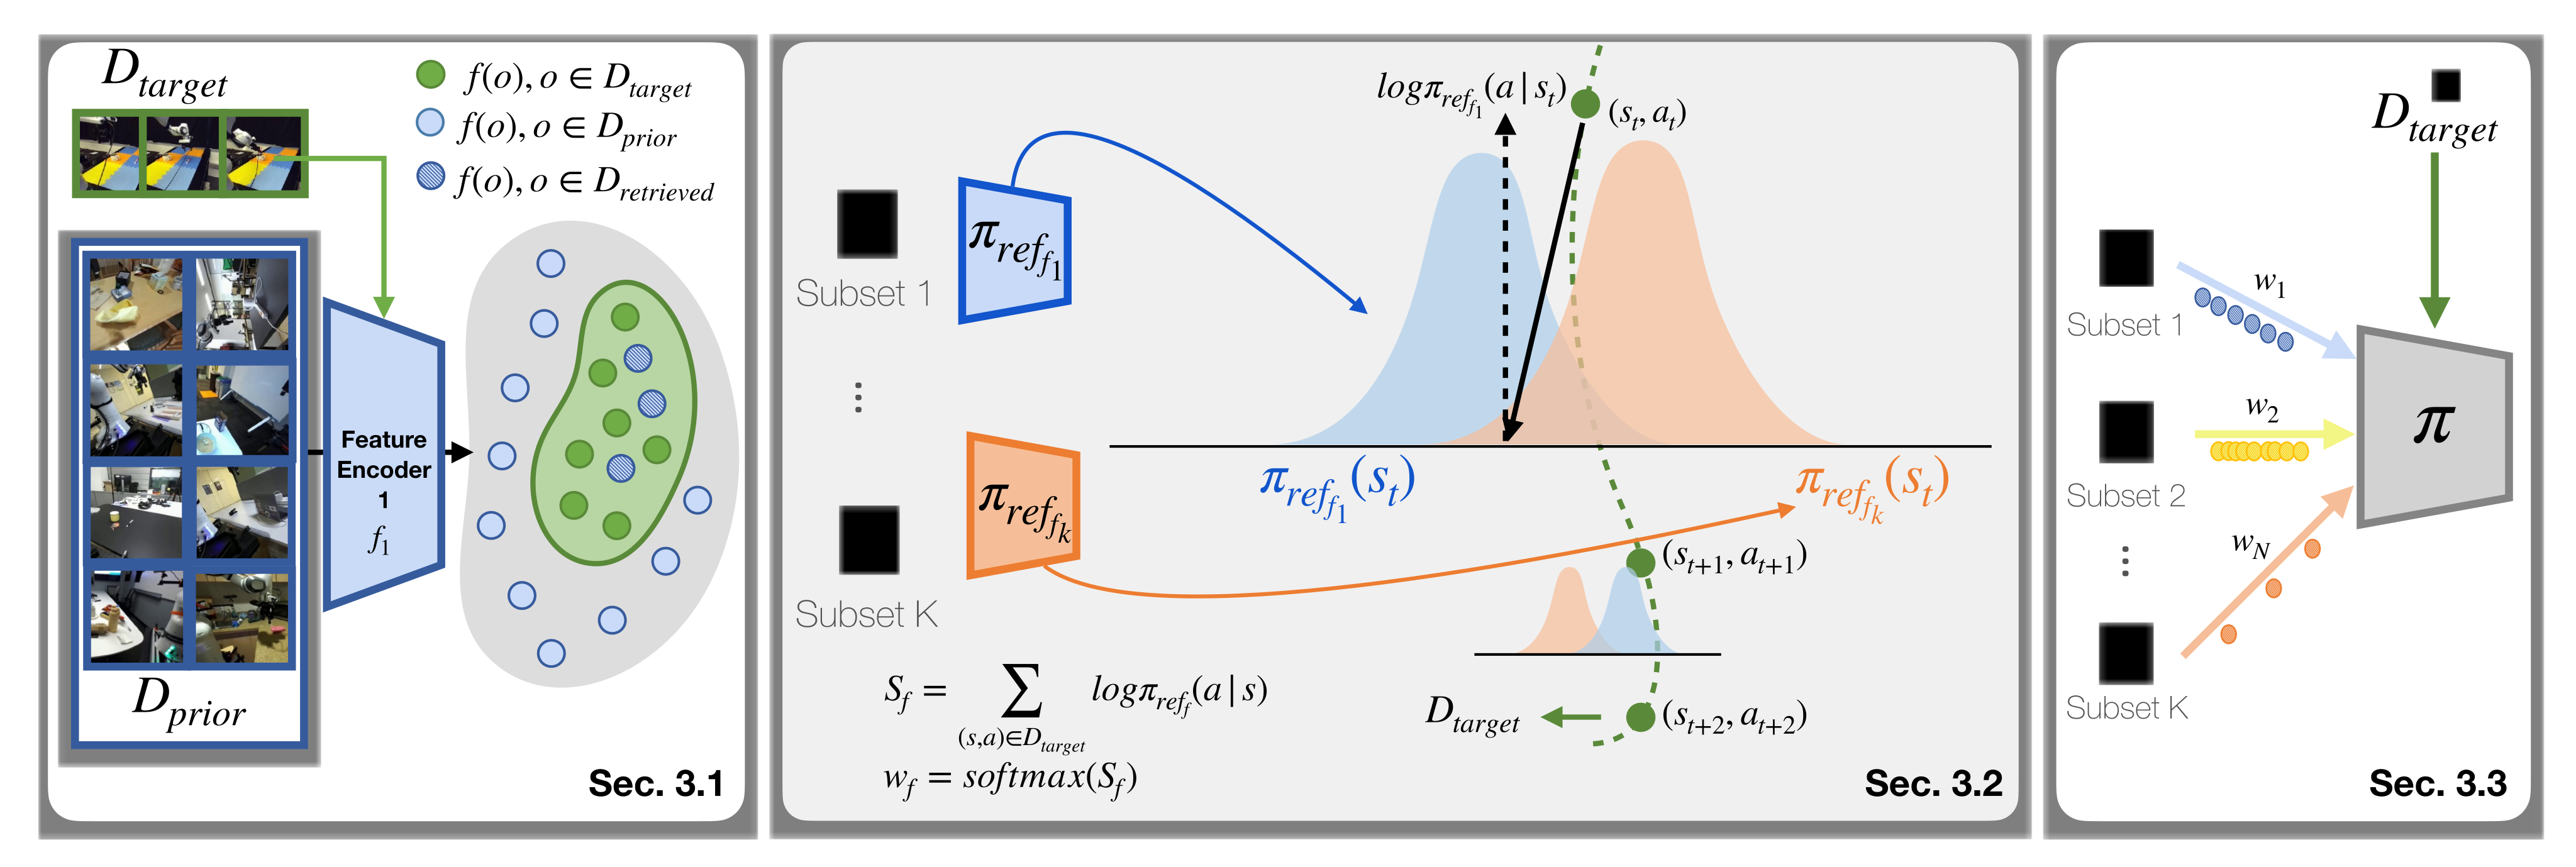
Given a small target dataset and a much larger prior corpus, retrieve a separate subset for every modality, estimate one relevance weight per subset, and train a language-conditioned policy from their weighted mixture plus the target examples.
Observations may include RGB, depth and robot state. The framework accepts different feature encoders and retrieval granularities, although the experiments instantiate four specific modalities and one policy family.
3.1 Retrieval Across Multiple Modalities
Split each target trajectory at pauses in end-effector motion. For each modality, embed the observations and construct a pairwise feature-distance matrix between a target segment and each prior trajectory. Subsequence dynamic time warping matches the complete target segment to a contiguous portion of the longer demonstration.
Retrieve the K lowest-cost matches independently for each modality, retaining their original language instructions. Most modalities use sub-trajectories; language retrieval selects whole demonstrations and adjusts their sampled data budget.
3.2 Estimating the Weights for Retrieved datasets
Train one behavior-cloning reference policy solely on each modality’s retrieved subset. Sum its log-likelihood of state/action/instruction triples from the target demonstrations, then apply a temperature-scaled softmax across modalities. Higher target likelihood gives the corresponding subset a higher final sampling probability.
The score measures action fit on the available examples, not directly measured rollout success or a calibrated probability of dataset usefulness. The target demonstrations are subsequently reused in final training; appendix details average scores across late reference-policy checkpoints.
Equations 1–2
| (1) |
| (2) |
3.3 Retrieval Augmented Policy Learning
The final transformer consumes a history of observations and a task instruction, then predicts an action chunk through a Gaussian-mixture head. Training minimizes negative action log-likelihood with L2 parameter regularization.
For each modality, form an augmented set containing its retrieved data and the target demonstrations. Sample among these augmented sets with the estimated modality weights. Thus adaptation changes the training distribution, not an online retrieval or mixture-of-policies decision at execution time.
Equation 3
| (3) |
3.4 Feature Modalities for Data Retrieval
Visual retrieval uses DINOv2 image embeddings. Motion retrieval computes GMFlow optical flow over a policy-related temporal offset, trains a compact encoder–decoder to reconstruct it, and retrieves using the learned latent. Motion features therefore require prior-corpus pretraining.
Shape retrieval converts foreground depth into point clouds and embeds them with pretrained PointNet++. Language retrieval compares instruction embeddings. These complementary signals can recover similar actions despite visual differences, or distinguish goals among visually similar scenes. Their usefulness still depends on retrieval quality and available sensors/annotations.
4 Experiments
Experiments test ten simulated LIBERO tasks and six physical manipulation tasks, asking whether multimodal retrieval, transfer from a separately collected corpus and adaptive weighting improve few-shot policy learning.
4.1 Experimental Setup
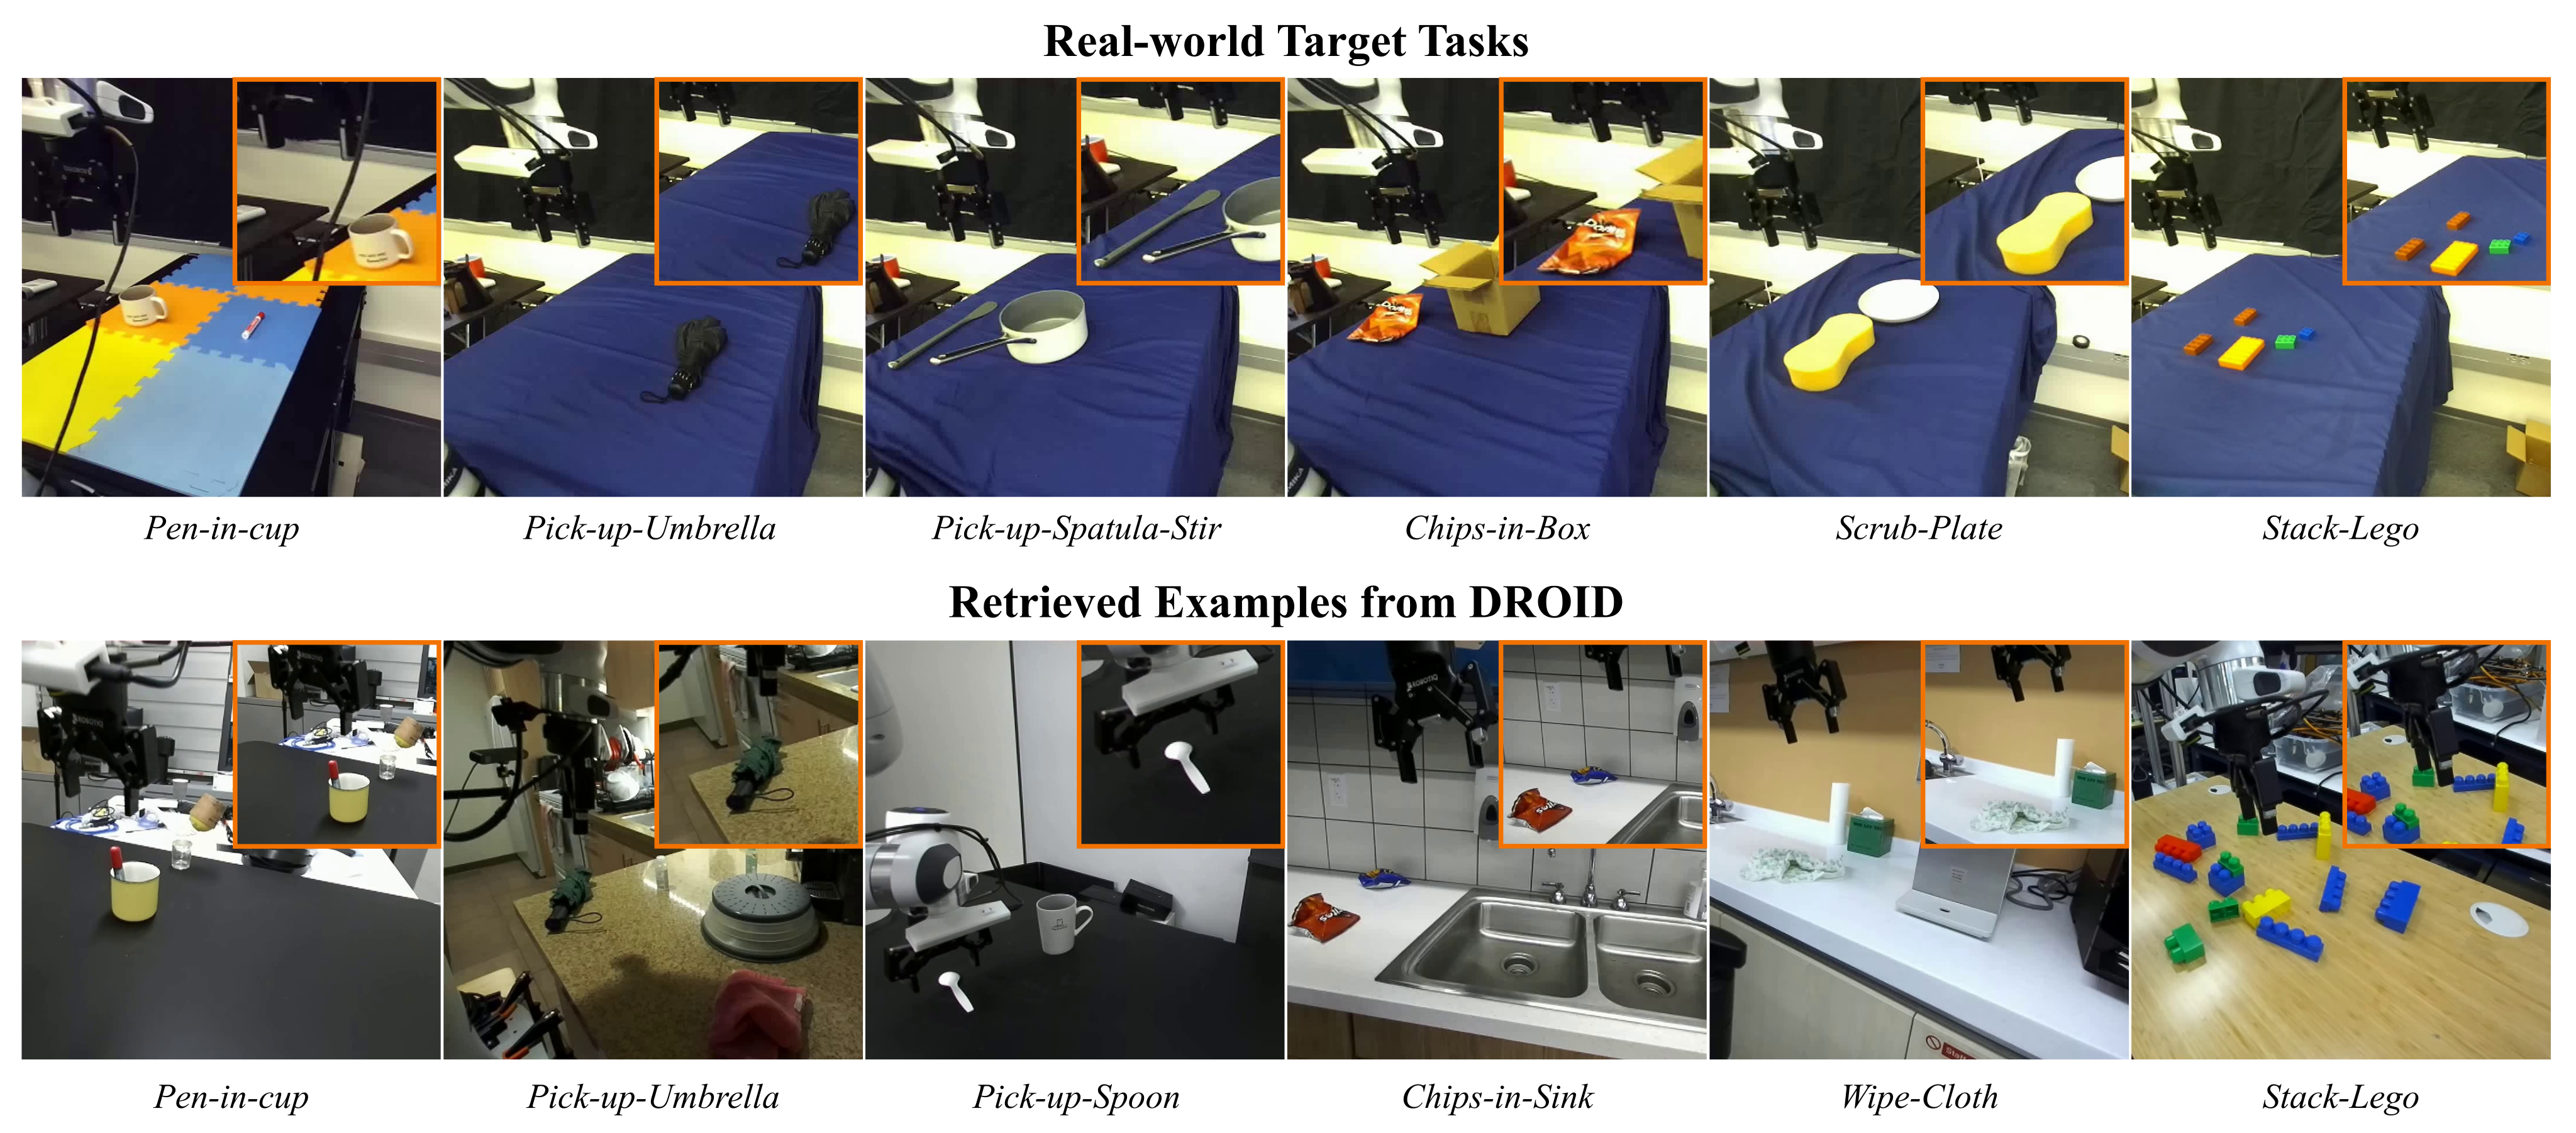
Simulation uses five target demonstrations per LIBERO-10 task and 4,500 prior demonstrations from LIBERO-90. Physical experiments use a Franka Panda, five demonstrations per task, and 30,000 language-annotated successful DROID episodes randomly selected from 50,000 successes.
The six physical tasks place a pen in a cup, pick up an umbrella, stir with a spatula, put chips into a box, stack blocks and scrub a plate. DROID differs visibly from the target setup and can contribute related partial behaviors even without an exact task match.
Baselines include target-only behavior cloning, all-data multitask learning, state/action and flow retrieval, published STRAP results, reproduced visual retrieval, the other individual modalities and uniform fusion. Simulation reports three seeds and 50 trials; physical evaluation uses 15 trials per task and method.
4.2 Results
COLLAGE reaches 50.5% mean simulated success, versus 45.4% reproduced visual retrieval, 45.6% published STRAP, 44.8% shape retrieval and 46.9% uniform fusion. Its 5.1-point gain over reproduced visual retrieval is 11.2% relative; the gain over the strongest tabulated published baseline is about 10.7%. All averages include Moka-Moka, where every method scores zero.
Adaptive weighting beats uniform fusion on seven of nine nonzero tasks, not all tasks as the main prose claims. It trails uniform fusion on Mug-Mug and Mug-Pudding, and trails single modalities on several tasks. Book success improves 66.0→89.3 versus reproduced visual retrieval, a 23.3-percentage-point increase.
Physical successes are 6/15 pen, 6/15 umbrella, 9/15 stirring, 7/15 chips, 6/15 blocks and 7/15 scrubbing. The 41/90 total is about 45.6%, versus visual retrieval’s 26/90 (28.9%); rounded table percentages yield the headline 57.4% relative gain. COLLAGE loses to visual/motion retrieval on chips and ties shape on blocks.
The source says target-only BC averages 0.5/15 physical successes, but its table totals 6/90: one success per task on average. Task-specific weights illustrate selectivity, not a universal correspondence between a modality’s isolated success and its learned weight. Original tables retain all reported values.
| Tasks | Mug-M | Book | Cheese | Soup-Sa | Mug-Mi | Soup-C | Bowl | Stove | Mug-P | Avg. |
|---|---|---|---|---|---|---|---|---|---|---|
| BC | ||||||||||
| MT | ||||||||||
| BR [13] | ||||||||||
| FR [14] | ||||||||||
| STRAP [15] | ||||||||||
| Motion | ||||||||||
| Language | ||||||||||
| Shape | ||||||||||
| Visual [15] | ||||||||||
| NA-Fusion | ||||||||||
| Collage |
| Method | Pen | Umb | Stir | Chips | Lego | Scrub | Avg. |
|---|---|---|---|---|---|---|---|
| BC | |||||||
| MT | |||||||
| Visual [15] | |||||||
| Motion | |||||||
| Shape | |||||||
| Language | |||||||
| Collage |
5 Conclusion
Late fusion of independently retrieved demonstration subsets improves mean few-shot policy performance in these simulation and physical experiments. The useful contribution is task-specific training-data weighting, with evidence that complementary cues can outperform a larger single-modality retrieval set.
6 Limitations
If every modality retrieves irrelevant examples, reweighting cannot supply missing skills. Four reference policies add compute, and target-action fit is only a proxy for subsequent policy performance. The authors propose cheaper reference-policy approximations or utility predictors as future work.
The evaluated tasks use one physical robot and small trial counts. Simulation includes seed variability, but the paper provides no analogous physical repeated-seed study or broad cross-embodiment evaluation. Average gains should not be presented as uniform task-level dominance.
Acknowledgments
The authors acknowledge manuscript feedback and discussions, NSF IIS-2504906 and gifts from Adobe/Google for Georgios Pavlakos, and DARPA TIAMAT HR0011-24-9-0428 for Roberto Martín-Martín.
Appendix A Appendix
The appendix retains complete task mappings, per-seed variability, equal-size retrieval comparisons, modality-weight diagnostics and implementation details for both environments.
A.1 Details of Simulated Experiments
Table 4 expands task abbreviations; Table 5 includes all ten tasks and their standard deviations. Table 6 controls retrieved-set size: visual-only K=400 reaches 46.9% versus COLLAGE’s 50.5%, with roughly 25,000 training sequences in each. COLLAGE uses 100 segments per modality, totaling 400; the table caption’s shorthand should not imply 400 per modality.
Simulation retrieval uses agent-view 128×128 images. DINOv2 averages patch and classification-token embeddings into 768 dimensions. GMFlow uses a five-frame offset; a convolutional/transformer autoencoder compresses flow through a 512-dimensional token to a 256-dimensional latent. Shape features are 256-dimensional PointNet++ embeddings pretrained on ModelNet40, with simulator-provided depth and foreground masks.
The language pipeline specifies text-embedding-ada-002, cosine similarity above 0.90 and a budget matched to visual retrieval, distributed across selected demonstrations. Reference 49 instead names text-similarity-ada-001; the implementation description and bibliography disagree.
Segmentation uses the sum of absolute end-effector coordinate differences with threshold 5×10⁻³. The text says it merges sub-trajectories longer than 20 to address over-segmentation, an unclear heuristic that should be checked in code. BR/FR retrieve state/action pairs with temporal padding; their printed padding indices are also ambiguous.
Final policies use agent and wrist views, batch size 32, 60,000 steps, five target demonstrations and temperature 2. Seeds are 1234, 42 and 4325. The authors distinguish published STRAP from their visual reproduction and attribute task-level discrepancies to training stochasticity.
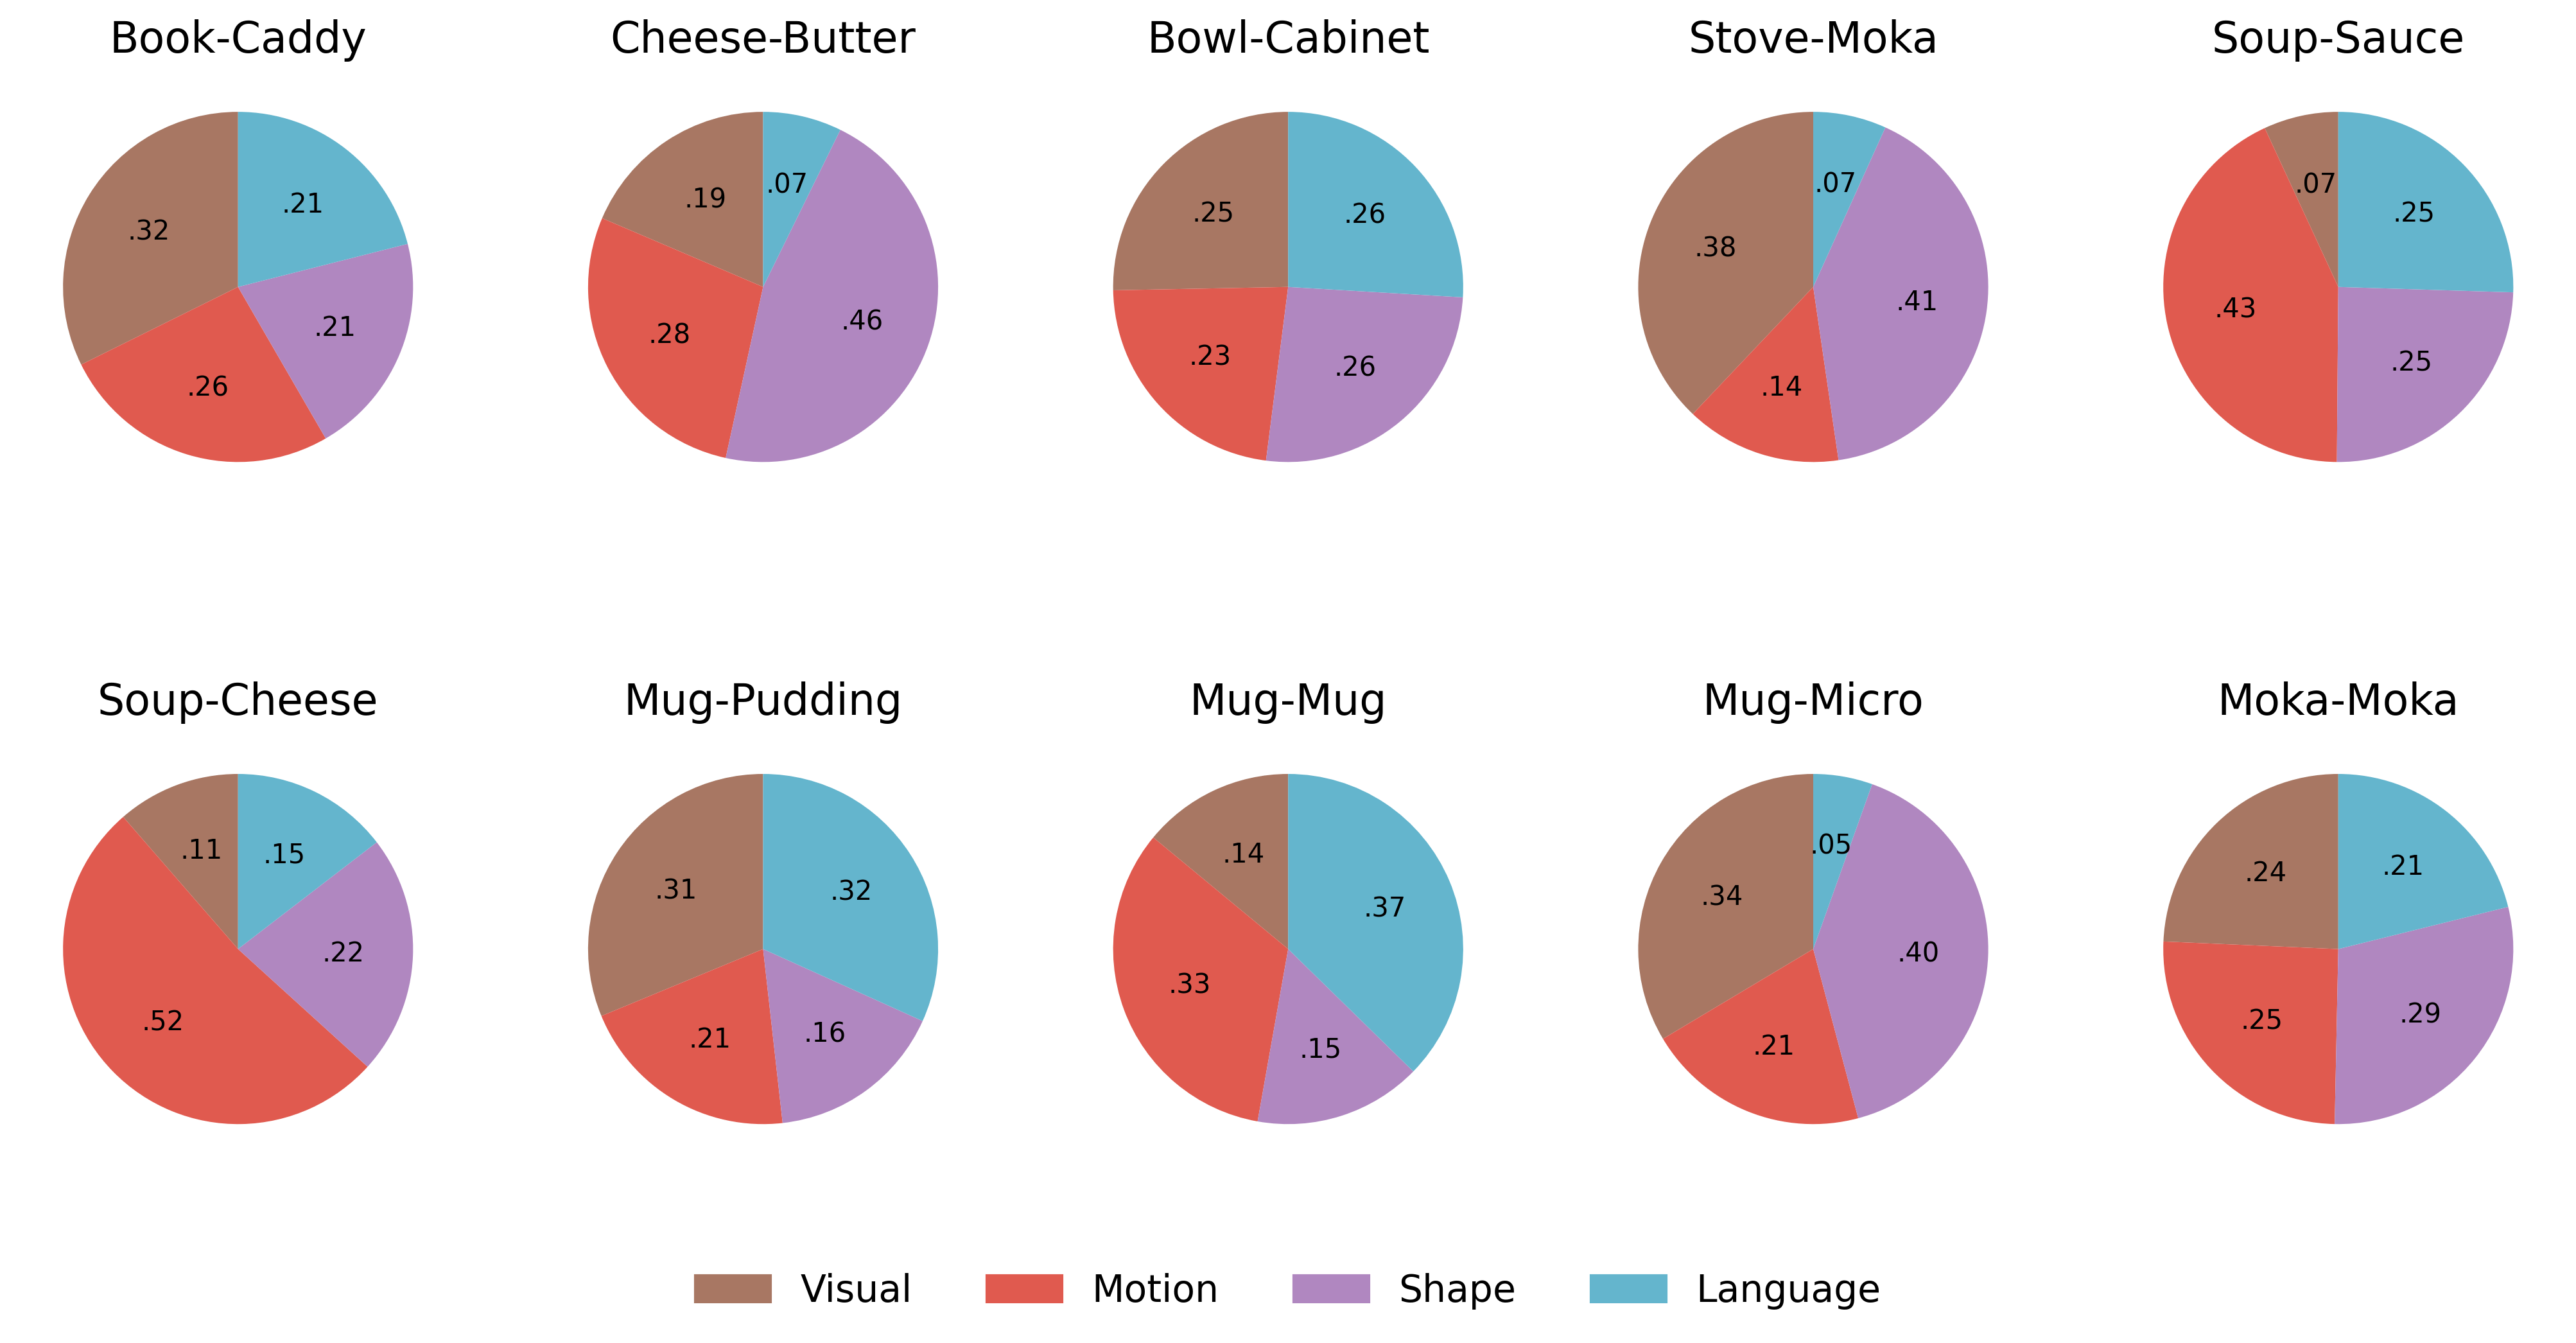
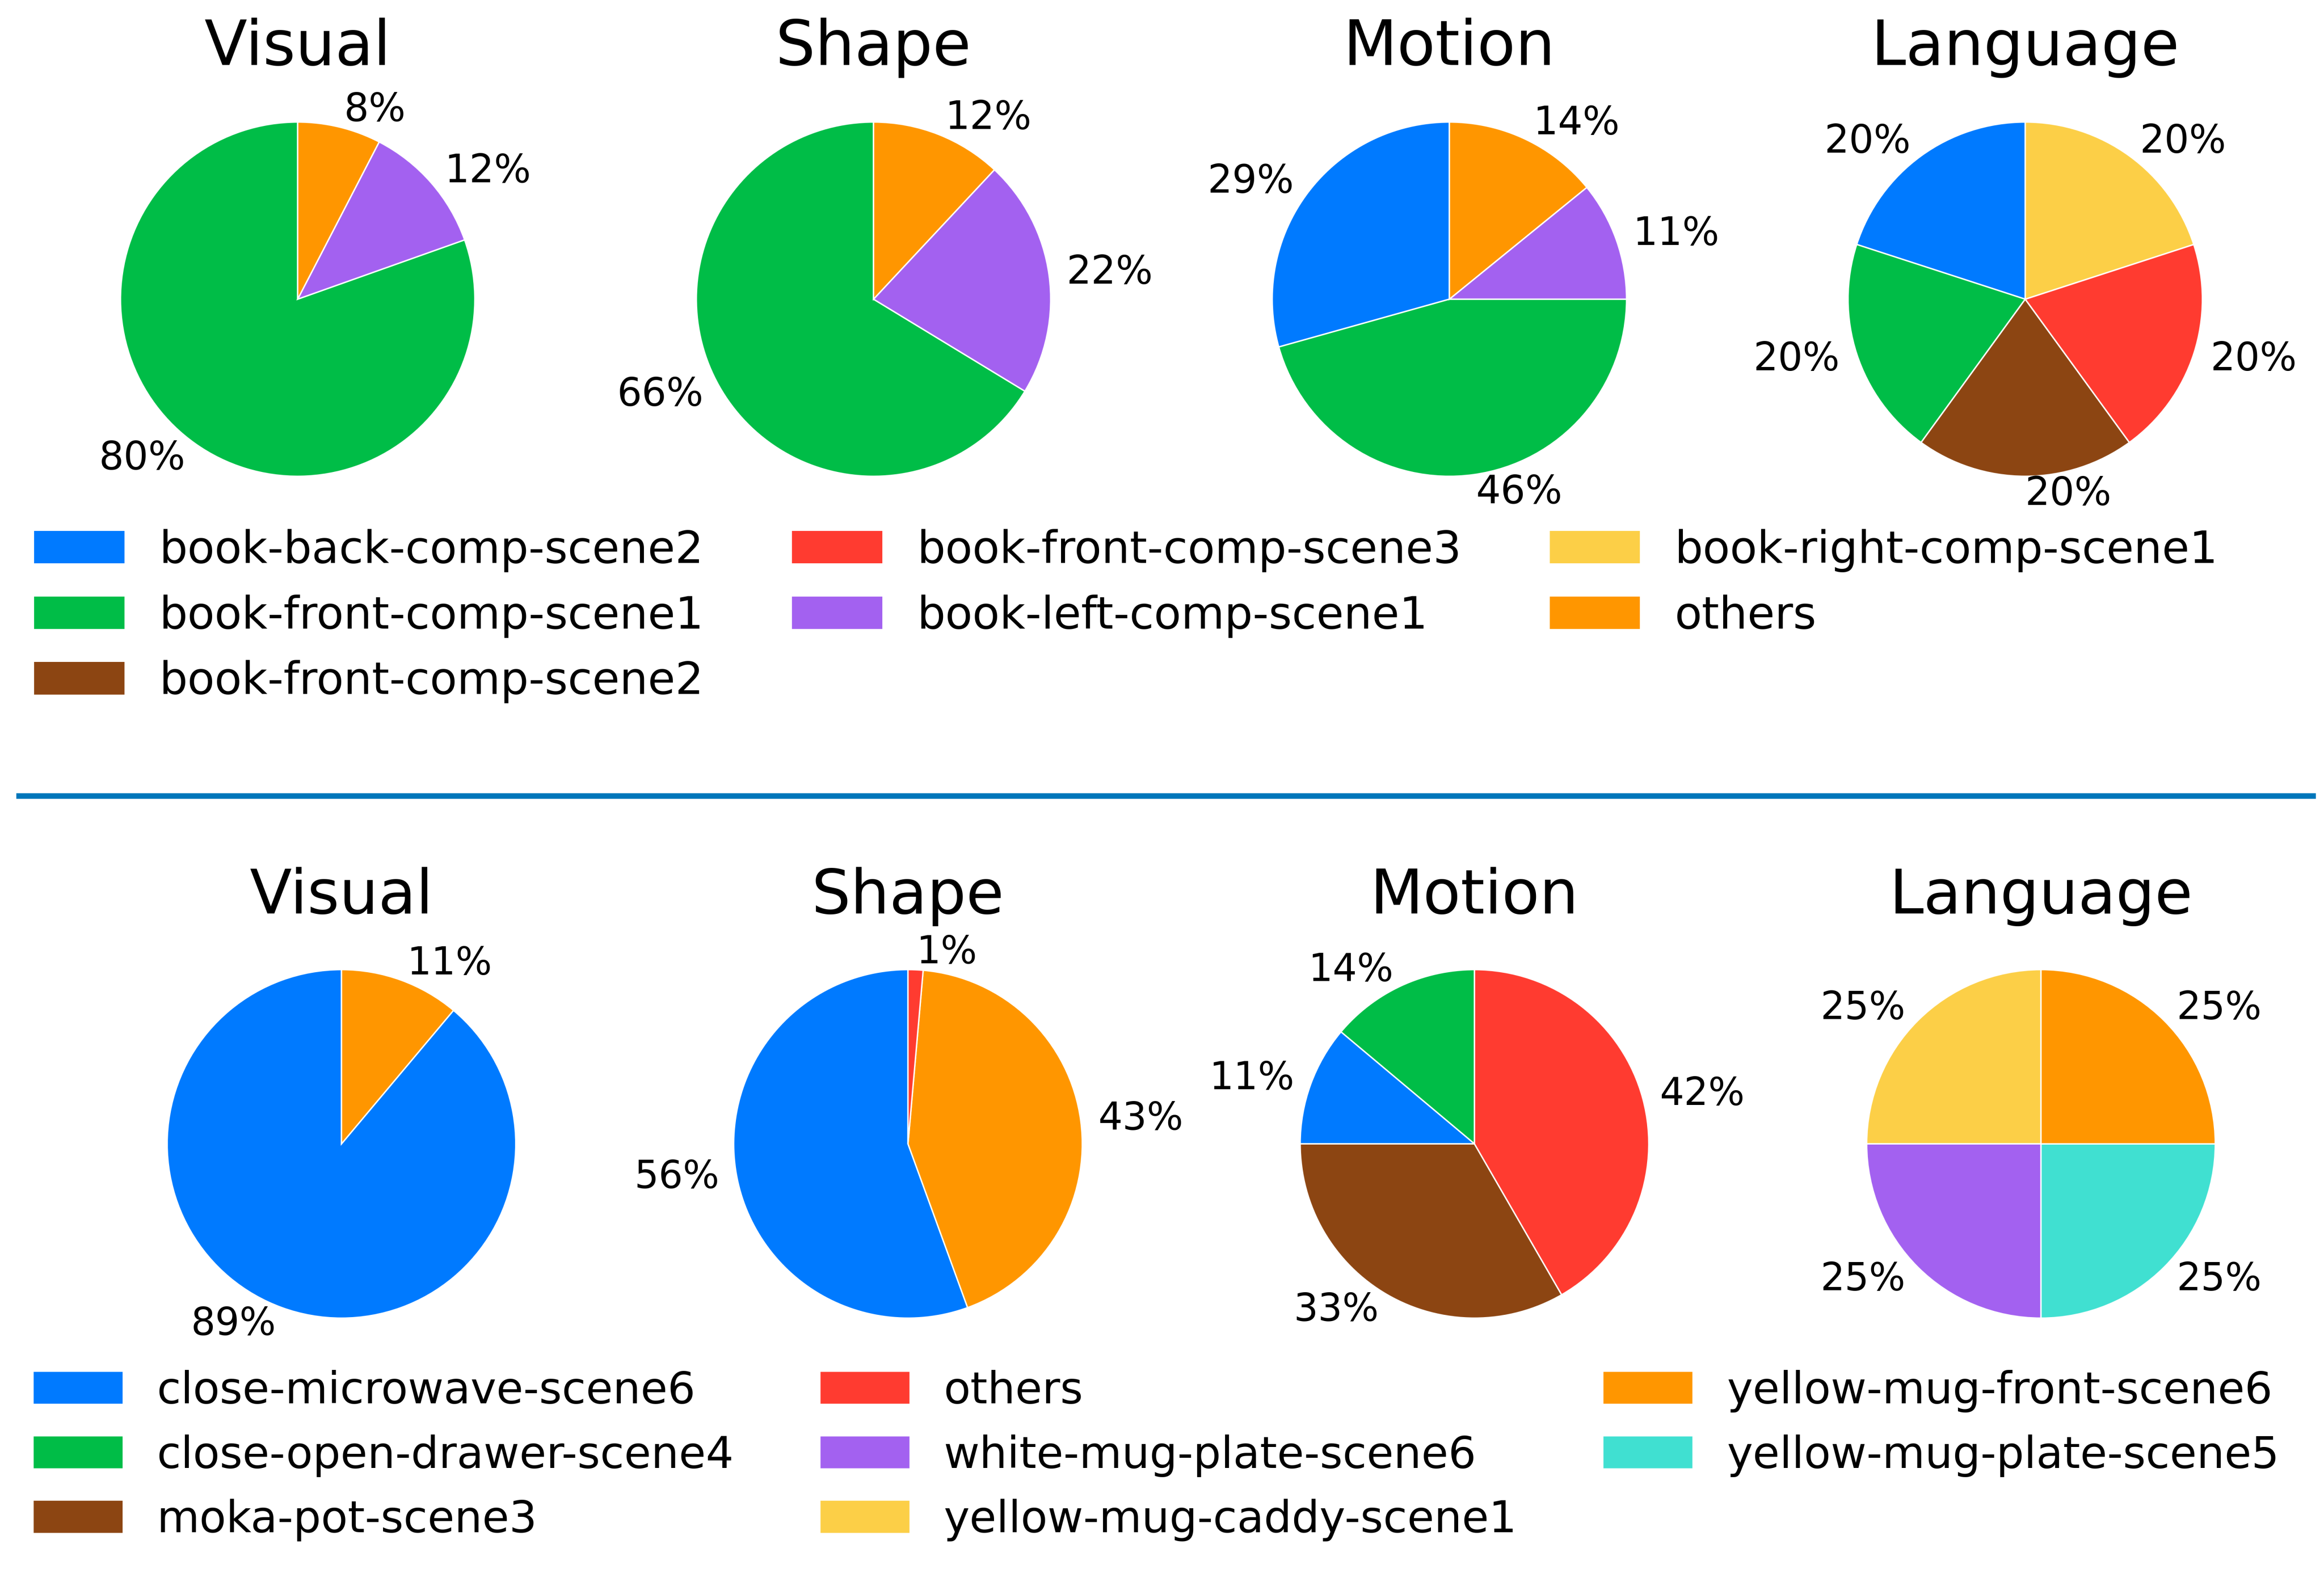
Figure 4 preserves all task-specific modality weights. Figure 5 shows that appearance may retrieve the right scene but wrong goal, while motion/language recover the goal elsewhere. For Mug-Microwave, language receives only 0.05 weight. These are explanatory examples, not isolated causal tests. Original implementation links remain available: FlowRetrieval, STRAP retrieval, STRAP policy training and Robomimic.
| Abbr. (Tab. 1) | Abbr. (Tab. 5, Fig. 4) | Task Name in LIBERO-10 |
|---|---|---|
| Mug-M | Mug-Mug | LIVING ROOM SCENE5 put the white mug on the left plate and put the yellow and white mug on the right plate |
| Book | Book-Caddy | STUDY SCENE1 pick up the book and place it in the back compartment of the caddy |
| Cheese | Cheese-Butter | LIVING ROOM SCENE2 put both the cream cheese box and the butter in the basket |
| Soup-Sa | Soup-Sauce | LIVING ROOM SCENE2 put both the alphabet soup and the tomato sauce in the basket |
| Soup-C | Soup-Cheese | LIVING ROOM SCENE1 put both the alphabet soup and the cream cheese box in the basket |
| Stove | Stove-Moka | KITCHEN SCENE3 turn on the stove and put the moka pot on it |
| Mug-Mi | Mug-Micro | KITCHEN SCENE6 put the yellow and white mug in the microwave and close it |
| Mug-P | Mug-Pudding | LIVING ROOM SCENE6 put the white mug on the plate and put the chocolate pudding to the right of the plate |
| Bowl | Bowl-Cabinet | KITCHEN SCENE4 put the black bowl in the bottom drawer of the cabinet and close it |
| Tasks | Mug-M | Book | Cheese | Soup-Sa | Mug-Mi | Soup-C | Bowl | Stove-Mo | Mug-P | Avg. |
|---|---|---|---|---|---|---|---|---|---|---|
| Visual () | ||||||||||
| Collage |
A.2 Details of Real World Experiments
Real-world shape retrieval reconstructs depth from DROID’s ZED stereo videos through the ZED API, obtains foreground masks with DECOLA, then applies PointNet++. The three camera-view embeddings are averaged for retrieval; trained policies also use all three views.
Physical settings use K=100, segmentation threshold 2×10⁻³, temperature 10 and 50,000 final-policy training steps. The larger temperature softens weights under the greater prior/target mismatch. Other settings follow the simulation pipeline and DROID collection/rollout setup.
A.3 Weight Estimation Implementation Details
Each reference policy trains for 100 epochs. Evaluate summed target-action log-likelihood at epochs 60, 70, 80, 90 and 100, then average the five scores before softmax. Early checkpoints are omitted for high variance; the authors avoid longer reference training because of overfitting.
Each reference policy takes about 40 minutes, with all four trained in parallel; scoring adds about 1.5 minutes. The final policy takes about two hours. The wall-time overhead assumes that parallel capacity and does not quantify total retrieval/feature-pretraining cost or full compute-hours.
Equations 4–5
| (4) |
| (5) |
A.4 Subsequence Dynamic Time Warping (S-DTW)
DTW minimizes accumulated local costs along a monotone, continuous alignment path, using the previous horizontal, vertical or diagonal cost. Subsequence DTW relaxes endpoint alignment so the entire short query can match a contiguous interval of the longer reference trajectory.
The appendix retains the recurrence and objective definitions, then applies them to modality embeddings and selects the lowest-cost prior segments. It specifies squared Euclidean feature distance, while the main method writes unsquared Euclidean distance; this reproduction discrepancy is preserved and flagged. Correct subsequence boundary initialization is required rather than ordinary full-sequence endpoint constraints.