At a glance
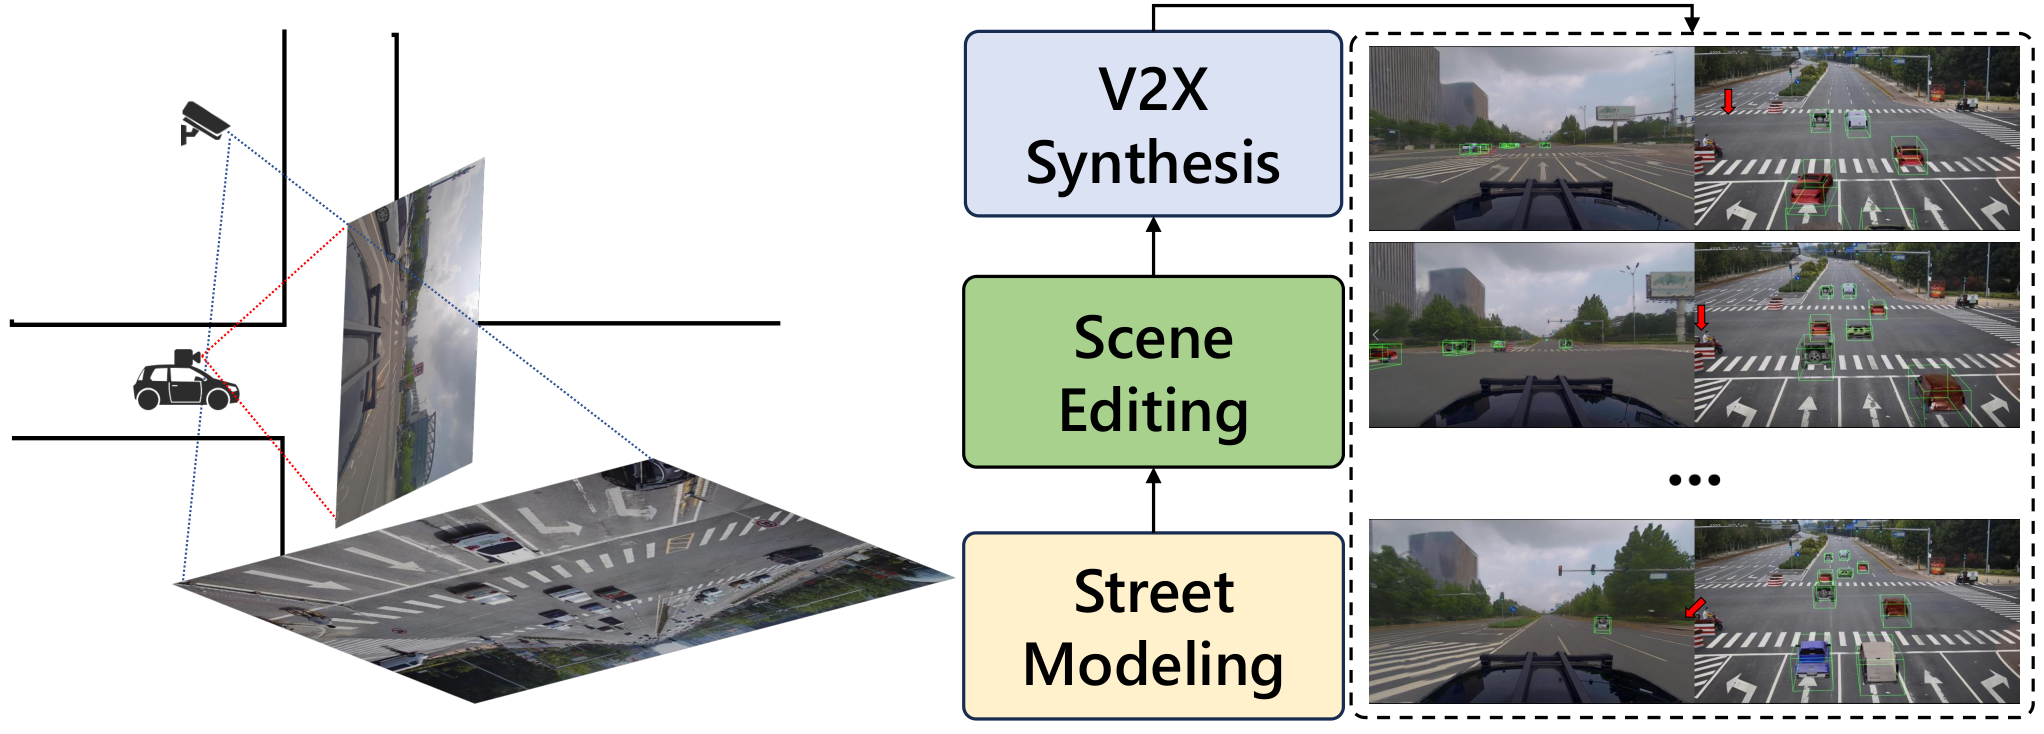
CRUISE reconstructs vehicle–infrastructure scenes as editable Gaussian representations, inserts generated vehicle assets and trajectories, and renders synchronized images with 3D annotations from both viewpoints. Experiments use the synthetic data to train detection and tracking models on V2X-Seq. Mixing real and generated data improves the reported perception metrics, while generated-only results are mixed across views. The demonstrated system is a reconstruction and augmentation pipeline; closed-loop driving evaluation remains a proposed application.
I Introduction
Cooperative perception depends on complementary vehicle and roadside observations, but realistic paired data are difficult to collect and annotate. CRUISE decomposes real scenes into static backgrounds and dynamic vehicles so that traffic can be edited while preserving both views. Its evidence concerns reconstruction quality, limited-sequence data augmentation, and qualitative occlusion cases. Broader claims about driving safety or a complete closed-loop data ecosystem are motivations rather than evaluated outcomes.
II Related Work
The method brings editable dynamic scene reconstruction into vehicle–infrastructure cooperative perception.
II-A Autonomous Driving Simulation
Radiance fields and Gaussian splatting provide appearance reconstruction from recorded driving data. Dynamic methods separate moving traffic from static surroundings. CRUISE adopts Street Gaussians [28], including tracked object poses and time-dependent appearance, then adapts data processing and reconstruction losses for paired roadside and vehicle observations.
II-B V2X Cooperative Perception
Cooperative perception combines observations to reduce occlusion and expand coverage. Existing work includes detection, tracking, forecasting, and simulation platforms. CRUISE uses V2X-Seq [43] to evaluate whether reconstructed and edited paired images provide useful additional training data; it does not replace the downstream perception algorithms.
III Formulation & Preliminaries
A Gaussian’s covariance is parameterized through rotation and scale. A scale penalty encourages surface-like flattened primitives, while a ratio penalty discourages highly elongated in-plane shapes that produce needle-like artifacts. These geometric regularizers complement image and depth supervision rather than enforcing a complete physical scene model.
Equations 1–2
| (1) |
| (2) |
IV Proposed Method
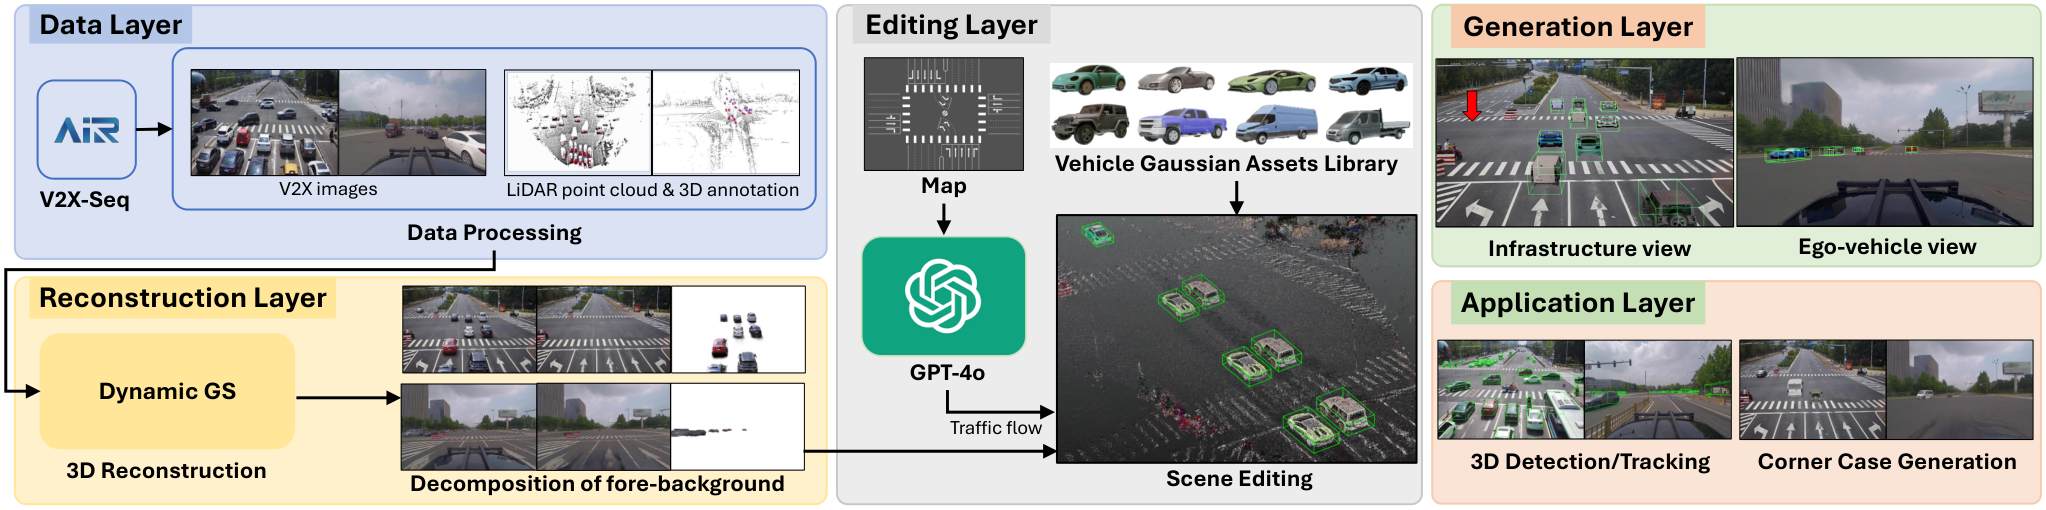
The pipeline processes recorded data, reconstructs separable backgrounds and objects, edits traffic using generated assets and proposed trajectories, renders annotated paired views, and trains downstream perception models. Each stage supplies assumptions and supervision that affect synthetic-data quality.
IV-A Data Processing and Scene Reconstructing
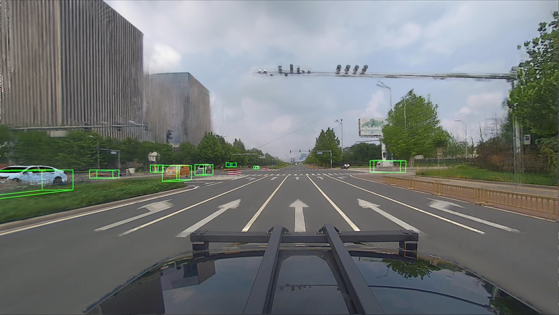
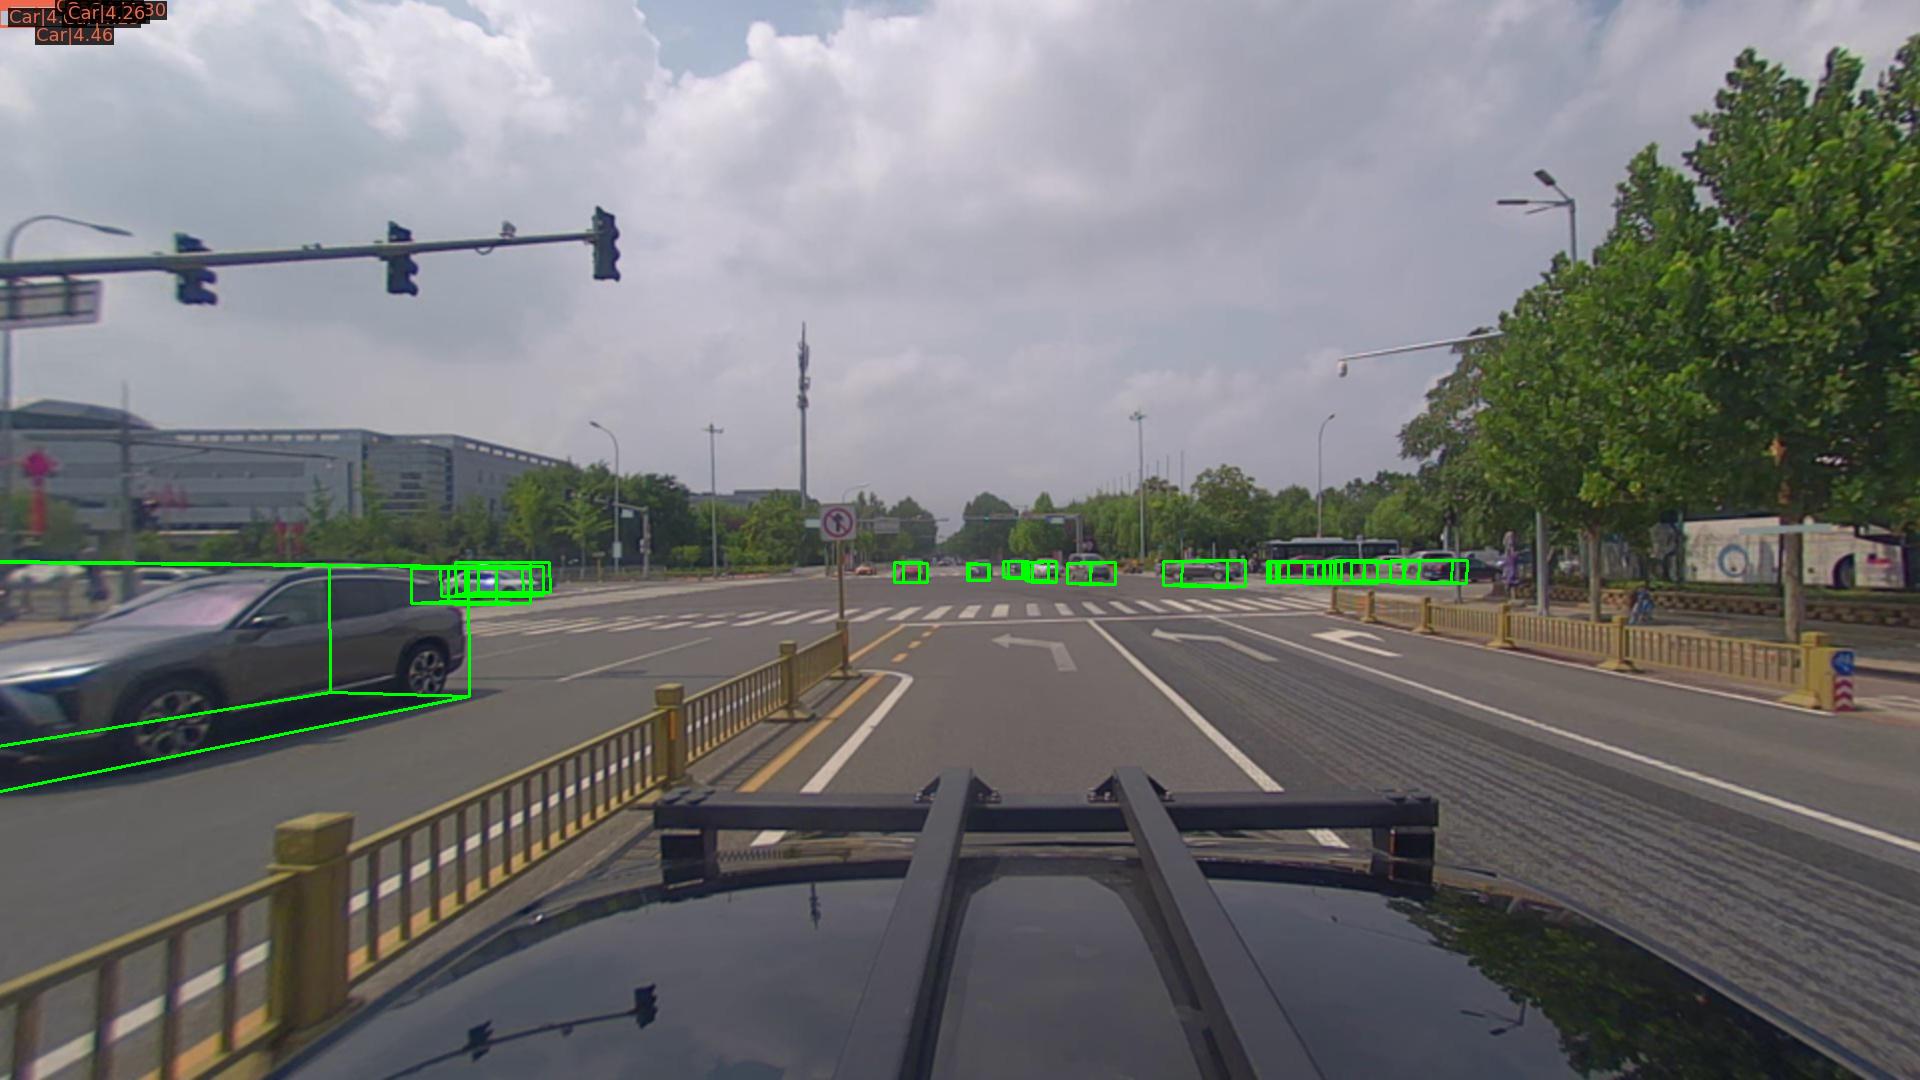
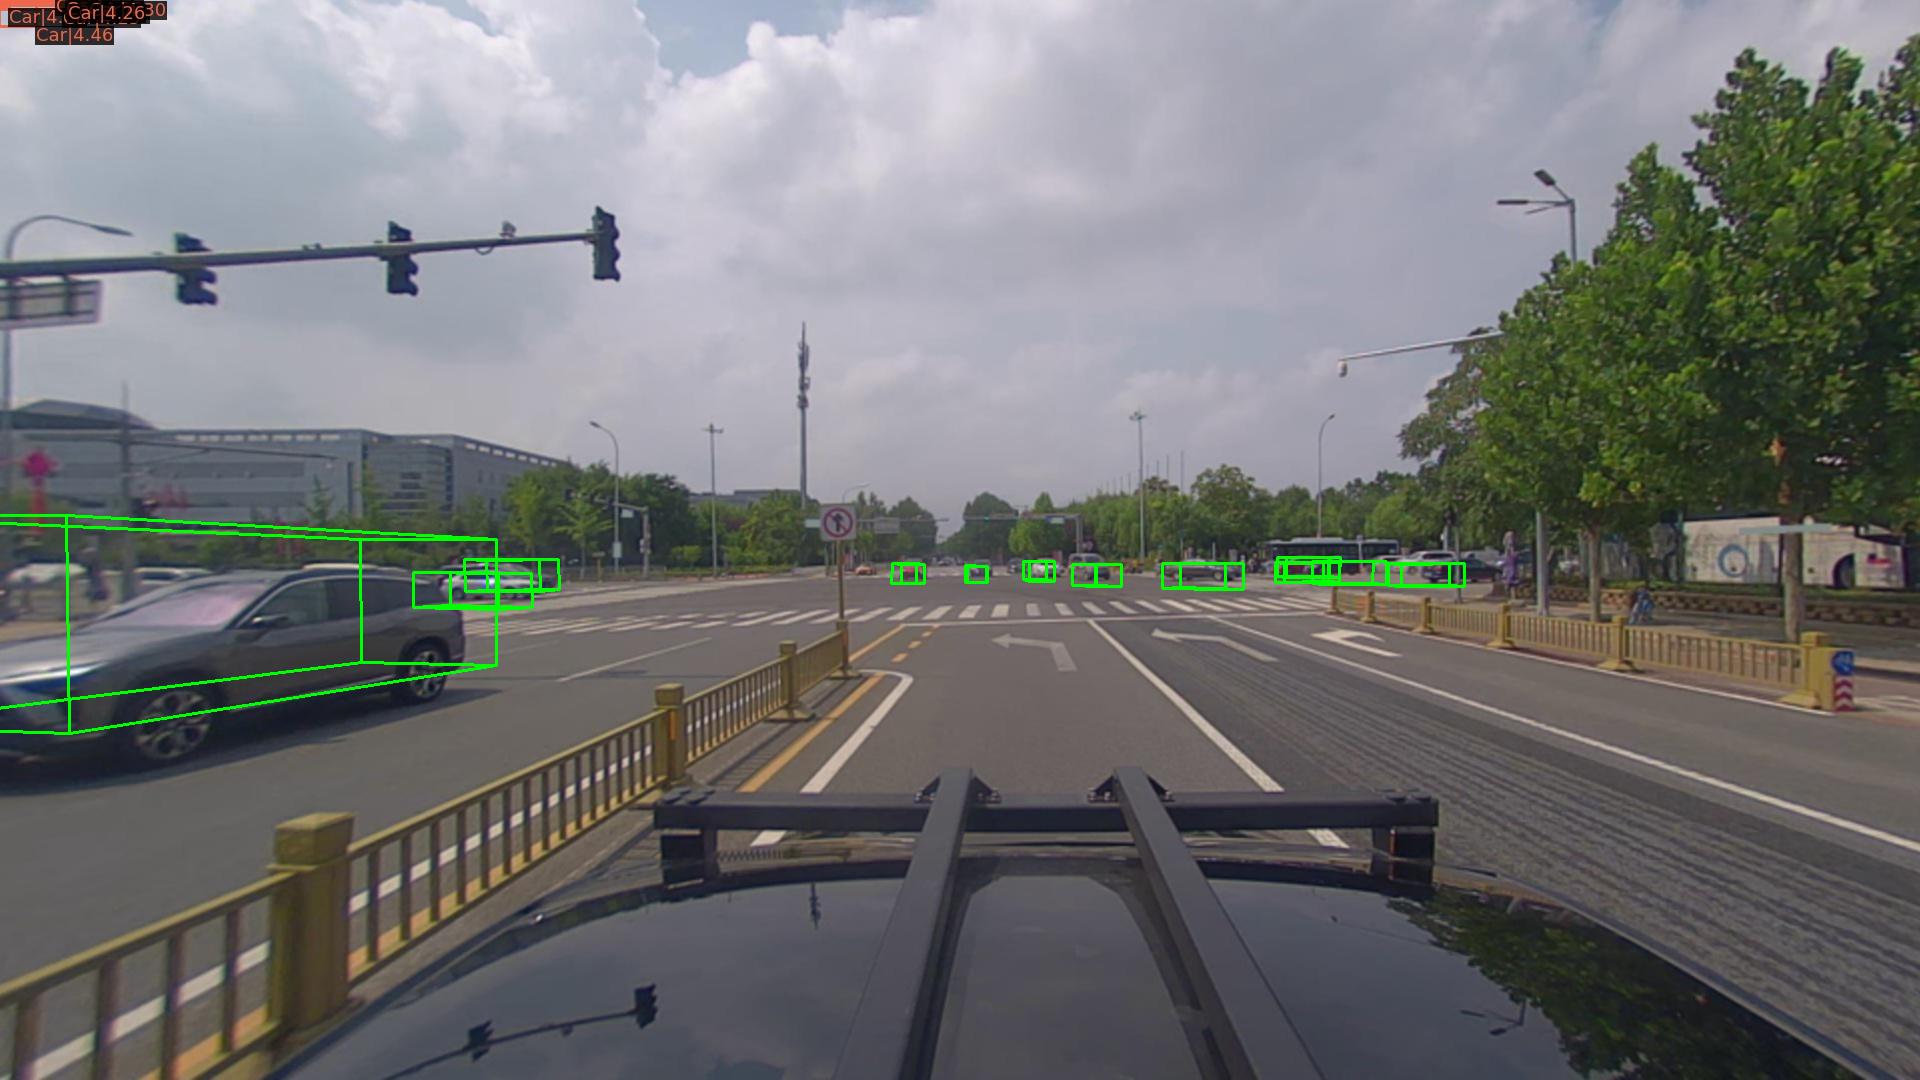
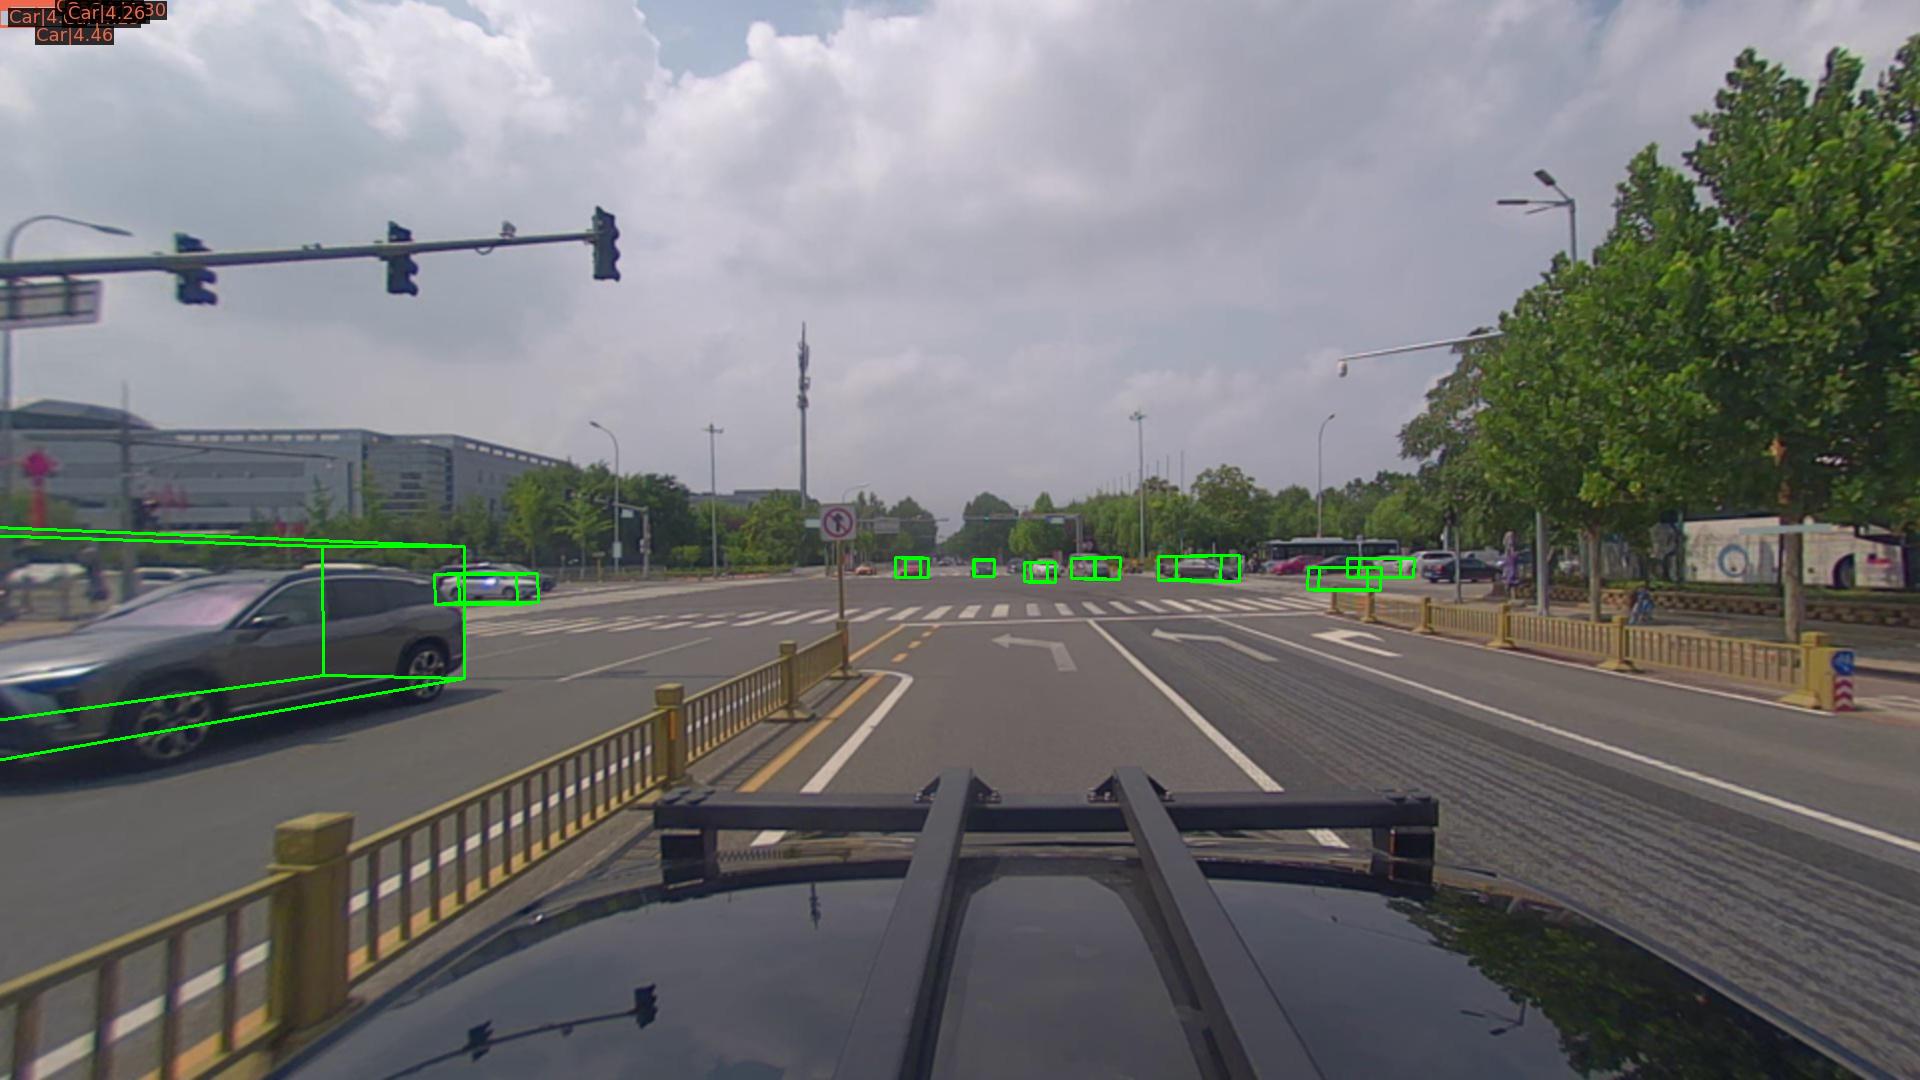
Inputs include RGB images, LiDAR, tracked 3D boxes, and calibration from both sensor platforms. A particular cooperative-data issue is that the ego-vehicle box can enclose much of its own camera frustum and incorrectly assign background to a dynamic object. CRUISE removes this box during reconstruction and masks the visible ego-car region. Multi-view LiDAR fusion initializes the background, while tracked multi-frame points densify vehicle models.
Training combines appearance-decoupled color reconstruction, LiDAR depth, predicted normals, sky masks, semantic labels, geometric scale/ratio penalties, and floater/decomposition regularization. The appearance model follows Gaussian Opacity Fields [73]. Thus high-fidelity rendering depends on existing boxes, masks, depth, calibration, and learned auxiliary predictions, rather than only paired images.
Equation 3
| (3) | |||
 |
 |
 |
 |
 |
 |
 |
 |
IV-B Scene Editing and Data Generating
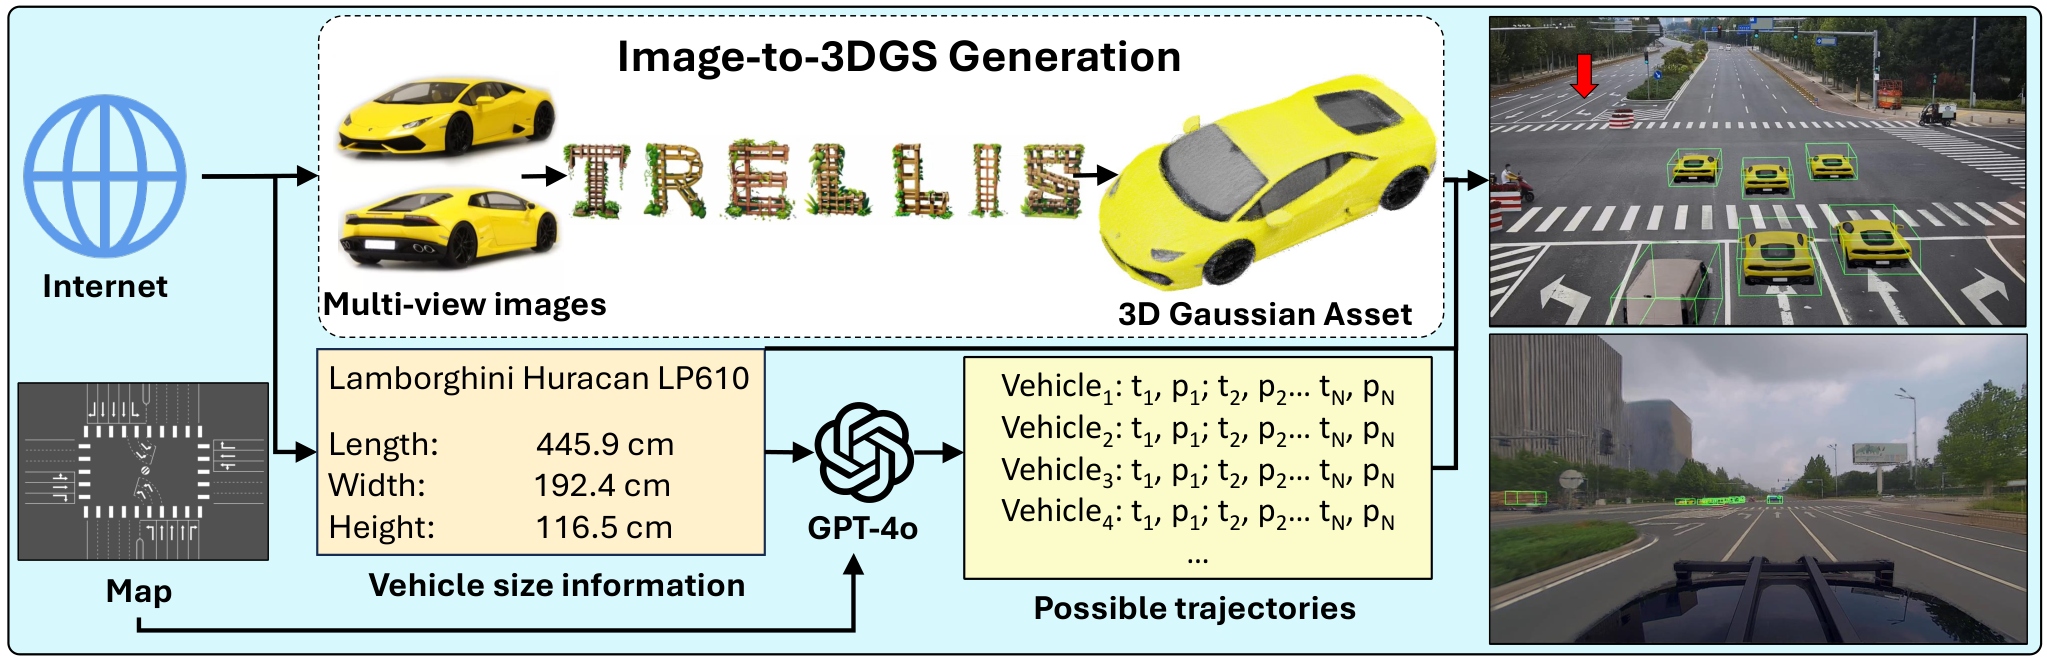
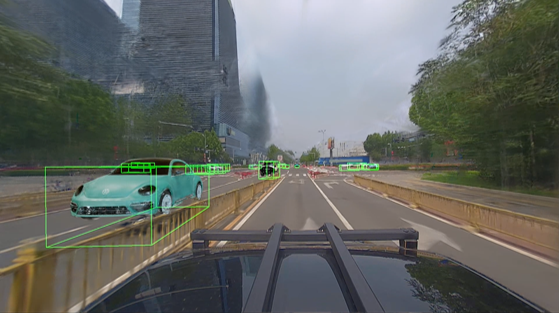
Internet vehicle images and size information feed TRELLIS [77] to generate Gaussian vehicle assets. A simplified intersection lane graph, vehicle dimensions, and ego trajectory sampled every ten frames are given to GPT-4o to propose additional traffic trajectories. Interpolation fills intermediate poses; these poses and dimensions define inserted tracking boxes. The paper does not establish physical or traffic-rule validity for every generated trajectory.
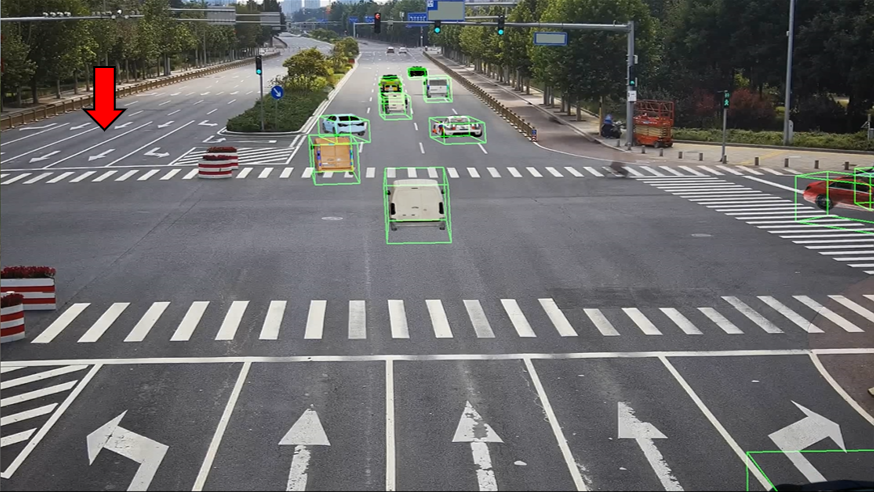
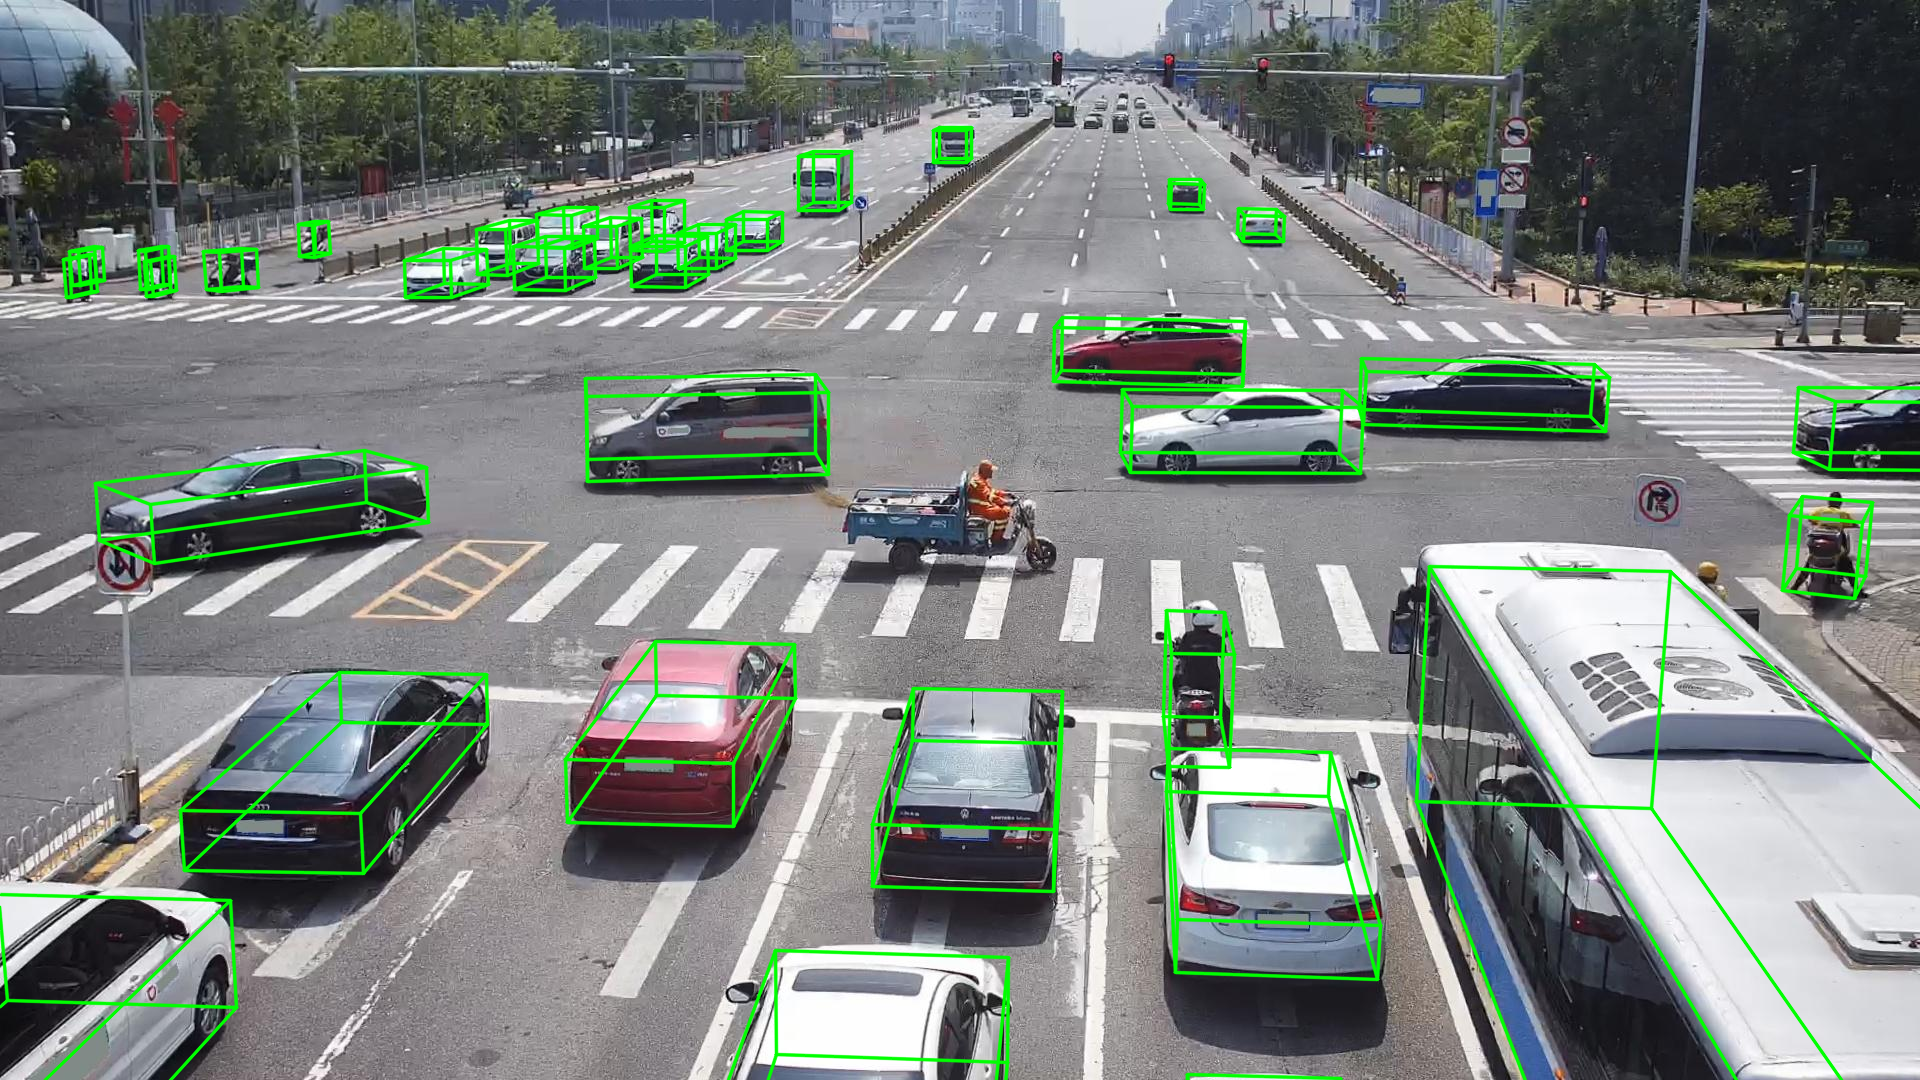
After editing, the scene is rendered from vehicle and infrastructure cameras at corresponding times. The original visible ego-car region is pasted back into the vehicle image. Generated object poses provide synthetic 3D annotations. This yields controllable paired data within the reconstructed scene, rather than arbitrary new environments without reconstruction effort.
IV-C Downstream Application
The evaluated applications are single-view and cooperative 3D detection plus cooperative tracking. Qualitative corner cases illustrate potential stress testing. Closed-loop training, end-to-end driving evaluation, and resulting safety benefits are prospective uses rather than demonstrated experiments.
V Experiments
Experiments compare reconstruction methods and components, then test synthetic-only and mixed real/synthetic training on held-out sequences.
V-A Dataset
V2X-Seq contains 95 sequences from six intersections, recorded at 10 Hz for approximately 10–20 seconds each. Vehicle and roadside units provide cameras and LiDAR, with shared object tracking identifiers and a vector map. CRUISE’s experiments use a subset of this dataset.
V-B Implementation Details
Six sequences from four intersections are reconstructed on an NVIDIA A800 for 50,000 iterations. The downstream models are MonoLSS for vehicle images, BEVHeight for roadside images, and ImVoxelNet for cooperative perception, using the paper’s respective training schedules. The limited number of reconstructed scenes bounds the demonstrated diversity.
V-C Comparison on Reconstruction
Across six reconstructed sequences, the adopted Street-Gaussian configuration reaches PSNR 27.97, SSIM 0.940, and LPIPS 0.095. It leads the listed baselines in SSIM and LPIPS, but PVG has higher PSNR at 28.51. The source’s broad claim of outperforming all methods should therefore be read metric by metric. Bounding-box-based decomposition is additionally useful for editing, independent of these image-quality scores.
V-D Ablation Studies on Reconstruction Modules
Removing normal or geometric regularization slightly reduces reconstruction quality. Removing the ego mask causes the largest PSNR drop, from 27.97 to 24.44, supporting the importance of correct foreground/background assignment. Appearance decoupling also improves all three reported metrics. These component ablations concern reconstruction; the paper does not separately measure each component’s effect on every downstream model.
| Method | Box | PSNR | SSIM | LPIPS |
|---|---|---|---|---|
| 3D-GS [12] | 24.79 | 0.902 | 0.158 | |
| PVG [57] | 28.51 | 0.924 | 0.115 | |
| -GS [29] | 27.54 | 0.931 | 0.097 | |
| HUGS [81] | ✓ | 27.23 | 0.925 | 0.101 |
| Street-GS(Ours) [28] | ✓ | 27.97 | 0.940 | 0.095 |
| Methods | PSNR | SSIM | LPIPS |
|---|---|---|---|
| Ours w/o Normal loss | 27.45 | 0.933 | 0.103 |
| Ours w/o Geo. loss | 27.37 | 0.935 | 0.100 |
| Ours w/o Ego-mask | 24.44 | 0.910 | 0.125 |
| Ours w/o Appearance | 26.89 | 0.929 | 0.117 |
| Complete method | 27.97 | 0.940 | 0.095 |
 |
 |
 |
 |
 |
 |
 |
 |
V-E Results on 3D Detection/Tracking
Training comparisons use 1,000 generated frames and the same number of real frames from the reconstruction sequences. Testing uses eight other sequences from four intersections. The combined-data condition follows the reported reduced training schedule; the paper does not fully break down sample exposure or compute across conditions. Holding out sequences does not by itself establish generalization to entirely unseen intersections.
For vehicle-view detection, real-plus-generated training improves moderate 3D average precision from 37.69 to 41.05 and hard precision from 34.14 to 38.71. Generated-only 3D detection is slightly below real-only across these categories. For infrastructure views, mixed training raises moderate 3D precision from 50.16 to 54.26; generated-only results are stronger in 3D but not uniformly stronger in bird’s-eye metrics.
For cooperative perception, mixed training raises 3D average precision from 14.79 to 15.91 and tracking MOTA from 21.83 to 25.52. Generated-only tracking also improves over real-only. Smoother, complete synthetic boxes are a plausible explanation proposed by the authors, but annotation accuracy is not independently quantified. The findings support augmentation in this protocol without proving that rendered data generally matches real-world authenticity.
| Train data | ||||||
|---|---|---|---|---|---|---|
| Easy | Mod. | Hard | Easy | Mod. | Hard | |
| Real | 56.84 | 37.69 | 34.14 | 66.81 | 46.62 | 44.21 |
| Gen | 54.41 | 36.77 | 34.02 | 65.44 | 47.13 | 45.33 |
| Real + Gen | 61.35 | 41.05 | 38.71 | 67.38 | 49.72 | 47.24 |
VI Discussion
The discussion highlights properties of controllable paired rendering: occlusion-case construction, synchronized views, and known synthetic annotations.
 |
| (a) |
 |
| (b) |
VI-A Corner Case Generation.
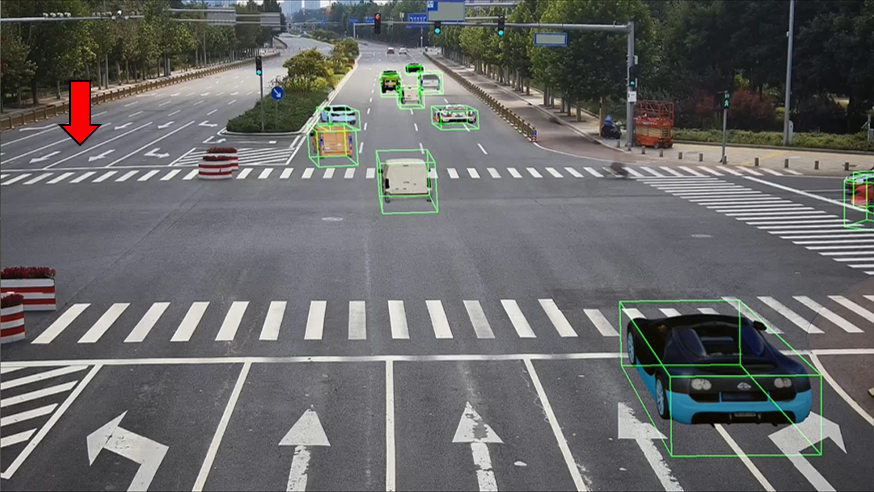
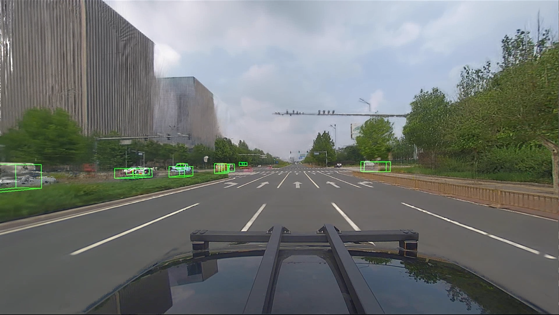
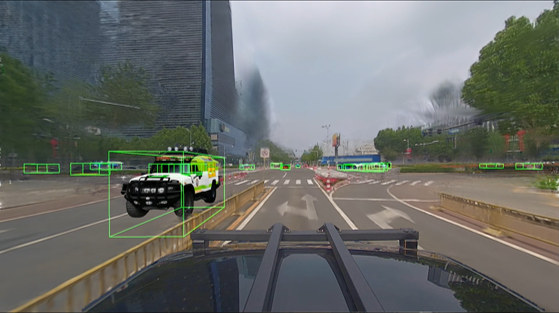
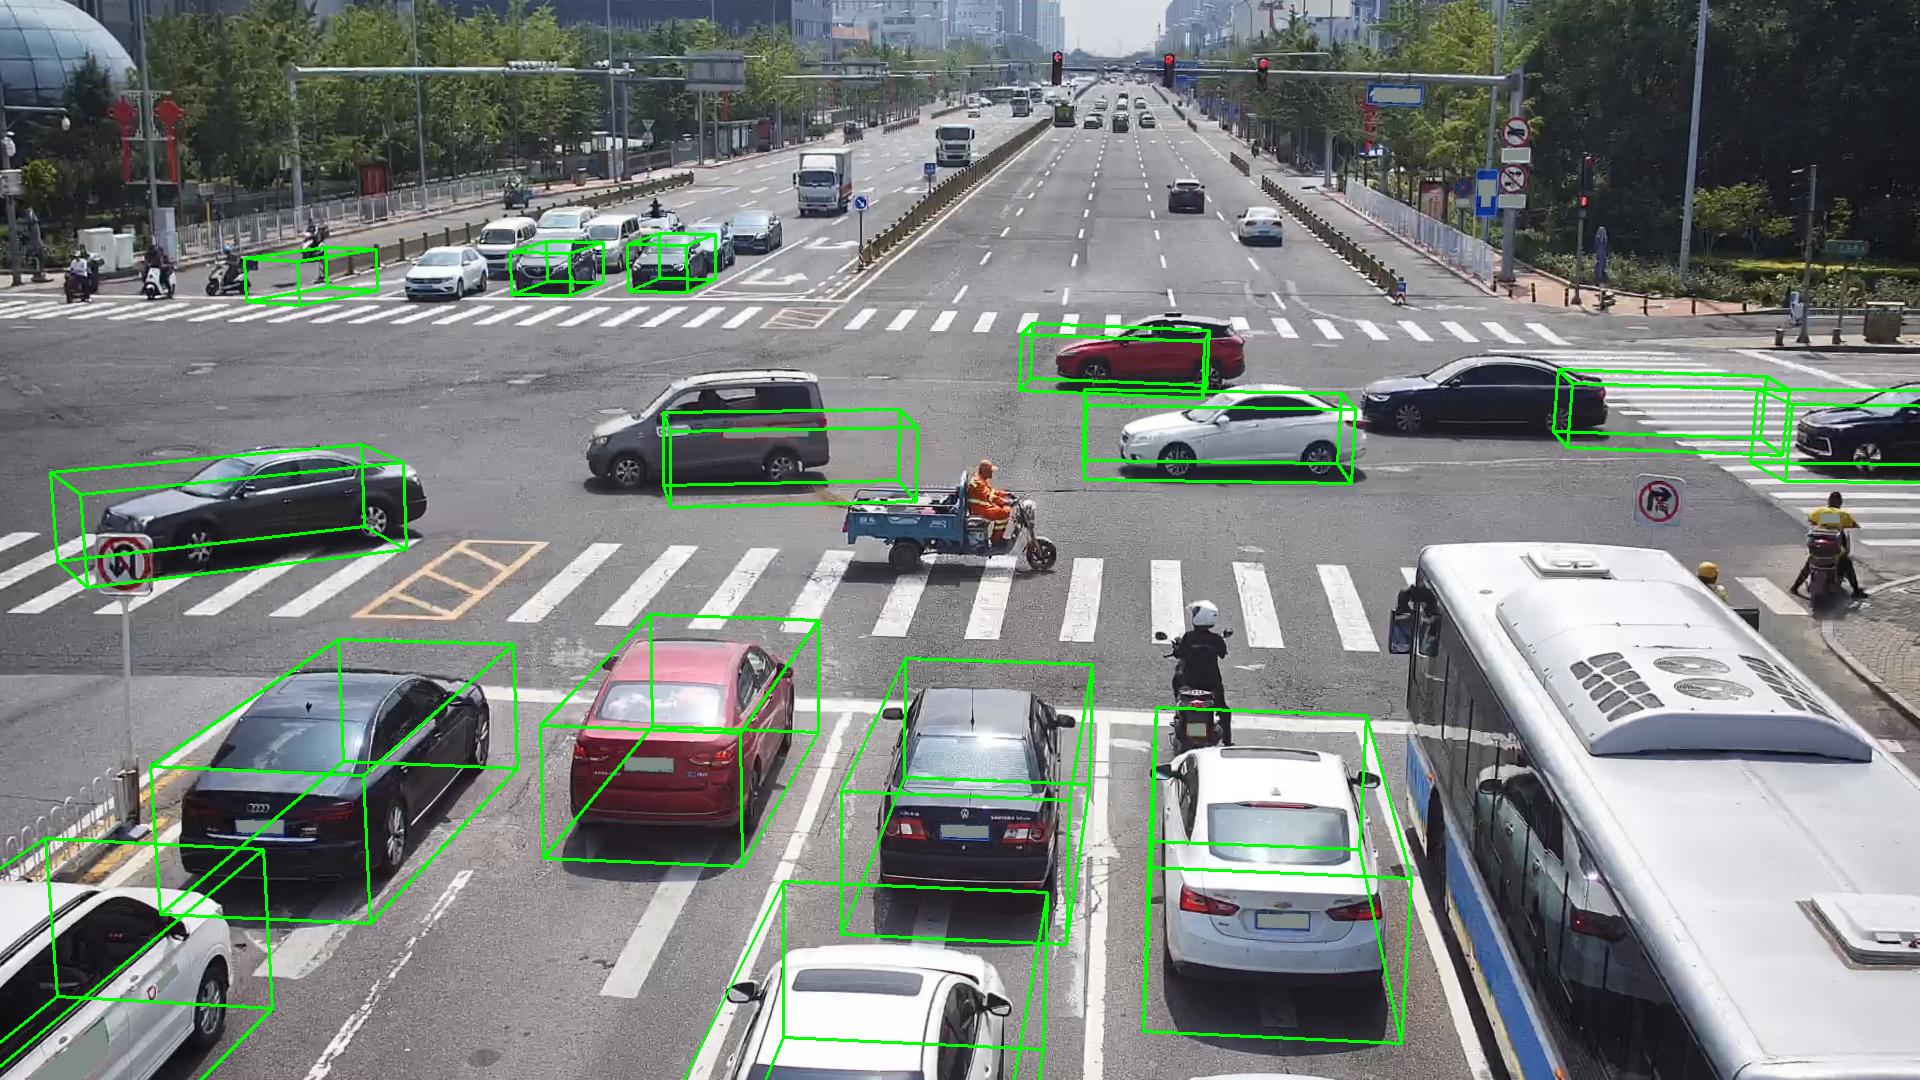
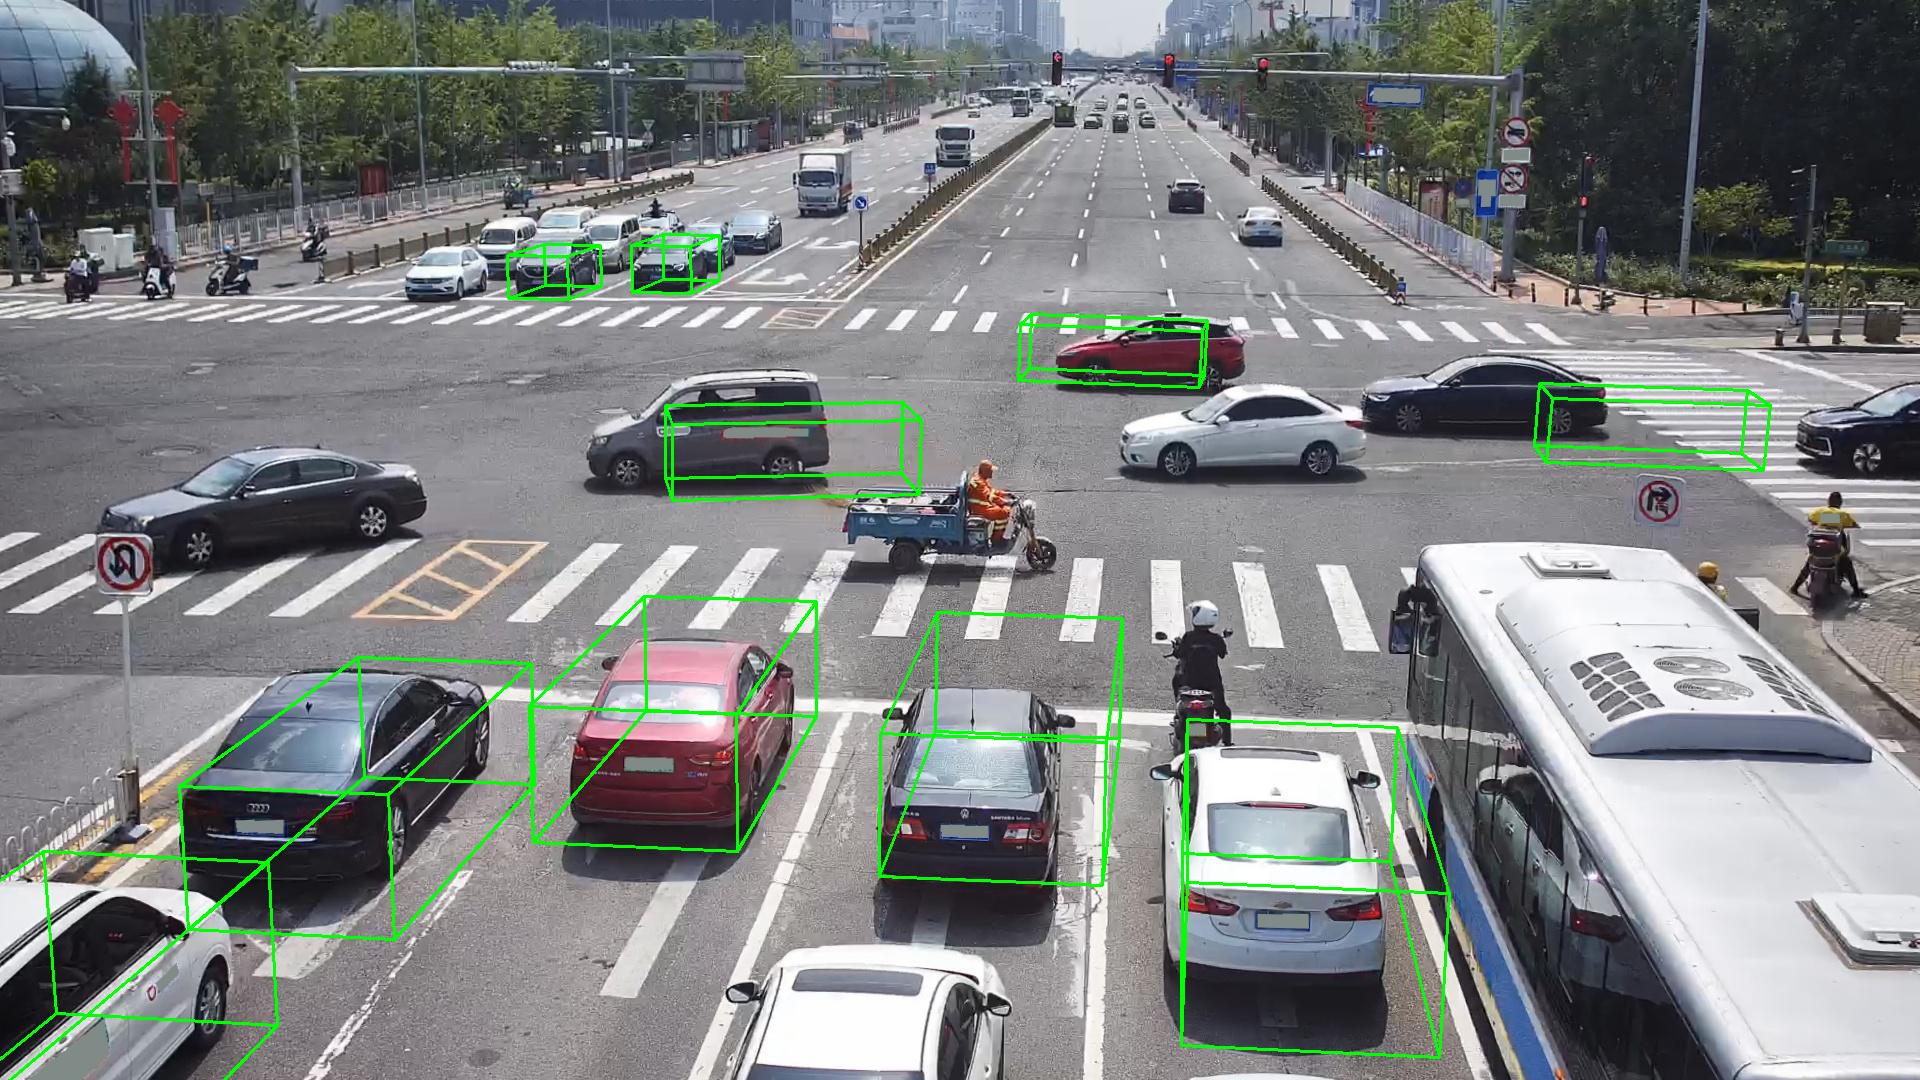
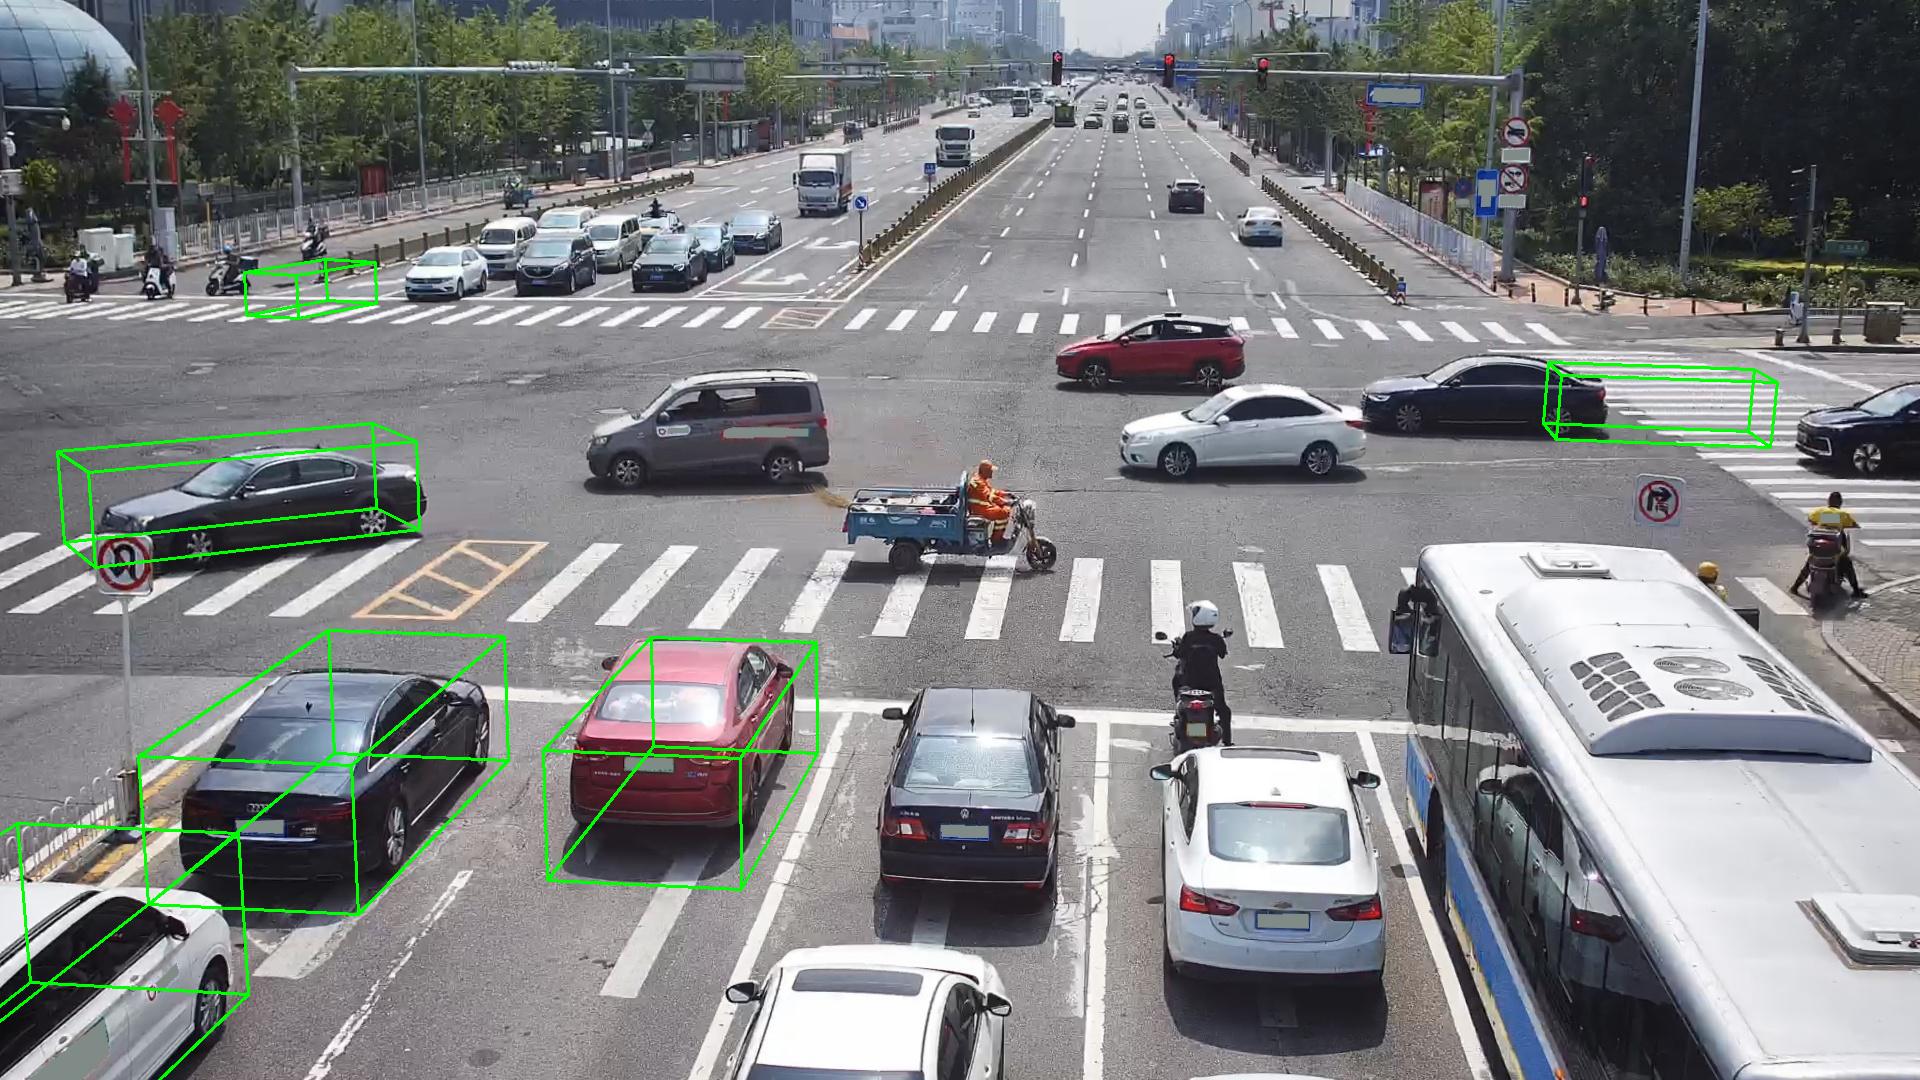
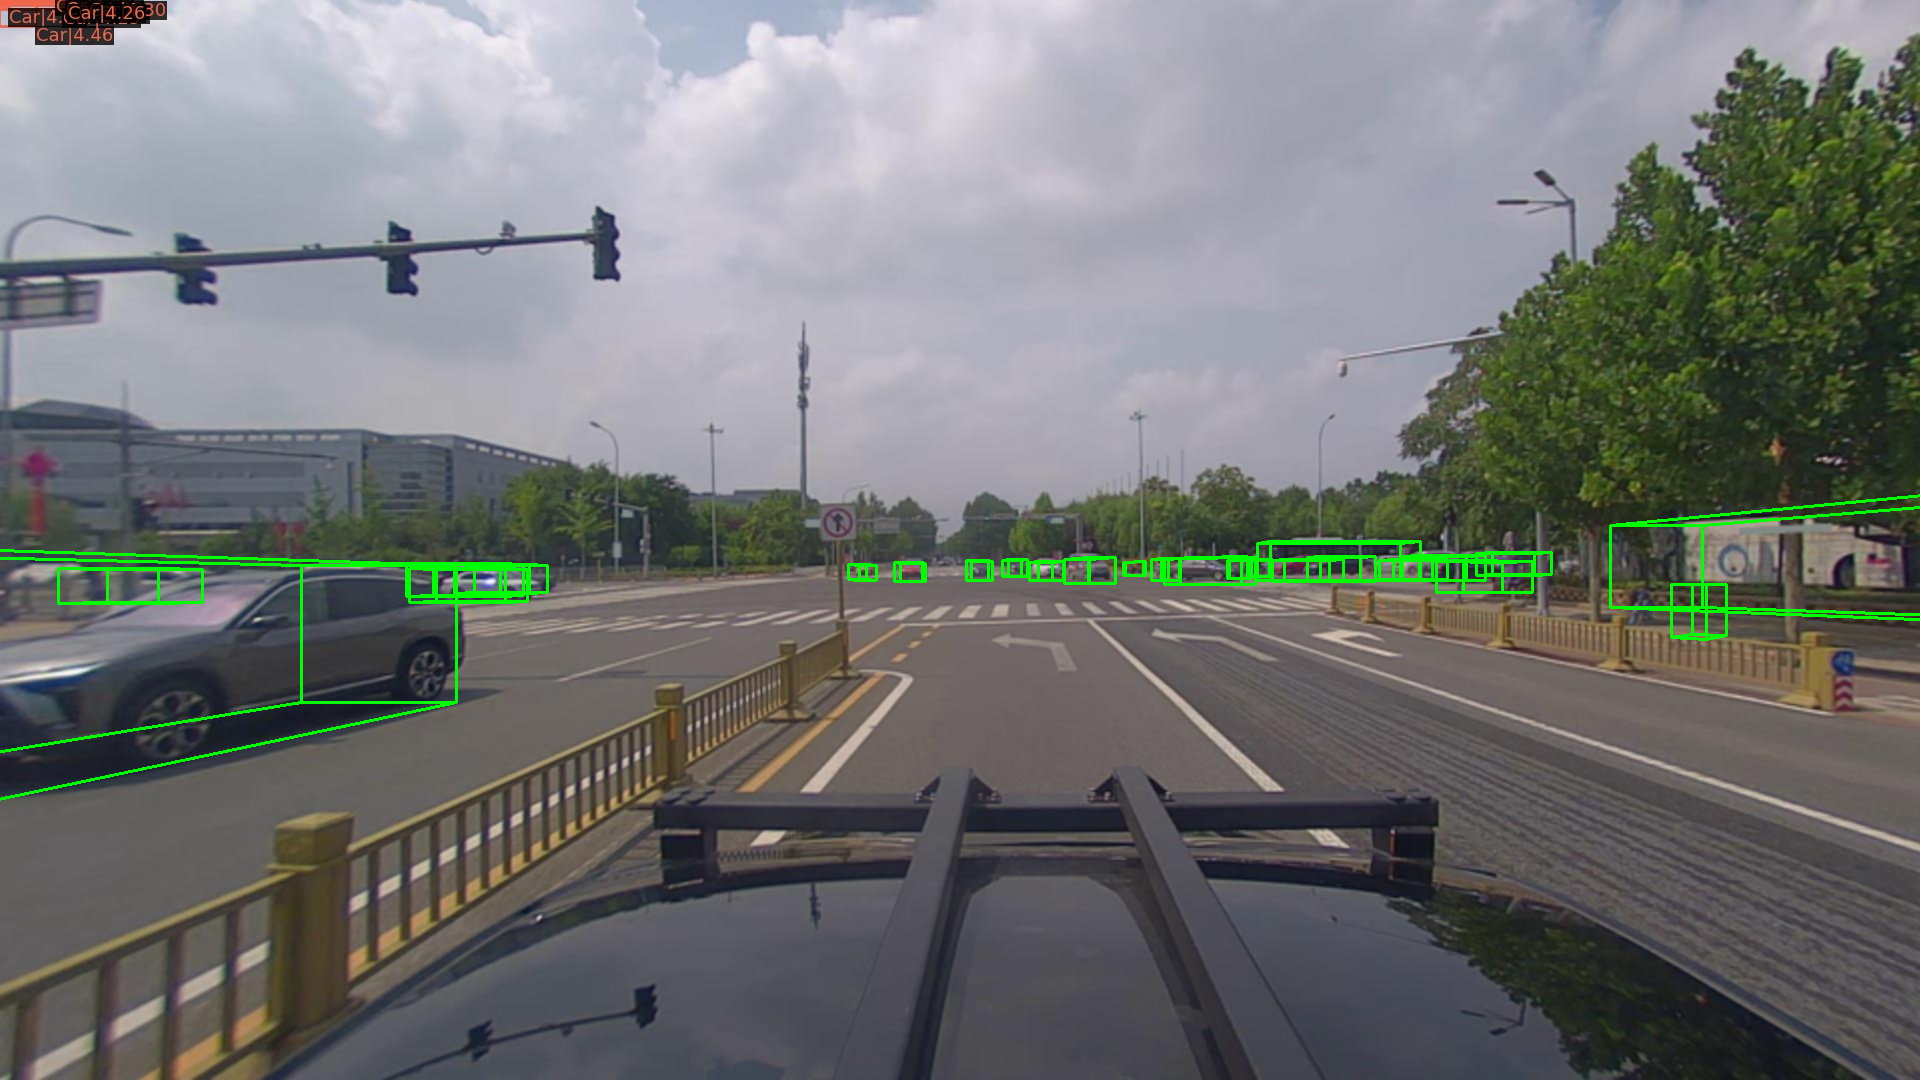
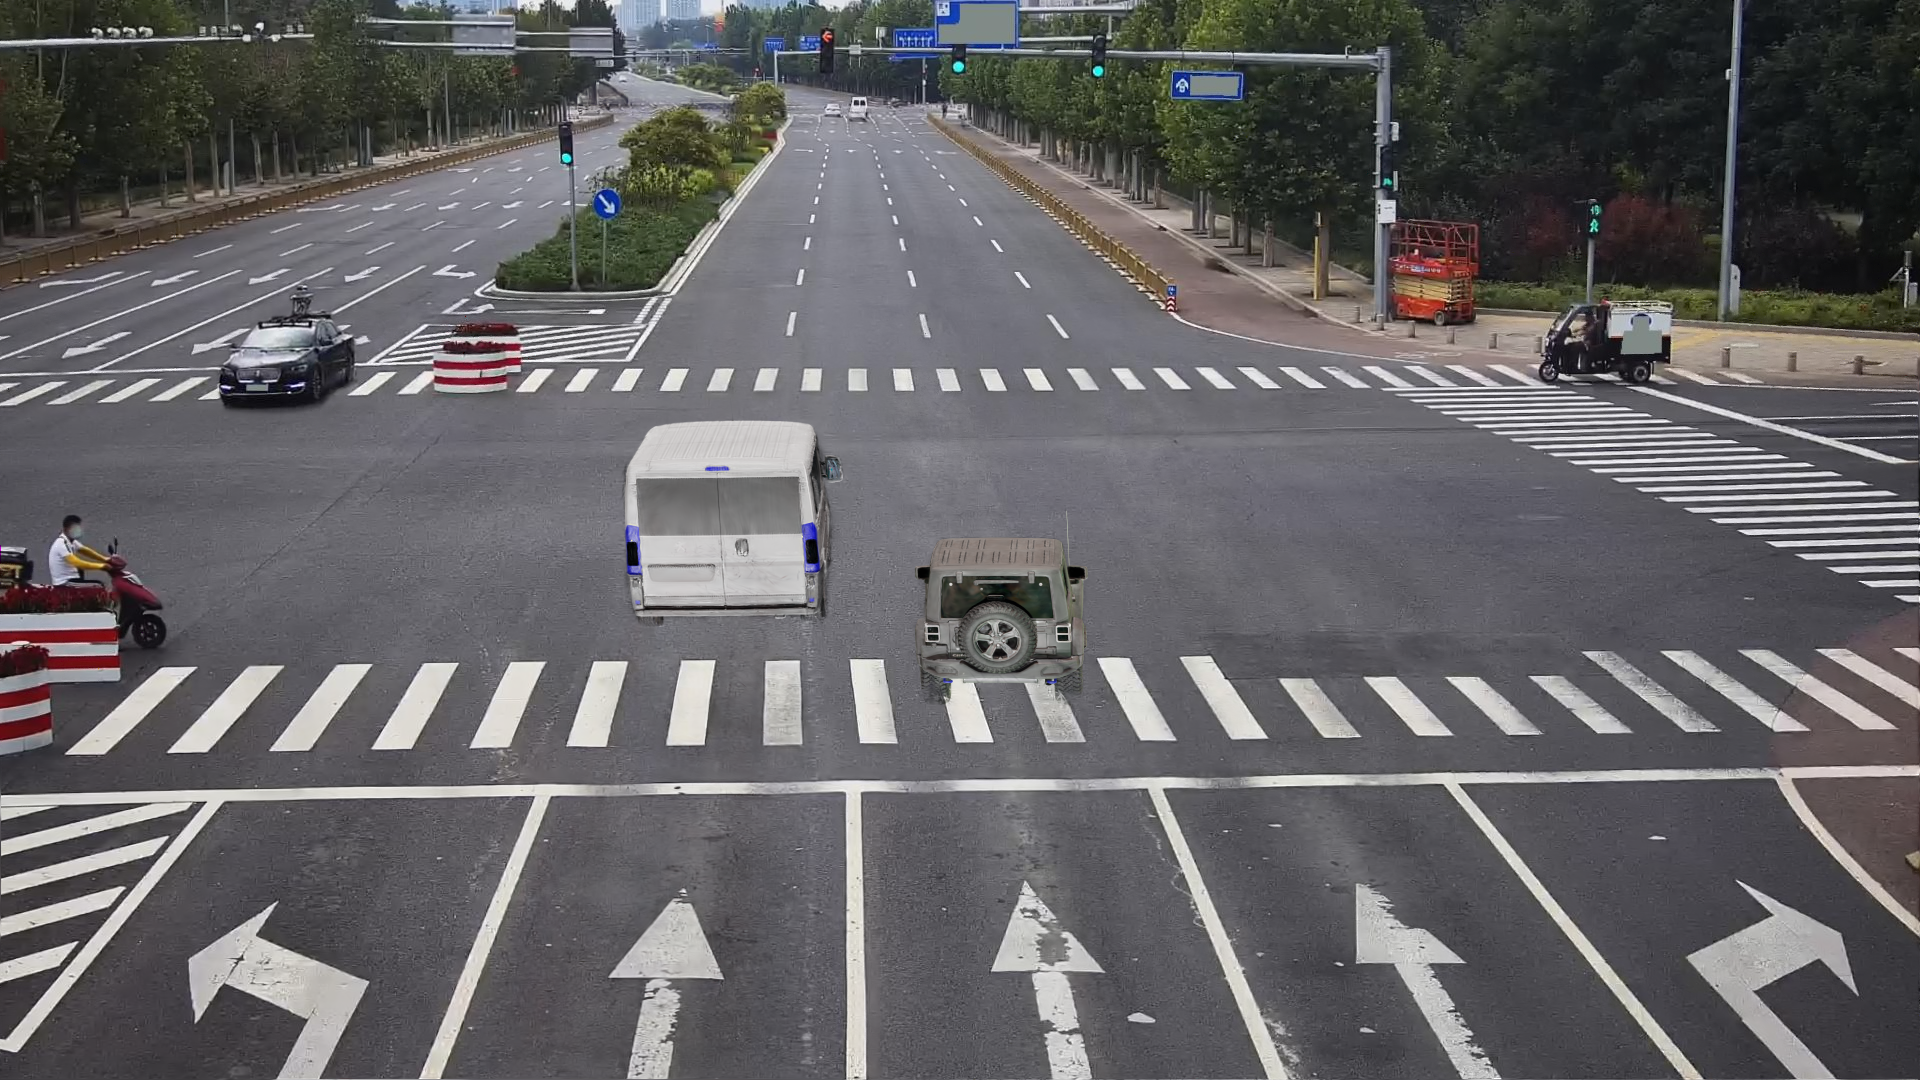
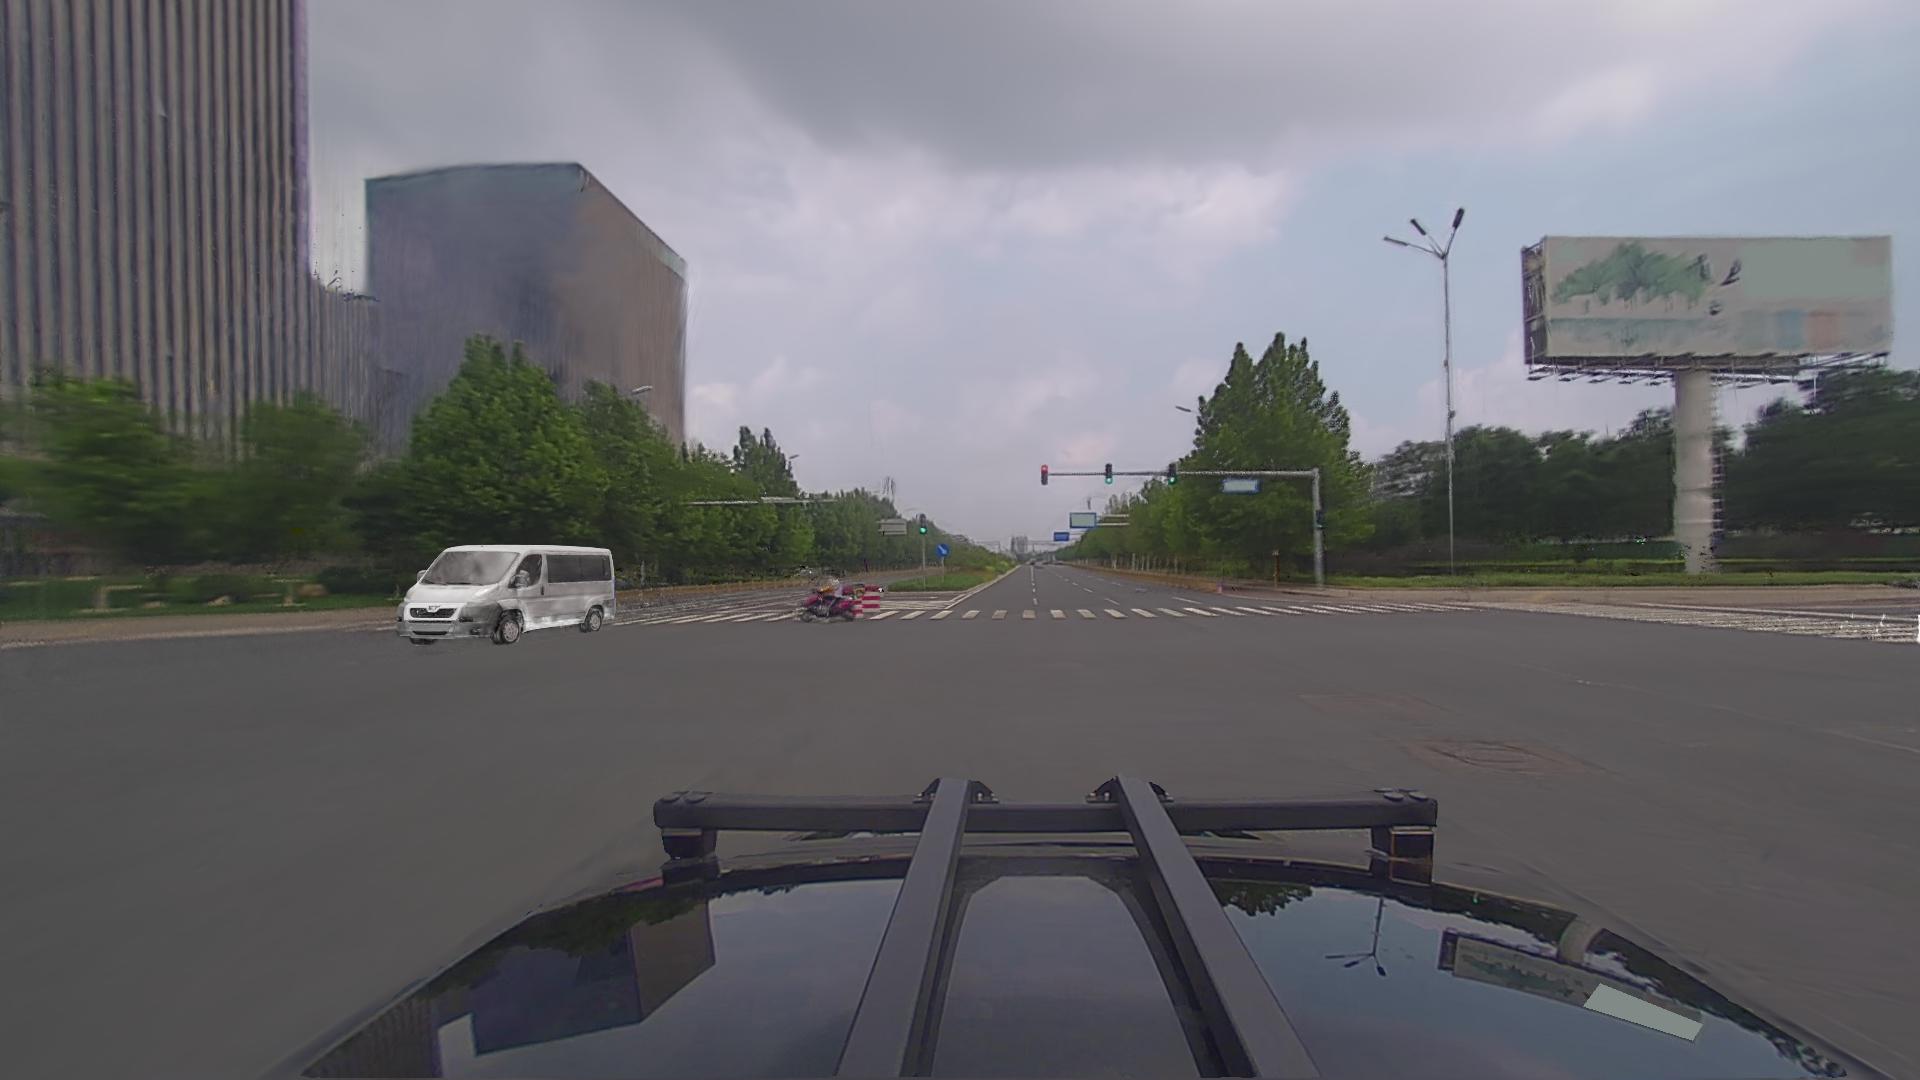
A generated van occludes a jeep from the vehicle camera while both remain visible from the roadside camera. This illustrates why cooperative observations can expose hidden traffic. It is a qualitative perception scenario, not a measured demonstration that a driving policy safely resolves the situation.
VI-B Synchronized Generation.
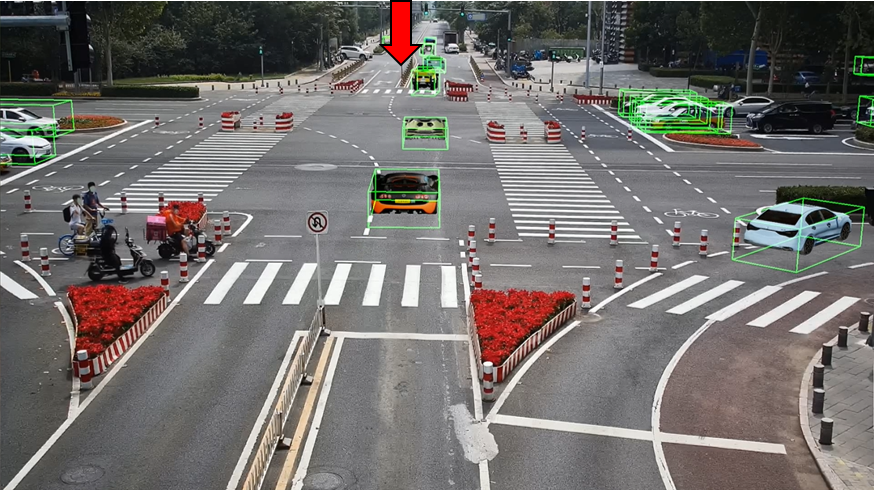
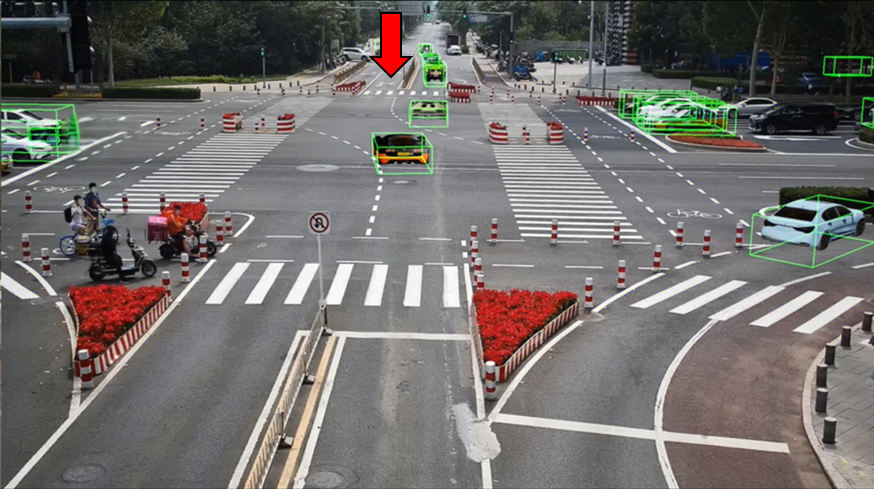
Rendering both cameras at the same synthetic timestamp avoids temporal offsets in generated pairs. This is useful for controlled training and analysis, but does not itself correct real sensor synchronization or establish robustness to communication delay.
VI-C Accurate 3D Boxes.
Inserted assets have known dimensions and trajectories, allowing consistent synthetic boxes. Street-Gaussian pose optimization can also refine reconstruction annotations. The reported downstream gains are compatible with improved labeling, but the paper does not provide a separate ground-truth annotation-error evaluation.
VII Limitations
Similar vehicle and roadside viewing directions can leave geometry poorly constrained, allowing noisy LiDAR points to produce floating road textures. The system does not yet simulate realistic LiDAR returns for both viewpoints. Rain and windshield droplets also degrade Gaussian reconstruction. Filtering, visibility-aware point-cloud generation, and weather restoration are suggested future additions.
VIII Conclusion
CRUISE shows that editable reconstruction can supply synchronized vehicle–infrastructure training images and improve the tested perception models when combined with real data. Its present evidence supports dataset augmentation and qualitative corner-case generation. Physically validated traffic, realistic sensor simulation, adverse-weather robustness, and closed-loop driving remain open parts of the larger simulation goal.