Overview
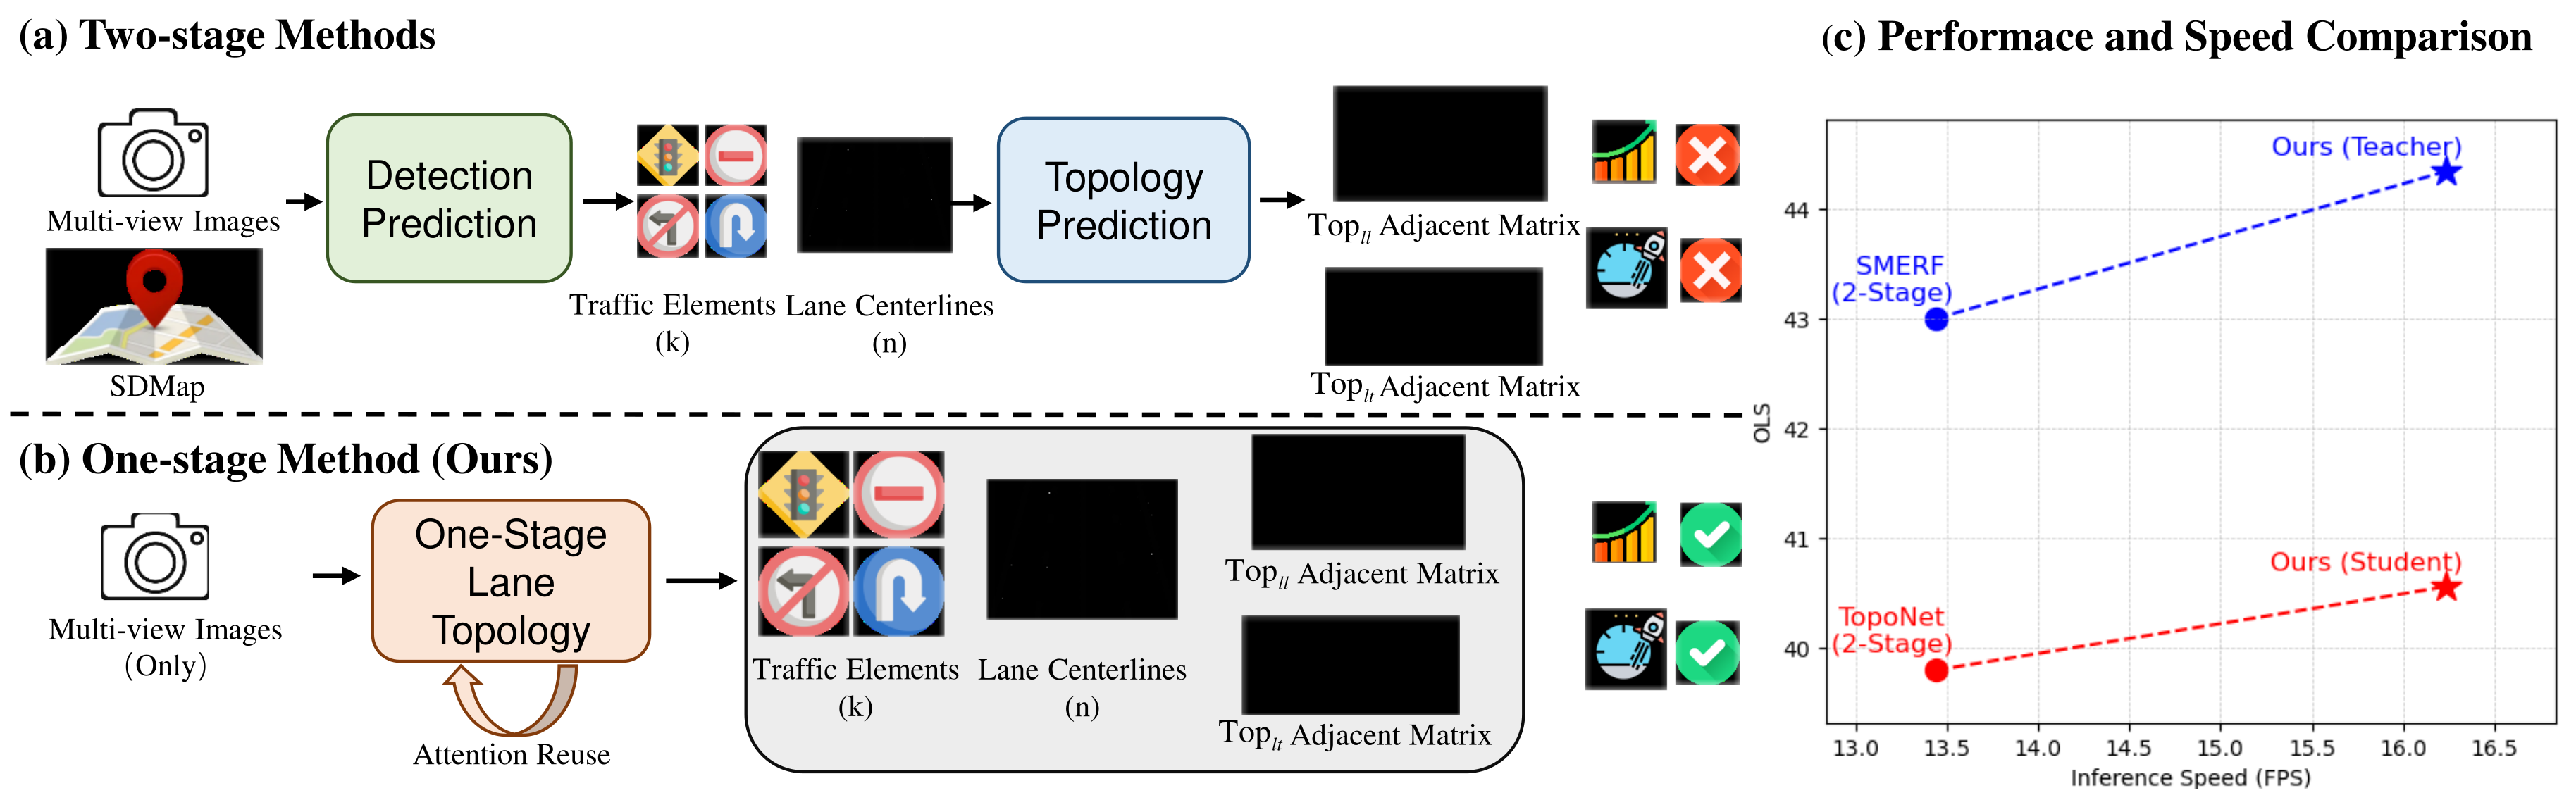
The architecture reuses attention features for relation prediction instead of building a separate graph from completed detections. Figure 1 retains the original comparison and speed/accuracy plot.
At a glance
This system jointly predicts lane centerlines, traffic elements and their relationships from camera images. It combines intermediate attention queries/keys from two decoders—one operating in the front-camera view and one in bird’s-eye view—through lightweight relation heads.
A second contribution distills bird’s-eye features from a teacher that also receives standard-definition maps into a camera-only student. On OpenLane-V2 subset A, the student reaches 40.6 overall score versus TopoNet’s 39.8. The reported 17% inference-speed gain excludes feature extraction; these perception results do not establish closed-loop driving safety.
I INTRODUCTION
Two-stage baselines detect road elements and then infer their graph. The proposed alternative shares decoder resources between detection and relation prediction, reducing dedicated topology-network parameters. The claimed reduction in error propagation is a motivation, not a separately isolated causal result.
Unlike EGTR’s single-decoder scene graphs, this design connects front-view traffic-element features to bird’s-eye lane features. A map-enhanced teacher supplies additional training supervision while the deployed student remains camera-only.
II Related Work
The method combines ideas from lane-topology estimation and one-stage scene-graph generation.
II-A Lane Topology Construction
Earlier approaches detect lanes or road elements and recover relationships through explicit graph networks, positional embeddings, auxiliary queries or geometric post-processing. TopoNet is the main camera-only baseline; SMERF adds standard-definition map information.
II-B Scene Graph Generation
Query-based scene-graph models jointly infer objects and relations. EGTR extracts relational resources from transformer self-attention; this paper adapts that idea to two decoders with different visual coordinate systems. Cross-view lane/traffic relations are the application-specific distinction.
III Method
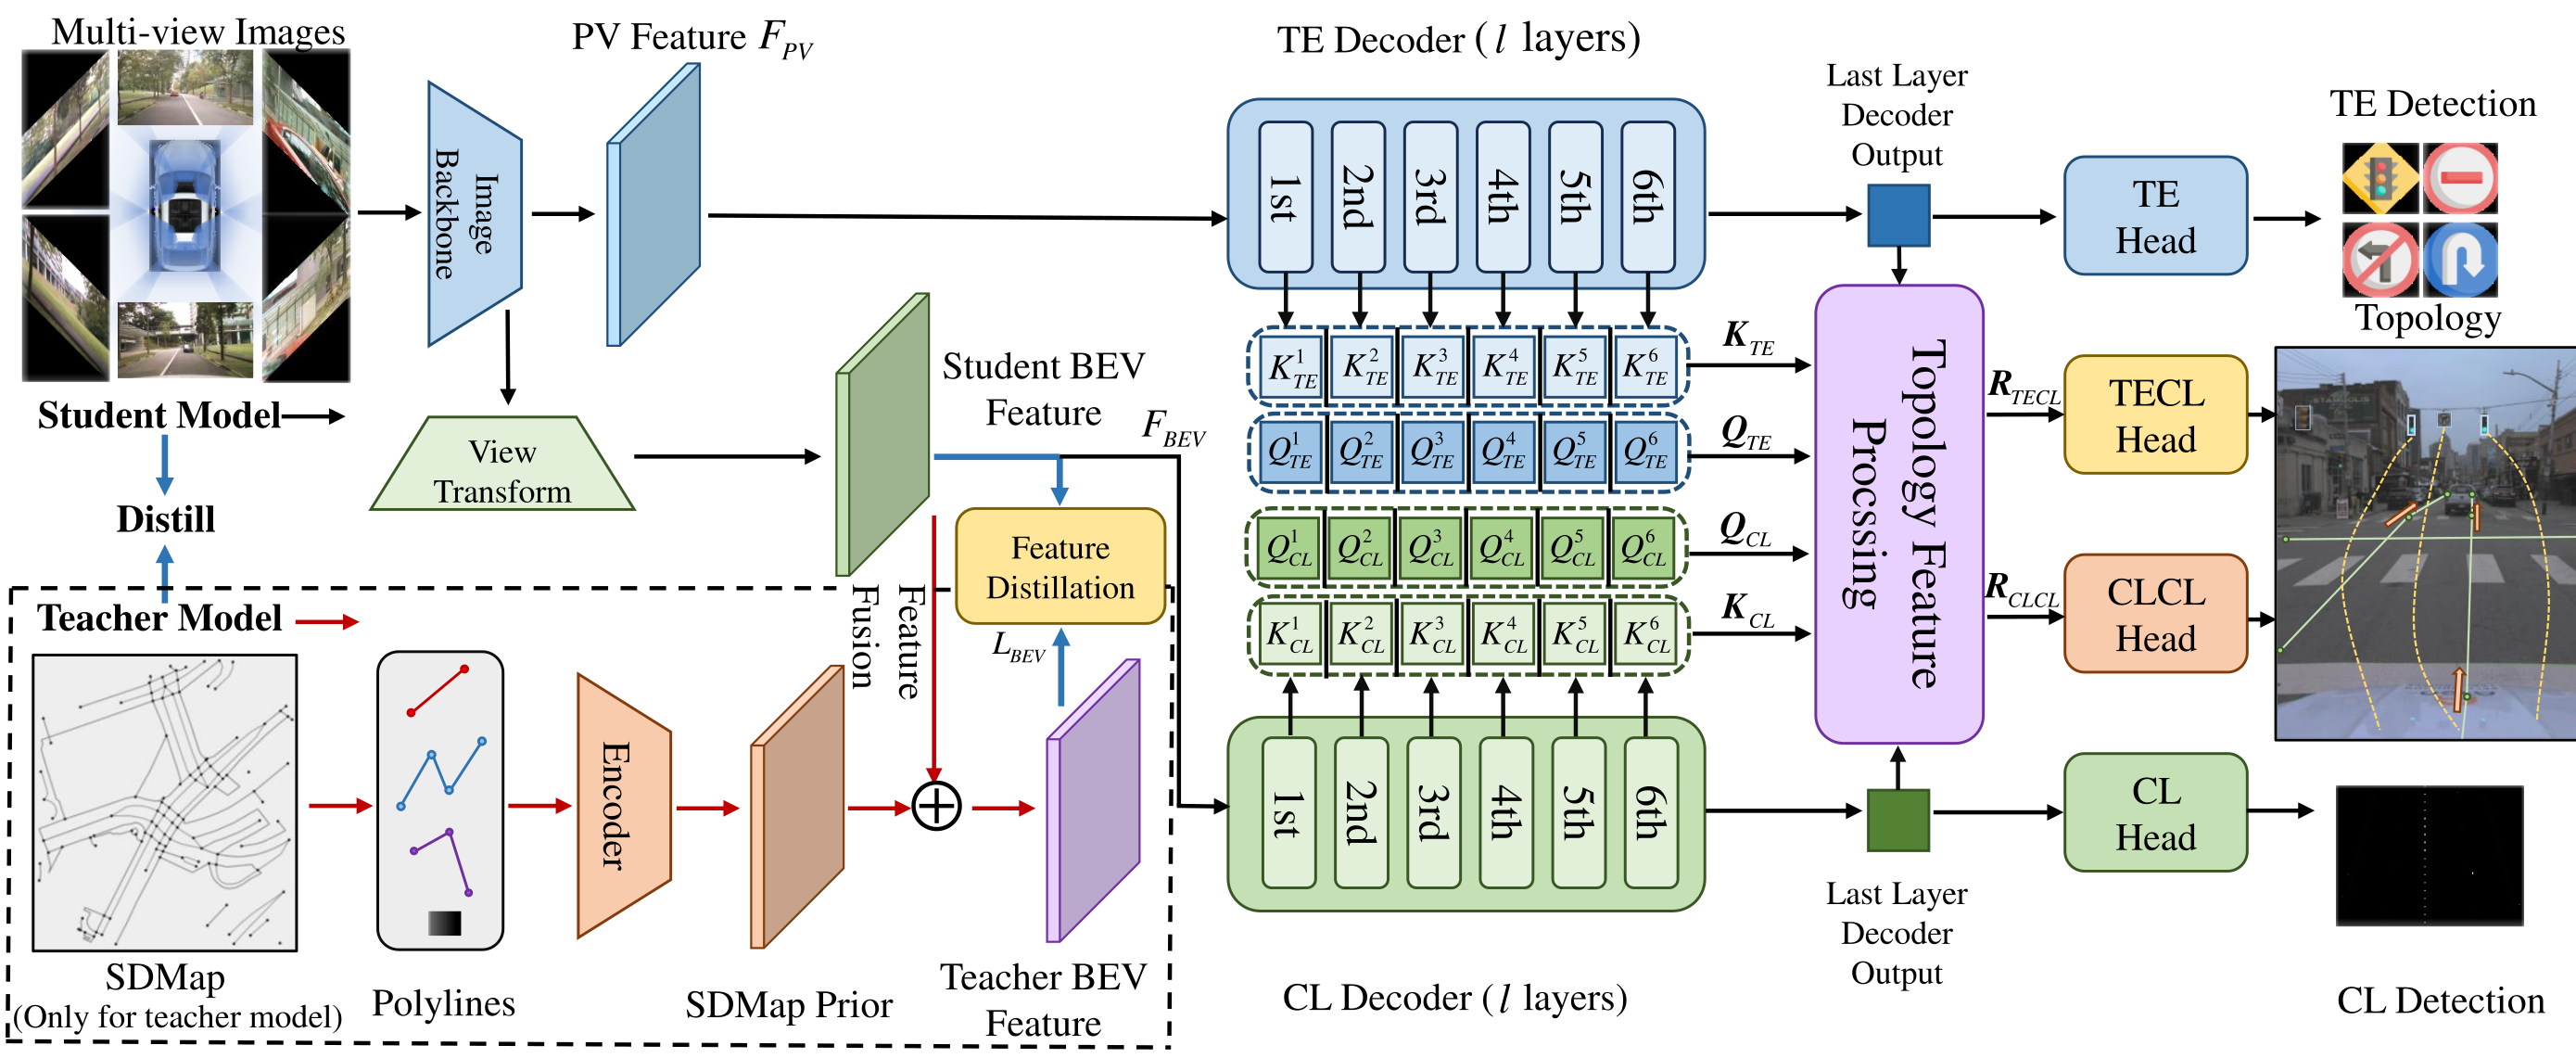
The pipeline extracts image and bird’s-eye features, predicts objects and relations together, and optionally trains a camera-only student against map-enhanced teacher features.
III-A Feature Extraction
A pretrained ResNet-50 with a feature pyramid extracts image features, and the same view transformation as TopoNet constructs bird’s-eye features. Traffic-element detection uses the front camera’s perspective features; lane detection uses the multiview bird’s-eye representation. Matching the backbone limits one source of baseline variation.
III-B One-Stage Prediction for Topology Reasoning
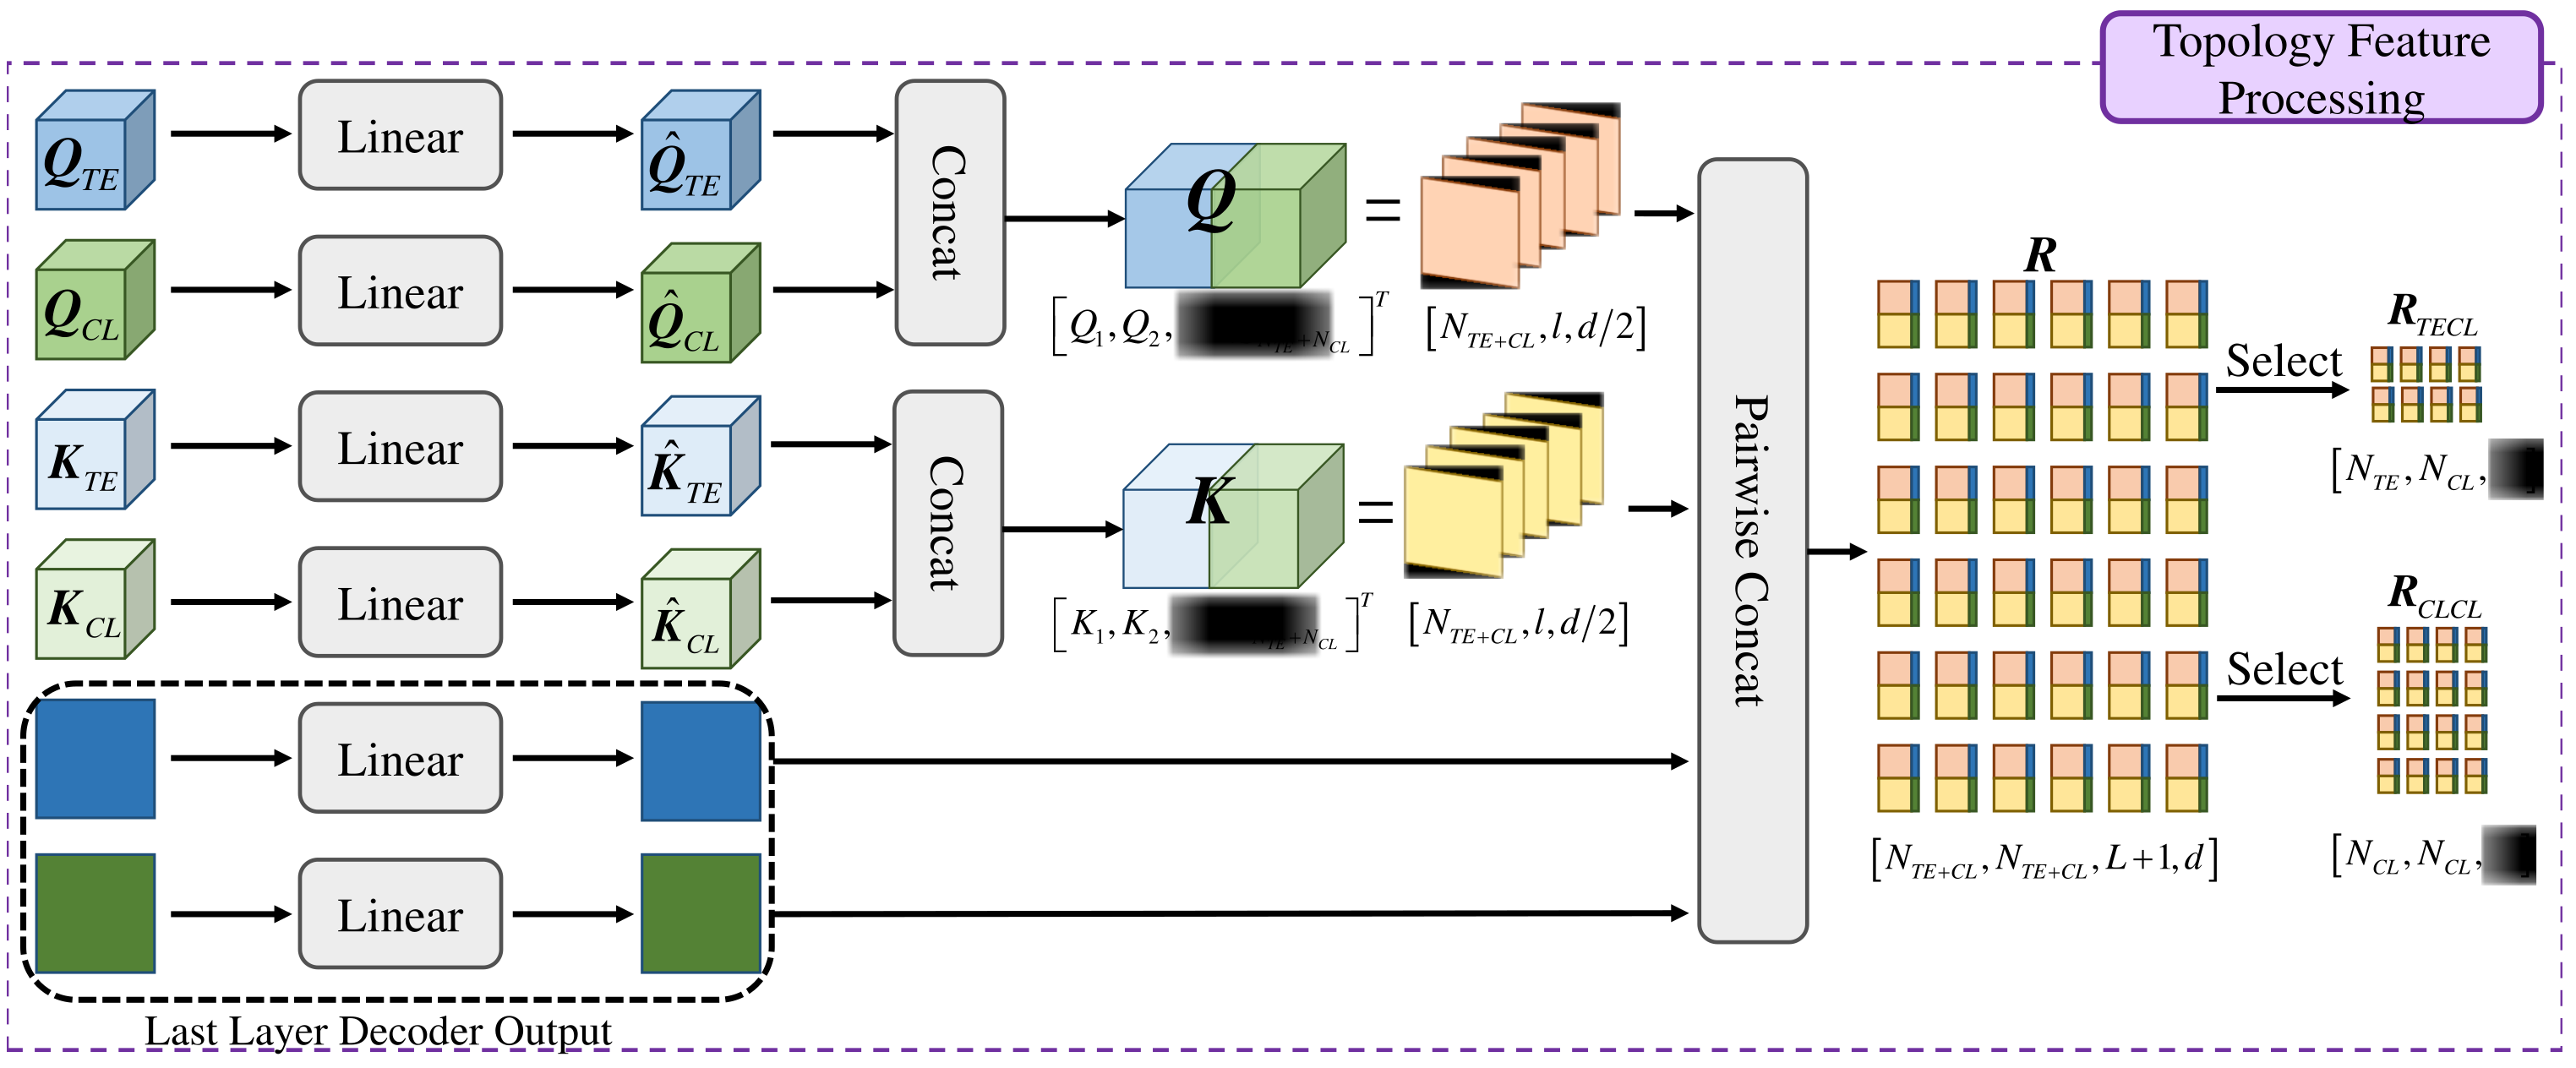
Collect self-attention queries and keys from every layer of both decoders. Separate linear projections reduce their channel dimension, then concatenate traffic-element and lane resources. Pairwise query–key concatenation constructs relation features for all element pairs; projected final decoder outputs provide an additional relation resource.
Task-specific blocks feed gated aggregation and MLP heads for lane–lane and traffic-element–lane relations. Final decoder outputs also feed the original detection heads, and the system retains the baseline detection/topology losses. Reusing features removes a separate graph network, but pairwise relation construction still scales quadratically with query count.
The printed indexing deserves care: Equation 7 selects columns starting at one, although Equations 3–4 place traffic-element queries before lane queries. The stated layer dimension for the final-output resource is also not fully explained. The original formulas remain unchanged; these notation inconsistencies should be checked against the implementation before reproduction.
Equations 1–8
| (1) |
| (2) |
| (3) |
| (4) |
| (5) |
| (6) |
| (7) | ||||
| (8) |
| Method | OLS | |||||
|---|---|---|---|---|---|---|
| SD-Map-Based | SMERF [3] | 43.0 | 31.1 | 48.6 | 16.2 | 27.1 |
| Ours (Teacher) | 44.3 | 33.5 | 49.4 | 17.1 | 28.2 | |
| SD-Map-Free | STSU [4] | 29.3 | 12.7 | 43.0 | 2.9 | 19.8 |
| VectorMapNet [5] | 24.9 | 11.1 | 41.7 | 2.7 | 9.2 | |
| MapTR [6] | 24.2 | 8.3 | 43.5 | 2.3 | 8.9 | |
| MapTR (Chamfer Dist.) [6] | 31.0 | 17.7 | 43.5 | 5.9 | 15.1 | |
| TopoNet [7] | 39.8 | 28.6 | 48.6 | 10.9 | 23.8 | |
| Ours (Student) | 40.6 | 30.2 | 48.7 | 11.0 | 25.2 |
III-C Map-to-Mapless Knowledge Distillation
The teacher adds SMERF-style cross-attention from standard-definition map features into the bird’s-eye representation. After training that stronger model, freeze it and penalize squared differences between teacher and student bird’s-eye features while also training the student against ground truth.
The explicit distillation target is a feature tensor, despite the prose’s broader “soft labels” wording. Maps are needed for teacher training, not student inference. The paper does not fully specify the relative loss weighting here.
Equation 9
| (9) |
IV Experiments
Evaluation uses the OpenLane-V2 benchmark, with separate map-enhanced and camera-only comparisons and two ablations.
IV-A Dataset and Evaluation Metrics
The study evaluates subsets A and B, obtaining maps through the same preprocessing as SMERF. Lane detection averages AP over Fréchet-distance thresholds 1, 2 and 3; traffic-element detection uses IoU and thirteen attributes. Lane–lane and lane–traffic AP scores measure relations, and OLS is the benchmark’s combined score.
These are dataset perception metrics. They do not measure planning success, crash frequency or reliability after distribution shifts.
IV-B Implementation Details
Training uses four A800 or V100 GPUs, one sample per GPU, AdamW with initial learning rate 10⁻⁴ and 24 epochs. Decoder/query counts match the baselines. Inference uses one V100 on a four-GPU machine, with the other GPUs idle.
Feature extraction is excluded from speed comparisons unless stated otherwise. Table II reports a 17% speed gain, while the introduction calls it a 17% time reduction; those are not equivalent quantities. Teacher parameters fall from 65.8M to 52.7M, and student parameters from 62.6M to 49.4M.
IV-C Quantitative Results
On subset A, the map-enhanced teacher improves SMERF’s OLS from 43.0 to 44.3. Its lane detection increases 31.1→33.5, traffic detection 48.6→49.4, lane–lane topology 16.2→17.1 and lane–traffic topology 27.1→28.2.
The distilled camera-only student improves TopoNet’s OLS 39.8→40.6, lane detection 28.6→30.2 and lane–traffic topology 23.8→25.2; traffic detection and lane–lane topology each increase only 0.1. These exact table differences correct overstatements in the surrounding source prose.
On subset B without distillation, OLS rises 36.0→37.0, but lane–traffic topology declines 16.7→16.5. Gains are therefore not uniform across metrics or conditions. Some older baseline results are inherited from TopoNet, with no corresponding released modifications for a speed comparison.
IV-D Qualitative Comparisons
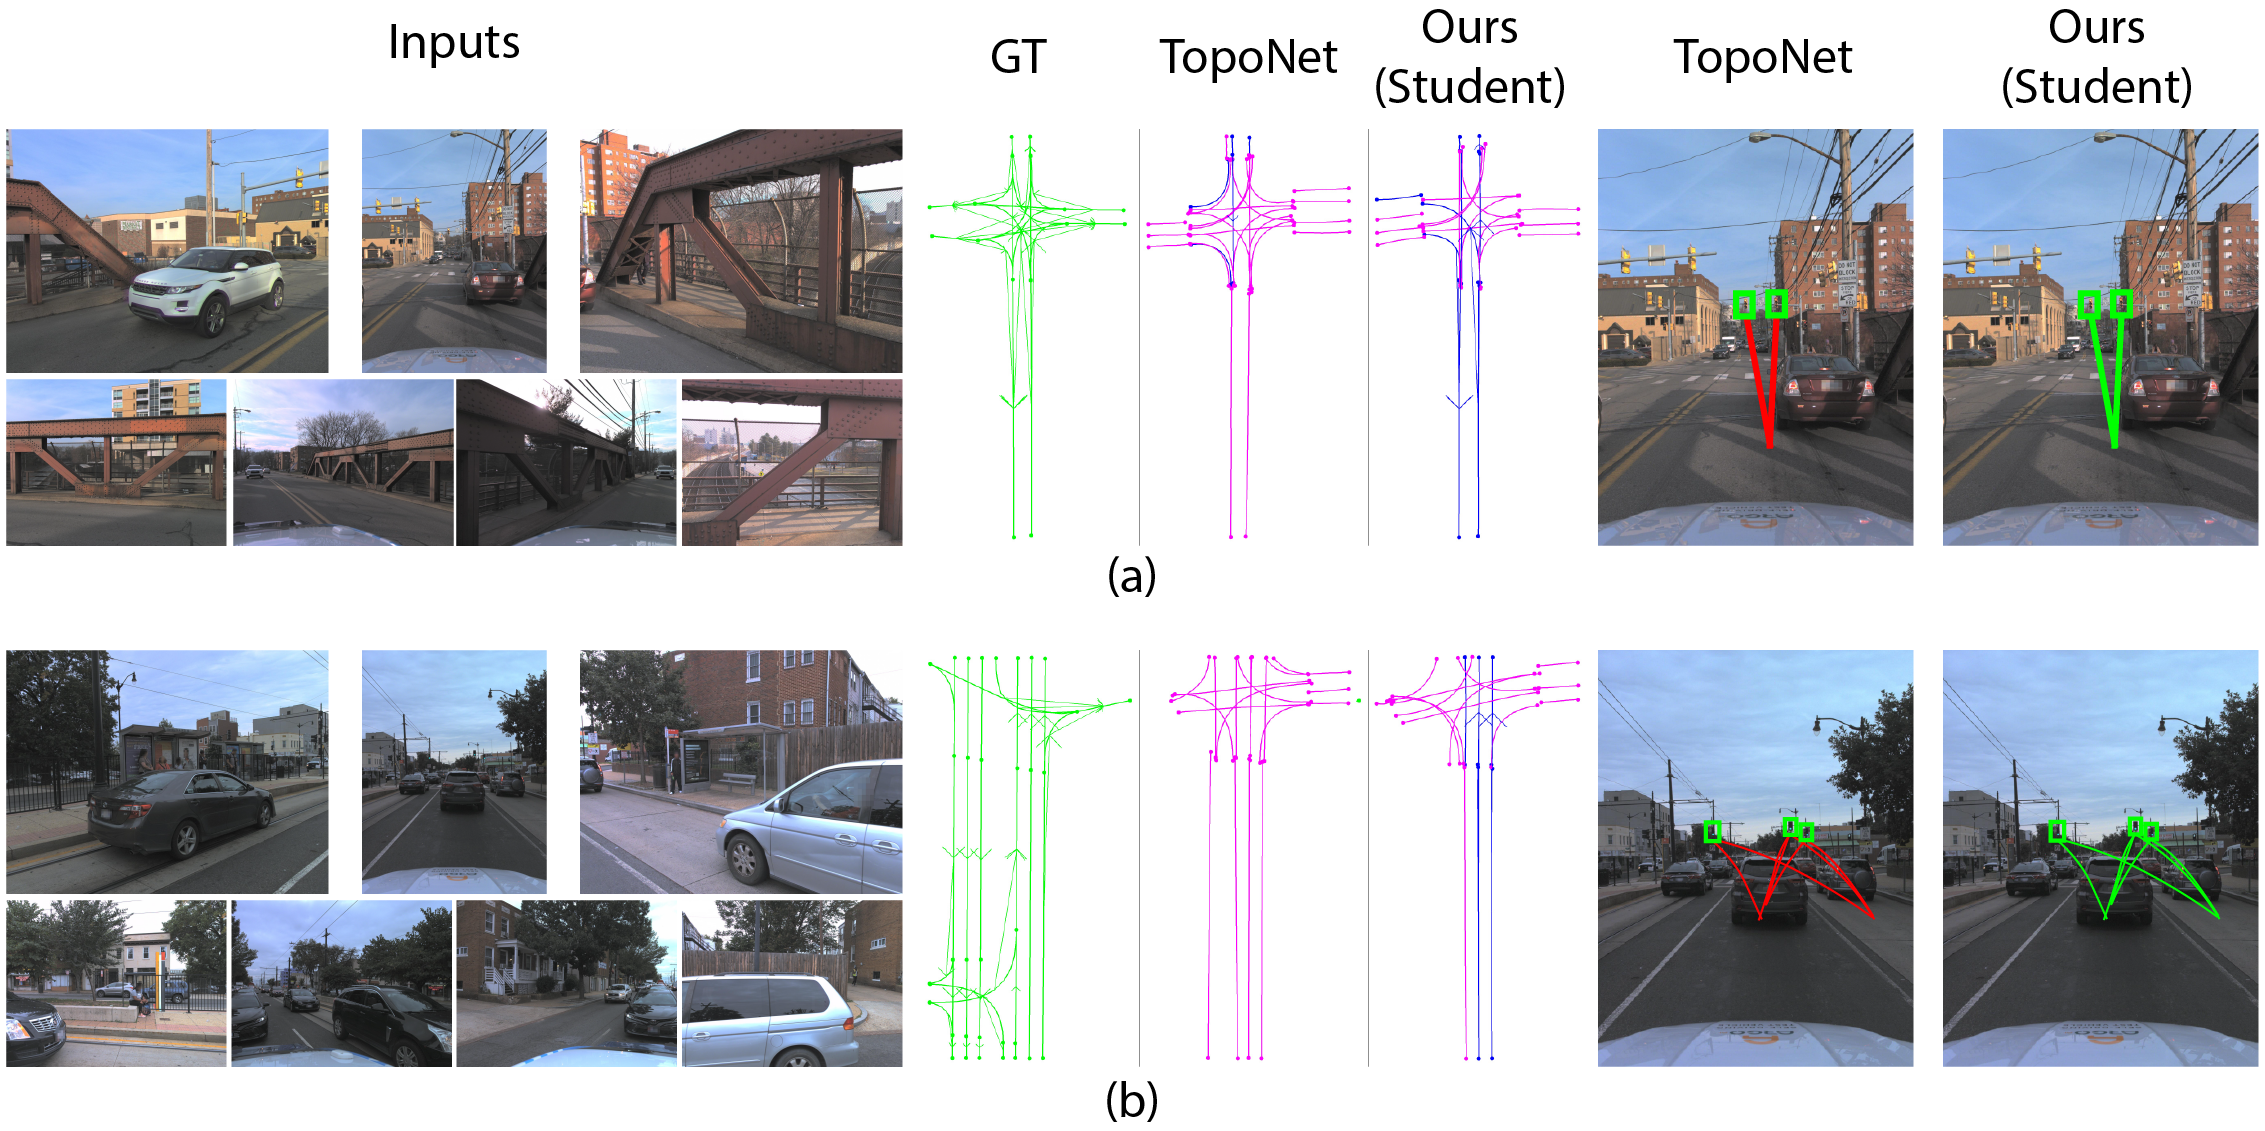
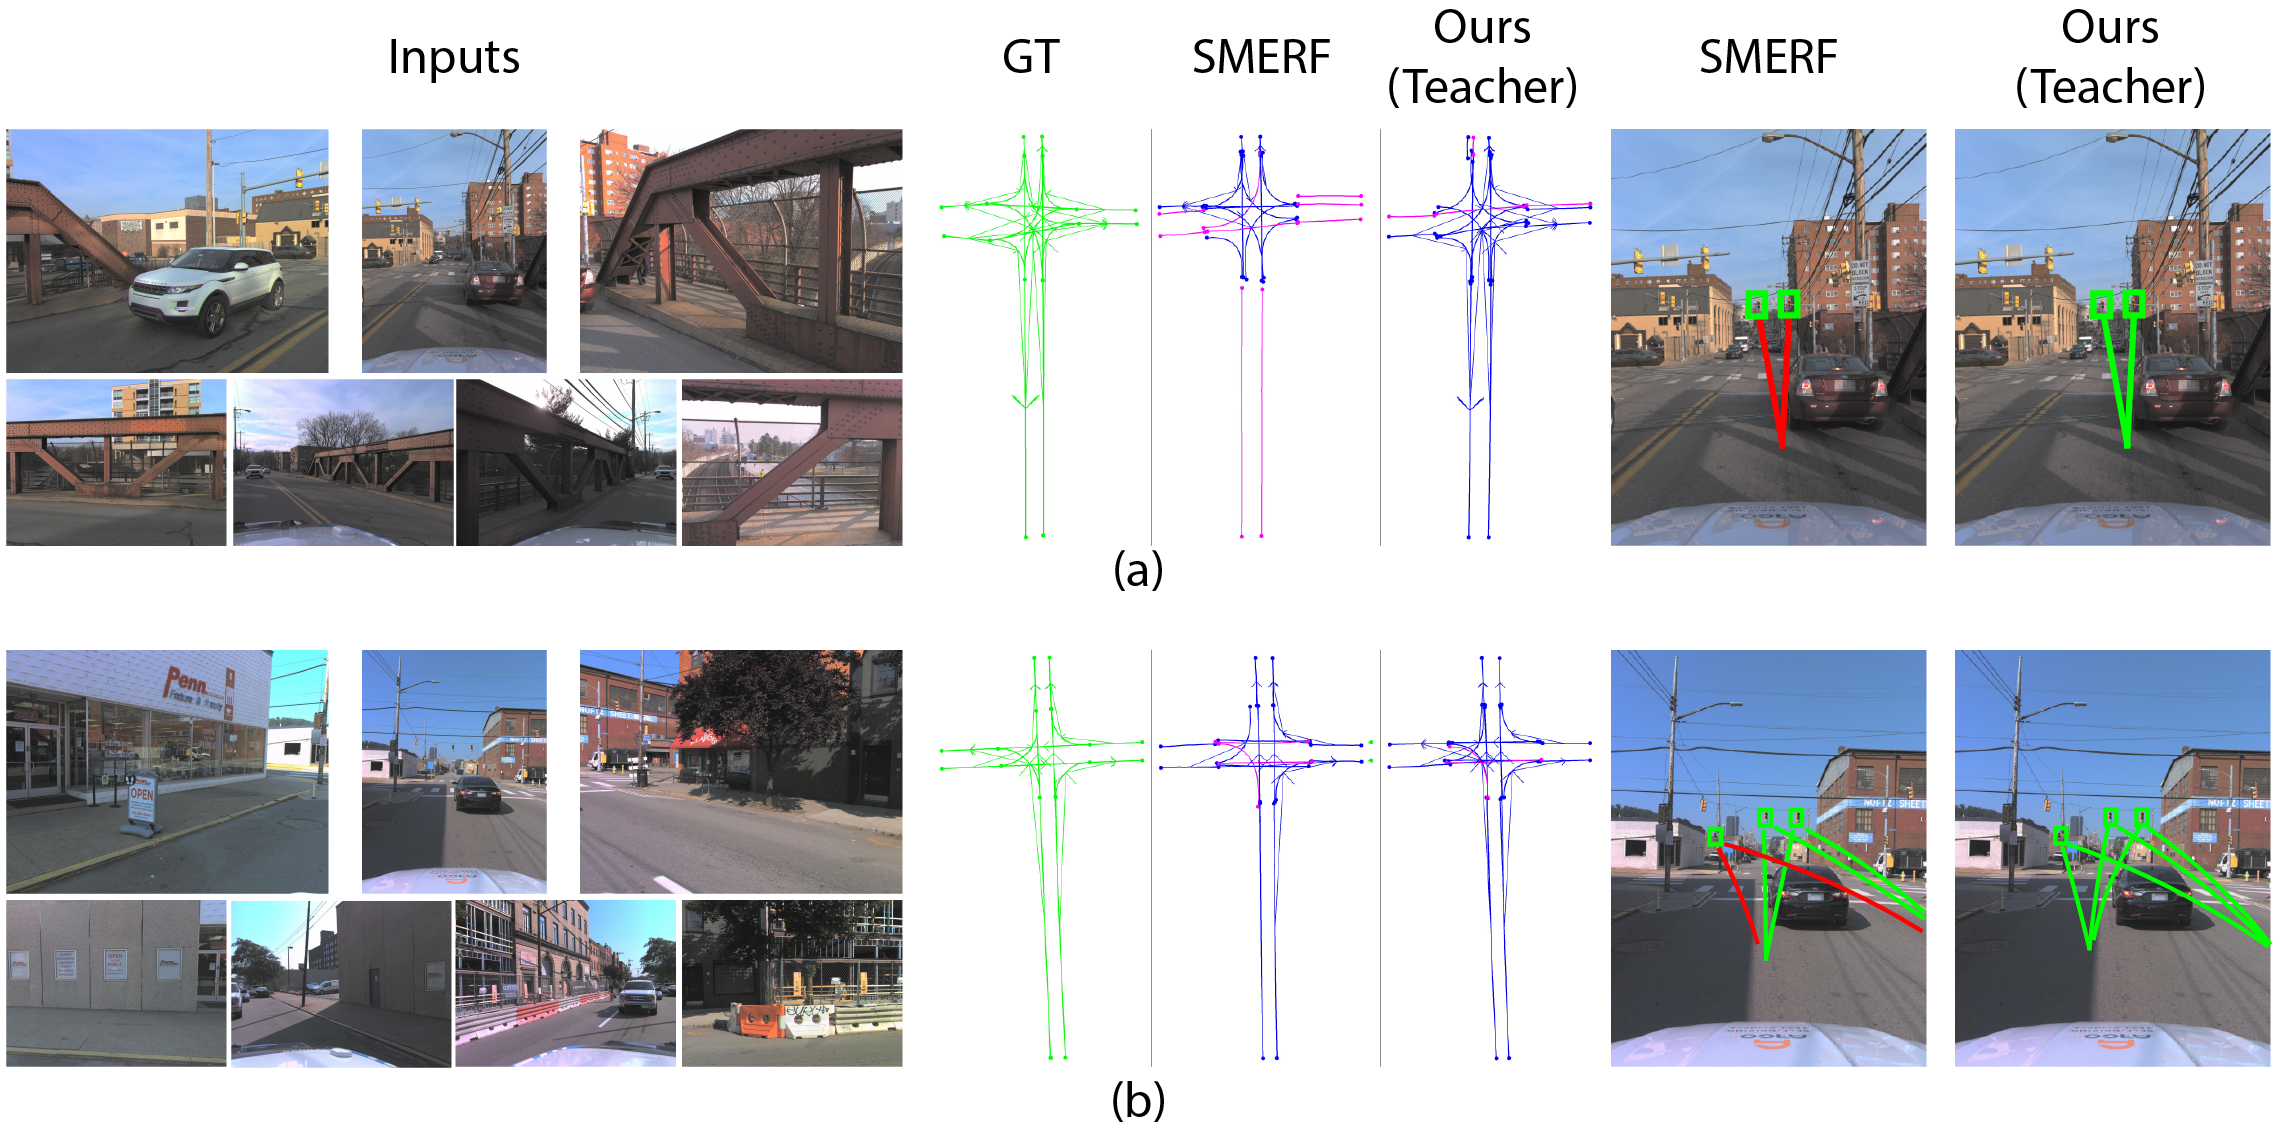
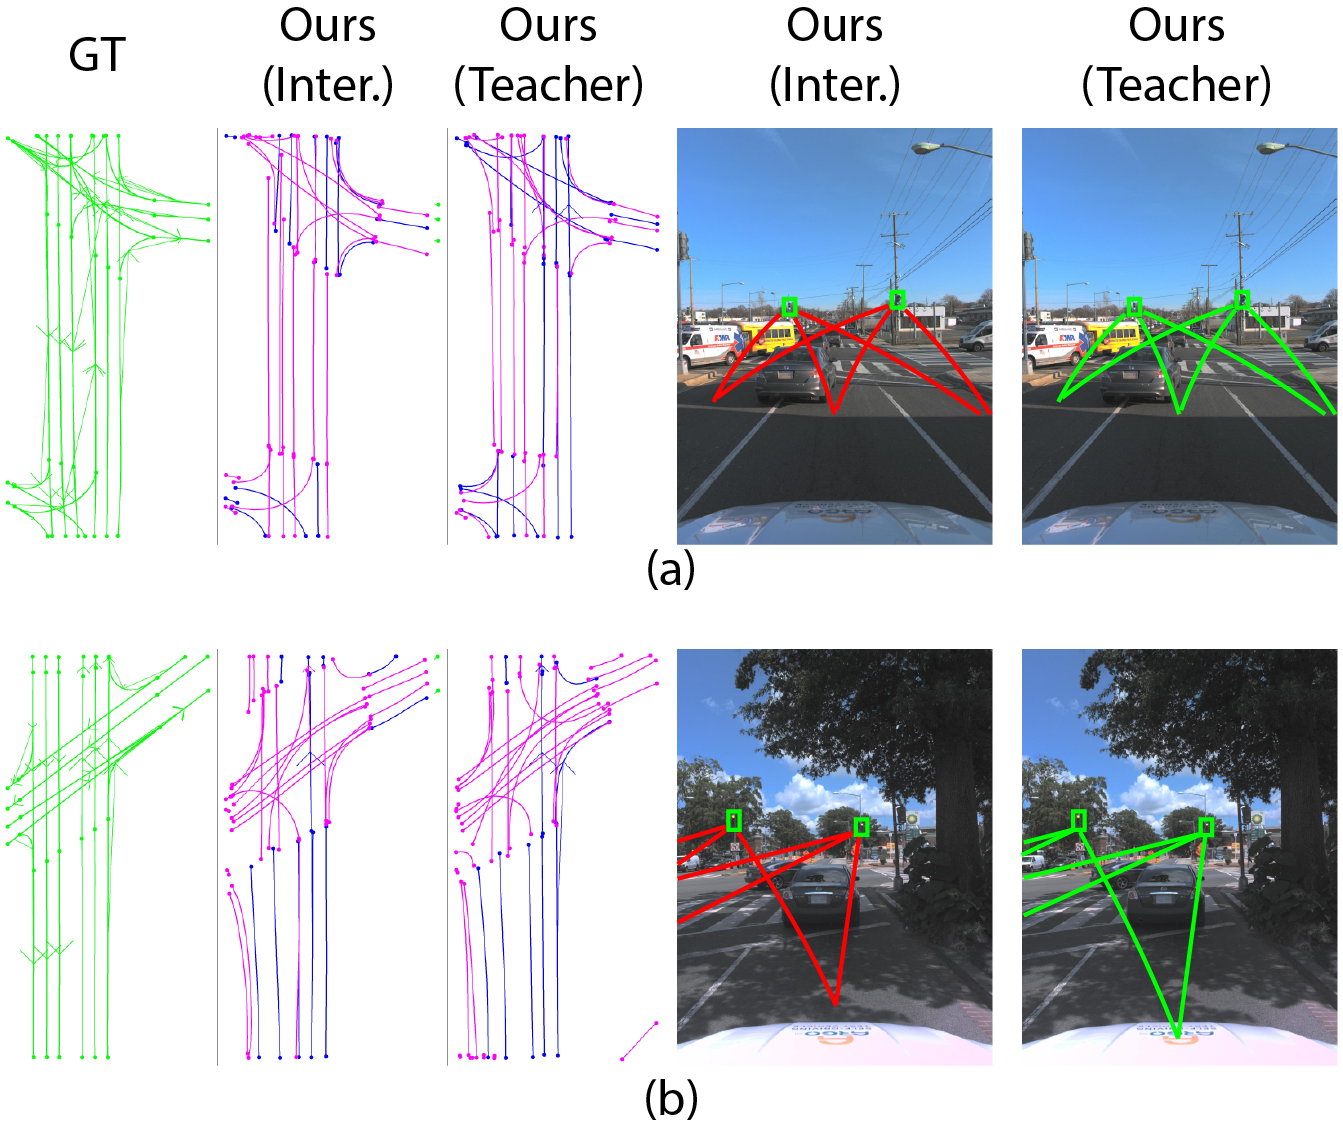
The qualitative figures compare selected scenes, with original color codes marking true positives, false positives and missed relationships. They illustrate mechanisms and failures rather than a separate statistical evaluation.
IV-D 1 Without SD Map Inputs
In the camera-only examples, both models detect several traffic lights, but TopoNet misses their associations with the ego lane while the distilled student recovers them. Lane-graph examples also show more correct connections. These selected cases complement the modest aggregate gains in Table I.
IV-D 2 With SD Map Inputs
The map-enhanced teacher is compared with SMERF in Figure 5, as its panel labels and surrounding discussion show. Its caption incorrectly repeats the TopoNet/student wording from Figure 4; the original caption is preserved with this clarification. The selected teacher examples recover two lane–traffic relations missed by SMERF.
IV-E Ablation
Ablations separately test map-derived feature distillation and a specific additional mixing operation across relation features.
IV-E 1 Effects of Distillation
Distillation improves OLS from 39.9 to 40.6, lane detection 29.6→30.2, traffic detection 47.8→48.7, lane–lane topology 10.5→11.0 and lane–traffic topology 24.7→25.2. Inference architecture and reported speed remain unchanged.
Without distillation, OLS is nearly TopoNet’s 39.8 rather than a large accuracy gain; traffic detection and lane–lane topology are lower than that baseline. Map-based supervision accounts for part of the final accuracy advantage.
| Method | OLS | ||||
|---|---|---|---|---|---|
| Ours (No distillation) | 39.9 | 29.6 | 47.8 | 10.5 | 24.7 |
| Ours (Student) | 40.6 | 30.2 | 48.7 | 11.0 | 25.2 |
IV-E 2 Effects of Extra Feature Interactions
The tested interaction variant uses the full relation matrix, a 3×3 stride-one convolution with same padding, and adaptive average pooling to recover the desired lane-pair size. Teacher OLS falls 44.3→42.9 and every listed component metric declines.
This rejects that particular mixing design in this experiment. It does not establish that all extra cross-task feature interaction is harmful.
| Method | OLS | ||||
|---|---|---|---|---|---|
| Ours (Teacher) | 44.3 | 33.5 | 49.4 | 17.1 | 28.2 |
| Ours (Interactions) | 42.9 | 33.0 | 47.1 | 16.6 | 25.8 |
V CONCLUSIONS
The experiments support attention reuse as a smaller, faster topology-prediction module and feature distillation as useful camera-only supervision. Accuracy improvements are modest and uneven across metrics; backbone-excluded speed should not be presented as a full-stack latency reduction.
The paper supplies public code but no confidence intervals, repeated-seed analysis, adverse-weather robustness study or closed-loop driving test. The method still depends on accurate visual representations and, during teacher training, suitable maps.