Overview
Keywords: generalist robot-policy evaluation and crowdsourced benchmarking.
At a glance
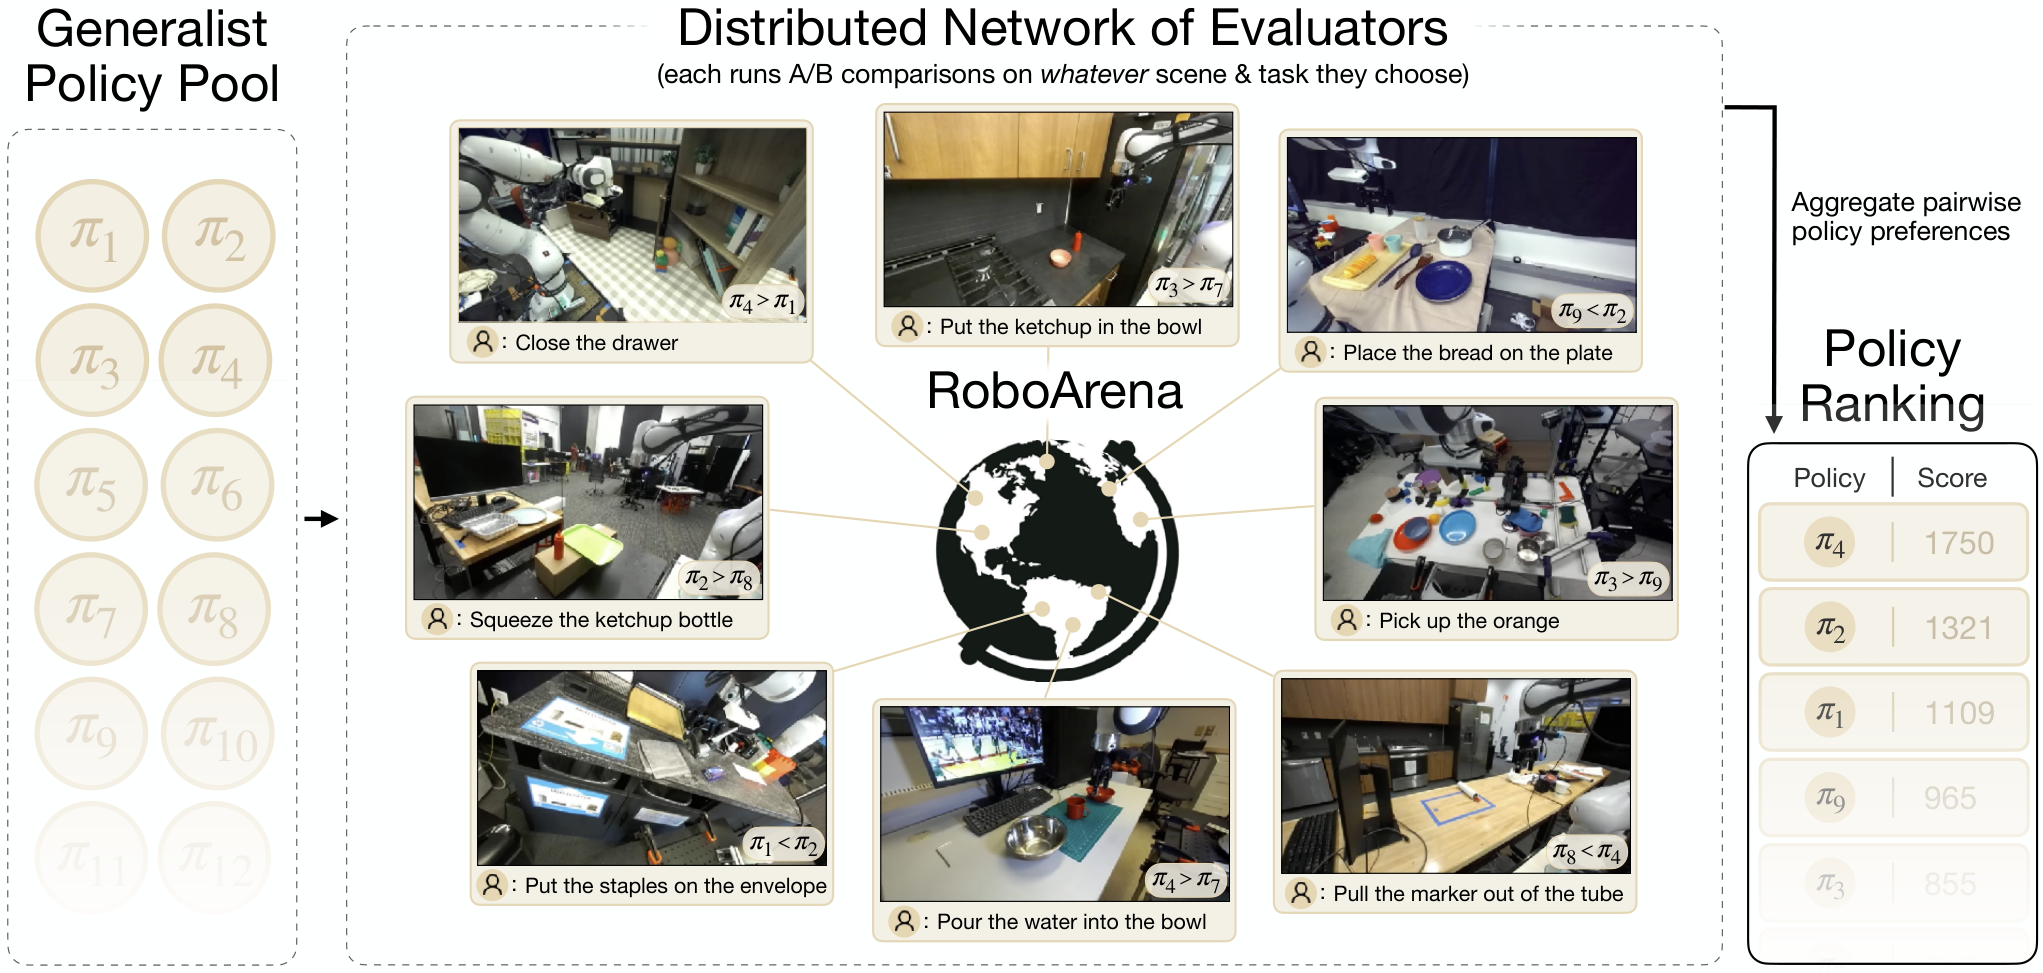
RoboArena evaluates generalist robot policies through distributed, blinded A/B comparisons on tasks chosen by local evaluators. Initial conditions must match within each pair, but need not be standardized across institutions. A task-aware preference model aggregates the comparisons, while language-model reports summarize qualitative behavior. The DROID study compares seven policies across seven universities using 612 pairs, with 4,284 total rollouts collected to construct an exhaustive progress-score reference.
1 Introduction
The proposal trades global scene standardization for local pairwise control. Evaluators can vary objects, backgrounds, and instructions, making broad coverage easier than reproducing a fixed benchmark everywhere. Blinding policy identity and aggregating many evaluators are intended to reduce individual influence; they do not prove immunity to bias or malicious feedback.
The important distinction is between the 612 pairwise comparisons used by RoboArena and the larger 4,284-rollout dataset used to measure its ranking accuracy. The latter additionally evaluates the other five policies on each task. The resulting “oracle” is an empirical ranking on these sampled tasks, not a universal measure of robot competence.
Related source: Chatbot Arena.
2 Related Work
The motivation connects the reproducibility limits of physical benchmarks with the growing scope of generalist policies and the use of crowdsourced model preferences.
Simulated and real-world robot evaluation.
Simulation enables repeatable, parallel testing but can misrepresent physical performance. Real-world benchmark manuals, remotely hosted robots, and competitions offer different forms of control, usually over narrower tasks or locations. RoboArena broadens coverage by restricting matched conditions to the two runs in each comparison.
Generalist robot policies.
Policies trained on diverse robot data can sometimes execute new tasks and scenes without retraining. That property makes distributed evaluation practical: each site can test the same policy directly rather than train a site-specific model. It also raises the burden of sampling sufficiently diverse evaluation conditions.
Crowd-sourced benchmarks.
The approach adapts crowdsourced preference benchmarking from language and generative models. Earlier distributed robot benchmarks compared learning procedures after retraining for each institution; RoboArena instead compares already trained generalist policies. This changes both the unit being ranked and the cost of adding evaluation sites.
3 Decentralized Robot Policy Evaluation via Pairwise Comparison
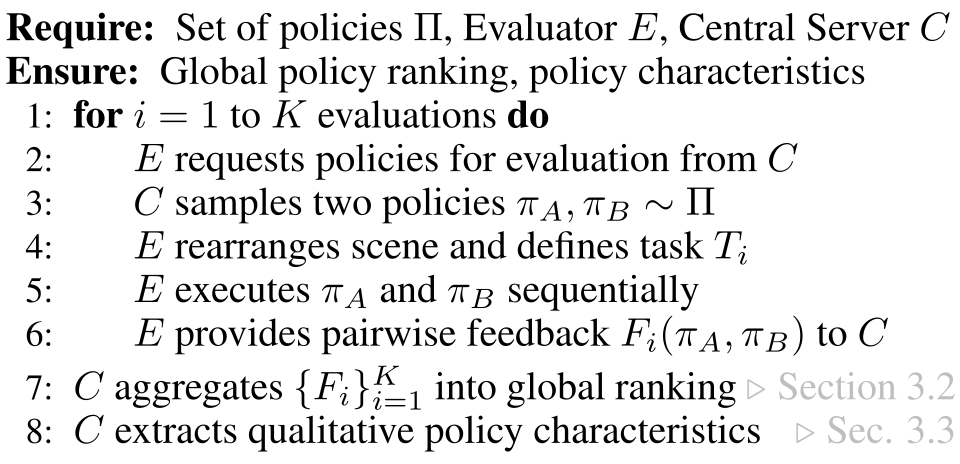
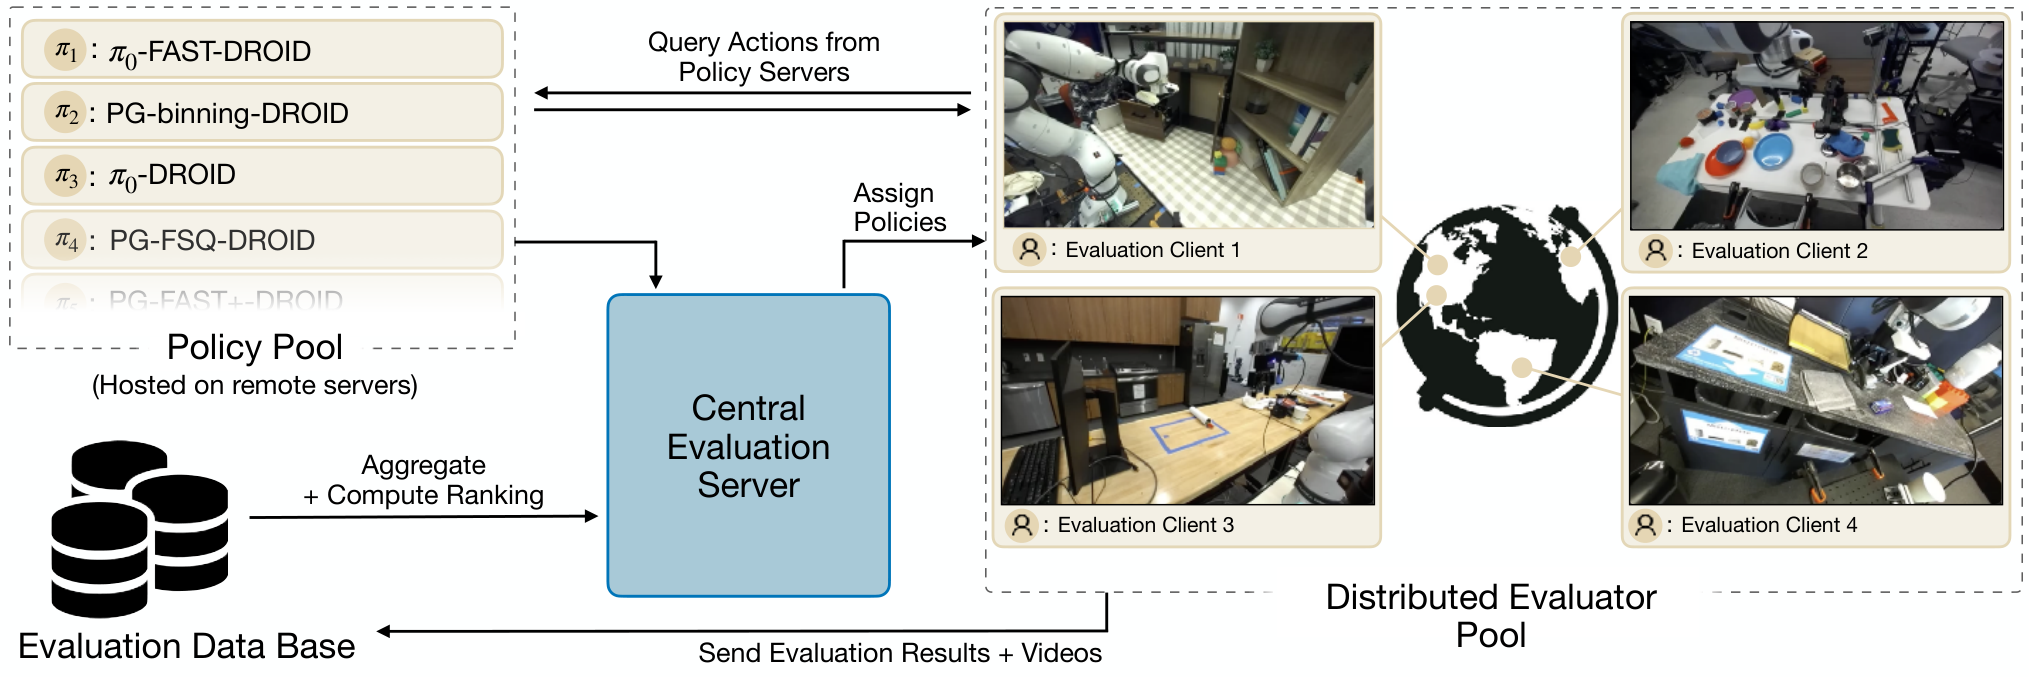
A central service assigns policy pairs, while distributed evaluators choose scenes and tasks. Pairwise feedback yields a global ranking; associated videos and language explanations support qualitative analysis. Open-ended task selection is a design feature, with the resulting ranking conditional on the tasks evaluators actually choose.
3.1 Policy Evaluation Protocol
An evaluator requests two anonymous remote policy endpoints, arranges a scene, and specifies a natural-language task. The policies run sequentially until completion or timeout, with the initial state closely reset between them. The evaluator reports maximum progress on a 0–100 scale, a preference, and a free-form explanation; observations and actions are uploaded centrally. Sessions can otherwise proceed asynchronously.
The protocol assumes that all assigned policies can meaningfully and safely operate across the task pool. Preferences are left to evaluator judgment, so they can reflect speed, confidence, or recovery in addition to completion. Although the main description presents binary preferences, the appendix explicitly extends the ranking model to ties.
3.2 Computing Global Policy Rankings
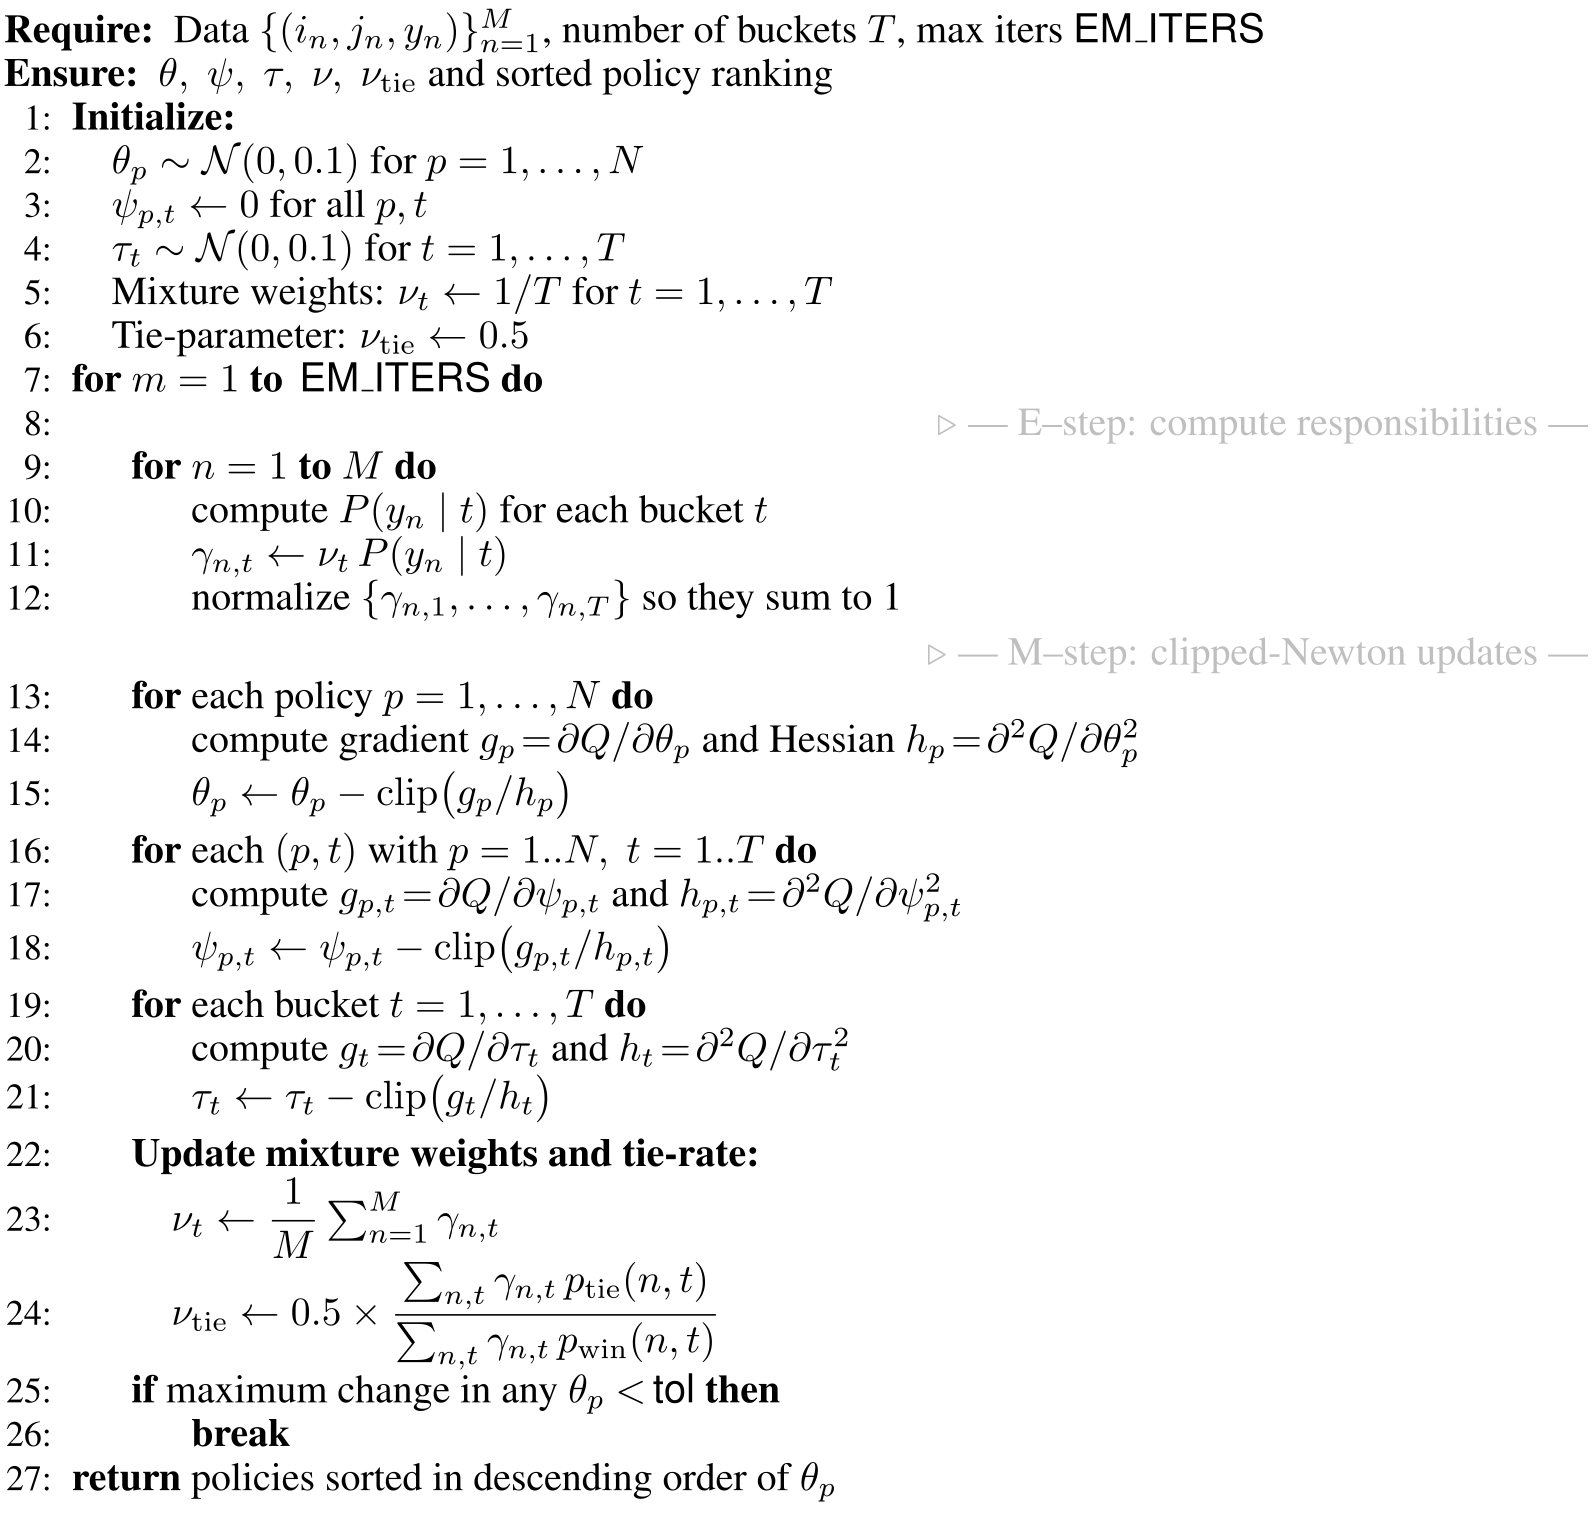
Standard Bradley–Terry models preference through a difference in policy abilities. RoboArena adds a mixture of latent task buckets, each with a difficulty, sampling weight, and policy-specific offset. These variables let relative policy strengths vary with task type; bucket identities are inferred from preferences without observed task labels. Approximate expectation-maximization alternates responsibilities with clipped Newton parameter updates and ranks global abilities.
This is a modeling assumption rather than a guarantee of recovering a unique task taxonomy or unbiased ability. The printed probability expressions are not explicitly normalized over win, loss, and tie outcomes; the appendix notes below preserve this reproducibility caveat rather than silently repairing the formulas.
Related source: the Bradley–Terry model.
Equation 1
| (1) |
3.3 Extracting Qualitative Policy Characteristics
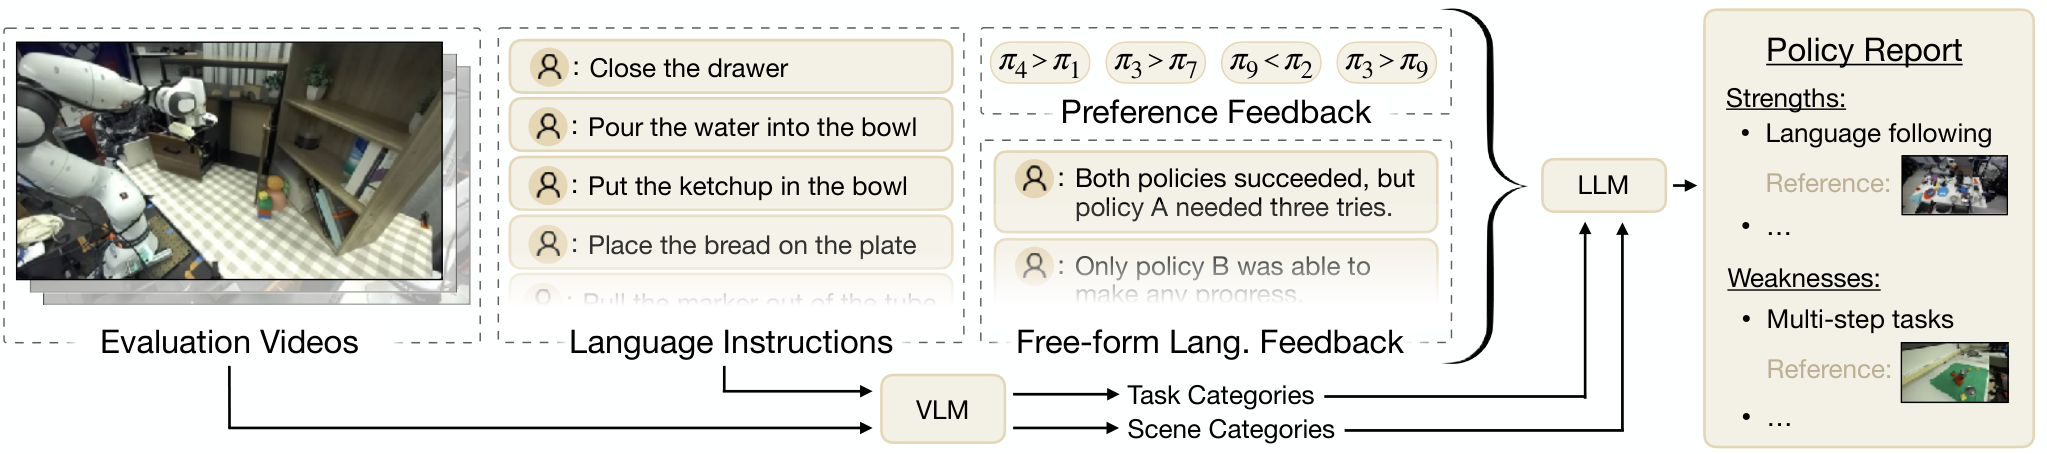
A vision-language model categorizes the instruction and initial scene images, then a language model summarizes task categories, preferences, and evaluator explanations into a policy report. Reports are instructed to cite rollout IDs, which link to videos for verification. This creates an auditable synthesis aid, not an independently validated explanation of policy internals. The methods name GPT-4.5 for categorization and o3 for report generation; Figure 8 instead labels the categorizer GPT-4o.
4 The DROID-RoboArena Evaluation System
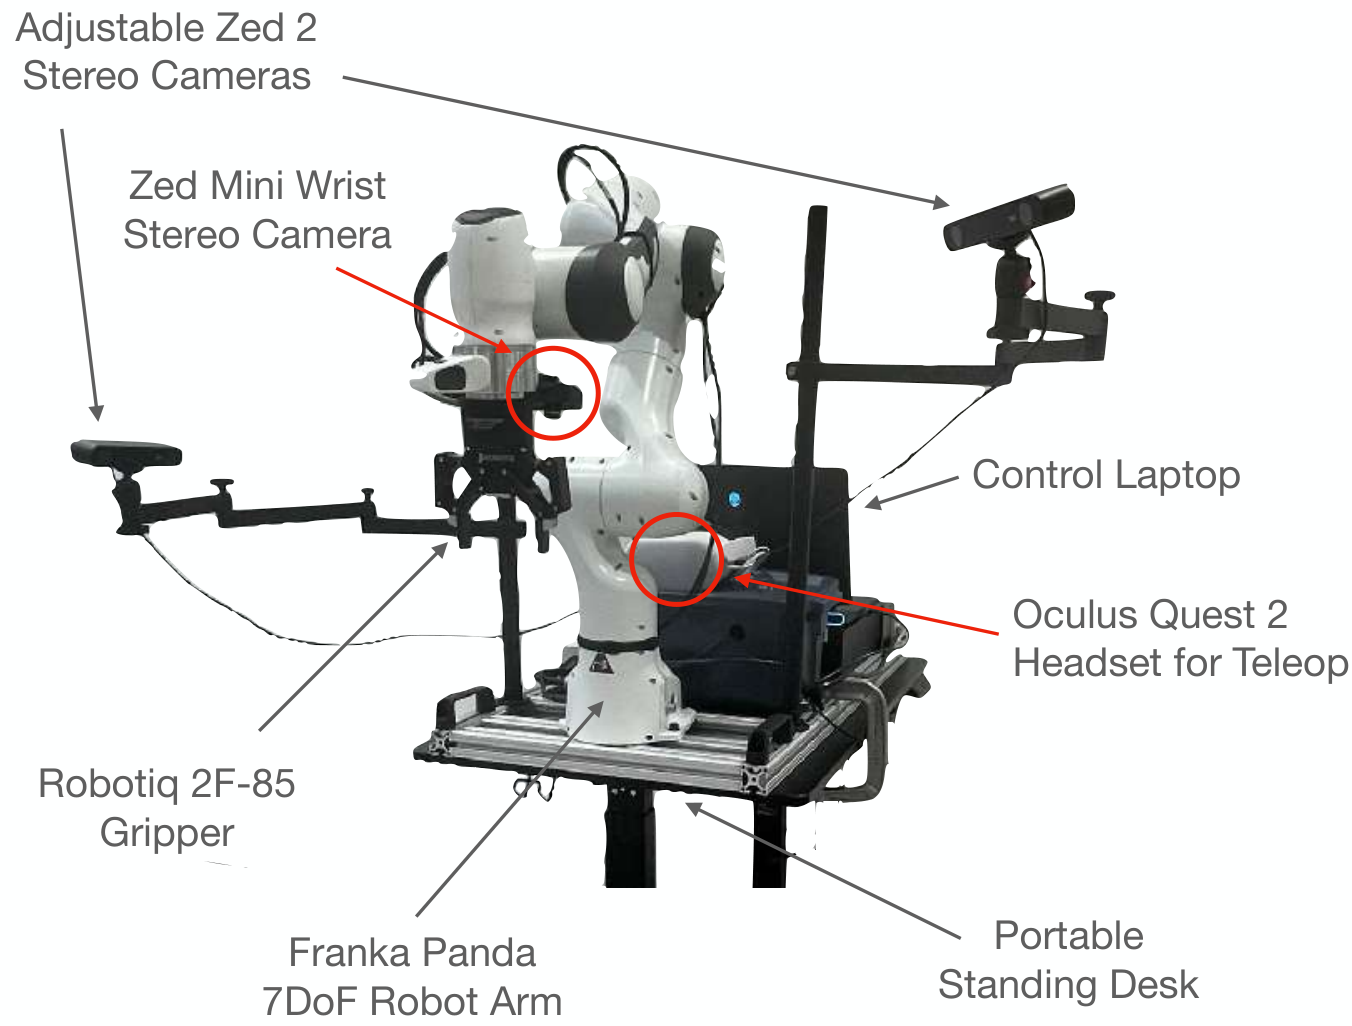
The implementation uses the DROID platform: a seven-joint Panda arm, parallel gripper, wrist and external stereo cameras, and a movable height-adjustable table. Existing DROID data and installations make both policy training and distributed deployment feasible. Other embodiments are proposed extensions; the reported evaluation remains on this shared hardware family.
Related source: DROID.
4.1 RoboArena System Design
Remote policy servers perform inference; lightweight robot clients conduct sessions and upload results; a database stores instructions, scores, explanations, and videos; and a central server assigns pairs and handles policy registration or timeouts. Contributors can host their own policies without releasing weights. Remote latency was acceptable for the tested mostly static manipulation tasks, but dynamic tasks may need local inference. Decentralized evaluation still relies on central coordination and storage.
4.2 Open-Sourcing RoboArena: Interfaces, Safety and Incentives
The proposed community system combines input/output checks with supervised trial runs before exposing a submitted policy to general evaluators. Evaluation credits reward each contributed pair with a requested pair involving the contributor’s policy, while sponsoring institutions provide a limited budget for users without robots. Separate all-policy and reproducible open-policy leaderboards are planned. These are the paper’s operating design and stated plans, not a verification of present service availability.
5 Experiments
Experiments measure agreement with exhaustive progress-score rankings, the number of comparisons needed, and whether automated reports capture observed qualitative differences. The comparisons test this evaluation framework on a particular policy pool and task sample.
5.1 Experimental Setup
The seven DROID-tuned policies are π0-flow, π0-FAST, and five PaliGemma variants using flow matching, FAST, FAST+, finite scalar quantization, or simple binning. All use the public openpi implementation. After each A/B trial, the remaining five policies are also run on that task, producing 612 × 7 = 4,284 rollouts for the exhaustive reference.
The conventional comparator is the earlier DROID evaluation protocol with 17 tasks and 44 episodes per policy. Comparing distributed samples with this narrower protocol tests coverage as well as ranking algorithms; it does not isolate every possible advantage of decentralization or establish superiority to all controlled benchmarks.
Related source: FAST action tokenization.
5.2 RoboArena Accurately Ranks Policy Performances
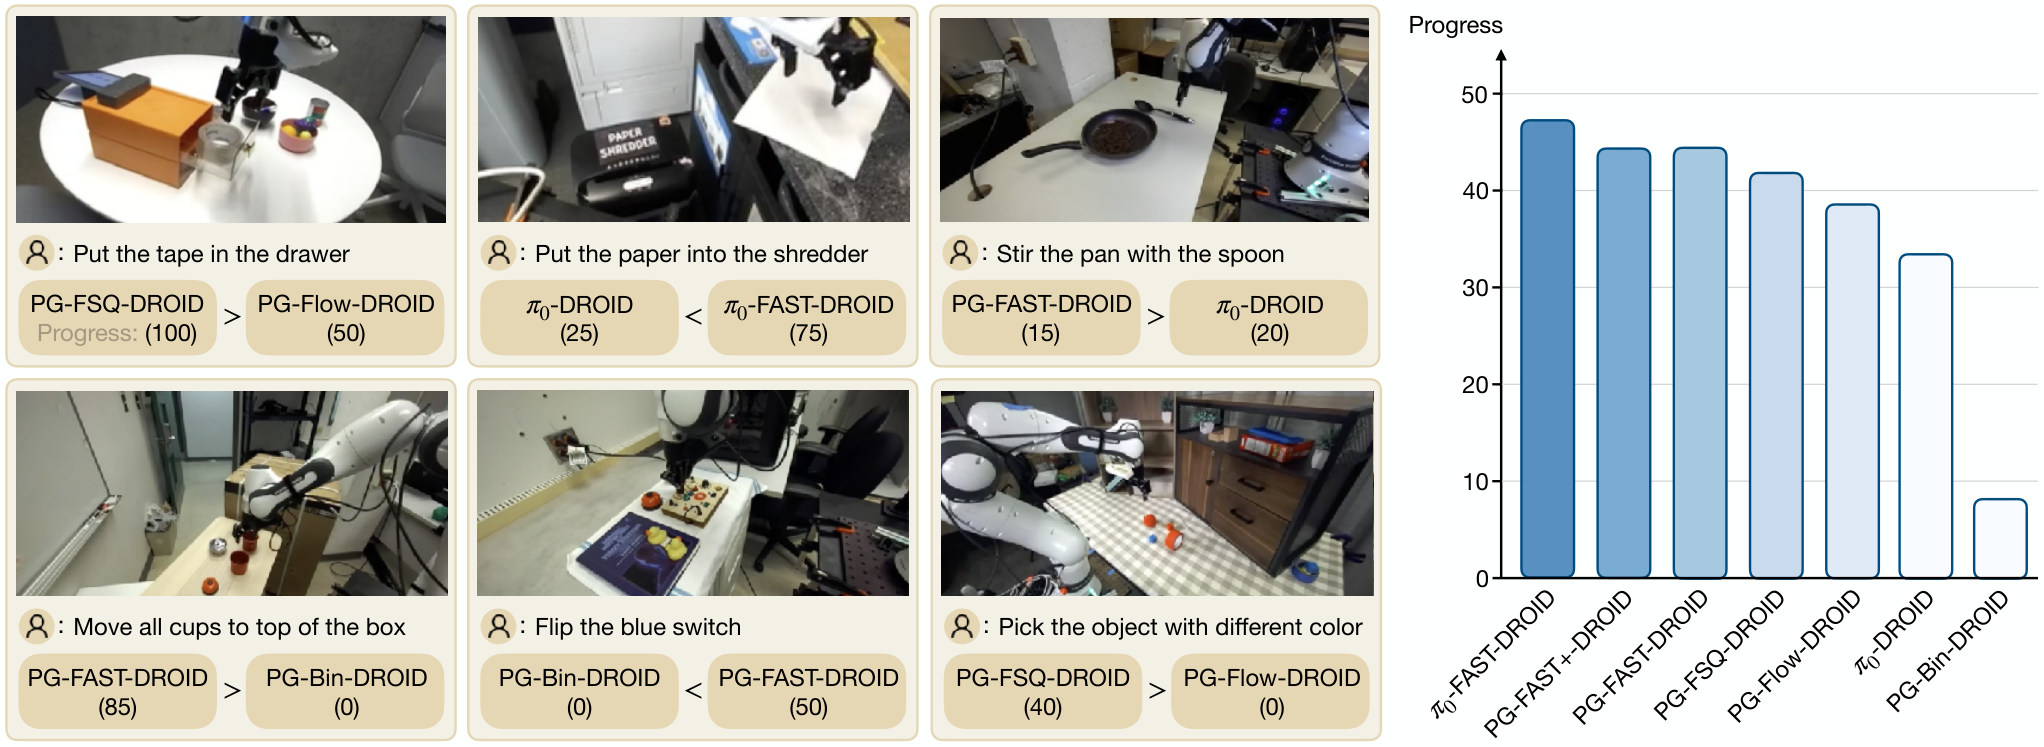
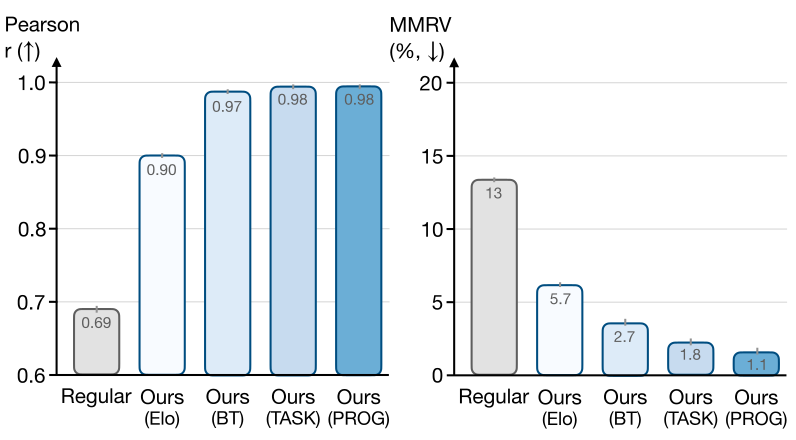
Figure 6 reports Pearson correlation of 0.69 for conventional evaluation, 0.90 for distributed Elo, 0.97 for distributed Bradley–Terry, and 0.98 for both task-aware and progress-based rankings. Mean maximum rank violation falls from 13% to 5.7%, 2.7%, 1.8%, and 1.1%, respectively. Thus task awareness improves preference-based ranking, while simple progress averaging has the lowest reported rank-violation score.
π0-FAST leads this policy pool; expressive action representations generally outrank simple bins. These are empirical tendencies within the tested training setups. Progress averaging agrees strongly with an oracle that is itself defined by average progress, while preferences also capture qualities such as decisiveness that the progress score omits. Both forms of feedback are useful and should be reported.
5.3 RoboArena Evaluation is Sample Efficient
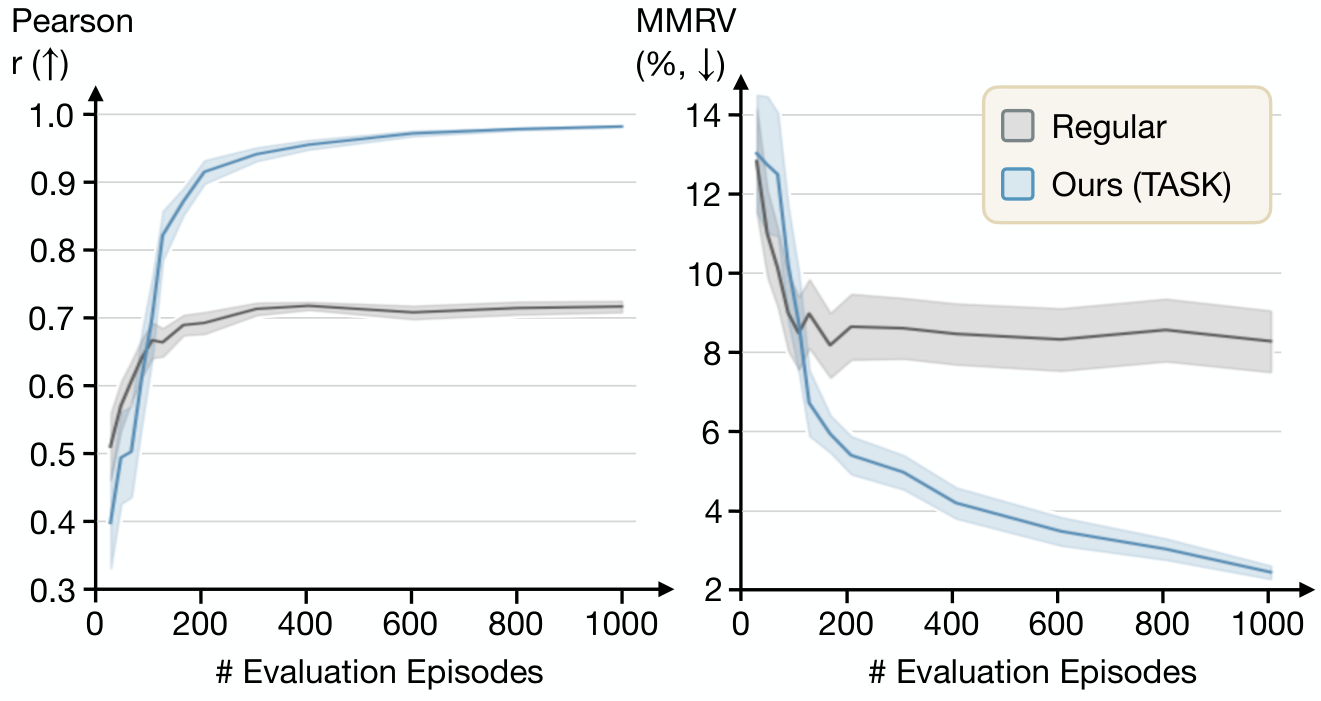
Random subsets of the collected comparisons show high-quality rankings after roughly 100 pairs, with continued improvement as more data is added. One pair comprises two rollouts, so the pair count should not be confused with the plotted number of episodes or the 4,284-rollout reference cost. The sample-efficiency result concerns resampling this dataset, not a prospective guarantee for a new population of policies and tasks.
5.4 Extracting qualitative policy characteristics
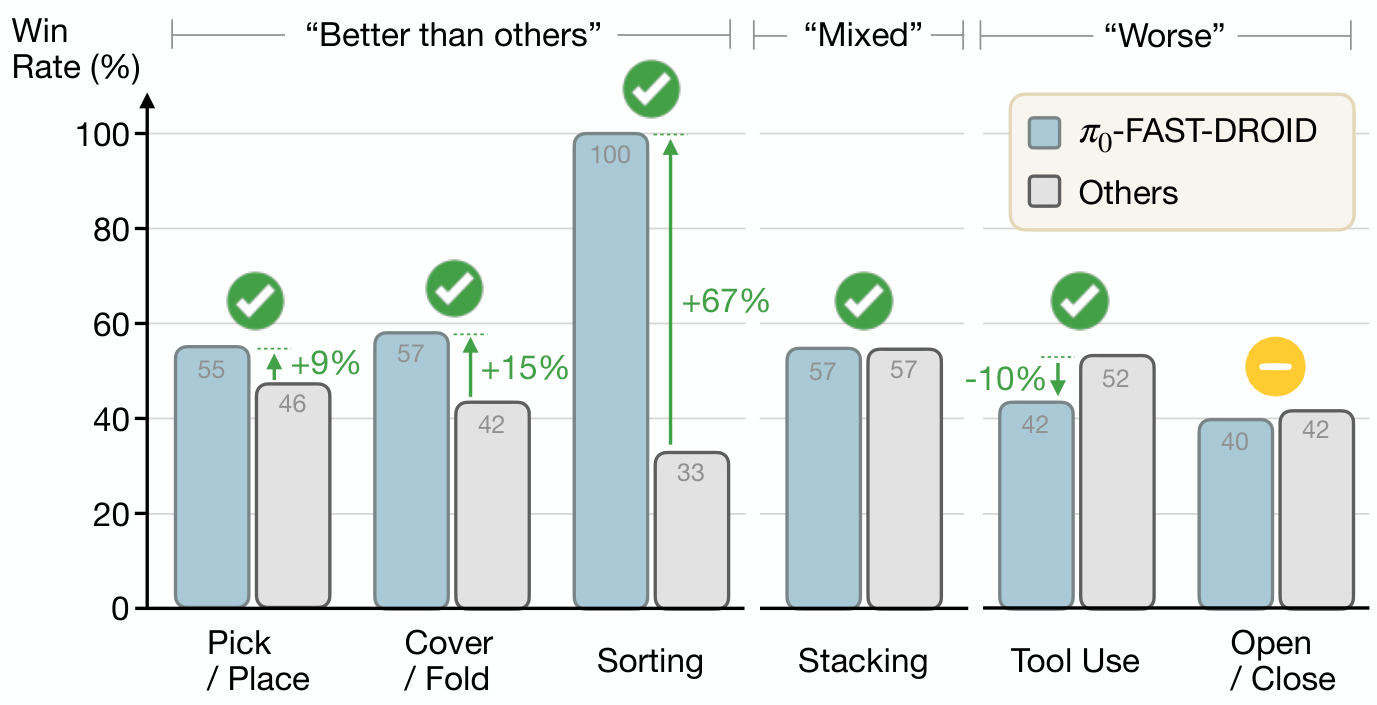
Figure 8 reports 94.6% task-category agreement with an expert over 448 samples, labeling the model GPT-4o despite the GPT-4.5 methods description. For π0-FAST, most generated comparative claims agree with category-level win rates; the open/close judgment is a visible exception. This is a limited check of one report and categorization accuracy, rather than a comprehensive factuality or causal-reasoning evaluation.
| Model | Task Category Acc. |
| GPT-4o | 94.6% |
6 Discussion
The study demonstrates that broadly sampled pairwise real-robot evaluations can estimate this dataset’s overall policy ranking more accurately than the tested narrow benchmark, while yielding useful qualitative evidence. Its practical contribution is the distributed protocol and supporting infrastructure; continued community operation and broader policy coverage remain future work in the paper.
7 Limitations
Only one robot platform is evaluated. Unrestricted task choice makes one-factor controlled experiments difficult, so RoboArena complements targeted tests of camera, object, or other generalization changes. Robustness to intentionally misleading evaluators is not tested. Leaderboard over-optimization remains possible, and evolving tasks or policy pools may change what the aggregate ranking means.
Related source: targeted generalization evaluation.
Acknowledgments
The authors acknowledge evaluation volunteers, robot maintenance, institutional and agency funding, hardware support, and contributed computing resources. The distributed evaluation depended on both physical infrastructure and substantial human effort.
Appendix A Contributions
Atreya, Pertsch, and Lee lead system design, implementation, and experiment design; a broader cross-institution team runs policy evaluations. The appendix separately credits simulated-environment work, writing, coordination, and advising, making the human evaluation contribution explicit.
Appendix B Policy Ranking EM Procedure
The appendix specifies the latent-bucket model, derivative expressions, clipped-Newton expectation-maximization procedure, optional partial-success extension, baseline estimators, hyperparameters, and a simulated distribution-shift test. Original mathematics and pseudocode are preserved alongside the noted inconsistencies.
B.1 Model Definition
The model assigns each comparison to an unobserved task bucket and combines global ability, policy–bucket offsets, and bucket difficulty. The appendix supports three observed outcomes: loss, tie, and win.
Observed data.
Each observation identifies the two policies and an outcome coded 0, 1, or 2. True task IDs are not observed by the ranking model. The finite set of latent buckets approximates heterogeneity in the comparison data.
Equations
Latent tasks and mixture weights.
Nonnegative mixture weights sum to one and represent the prior chance that a comparison belongs to each task bucket. The number of buckets is a chosen hyperparameter rather than a measured number of task classes.
Equation
Per‐policy and per‐bucket parameters.
A policy’s global log-ability is adjusted by its bucket-specific offset and reduced by bucket difficulty. This permits different relative strengths across subsets of tasks, but also introduces parameter ambiguities that require regularization or centering.
Equation
Tie‐model parameter.
A shared tie parameter scales a Davidson-style draw term. It is distinct from the mixture weights despite the reused Greek-letter notation.
Link function and conditional likelihood.
Sigmoids turn adjusted abilities into independent solve probabilities. A win is modeled as one policy solving while the other does not; a symmetric term gives a loss, and a geometric-mean expression gives a tie. The bucket mixture then marginalizes these scores.
As printed, the three expressions do not generally sum to one: when both solve probabilities are 0.5, their sum is 0.5 + 0.5 times the tie parameter. No outcome-normalization denominator is shown. This source-level specification issue is retained; the notes do not assume that the released implementation has the same behavior.
Equations
B.2 Gradient & Hessian Derivation
The derivation computes mixture responsibilities and blockwise first and second derivatives for approximate maximization. The formulas are retained as published. Several sign, outcome-coding, and normalization details require checking against an implementation before reproduction.
Expected complete‐data objective.
The E-step normalizes bucket likelihoods into posterior responsibilities. The expected complete-data objective combines weighted log mixture and outcome terms with quadratic penalties on global abilities and policy–bucket offsets. This normalization is over buckets; it does not by itself resolve the missing normalization across outcomes noted above.
Equations
Gradient w.r.t. θ p .
Only comparisons involving a policy contribute to its ability derivative. The example win derivatives are positive for the winning policy’s solve logit and negative for the losing policy’s. The displayed aggregate formula additionally subtracts the second-policy derivative, a sign convention that is not reconciled in the text; it should be verified before implementing the update.
Equations
Hessian w.r.t. θ p .
The printed curvature sums responsibility-weighted negative logistic variances and the ability regularizer. It provides a simple blockwise Newton approximation; the source does not separately derive the curvature of every tie and normalization term.
Equation
Gradients/Hessians for ψ p , t .
Policy–bucket offsets receive analogous gradients and curvature, restricted to a single bucket and with their own quadratic penalty. The same second-policy sign convention appears here.
Equations
Gradients/Hessians for τ t .
Bucket difficulty enters both policy logits negatively, so its update combines contributions from both participants. Algorithm 2 alternates these blockwise clipped-Newton steps with updates to mixture weights and tie rate, then stops on small changes in global ability and sorts those abilities. The prose mentions centering, but the printed pseudocode does not show that step.
Equations
B.3 Including Partial‐Success Information
When partial-progress scores are available, an extra Gaussian agreement factor compares them with predicted solve probabilities. Its weight and variance determine how much it influences responsibilities and derivatives. This optional extension uses additional continuous supervision; it is not necessary for the preference-only formulation.
B.4 Baseline Ranking Algorithms
The baselines separate offline preference fitting, online rating updates, and direct progress averaging. Their different information sources matter when interpreting agreement with a progress-defined reference ranking.
Bradley–Terry MLE (offline).
Offline Bradley–Terry fits sigmoid ability differences using all comparisons, optionally regularizing abilities and treating a tie as half a win. The printed gradient uses the outcome symbol also described as 0/1/2, without showing conversion to a binary or half-win target; this coding ambiguity should be resolved before implementation.
Equations
Elo‐style online update.
Elo updates the two participating ratings immediately using the difference between observed outcome and predicted win probability. Here the text explicitly uses 1 for a win, 0 for a loss, and 0.5 for a tie, with a fixed step factor.
Equation
Partial‐Success Averaging.
Progress averaging ranks each policy by the mean fractional success over its rollouts. It discards pair structure and preference nuances, but directly matches the quantity used to construct the study’s exhaustive oracle.
Equation
B.5 Hyperparameter Table
Reported defaults are 60 iterations, 60 latent buckets, unit step clipping, 0.01 penalties on ability and offset, 0.99 step decay, and a 10⁻⁴ stopping tolerance. Table 1 also lists search ranges; the default iteration count of 60 is not among its displayed 50/100/200 search values. The source table is preserved.
| Parameter | Default | Search range |
| EM_ITERS | 60 | |
| # buckets | 60 | |
| step_clip | 1.0 | |
| l2_theta | ||
| l2_psi | ||
| step_decay | 0.99 | |
| tol |
B.6 Simulating Shifts in the Task Distribution and Policy Set
The authors order sampled tasks from easier to harder and replace weaker policies with stronger ones, using progress scores to define both changes. Under this artificial drift, RoboArena correlation is 0.838 versus 0.692 for conventional evaluation, with rank violation 0.058 versus 0.141. This supports robustness to the tested constructed shift, not to arbitrary future drift or adversarial task selection.
| Eval Approach | Pearson | MMRV |
| Regular | 0.692 | 0.141 |
| RoboArena w/ dist. shifts (ours) | 0.838 | 0.058 |
Appendix C Evaluation Data Breakdown
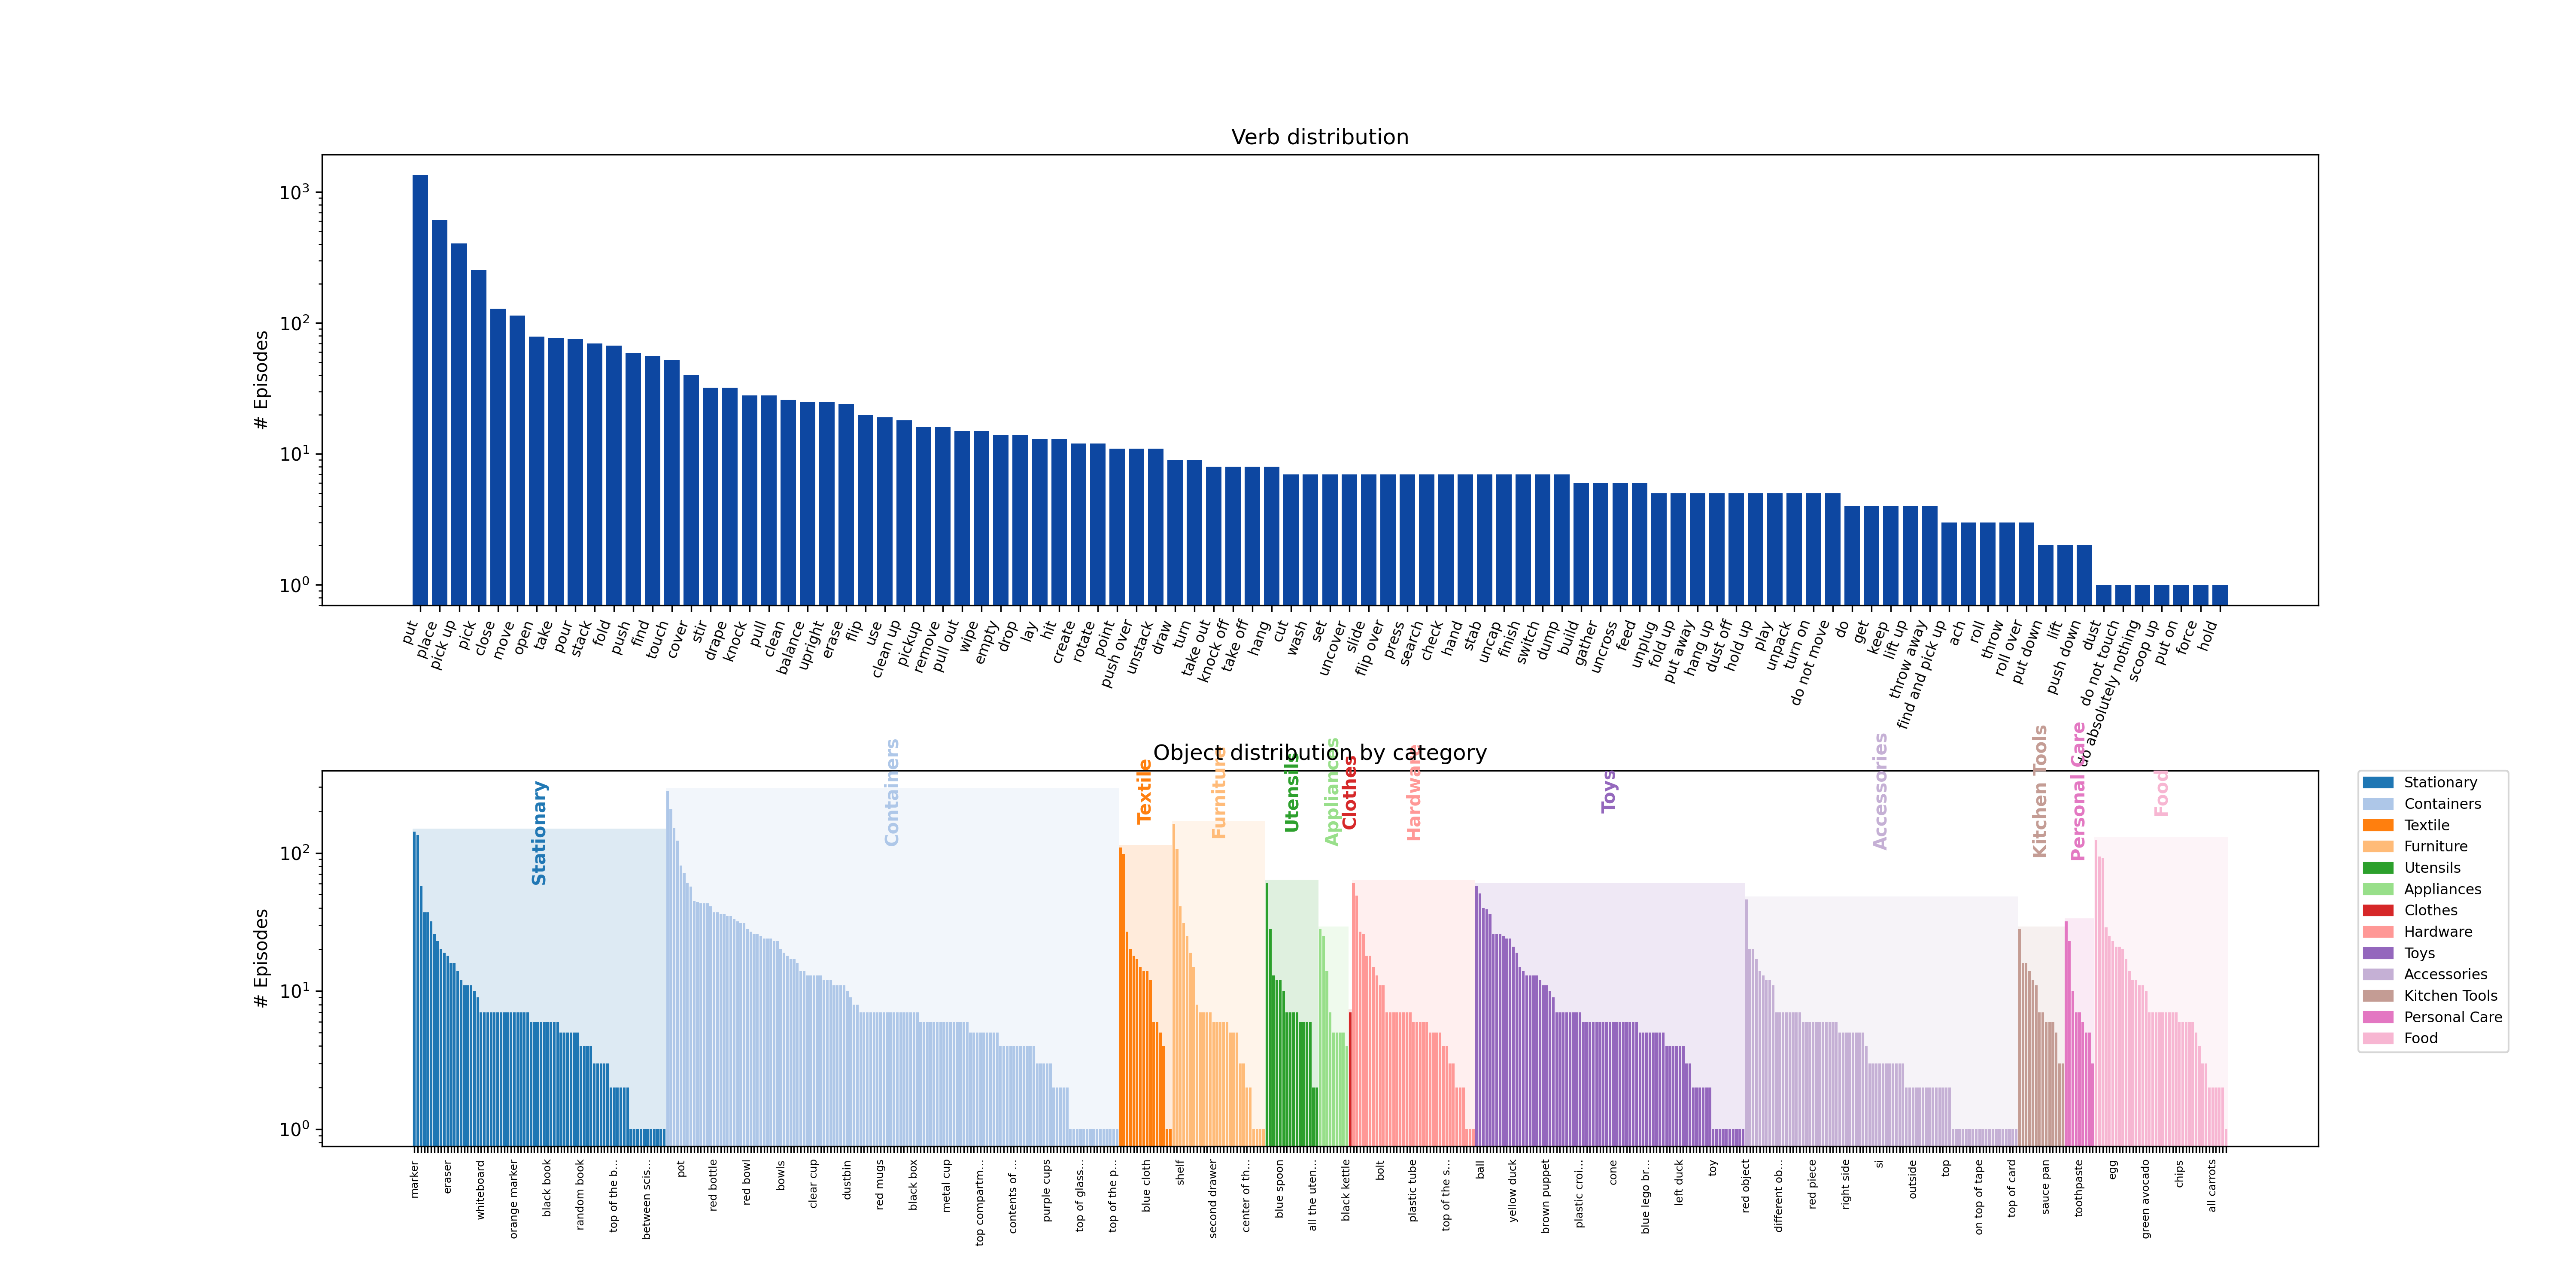
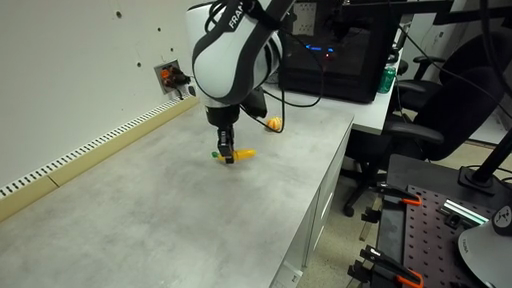
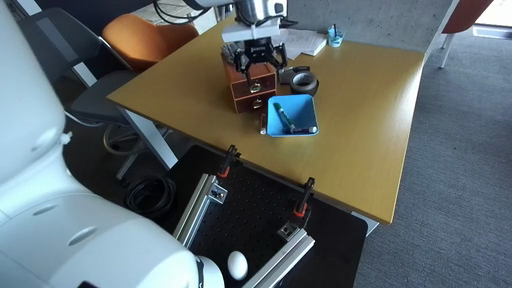
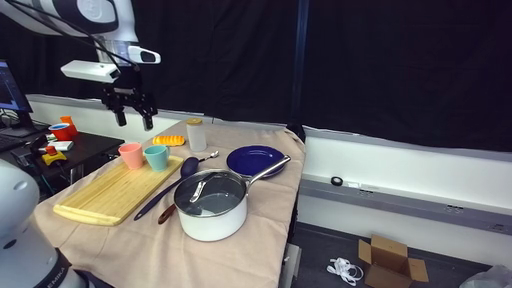
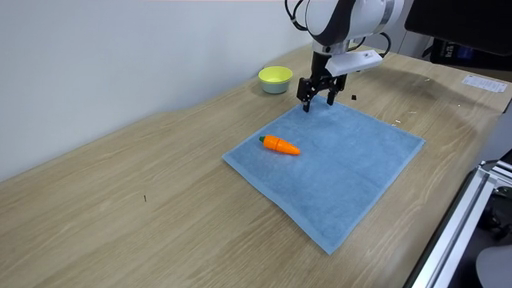
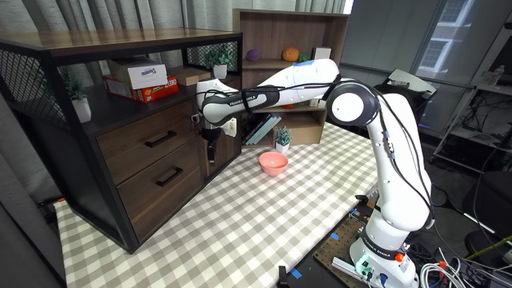
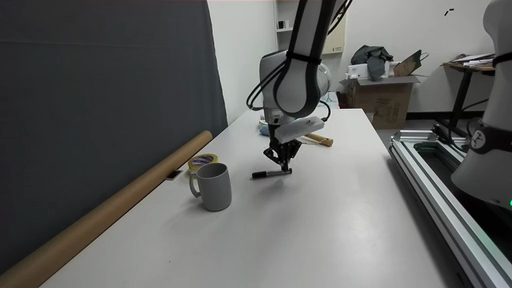
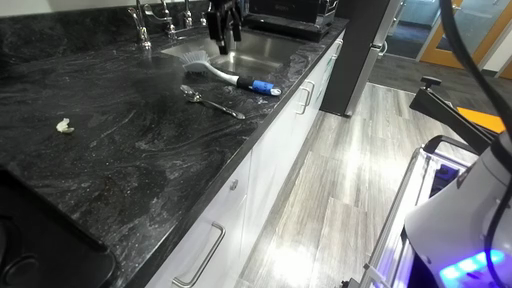
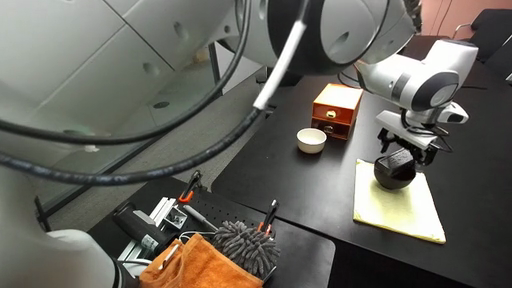
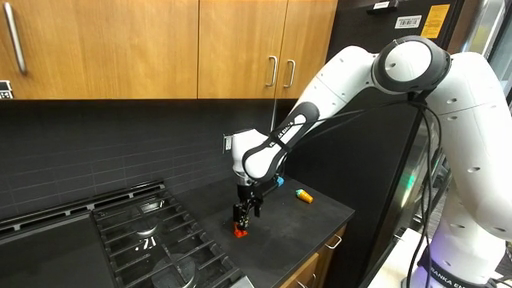
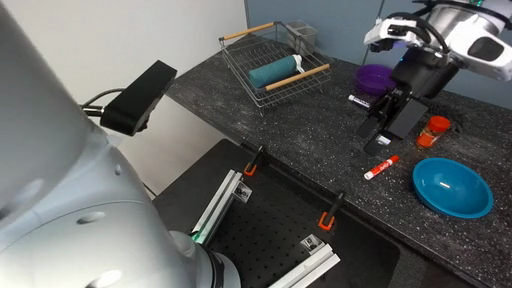
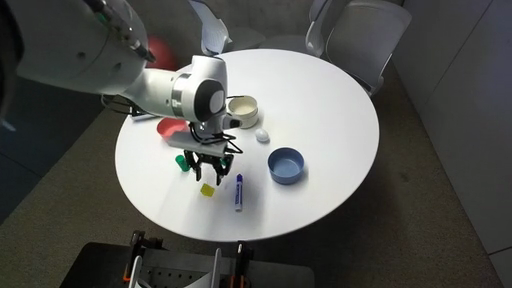
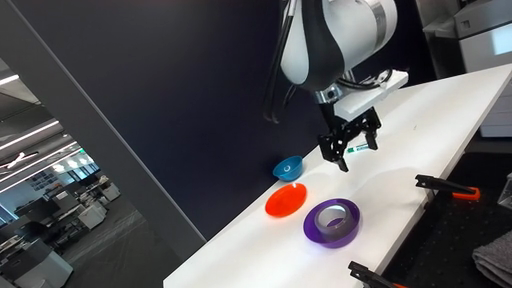
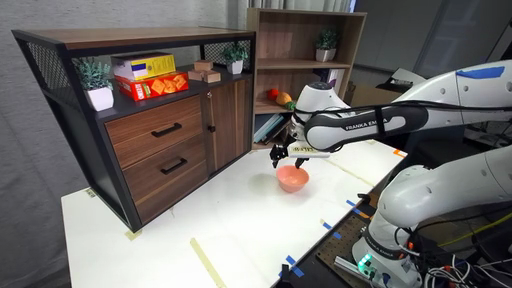
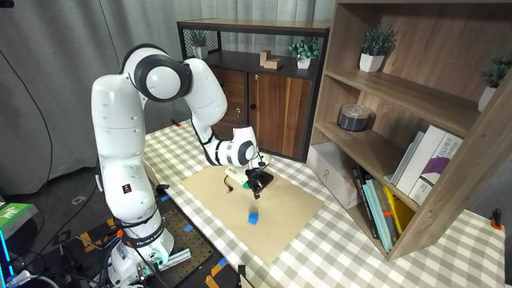
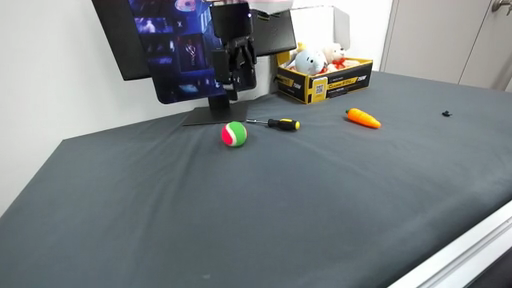
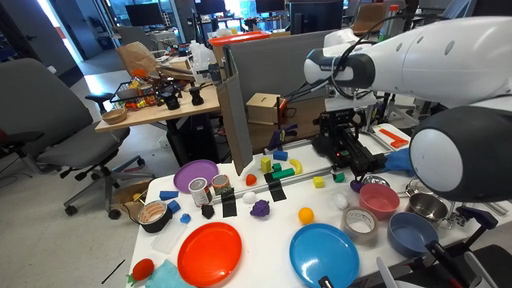
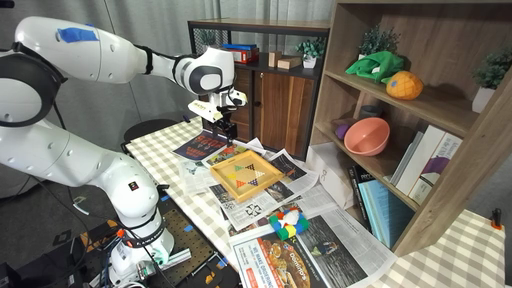
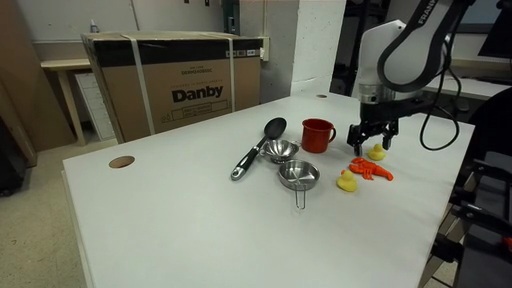
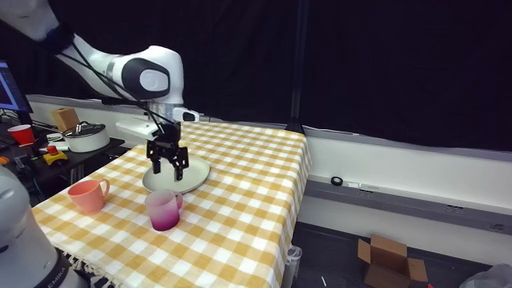
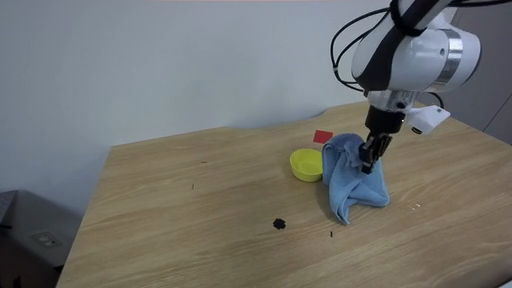
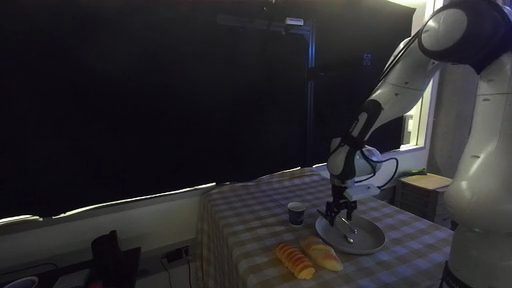
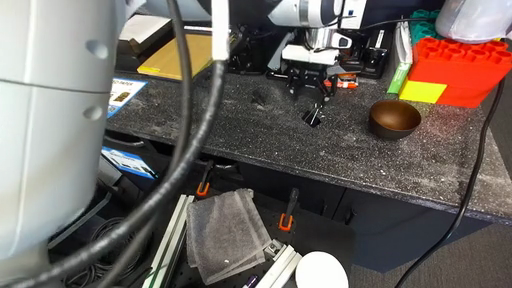
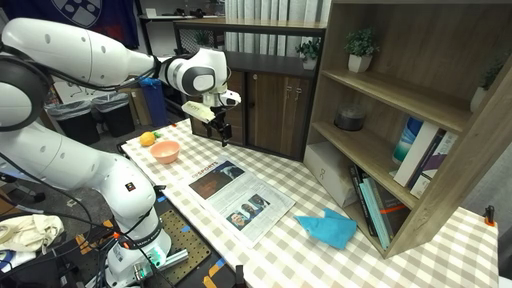
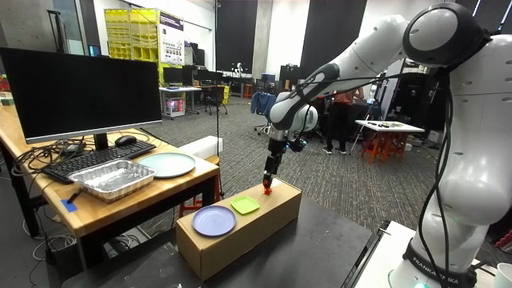
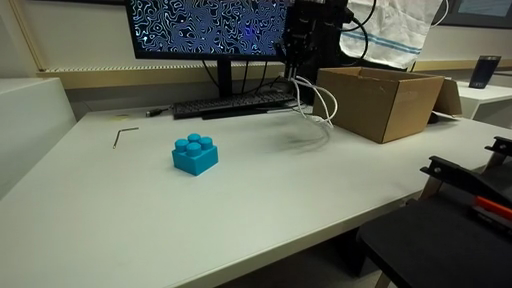
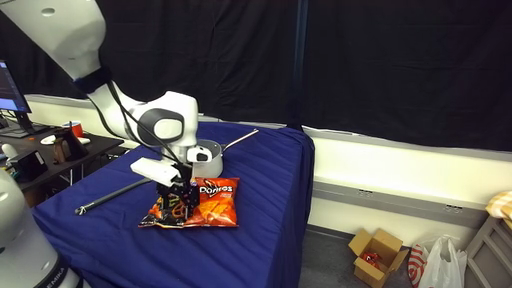
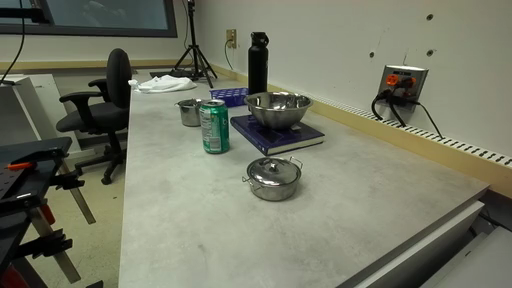
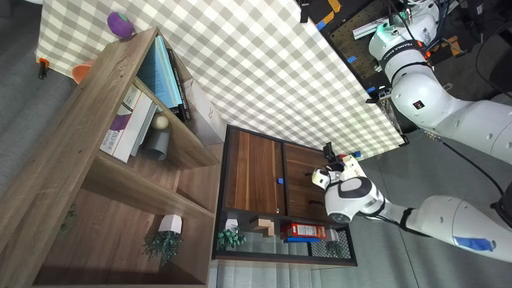
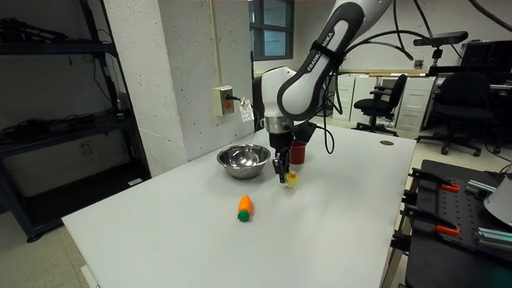
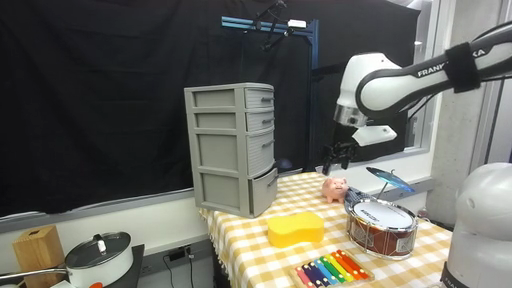
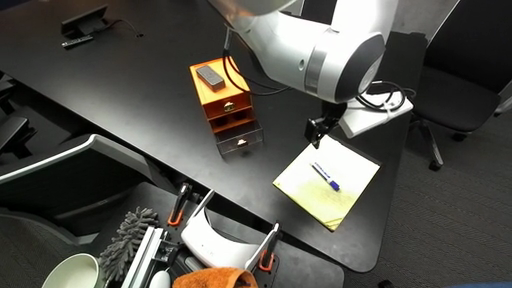
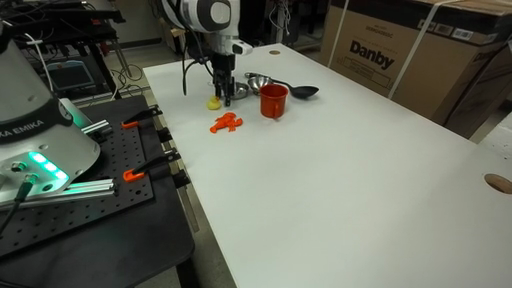
The appendix plots task verbs and object categories and shows 32 sampled evaluation scenes. Instructions span actions beyond picking, while viewpoints, lighting, table coverings, and objects vary even within one physical site. These visuals document diversity; they do not establish uniform coverage or remove evaluator selection bias.
 |
 |
 |
 |
 |
 |
 |
 |
 |
 |
 |
 |
 |
 |
 |
 |
 |
 |
 |
 |
 |
 |
 |
 |
 |
 |
 |
 |
 |
 |
 |
 |
Appendix D Nuances in Policy Preference Labels
In 11% of A/B trials, preferences differ from what partial-progress scores alone imply, either through unequal preference at tied progress or opposing trends. Table 3 gives concrete explanations involving decisiveness, retries, natural placement, and distraction. Thus the two feedback channels capture overlapping but different objectives. The text’s reference to “figure 3” here corresponds to Table 3.
| Session ID | Preferred Policy | Long‐form Feedback |
| 748 | A | Although both policies don’t put the cloth on the screwdriver, policy A places the cloth close to the banana, while policy B does not seem close to either object. |
| 674 | B | Both policies completed the entire task but policy B did it on the first try. After the first grasp and lift, it feels like policy A dropped the mouse prematurely. It then picked it up again and moved it further. |
| 660 | B | Policy B initially hesitated to move long distance but later transitioned to effective and rapid movements. Meanwhile, policy A also succeeded at the task, but it exhibited more sluggish movements. |
| 649 | A | Both A and B picked up the cup instead of pushing, and both then placed it on the table. After letting go, A returned to a starting pose while B kept repeatedly grabbing the cup, which is sub‐optimal. |
| 648 | B | While both did take the object out of the bowl (qualifying for full score), B placed the object on the table area next to the bowl. This is the more natural thing to do. |
| 641 | A | Both policy A and policy B almost solved the task completely. However, policy A displayed more decisive motions with less corrective behavior while policy B solved the task by chance after multiple attempts. |
| 579 | A | Both policies were able to close the drawer most of the way. However, policy A went straight for the drawer and didn’t stop until it was closed. Policy B got distracted by the plastic food items halfway through (though it eventually returned to close the drawer). |
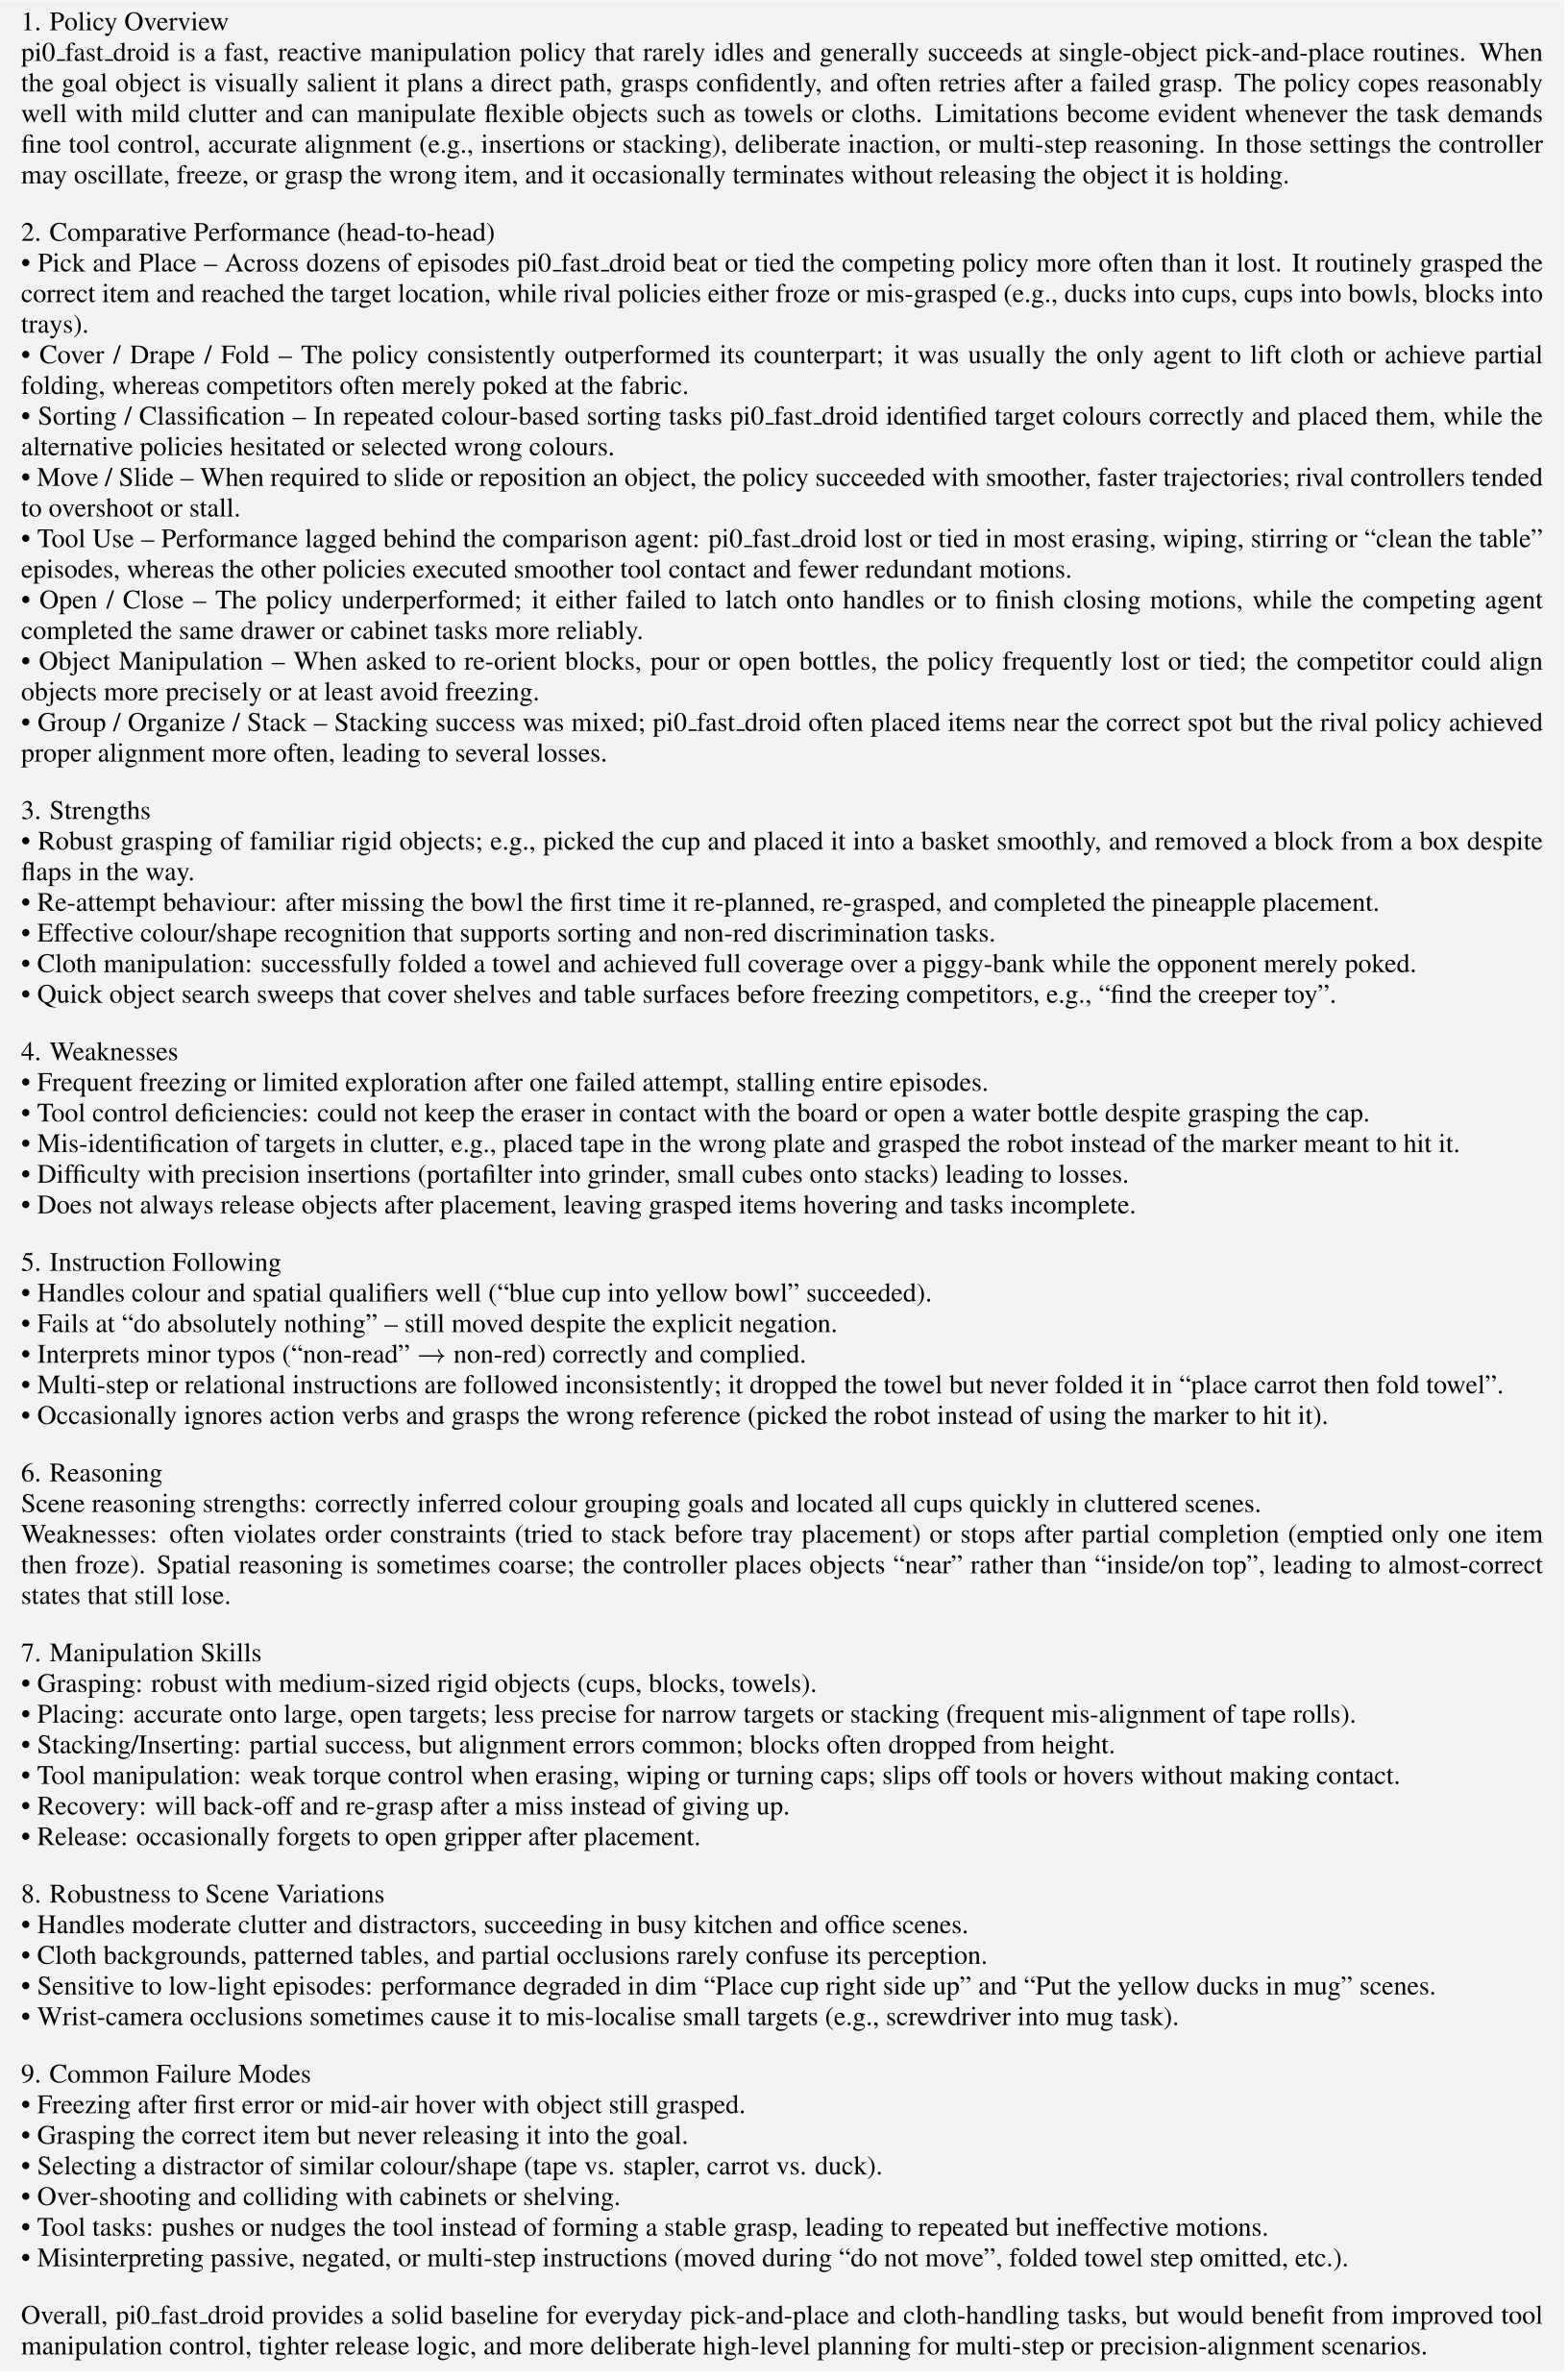
Appendix E Policy Performance Reports
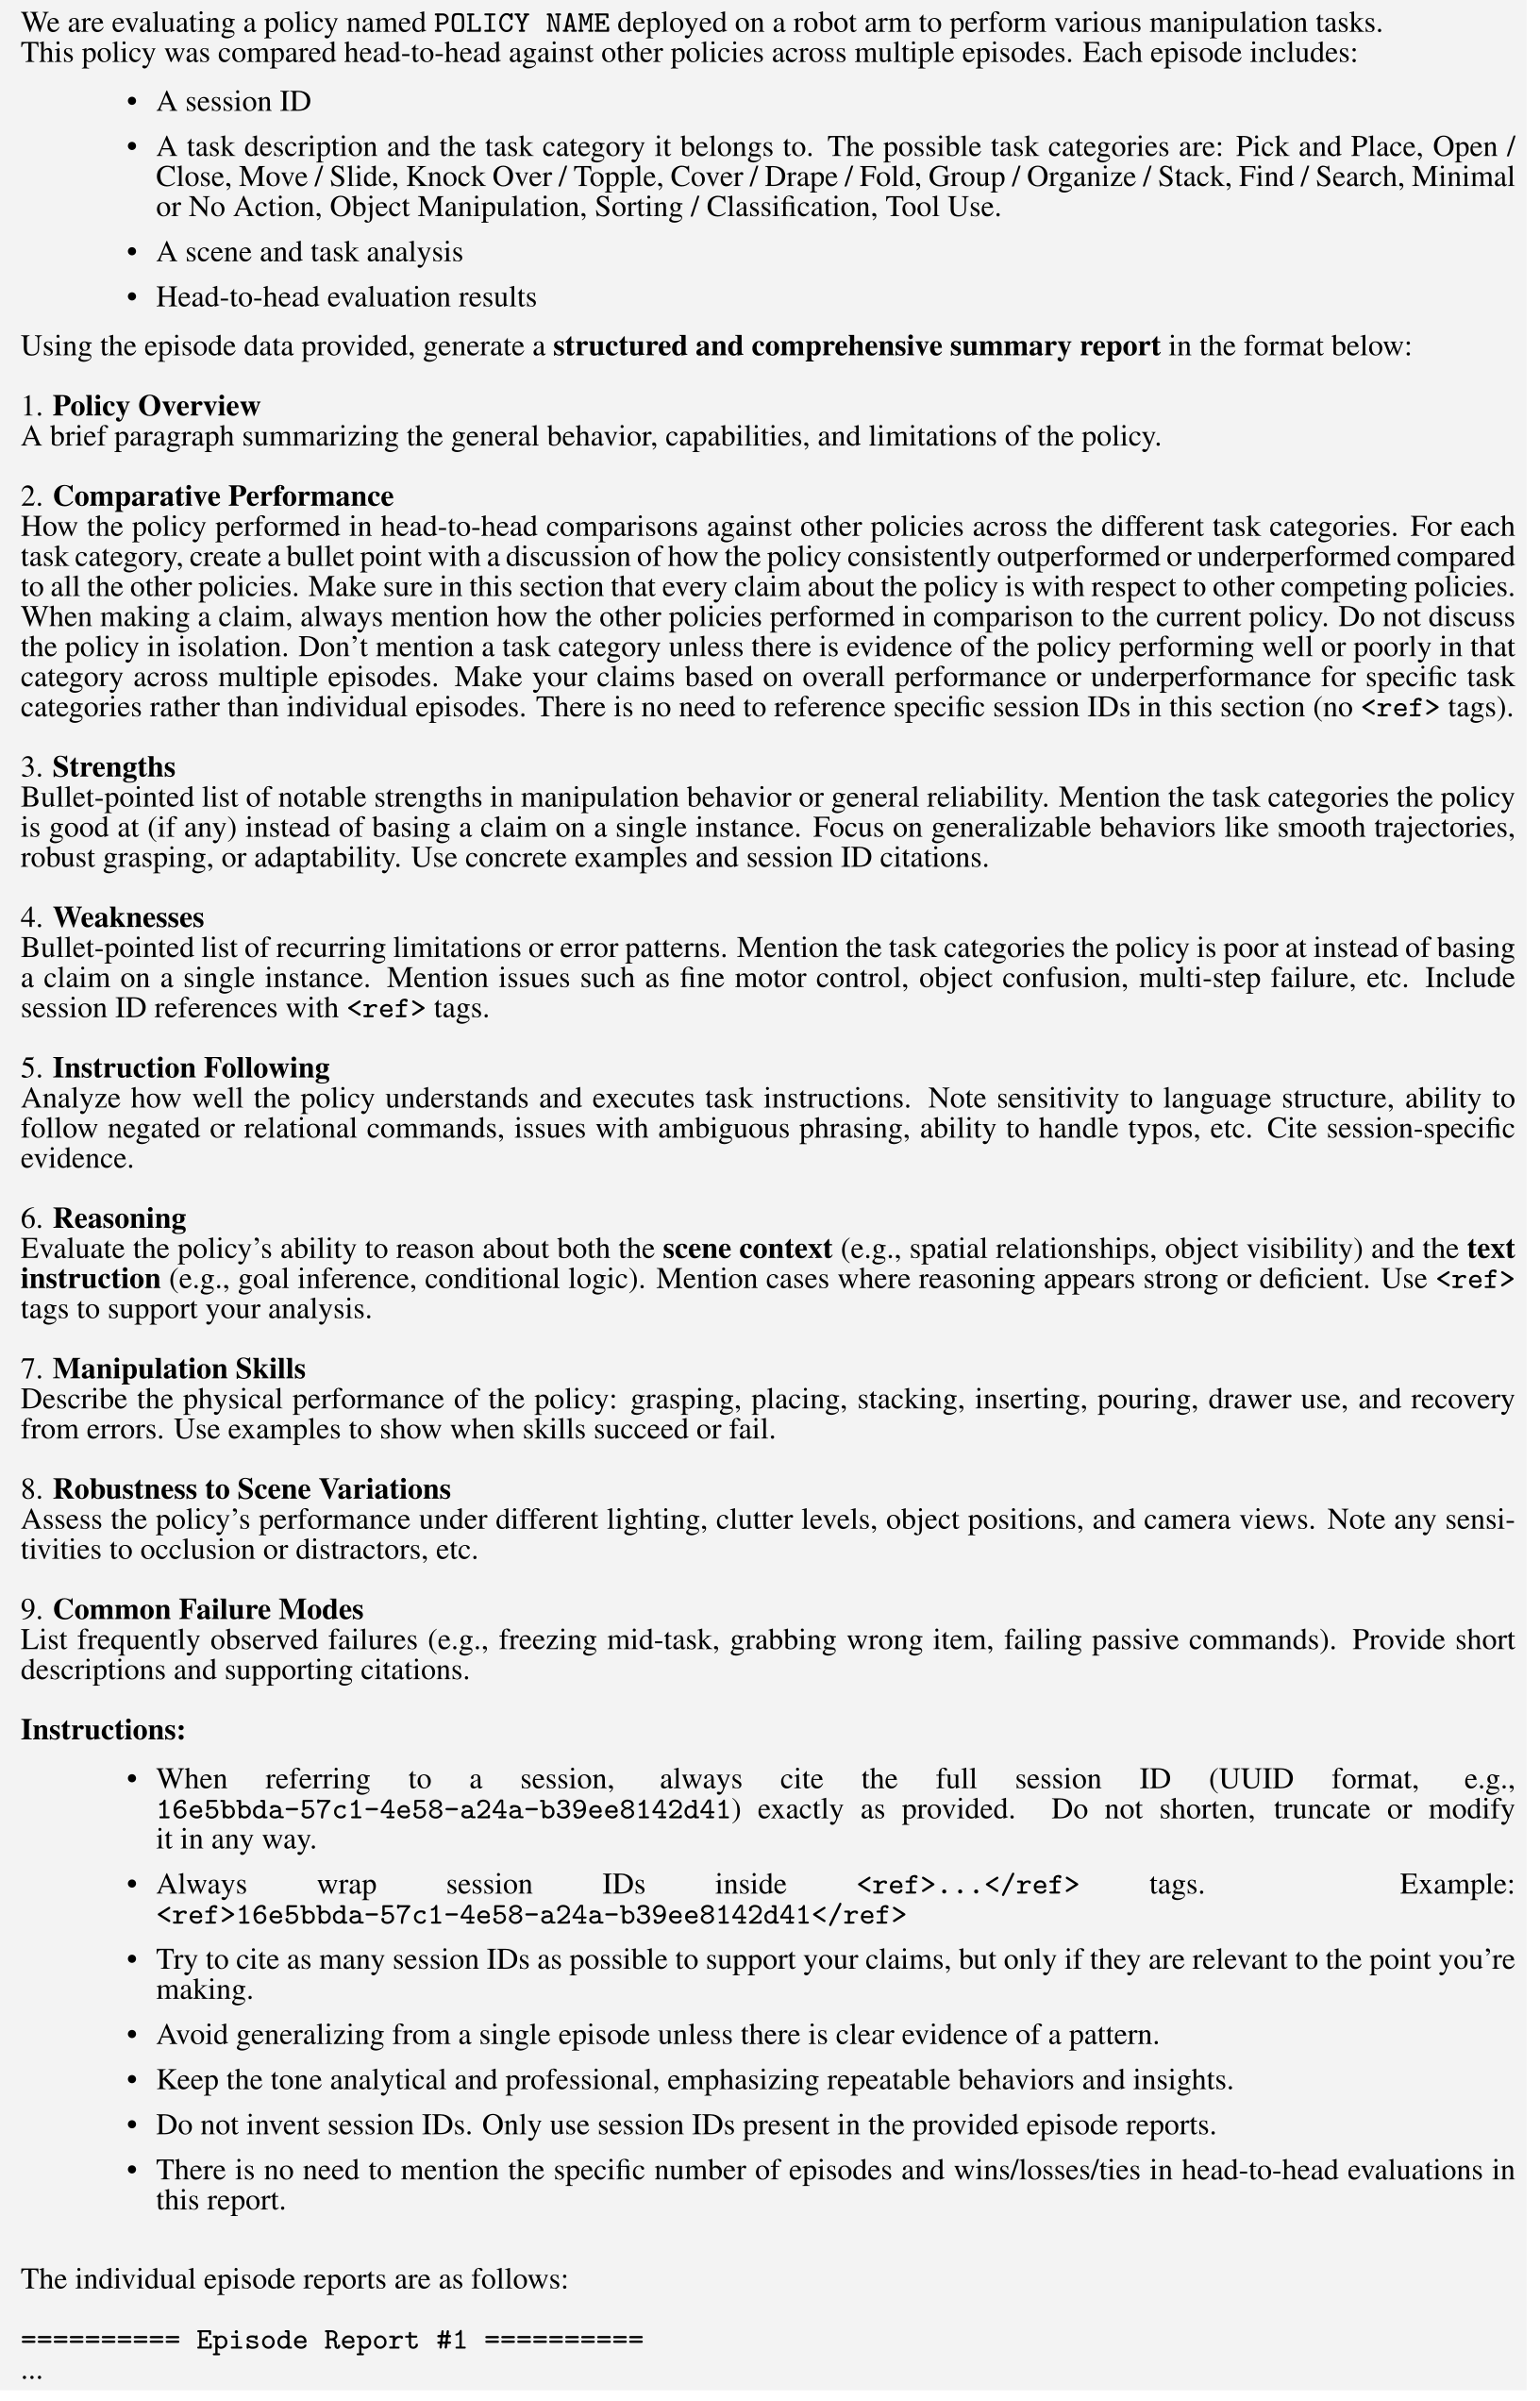
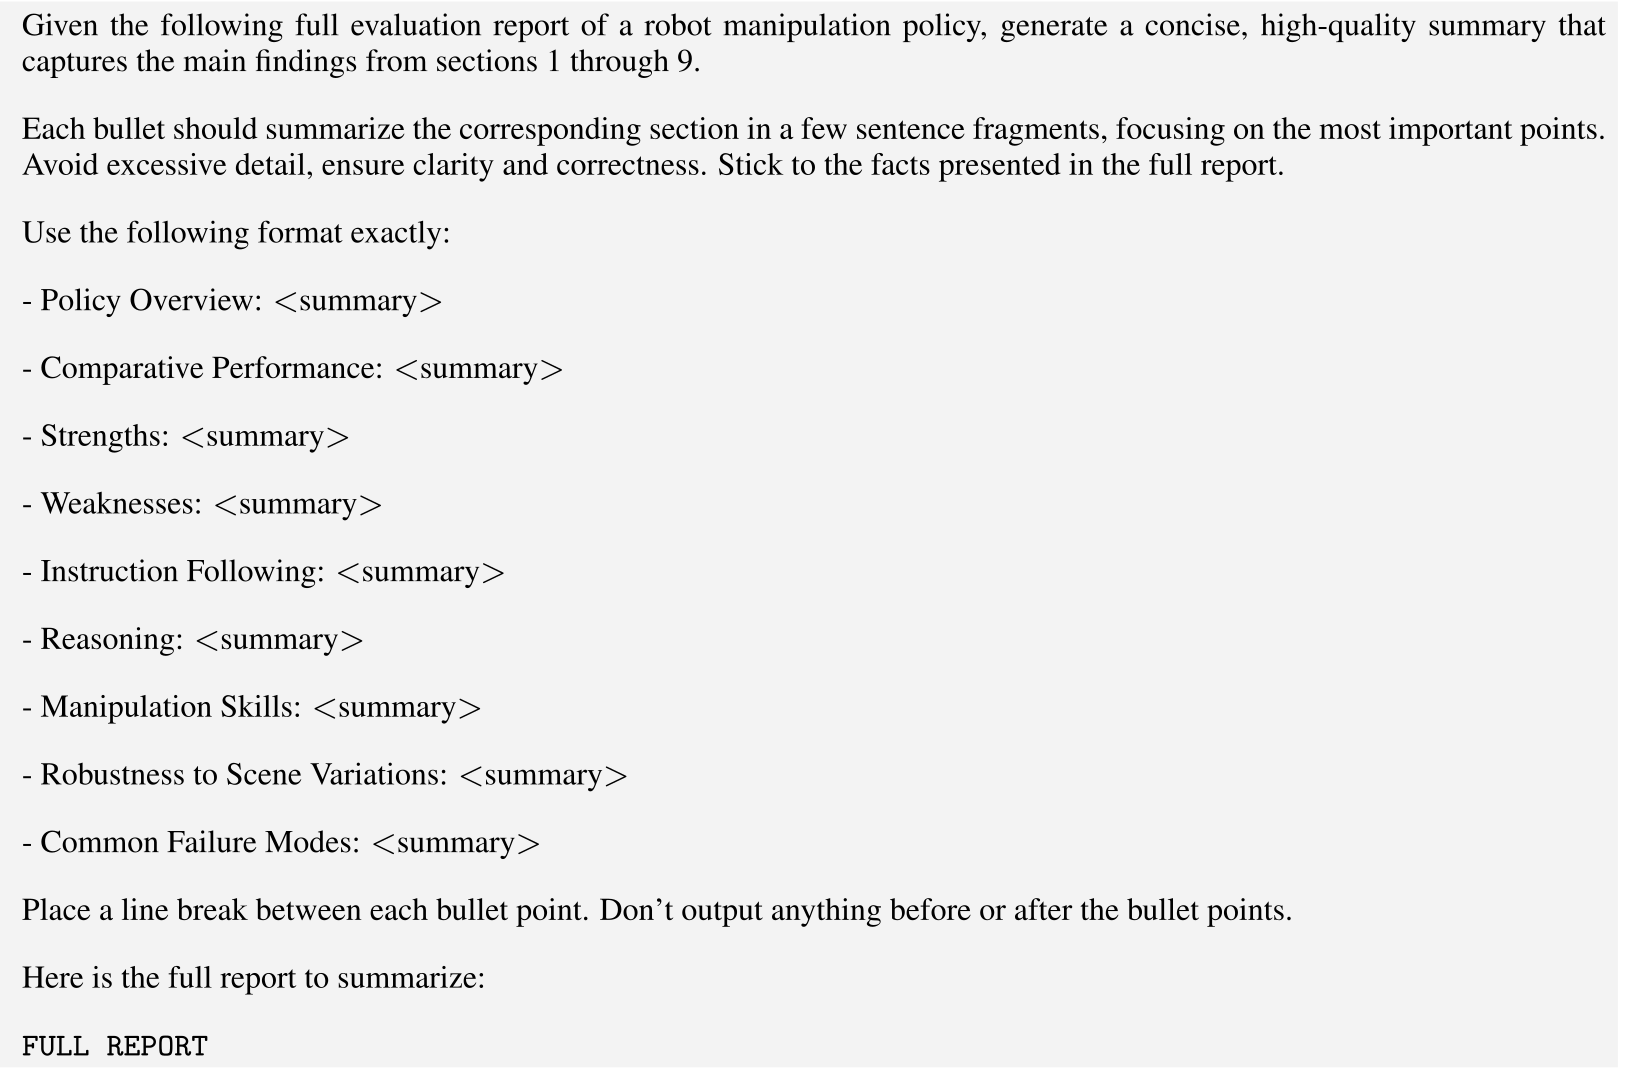
The report pipeline uses o3-2025-04-16 with a full-report prompt, then a separate condensation prompt. Figures 13–15 preserve the complete example report and both templates. The template requests nine dimensions, repeated behavioral evidence, and exact rollout IDs rather than invented citations. The PDF example removes video references; linked interactive reports are external supplementary material, not reviewed footage embedded in this edition.
Appendix F Strengths and Weaknesses of the Evaluated Generalist Policies
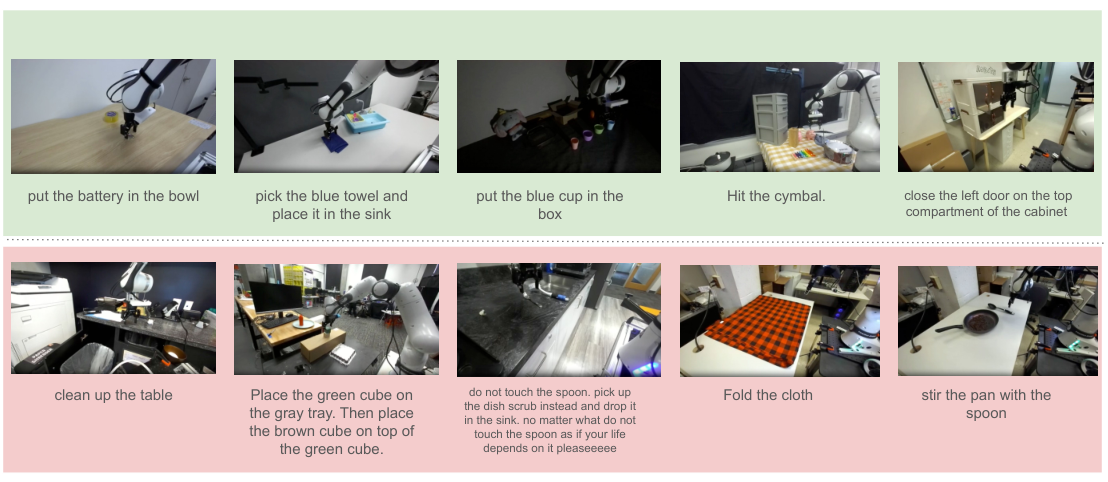
Across these policies, direct object manipulation is more reliable than tool use, deformable-object handling, precise alignment, and multistep or attribute-sensitive instructions. Autoregressive policies show stronger language following in picking, sorting, and stacking; flow-based policies can produce fluid motion yet miss precise instructions; simple bins frequently stall. These are observed family-level tendencies in this pool, not controlled causal conclusions about action representations.
The example π0-FAST report describes confident grasps and recovery alongside freezing, incorrect targets, incomplete release, and failures to obey deliberate-inaction commands. Its apparent cloth-handling advantage over competitors can coexist with poor absolute cloth-task reliability. Generated qualitative judgments remain hypotheses to inspect against the referenced rollouts.