Overview
This edition covers the 25-page revised paper, including its estimator derivations, evaluation protocol, ablations, and compute costs. It preserves every numbered figure and table, both algorithms, all displayed formulas, and the original title mark.

At a glance
DataMIL selects prior robot demonstrations by estimating how they affect a policy’s target-task performance. A datamodel assigns additive influence scores to data clusters, using held-out imitation loss as a differentiable substitute for costly environment rollouts. Policies trained with selected data improve average performance across simulation and physical manipulation experiments. The benefit is task dependent and comes with substantial offline computation.
1 Introduction
Large robot datasets can help specialization, but irrelevant or poor demonstrations can also hurt. Rather than equating usefulness with visual, language, or action similarity, DataMIL learns a model of how training-data inclusion changes a policy’s target objective. The robotics contribution is making that objective practical without online rollouts, reducing attribution noise through clustering, and addressing target-domain shift. The experiments study targeted data curation, not universal quality scores for every future robot task.
2 Related Work
Prior curation methods optimize broad dataset mixtures, score demonstration quality, or retrieve examples similar to a few target demonstrations. DataMIL instead adapts model-based data attribution to the target policy and task. It differs from rollout-based influence selection by evaluating its selection objective offline, although actual policy success is still measured with rollouts in the experiments. Related source: CUPID.
3 Preliminaries: Data Selection for Policies and Datamodels
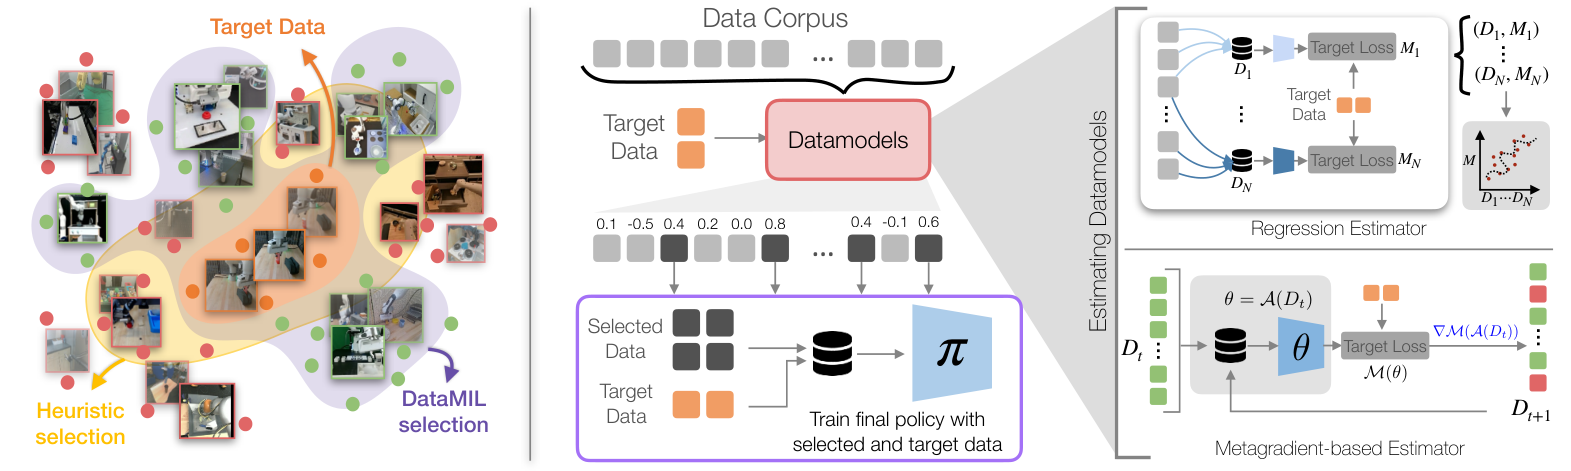
The formal setup fixes the policy-learning procedure and target metric, then asks which subset of prior demonstrations produces the best trained policy. A cheap predictor of this training outcome replaces exhaustive retraining during subset search.
Policy learning.
A learning algorithm maps a demonstration dataset to a stochastic state-to-action policy. A separate metric evaluates the resulting policy, typically through task success. Data quality is therefore relative to the learner, target task, and evaluation criterion.
Data selection in robotics.
The desired subset maximizes the target metric after training. Directly searching all subsets is infeasible because each candidate would require both policy optimization and evaluation.
Equation 1
| (1) |
Datamodels.
A datamodel predicts policy performance from the subset’s membership vector. Linear datamodels assign additive coefficients to individual examples or clusters, making ranking and subset selection inexpensive once those coefficients are known. This is an approximation to training outcomes; the main difficulty is estimating useful coefficients, not solving the final ranking problem. Related source: Ilyas et al.’s datamodels.
Equation 2
| (2) |
4 DataMIL: Datamodels for Robot Imitation Learning
The pipeline estimates a datamodel, adapts its objective and granularity to robotics, selects high-ranked prior data, and trains the downstream policy. Regression and metagradients provide two different accuracy–cost tradeoffs.
4.1 Estimating Datamodels
Regression trains policies on many random subsets and fits additive data coefficients to their observed scores. Metagradients instead differentiate a training-based target objective with respect to continuous data weights, giving a local first-order influence estimate. This avoids thousands of full retrainings for larger policies, but linear attribution remains approximate; the actual implementation differentiates only a final training segment, as specified in Appendix H. Related source: Engstrom et al.’s metagradient descent.
Equations 3–4
| (3) |
| (4) |
4.2 Adapting Datamodels for Robotics
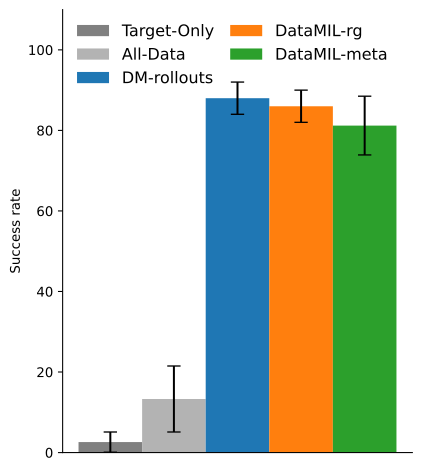
The proxy score is negative behavior-cloning loss on a small held-out target set, so larger scores mean better imitation. A MetaWorld comparison finds some loss of success relative to rollout-based attribution but large gains over using all data or target data alone. Temporal clustering reduces noisy per-example attribution: sub-trajectories suit LIBERO, whole trajectories the larger OXE collection. For physical tasks, half the target demonstrations enter datamodel training and half remain held out for scoring. The empirical usefulness of this proxy does not make imitation loss a guaranteed predictor of closed-loop success.
Equation 5
| (5) |
4.3 Data Selection and Policy Training
Rank clusters by estimated positive influence, retain a chosen fraction, then train using selected prior data and target demonstrations. The usual recipe samples the two sources with probabilities one minus alpha and alpha. MetaWorld is an explicit exception: its final policies use selected prior data alone because target co-training gave negligible improvement.
5 Experiments
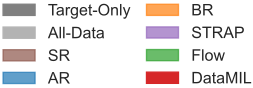
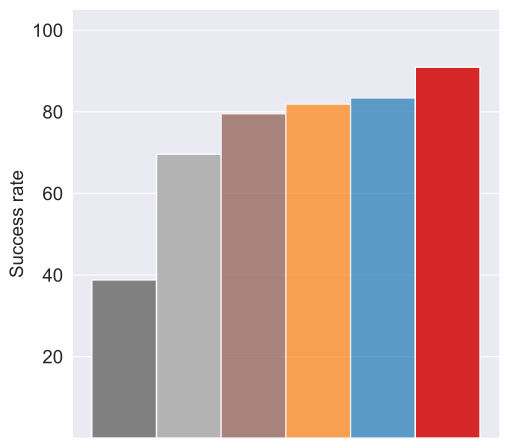
Evaluation spans 50 MetaWorld tasks, ten LIBERO target tasks, and four physical settings using OXE subsets. MetaWorld uses state-based Gaussian policies; LIBERO and OXE fine-tune pretrained Octo. Comparisons include state/action retrieval, behavior retrieval, flow retrieval, visual sub-trajectory retrieval, target-only training, and either all-data or budget-matched random selection. Related source: Octo.
5.1 Results
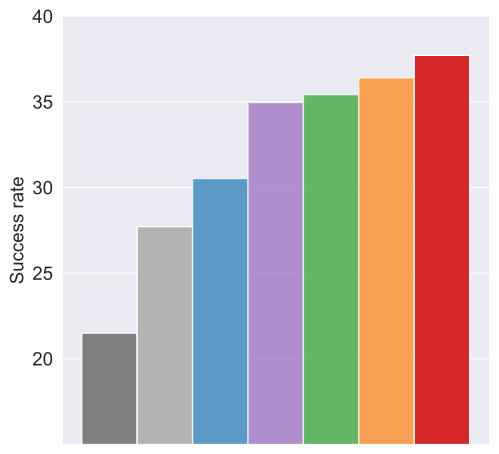
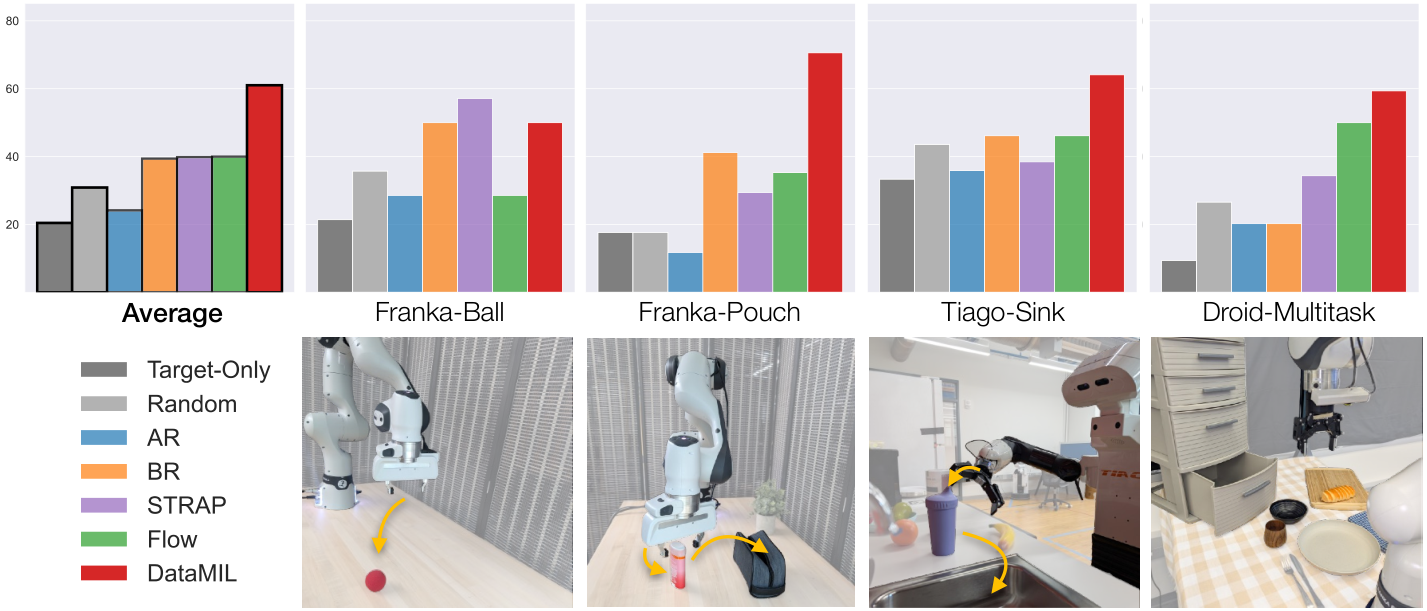
MetaWorld mixes expert demonstrations with lower-quality exploration data and provides five target demonstrations per task. LIBERO selects 10% of 4,500 prior demonstrations using metagradients; its mean success is 37.76%, versus 36.4% for behavior retrieval, with substantial task variation. Physical experiments cover ball placement, pouch opening, Tiago sink manipulation, and a three-task Droid setting. DataMIL has the highest reported mean across these settings, including transfer to Tiago despite its absence from the prior data. It does not win every task: STRAP is better on Franka-Ball, and several LIBERO tasks favor other methods.
5.2 What data is selected by DataMIL?
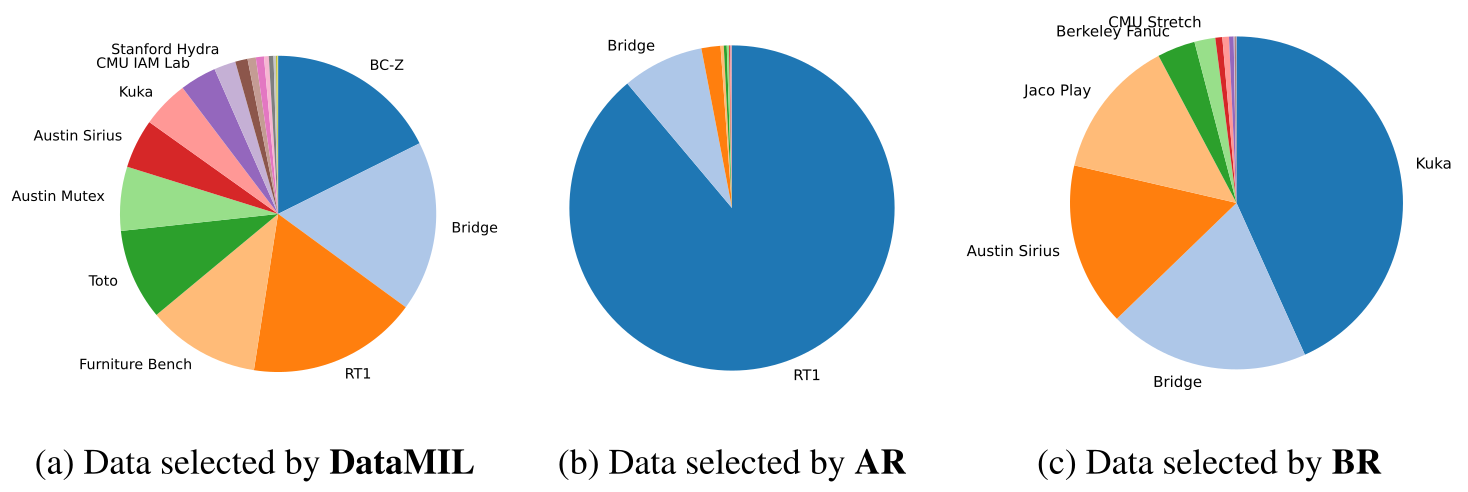
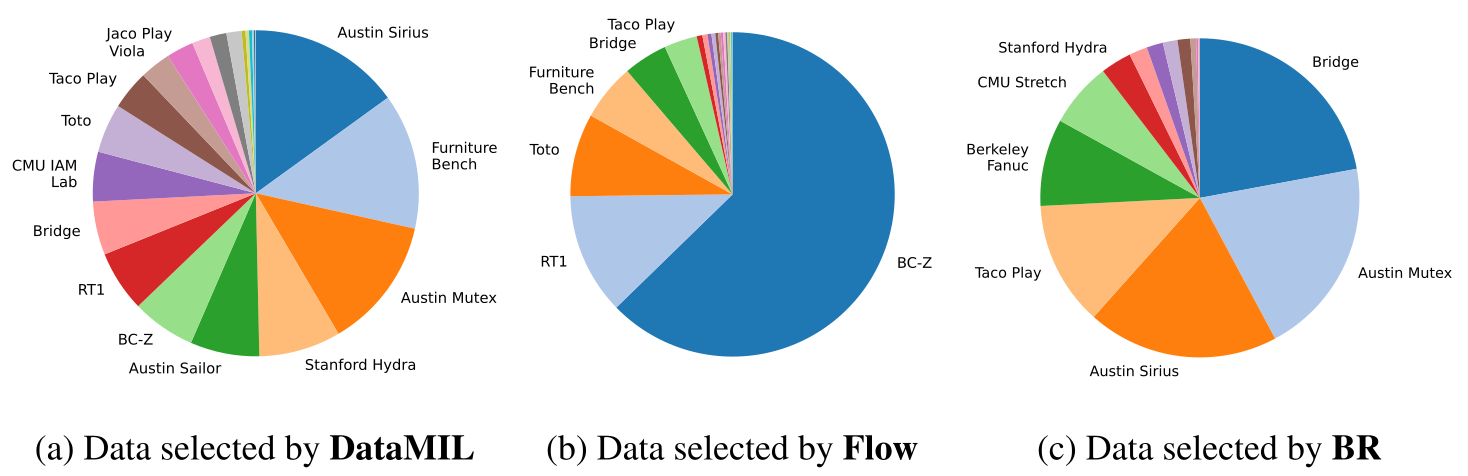
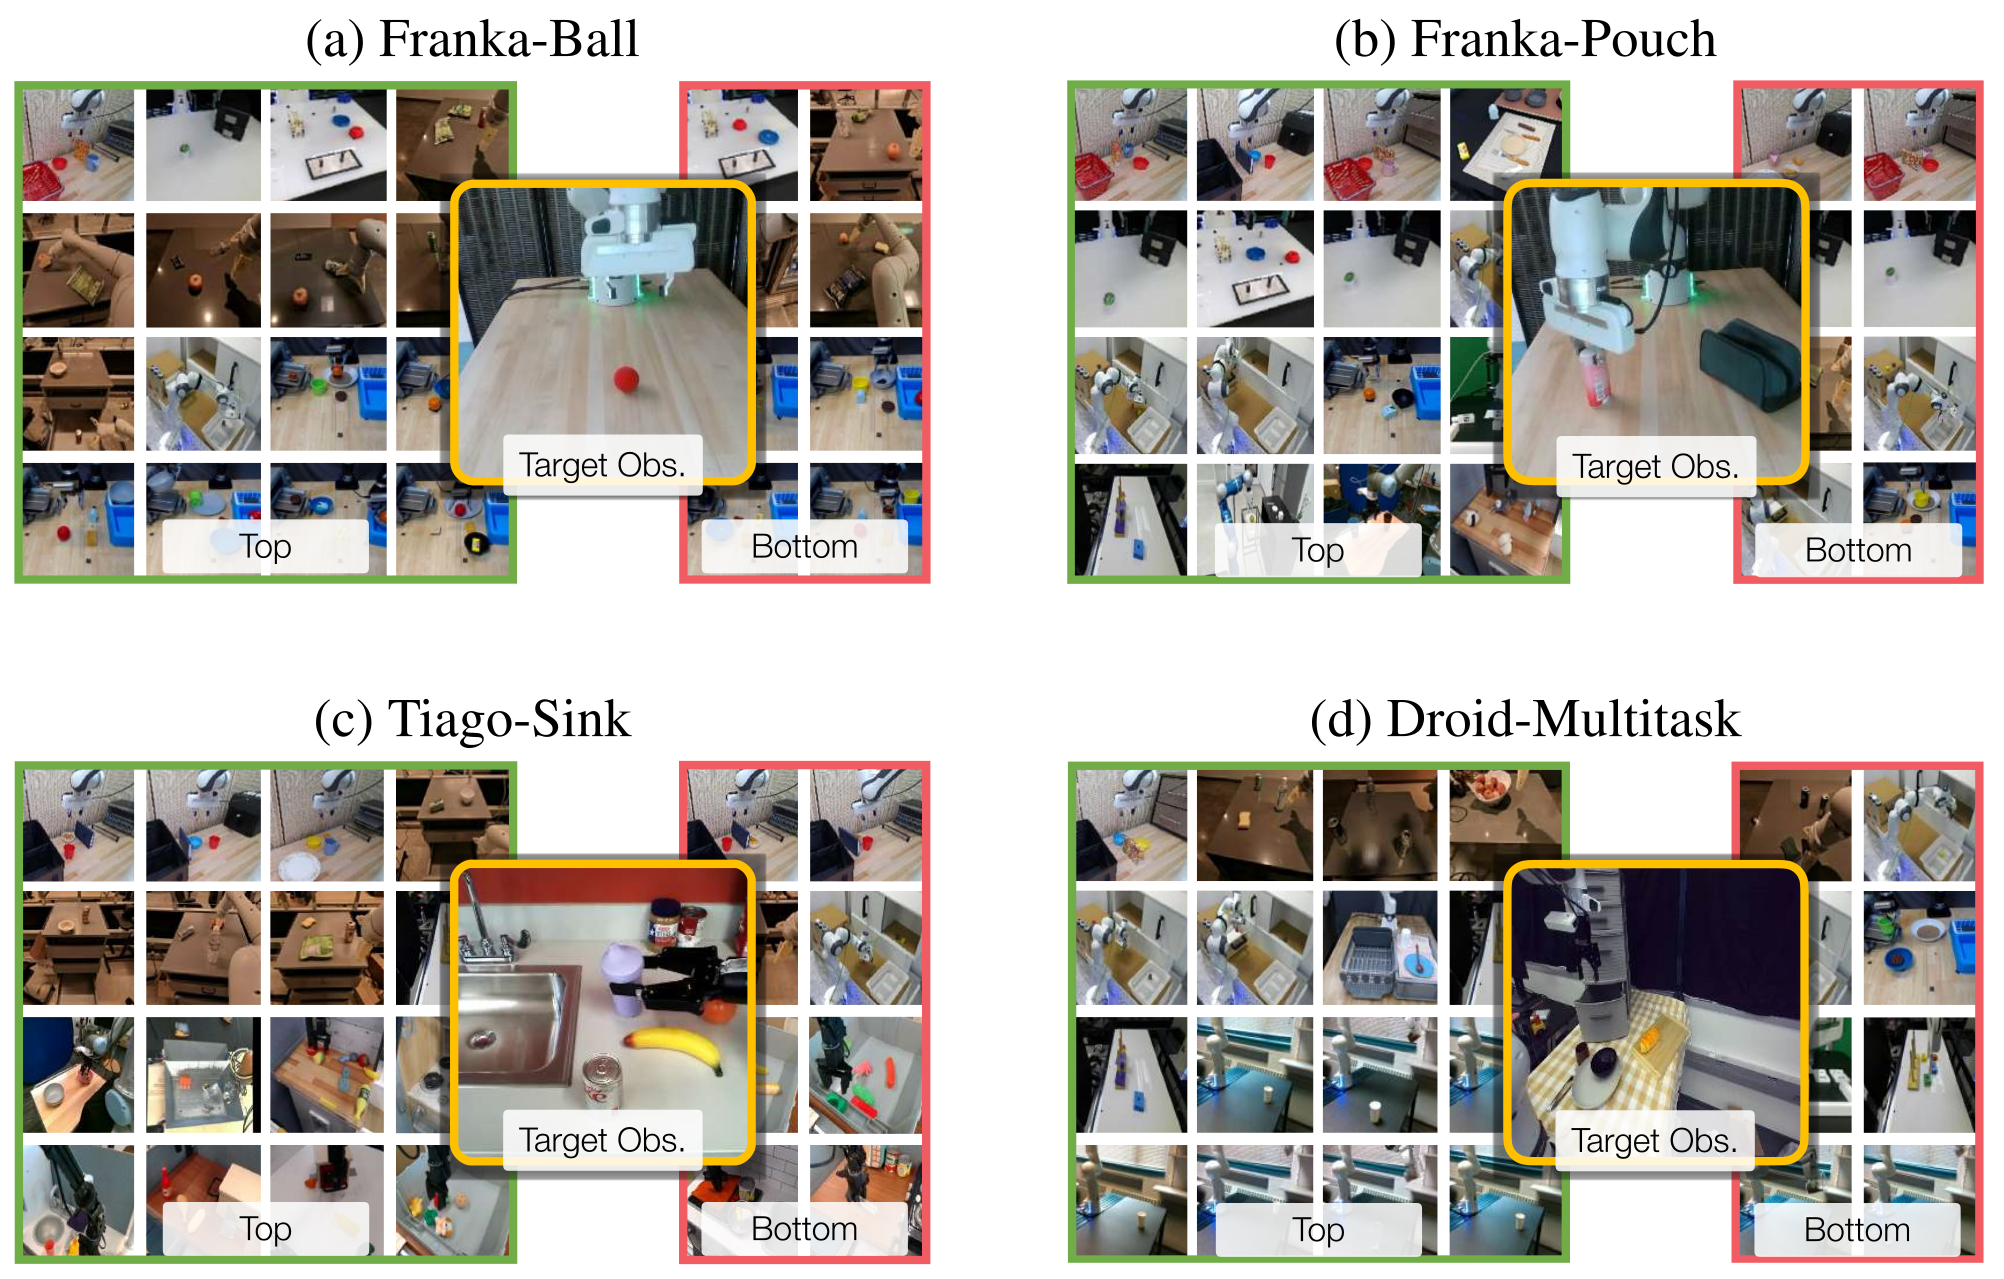
Selected-data distributions often span several source datasets rather than concentrating on one visually similar domain. For Tiago, useful data can come from different robots with related tabletop interaction structure; for the pouch task, frequently selected sources use Franka. High- and low-ranked images may look alike because their actions differ. These visual analyses suggest mechanisms but do not isolate causally why each example helps or harms.
6 Conclusion
The results support task-aware curation, with limits in computation, hyperparameter choice, and evaluation breadth. Metagradient estimation still costs several times ordinary policy training; selection fraction and cluster granularity need empirical tuning. Most targets are single tasks, with only a small multitask physical test, so generalist-scale curation remains unproven.
Acknowledgments
The authors acknowledge help with real-robot evaluations, manuscript feedback, and MetaWorld data generation. Funding includes DARPA’s TIAMAT program, the National Science Foundation, and Open Philanthropy.
Appendix A Qualitative Results: What data is selected by DataMIL?
The qualitative appendix examines which prior domains, tasks, and examples each method selects. It helps interpret the quantitative results without turning visual resemblance into a universal criterion of usefulness.
A.1 MetaWorld
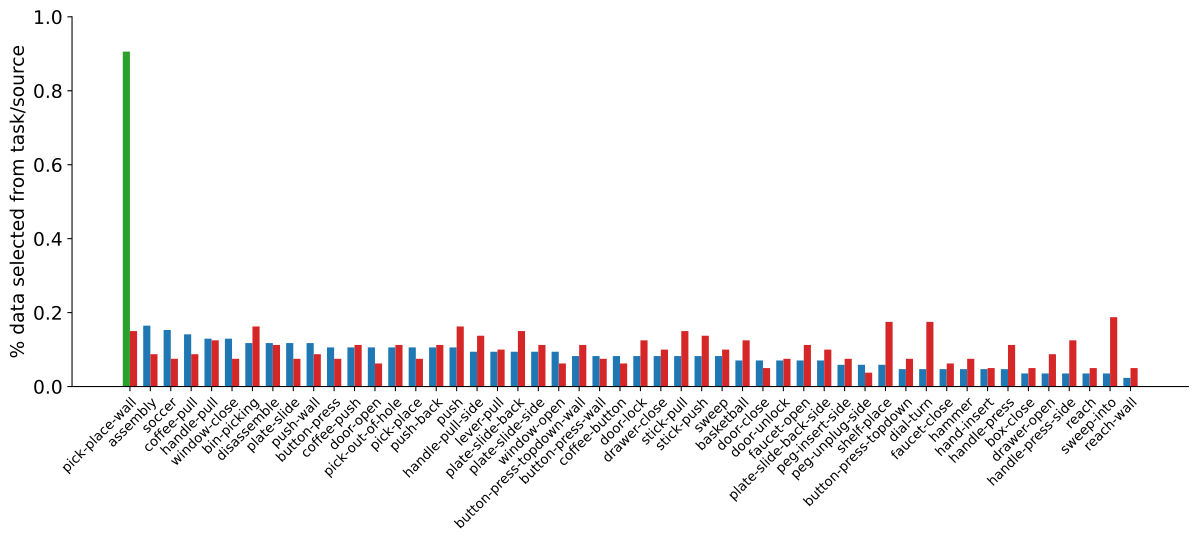
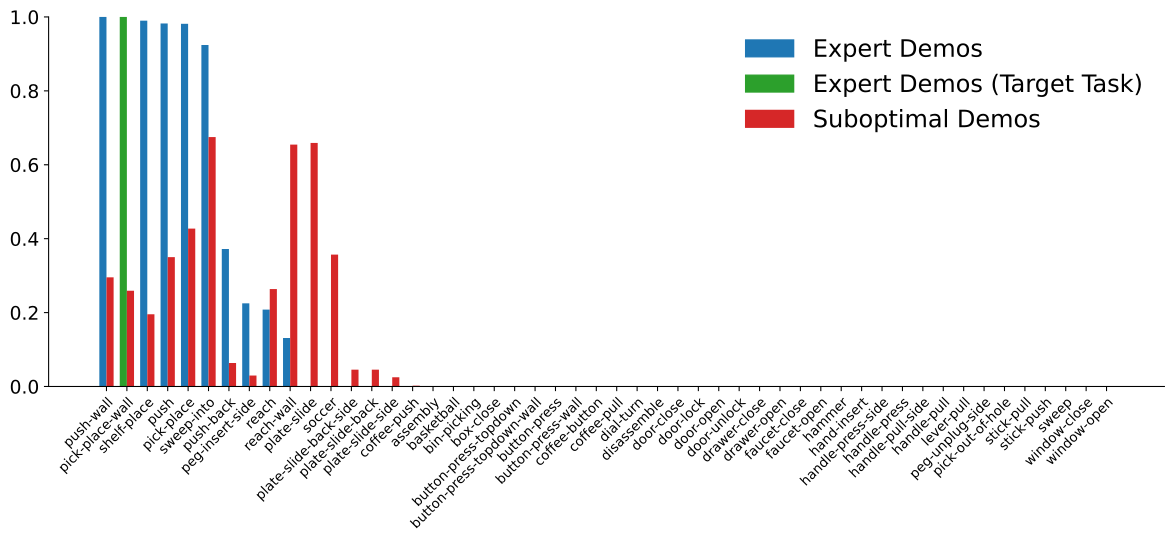
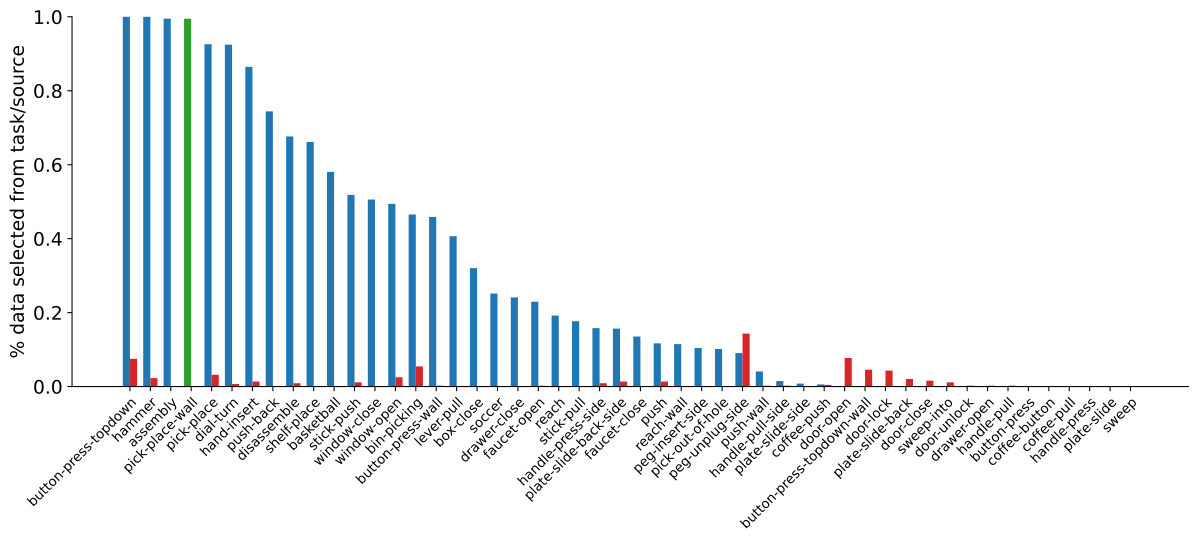
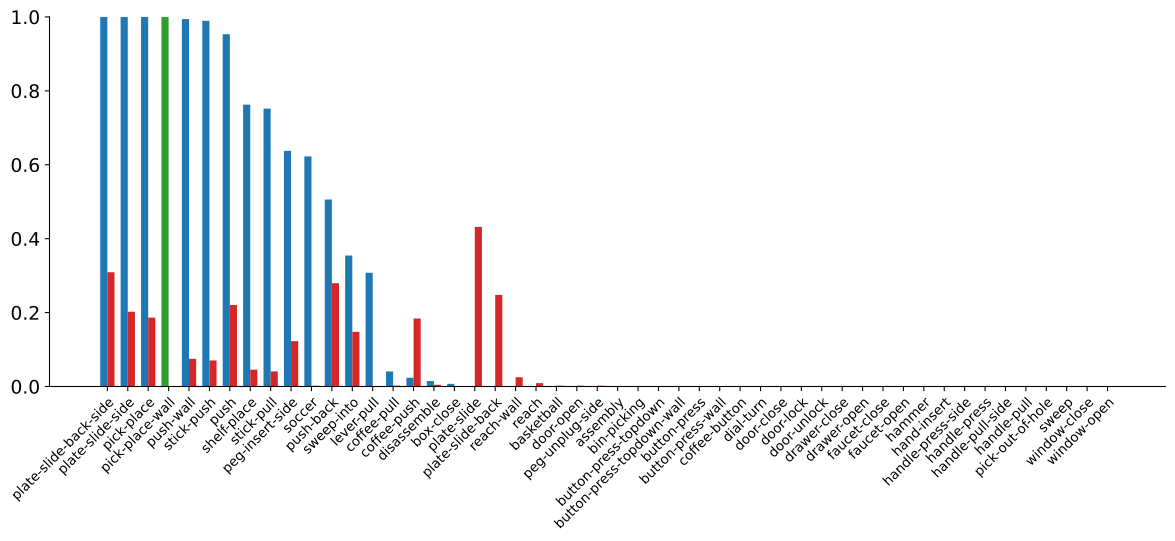
For pick-place-wall, state retrieval identifies related tasks but admits poor actions, while action retrieval suppresses some noisy data but loses task identity. Combined state/action retrieval inherits both tendencies. DataMIL favors the relevant task’s expert data while avoiding much of the suboptimal pool in this example.
A.2 LIBERO
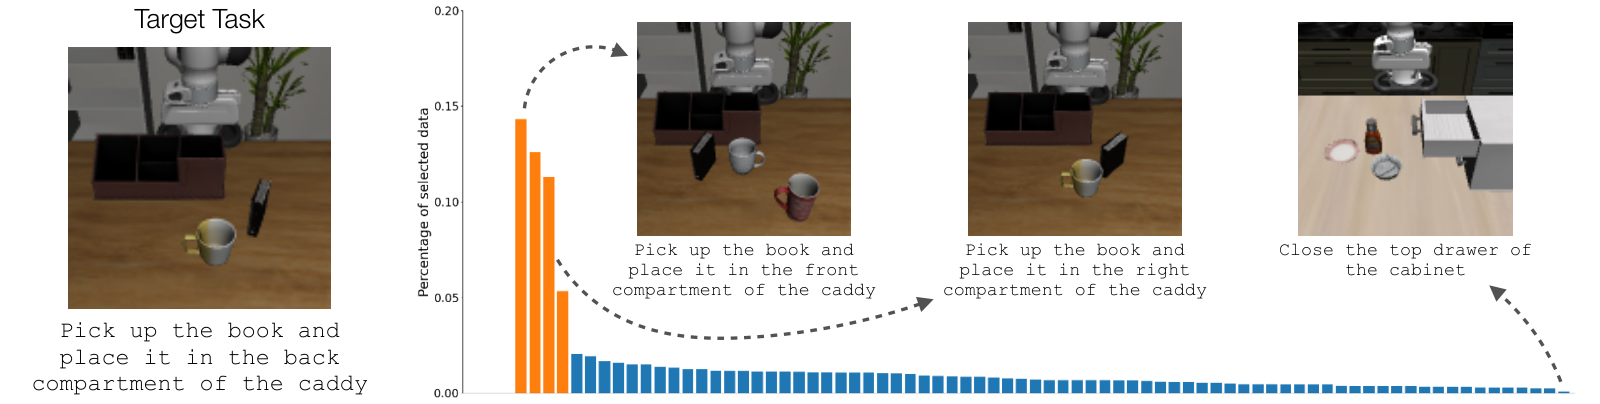
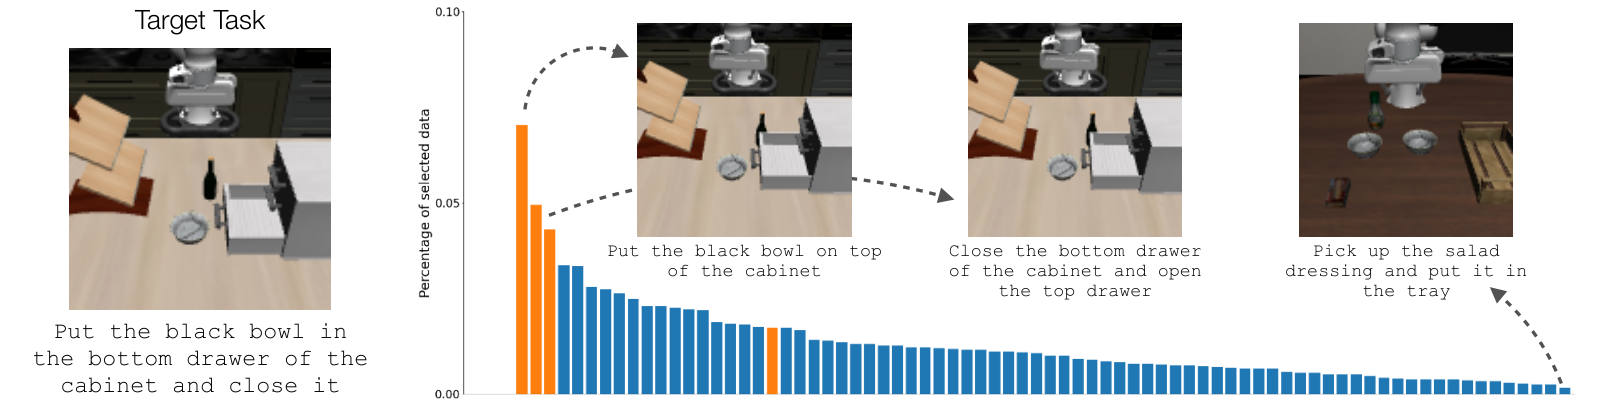
For book-caddy and bowl-cabinet, the prior collection lacks the exact target task. The authors manually identify related tasks and show that DataMIL often favors compatible object arrangements and scenes. These examples demonstrate related-task retrieval rather than exact target-demonstration recovery.
A.3 OXE
Highest- and lowest-ranked physical examples often have similar appearance. Their different action labels offer a plausible explanation for different influence scores, but the paper leaves a detailed account of these fine distinctions to future work.
Appendix B Estimating Datamodels
The appendix formalizes subset prediction and presents the regression and metagradient estimators with their original pseudocode. These definitions separate the datamodel approximation from the policy-training procedure it predicts.
B.1 Formalizing Datamodeling
Binary vectors encode dataset inclusion, and the formal objective minimizes prediction error over randomly sampled subsets. An additive model is a dot product between the inclusion vector and learned coefficients. The formal half-inclusion distribution differs from the smaller inclusion probability used in the reported MetaWorld regression experiment.
Equations 6–7
| (6) |
| (7) |
B.2 Regression Estimator
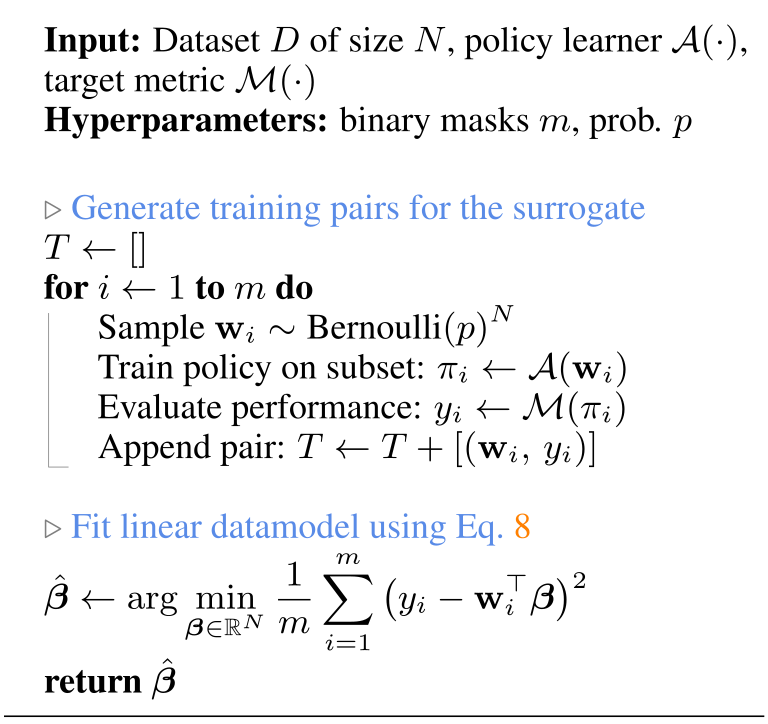
Sample membership masks, train a policy on each selected subset, evaluate the target score, then regress those scores on the masks. This estimates joint data-attribution coefficients rather than scoring each demonstration in isolation. Accuracy improves with enough trained subsets, at the cost of repeating policy training many times.
Equation 8
| (8) |
B.3 Metagradient-based Estimator
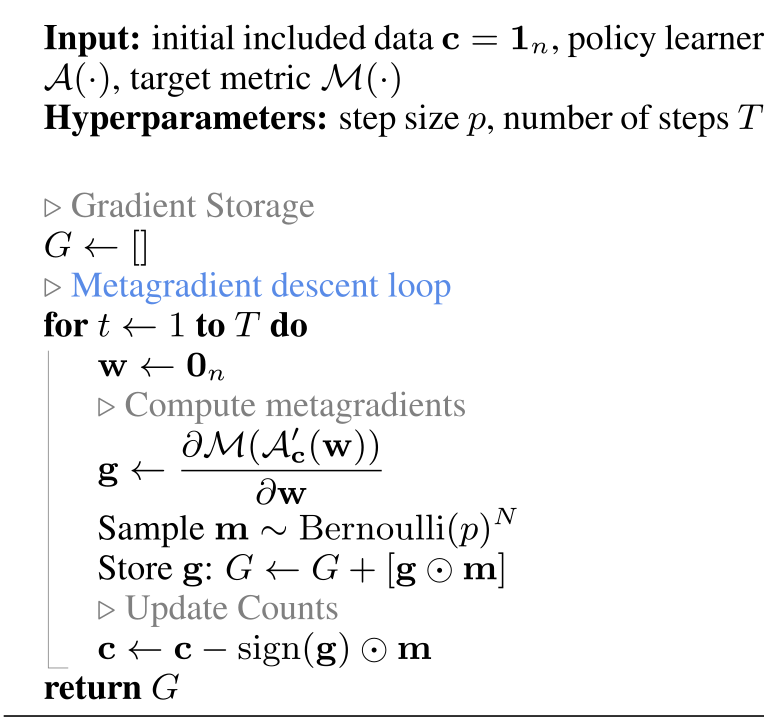
Continuous sample weights allow differentiation of a downstream metric through policy optimization. Metagradient descent repeatedly perturbs training weights, computes influence gradients, masks coordinate updates, and averages gradient information across iterations. Differentiability of both the learner and evaluation objective is required. The printed count update uses a descent sign while the main objective is a maximized score, and does not specify count projection or clipping; these source conventions are retained and need checking before implementation. Appendix H also limits differentiation to the final 100 training steps.
Equations 9–12
| (9) |
| (10) |
| (11) |
| (12) |
Appendix C Comparisons and Additional Results
Additional experiments isolate the proxy objective, goal information, selected fraction, clustering, co-training mixture, and training duration. Numerical per-task results expose where average gains conceal weak or losing tasks.
C.1 Comparison: True Rollout success vs. Proxy Metric
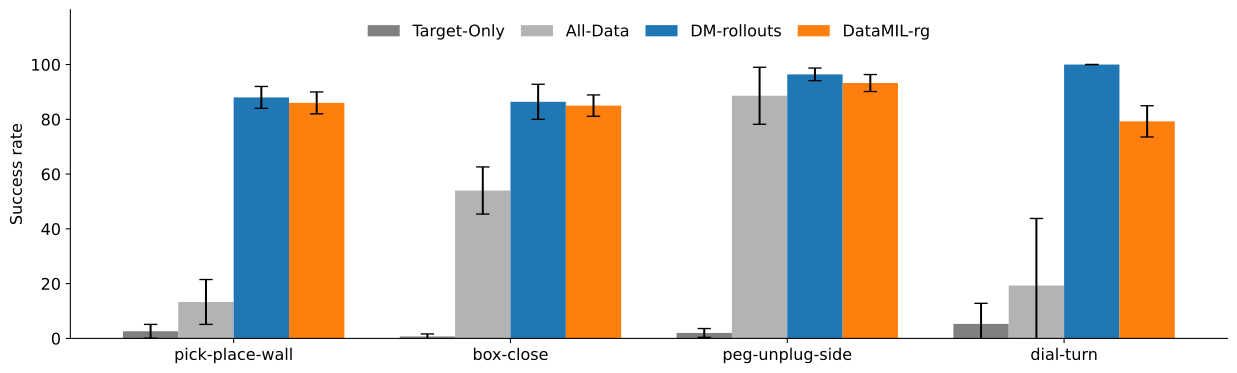
Four MetaWorld tasks compare regression attribution from real rollout success with attribution from held-out imitation loss. The proxy loses some success but remains much better than the uncurated alternatives. The gap is visibly larger for dial-turn than for the other examples, so the proxy is useful rather than equivalent to rollout evaluation.
C.2 MetaWorld No-Goal Conditioning Experiments
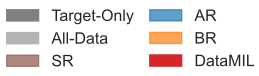
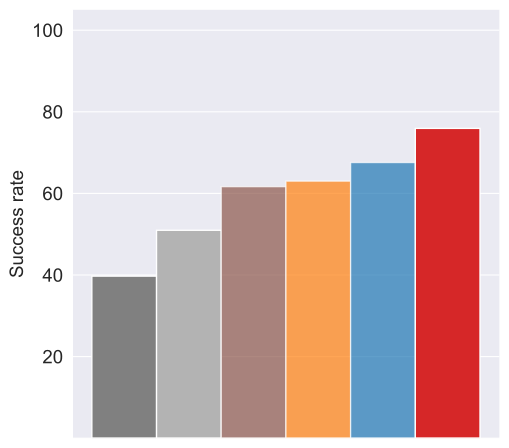
Masking simulator goal information reduces overall MetaWorld performance, while DataMIL retains the best mean among the compared selectors. Because the prior data already includes expert examples of the target tasks, this test asks whether retrieval can identify them without explicit goals; it is not generalization to wholly unseen tasks.
C.3 Comparison: Percentage of Data Selected
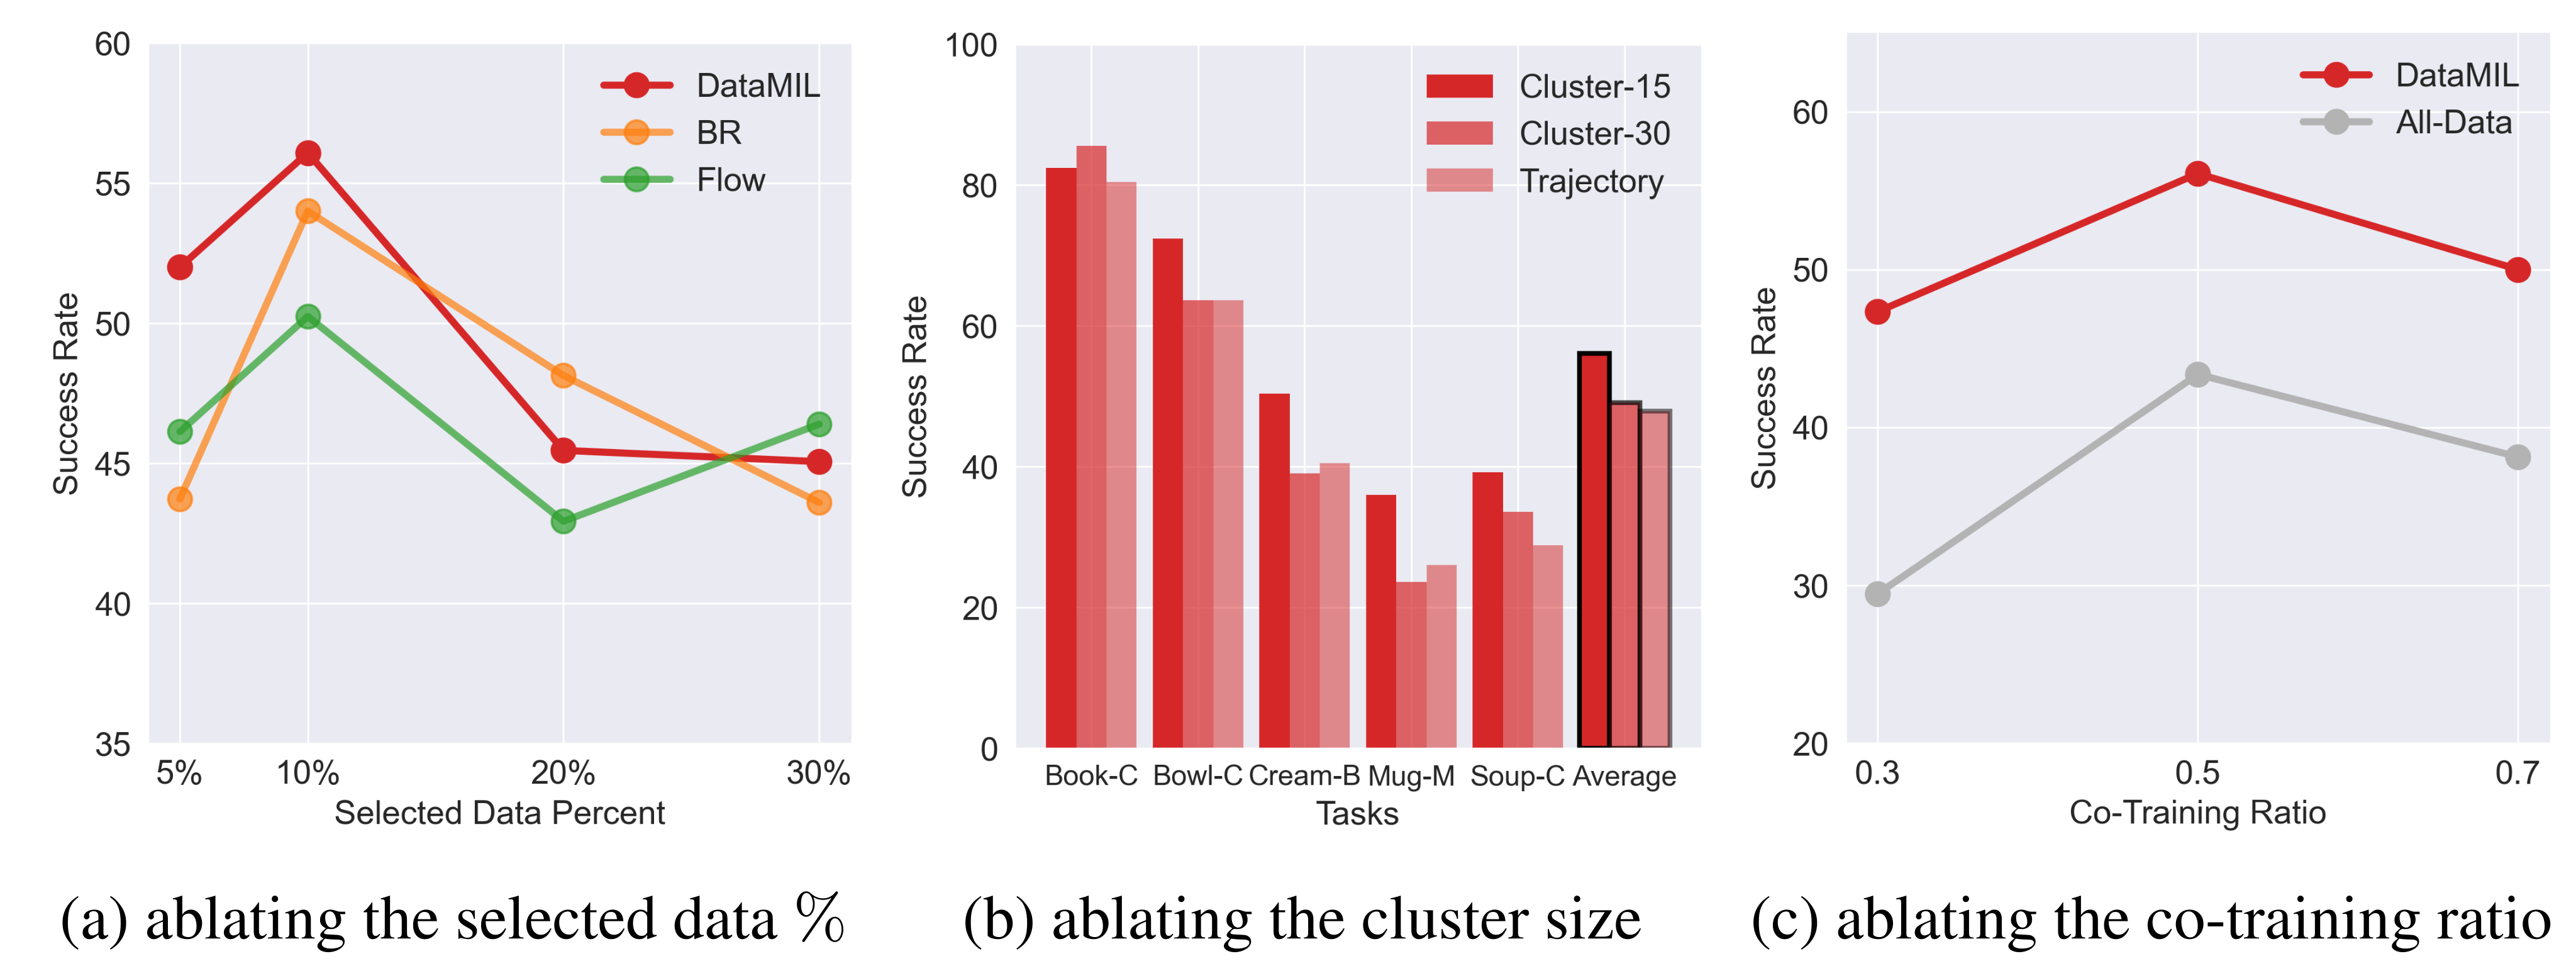
On a five-task LIBERO subset, selection is most useful at small budgets. DataMIL leads the baselines at 5% and 10%, while the gap narrows or reverses at 20–30%. The chosen 10% fraction is empirical, and larger selected datasets are not uniformly better.
C.4 Comparison: Cluster Size
Fifteen-step sub-trajectories outperform thirty-step or full-trajectory grouping on the LIBERO-5 average. Finer clusters offer more selective control in this dataset; that result does not contradict using full trajectories for much larger OXE, where per-sample exposure is lower and attribution noisier.
C.5 Comparison: Co-Training Ratio
A balanced target/prior mixture, alpha equal to 0.5, gives the best LIBERO-5 results among the tested ratios. The same choice is transferred to hardware to avoid another expensive physical sweep; its optimality there is not separately established.
C.6 Comparison: Longer Training for All-Data Baseline
Doubling all-data training barely changes success, and quadrupling it reduces success in the reported five-task experiment. Final comparisons therefore hold training-step counts equal. This checks one potential explanation for the selection gain without proving that every alternative all-data training recipe would fail.
C.7 Numerical Results and Discussion
Table 1 reports full per-task outcomes. DataMIL’s highest mean does not imply task-wise dominance, and its mug-mug and mug-pudding results remain low. Comparisons with published STRAP numbers are affected by this study’s final-checkpoint-only evaluation and its use of Octo rather than STRAP’s original policy architecture. In the OXE rows, the all-data column represents the budget-matched random baseline described in the main text.
| Tasks | Target-Only | All-Data | AR | BR | Flow | STRAP | DataMIL (ours) |
| LIBERO Evaluations | |||||||
| Soup-Sauce | |||||||
| Cream-Butter | |||||||
| Stove-Moka | |||||||
| Bowl-Cabinet | |||||||
| Mug-Mug | |||||||
| Book-Caddy | |||||||
| Mug-Pudding | |||||||
| Soup-Cheese | |||||||
| Moka-Moka | |||||||
| Mug-Microwave | |||||||
| Libero-Average | 37.76 | ||||||
| OXE Evaluations | |||||||
| Franka-Ball | |||||||
| Franka-Pouch | |||||||
| Tiago-Sink | |||||||
| Droid (Drawer) | |||||||
| Droid (Bread) | |||||||
| Droid (Napkin) | |||||||
| Droid-Multitask | |||||||
| Real-Average | 61.0 | ||||||
Appendix D Proxy Metric Details
The proxy is the negative loss appropriate to the policy: action absolute error or Gaussian negative log-likelihood for MetaWorld, and diffusion denoising loss for Octo. Absolute error worked better with regression in the reported tests, while negative log-likelihood suited metagradients. These are offline supervised objectives evaluated on target demonstrations, not direct task-success measurements.
Equations 13–15
| (13) |
| (14) |
| (15) |
D.1 Up-weighting Relevant States
State-dependent weights allow task knowledge to modify the proxy. LIBERO doubles the weight of states immediately before grasping; other states keep unit weight. Thus the method can incorporate an explicit heuristic into its learned selection objective rather than being entirely free of manually chosen relevance assumptions.
Equation
Appendix E Baseline Implementation
Baselines use the authors’ retrieval implementations where possible, adapted to a common policy and selection budget. STRAP retrieves enough segments to cover 10% of LIBERO rather than its original fixed 100-segment recommendation; this improves its mean from 24.72% to 34.96% here. OXE input formatting is adapted without changing retrieval logic. MetaWorld baselines compare fifty-step temporal windows, which helped reject noisy examples. Related source: STRAP.
Appendix F Training and Evaluation Details
Training and evaluation differ across state-based simulation, visual simulation, and hardware. The following settings define what each reported average and success score actually measures.
F.1 MetaWorld
MetaWorld combines 350,000 expert transitions with one million subsampled exploration transitions from a multitask SAC agent. Five expert target demonstrations guide trajectory-level regression attribution; the top 10% of prior trajectories train the final Gaussian policy without target co-training. Results average three random seeds.
F.2 LIBERO
LIBERO-90 supplies 4,500 demonstrations; each of ten target tasks supplies five demonstrations. Influence is estimated for fifteen-step segments with the pre-grasp-weighted proxy. Octo-small is then fine-tuned for 10,000 steps with an equal target/selected mixture, evaluated on fifty rollouts per task, and averaged over five seeds.
F.3 OXE
OXE selection uses whole trajectories and task-specific subsets of 13, 23, or 24 source datasets. Target data is split for attribution, then reused in final equal-mixture Octo fine-tuning for 50,000 steps. Selection retains 0.5–1% of prior data. Physical evaluation fixes object configurations across methods and uses one seed, with 14 ball, 17 pouch, 39 sink, and 32 combined Droid trials. Droid grants half credit to partial completions, so its reported score is not strictly a full-task success fraction. Table 3 calls the ball task Franka-Pick. Related source: TeleMoMa.
| Dataset | OXE13 | OXE23 | OXE24 | Dataset | OXE13 | OXE23 | OXE24 |
| RT1 | ✓ | ✓ | ✓ | CMU IAM Lab | ✓ | ✓ | ✓ |
| Viola | ✓ | ✓ | ✓ | Roboturk | ✗ | ✓ | ✓ |
| Austin Buds | ✓ | ✓ | ✓ | BC-Z | ✗ | ✓ | ✓ |
| Austin Mutex | ✓ | ✓ | ✓ | CMU Stretch | ✗ | ✓ | ✓ |
| Austin Sailor | ✓ | ✓ | ✓ | DLR Edan | ✗ | ✓ | ✓ |
| Austin Sirius | ✓ | ✓ | ✓ | Berkeley Autolab UR5 | ✗ | ✓ | ✓ |
| Taco Play | ✓ | ✓ | ✓ | Berkeley Fanuc | ✗ | ✓ | ✓ |
| Jaco Play | ✓ | ✓ | ✓ | Berkeley Cable | ✗ | ✓ | ✓ |
| Stanford Hydra | ✓ | ✓ | ✓ | Bridge | ✗ | ✓ | ✓ |
| NYU Franka | ✓ | ✓ | ✓ | NYU Door Opening | ✗ | ✓ | ✓ |
| Furniture Bench | ✓ | ✓ | ✓ | Toto | ✗ | ✓ | ✓ |
| UCSD Kitchen | ✓ | ✓ | ✓ | Kuka | ✗ | ✗ | ✓ |
| Embodiment | Prior | Prior Selection | No. of | No. of | |
| Dataset | Ratio | Target Demos | Evaluations | ||
| Franka-Pick | Franka-Panda | OXE13 | 1% | 10 | 14 |
| Franka-Pouch | Franka-Panda | OXE23 | 0.75% | 30 | 17 |
| Tiago-Sink | Tiago | OXE24 | 0.5% | 20 | 39 |
| Droid-Multitask | Franka-Panda | OXE24 | 1% | 40 (total) | 32 (total) |
| Drawer | - | - | - | 10 | 10 |
| Bread | - | - | - | 15 | 12 |
| Napkin | - | - | - | 15 | 10 |
Appendix G Computation Costs for Data Selection
Regression uses 10,000 trained subsets; the reported approximately eight hours across eight A100s corresponds to roughly 60–70 GPU-hours, amortized by reusing policies to score all fifty MetaWorld targets. Metagradients are typically three to five times slower than ordinary training. Reported selection costs include 16–20 hours on four A5000s for LIBERO and three to four days on four A100s for OXE. Avoiding robot rollouts shifts the cost to offline computation rather than eliminating it.
Appendix H Hyperparameters for estimating datamodels
MetaWorld regression samples inclusion masks at probability 0.1 and trains three-layer, 400-unit policies for 10,000 subset experiments. Metagradient experiments use 20 or 30 refinement steps, depending on the dataset. Crucially, differentiation covers only the final 100 policy-training steps, not the complete training history; exact differentiation of that segment should not be described as exact attribution through the full optimization.