Overview
This study compares when to introduce image data, how much to mix with text, and when to apply instruction tuning. The complete edition preserves the per-benchmark curves, larger-model check, and all training-recipe ablations.
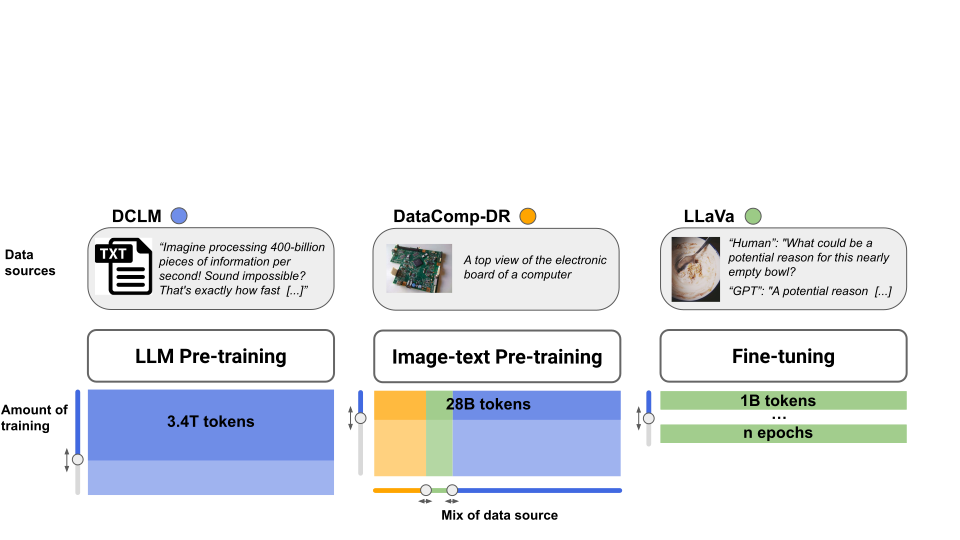
At a glance
The paper studies adding images before a language model finishes its text-only learning-rate schedule. Across mostly small and 1.4-billion-parameter language backbones, continuing from an intermediate checkpoint with mixed caption/text data can outperform restarting from the final checkpoint. The reported headline gain is about two average vision-benchmark percentage points at the 80% checkpoint. The comparison also changes learning-rate history, and the best image ratio depends on scale and initialization. Vision gains can come with substantial text-benchmark losses after instruction tuning.
1 Introduction
Most vision–language recipes start with a completed language model and then add image conditioning. This work instead tests intermediate language checkpoints, preserving their remaining learning-rate trajectory during a short multimodal continuation. It explores roughly 300 model configurations across checkpoint age, data mixtures, scale, and instruction tuning.
The central empirical recommendation is to test multimodal continuation during cooldown rather than assume the final language checkpoint is always best. It is a recipe study with limited scales and data formats, not a general proof that visual data should always be present from the start.
2 Experimental Setup
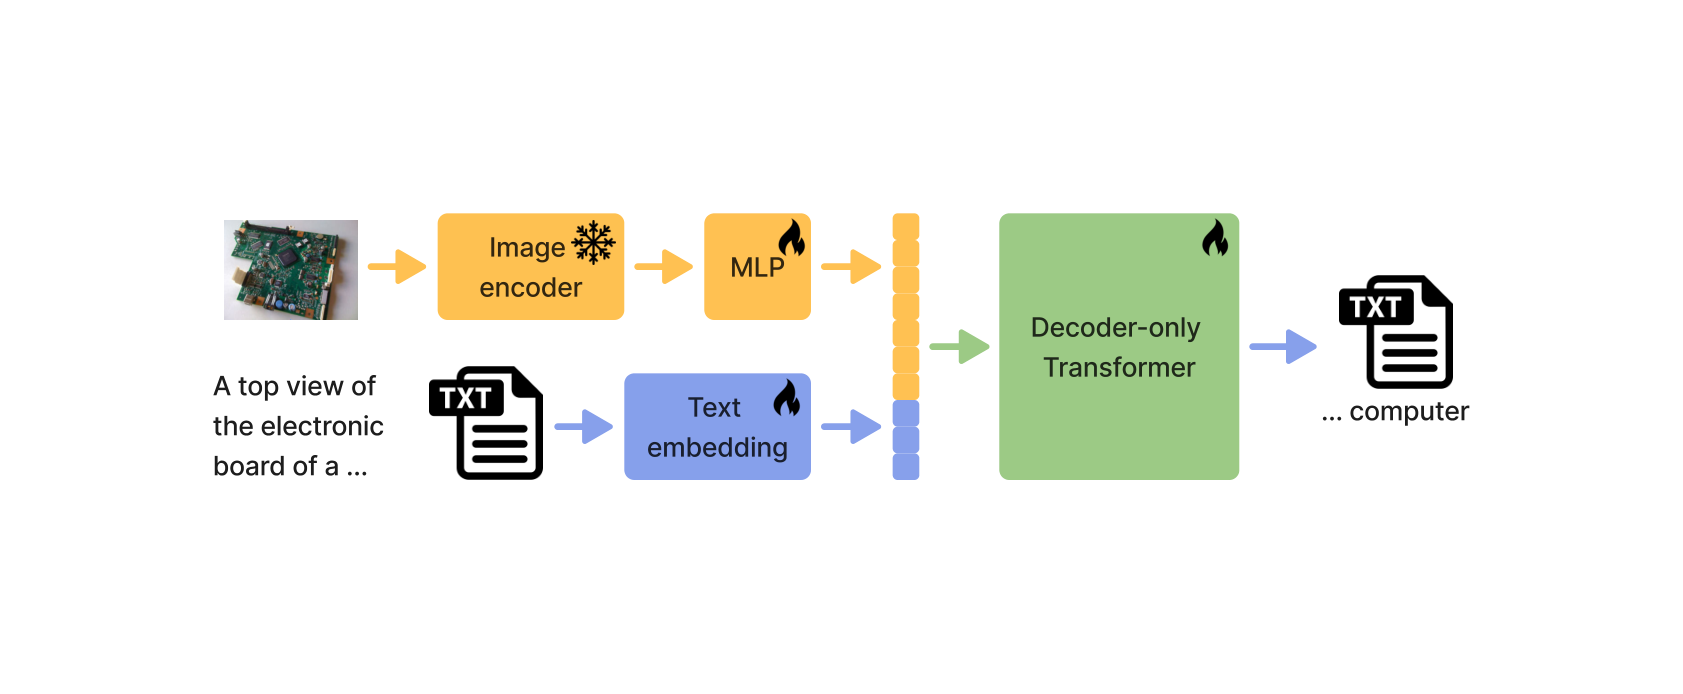
The default model combines a pretrained 400-million-parameter SigLIP encoder (Zhai et al., 2023), a two-layer projection network, and a 1.4-billion-parameter decoder-only language backbone. The paper often calls this the 1B regime; that shorthand describes the language-model scale and excludes the separate image encoder. Vision weights are frozen in the main experiments.
2.1 Training Procedure
Training has three phases: text-only language pretraining, mixed caption/text continuation from a selected checkpoint, and image instruction finetuning. The continuation resumes the learning-rate schedule for intermediate checkpoints, while final or fresh checkpoints require a warmup schedule. These differing histories are part of the compared recipes.
| Model | Text-Only Pre-training | Image-Text Pre-training | Multitask Fine-Tuning |
|---|---|---|---|
|
BLIP3
(Xue et al., 2024) |
Fully pre-trained
(Phi3-mini) |
Re-warmup
Caption and interleaved text-image data; no pure text |
Re-warmup |
|
Flamingo
(Alayrac et al., 2022) |
Fully pre-trained
(closed model) |
Re-warmup
Caption and interleaved text-image data; no pure text |
(Skipped) |
|
IDEFICS
(Laurençon et al., 2024) |
Fully pre-trained
(Mistral-7B-v0.1) |
Re-warmup
Interleaved text-image data; no pure text |
Re-warmup |
|
MM1
(McKinzie et al., 2024) |
Fully pre-trained
(closed model) |
Re-warmup
Various image-text ratios (100::0, 91::9, 86::14, 66::33) |
Re-warmup |
|
DeepSeek-VL / DeepSeek-VL2
(Lu et al., 2024; Wu et al., 2024b) |
Fully pre-trained
(DeepSeek) |
Two-stage (re-warmup then re-warmup)
Multitask; 30::70 image-text ratio |
Re-warmup |
|
Qwen-VL
(Bai et al., 2023) |
Fully pre-trained
(Qwen) |
Two-stage (re-warmup then re-warmup)
Caption then multitask; no pure text |
Re-warmup |
|
PaliGemma
(Beyer et al., 2024) |
Fully pre-trained
(Gemma) |
Two-stage (re-warmup then continue LR schedule)
Multitask; no pure text |
Continued LR schedule |
|
Janus / Janus Pro
(Wu et al., 2024a; Chen et al., 2025) |
Fully pre-trained
(DeepSeek-LLM) |
Two-stage (re-warmup then re-warmup)
Multitask; no pure text, followed by 30::70 image-text ratio |
No warmup |
|
Prismatic
(Karamcheti et al., 2024) |
Fully pre-trained
(LLaMA) |
No image-text pre-training. | Re-warmup |
| Ours |
Partially pre-trained
(OpenLM) |
Continued LR schedule
Various image-text ratios |
Re-warmup |
2.1.1 Text-only Pre-training
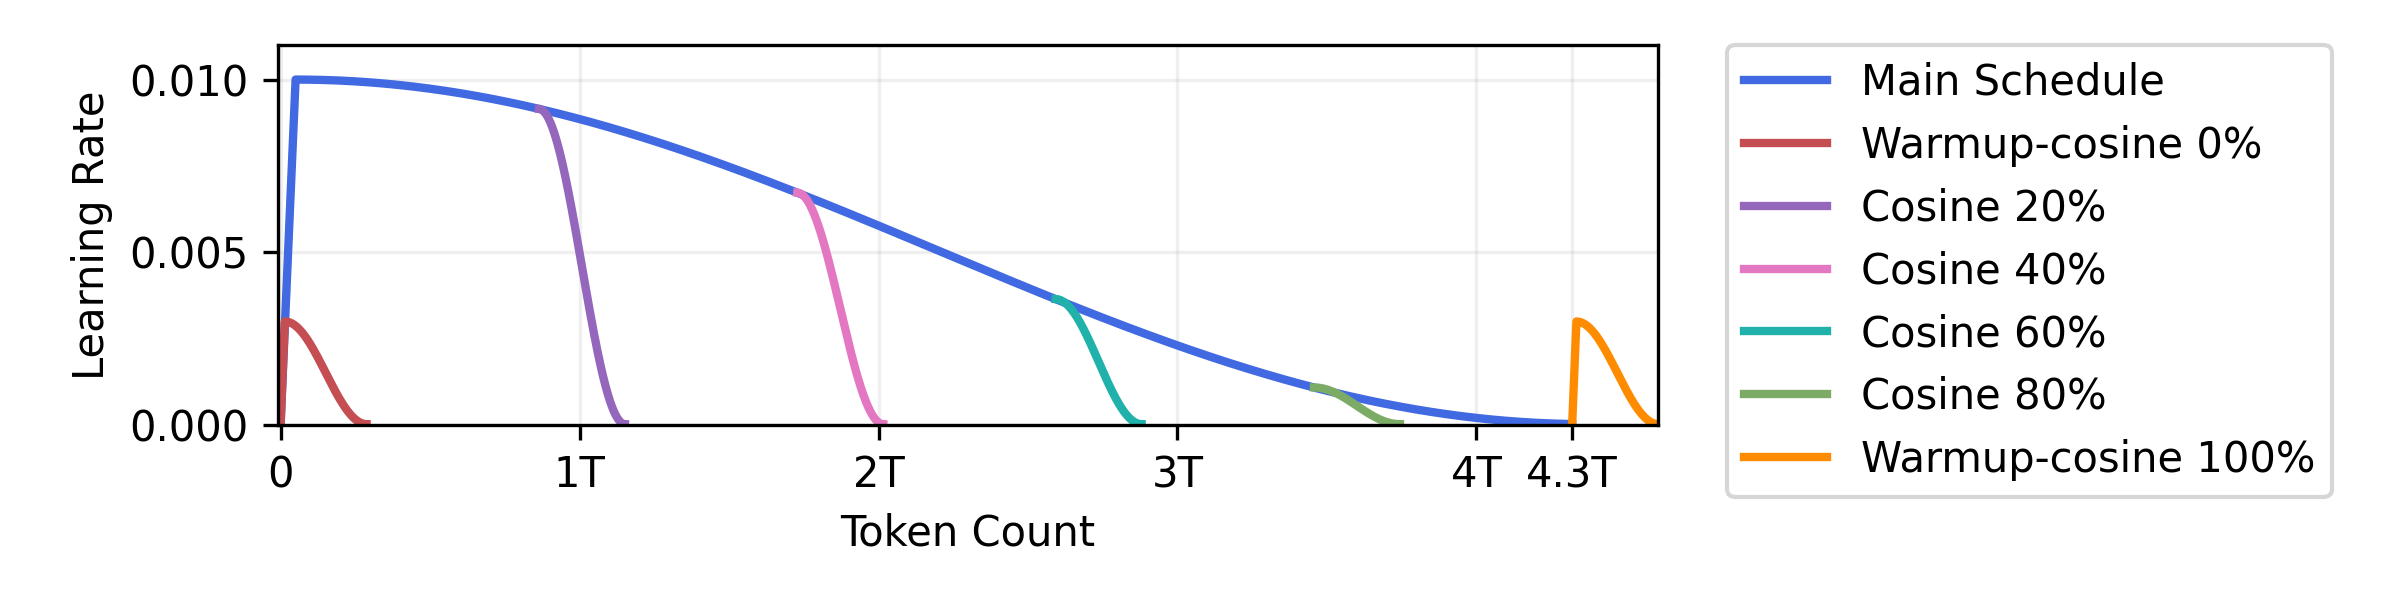
Existing DCLM-1B checkpoints (Li et al., 2024b) supply language backbones at 20%, 40%, 60%, 80%, and completion of a 4.3-trillion-token run. The 80% checkpoint has seen 3.44 trillion text tokens. The final language model uses a much lower terminal learning rate than an intermediate checkpoint.
Comparing checkpoint ages also changes prior text exposure and compute. Adding 28 billion multimodal tokens at 80% does not complete the remaining 860 billion tokens of the original text schedule.
2.1.2 Image-Text Pre-training
The default continuation mixes DCLM-style text with DataCompDR recaptioned images for 28 billion tokens, approximately twenty tokens per language-model parameter. Inputs contain text alone or one image followed by text; interleaved multi-image documents are excluded. Each image occupies 729 tokens within a 1,024-token sequence.
Intermediate checkpoints resume their current learning rate and cool down. Image ratio, caption source, and encoder choice are varied separately. The main recipe freezes the image encoder, though the supplementary freezing ablation contains a direct table/prose contradiction described below. The text-data description names ProofPile in initial pretraining and MathPile in continuation despite saying the mixtures match.
2.1.3 Instruction Fine-tuning
Instruction tuning uses the LLaVA mixture through the Prismatic framework (Karamcheti et al., 2024). Epoch counts are trained as separate runs with their own warmup/cosine schedules, avoiding the assumption that a checkpoint from a longer schedule equals a separately trained shorter run.
2.2 Evaluation
All evaluations are zero-shot in the in-context-learning sense. The main vision aggregate covers six tasks spanning question answering, text reading, hallucination, and localization. A stable score subtracts each task’s random-guessing baseline and averages the remaining accuracy; changes therefore represent average percentage-point differences rather than a relative percentage gain.
Text benchmarks are selected to be meaningful for the exploratory 79-million-parameter model. VizWiz and harder visual tasks are excluded from the main aggregate for specified performance or prompt-mismatch reasons, so the reported average is not a universal multimodal benchmark score.
3 Results
The main experiments vary one recipe choice at a time around the 1.4B language model, plotting both aggregate vision/text scores and representative individual tasks. Full per-task curves in the appendix expose exceptions hidden by averages.
3.1 The impact of amount of text-only pre-training
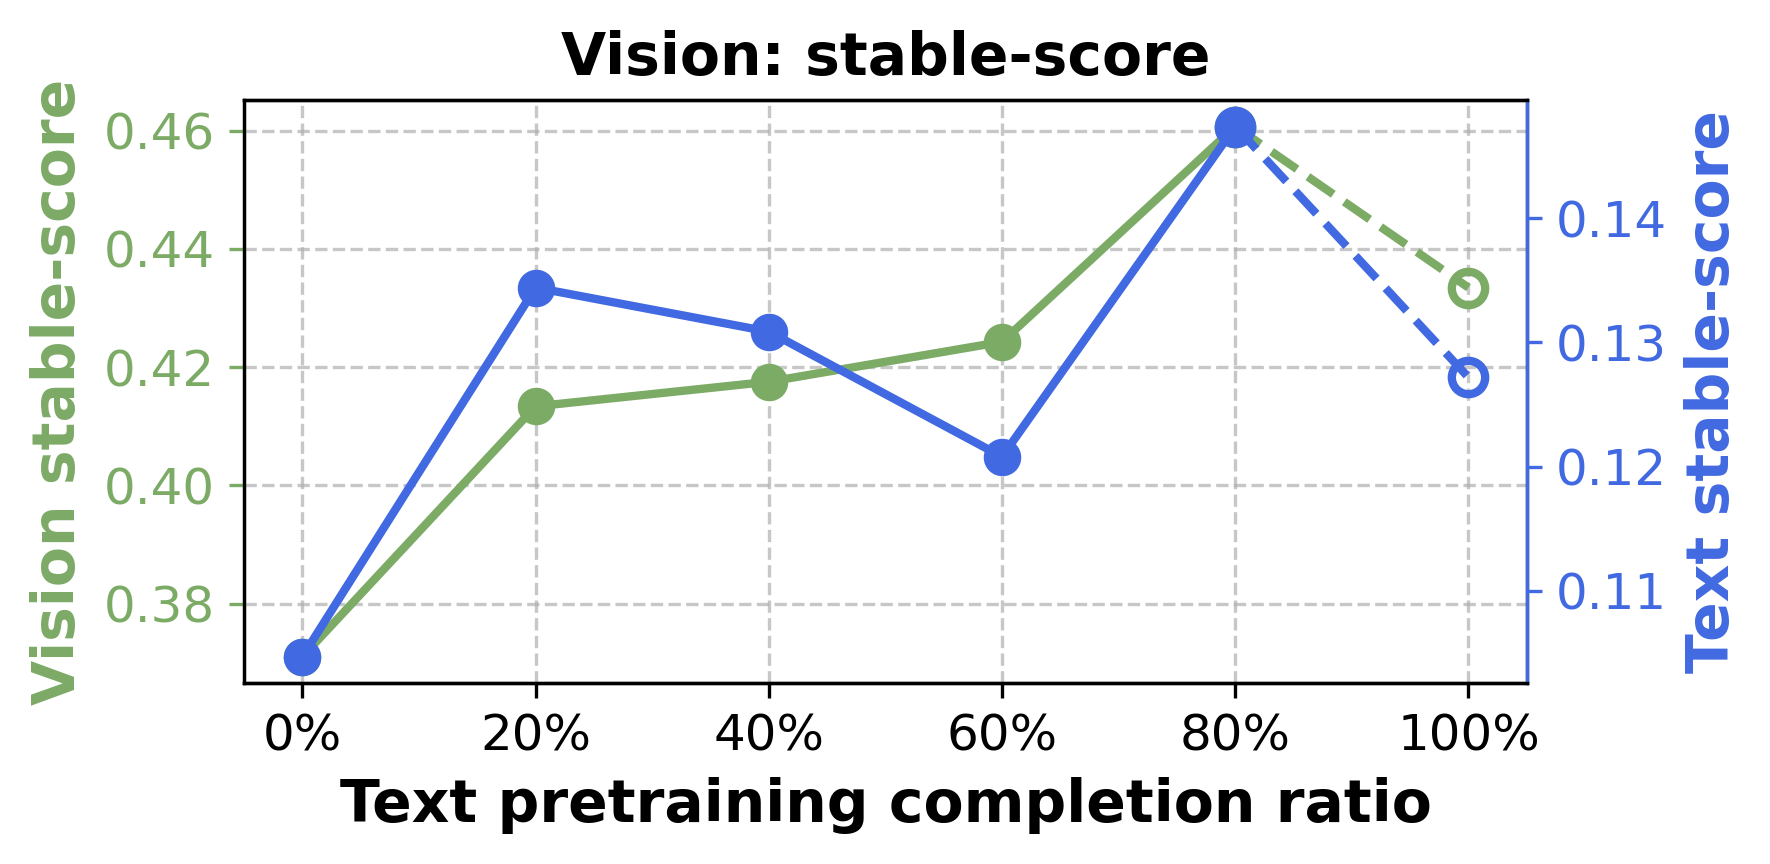
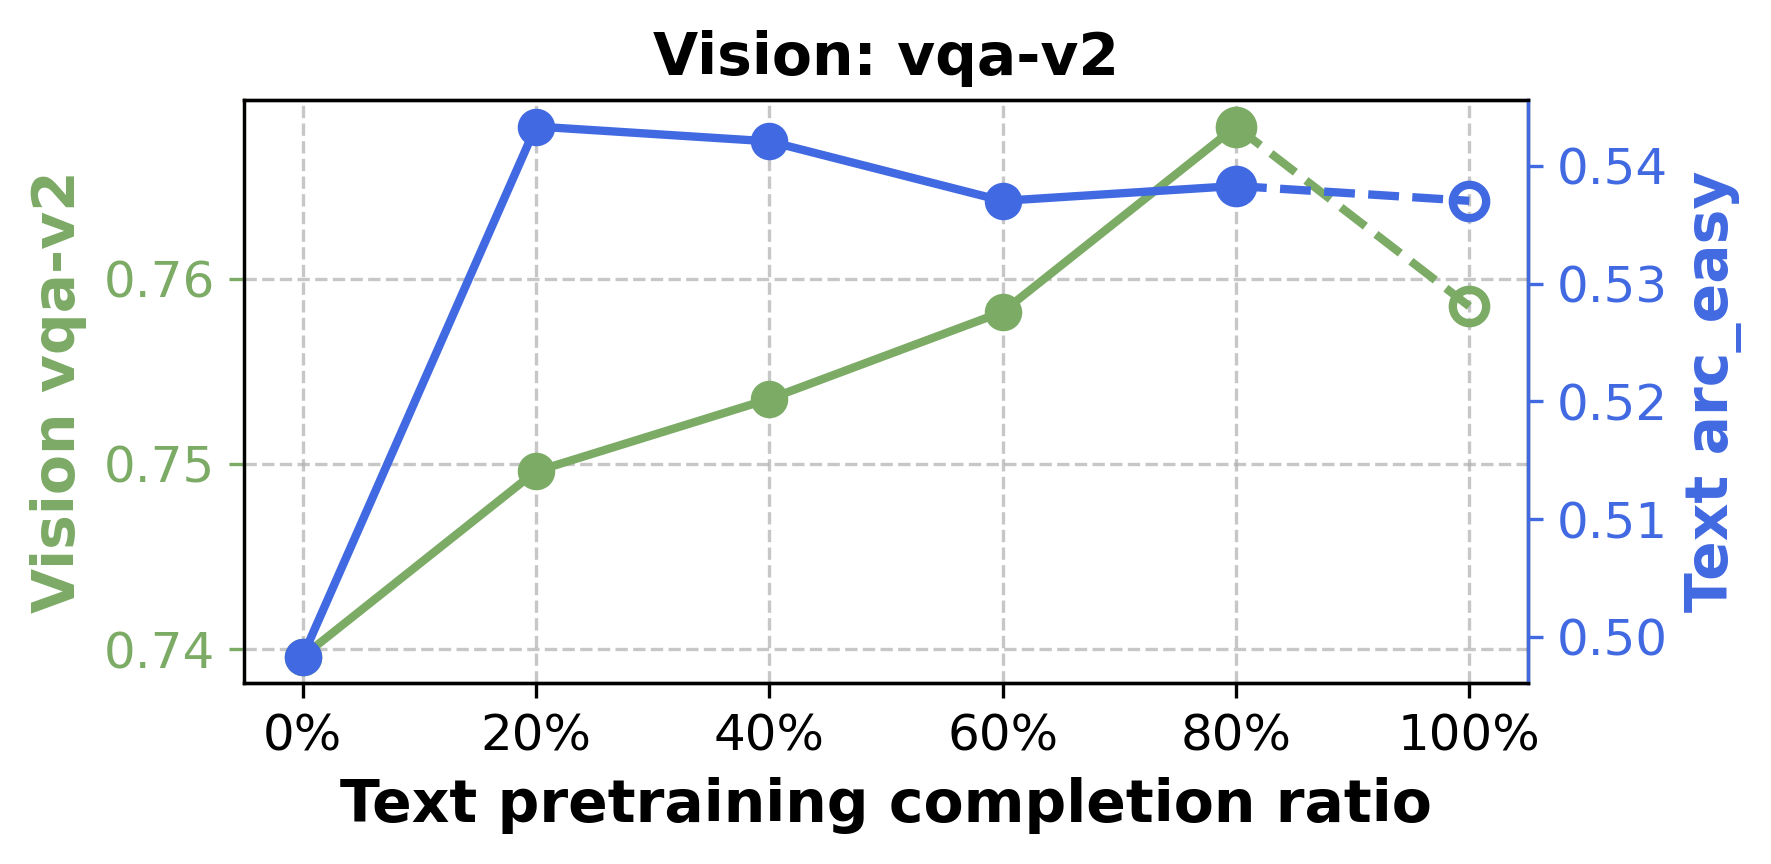
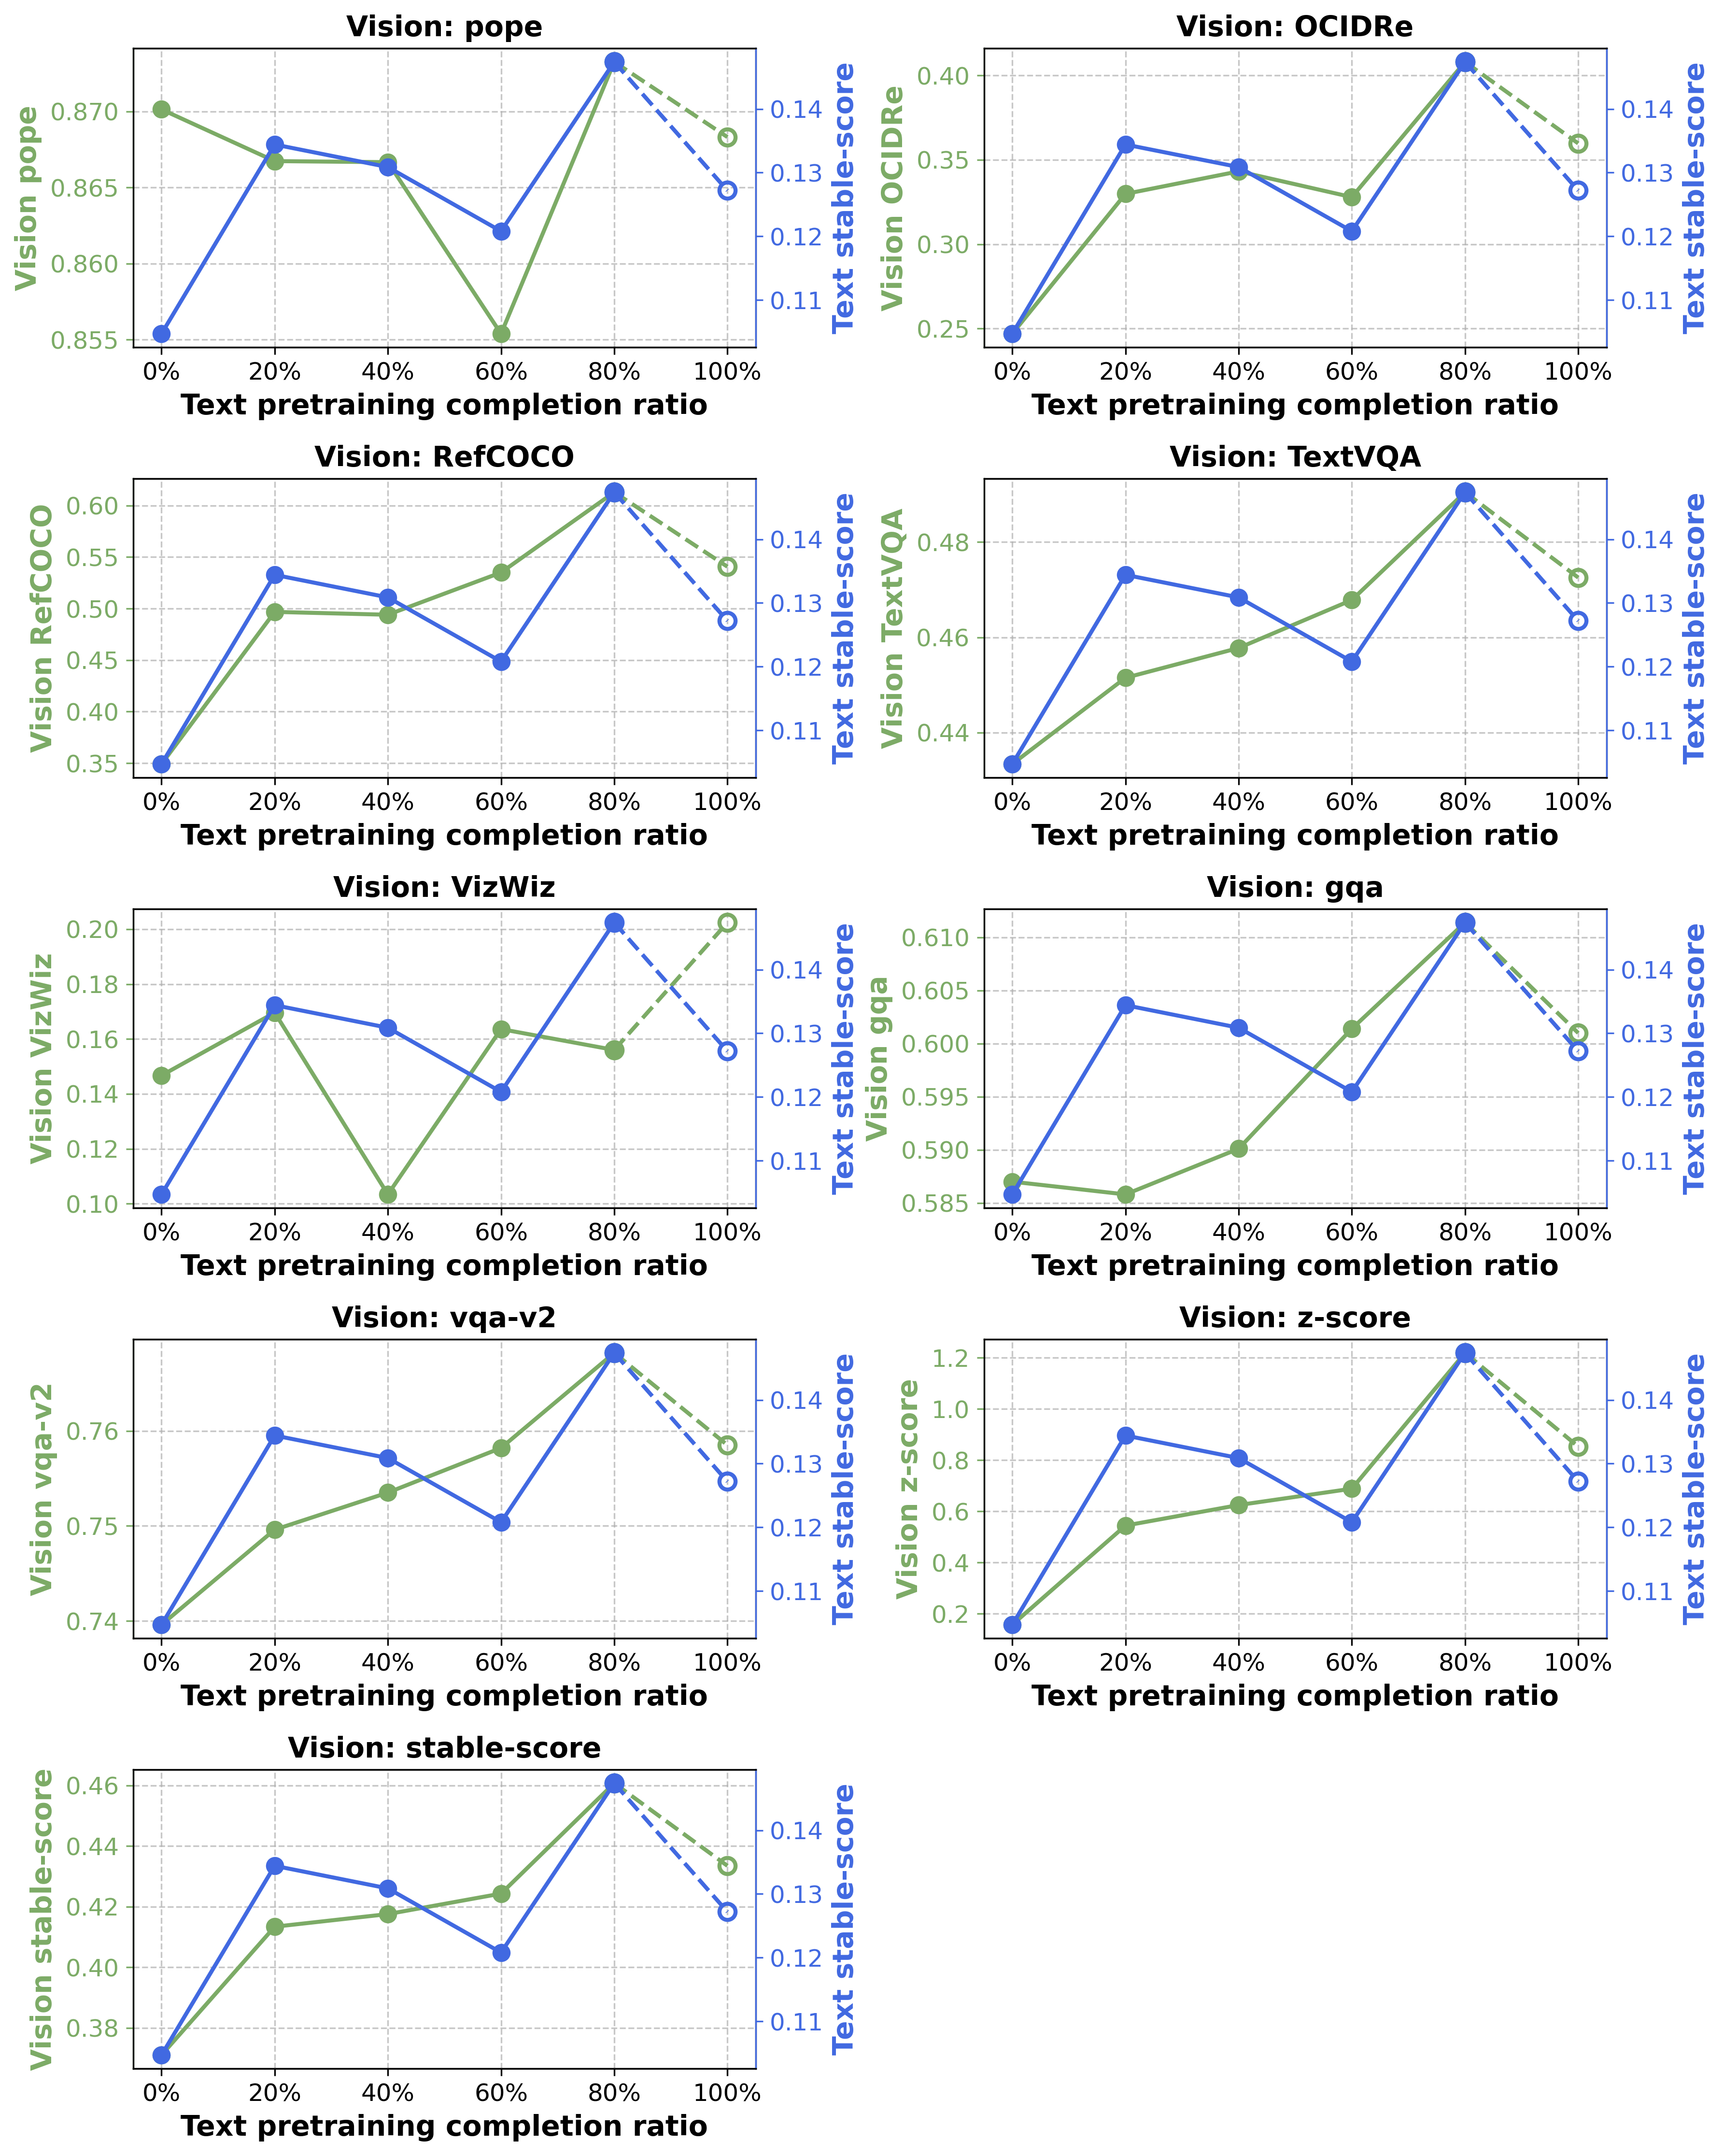
Performance improves as the initial text checkpoint advances to 80%, then declines for the completed checkpoint under the tested recipe. At 0% and 100%, the continuation uses a new warmup to peak learning rate 0.003; intermediate checkpoints resume their existing rate. Thus the 80% result combines checkpoint selection and learning-rate scheduling, and does not isolate a pure causal benefit of introducing vision at that exact fraction.
3.2 The impact of adding images before the end of pre-training
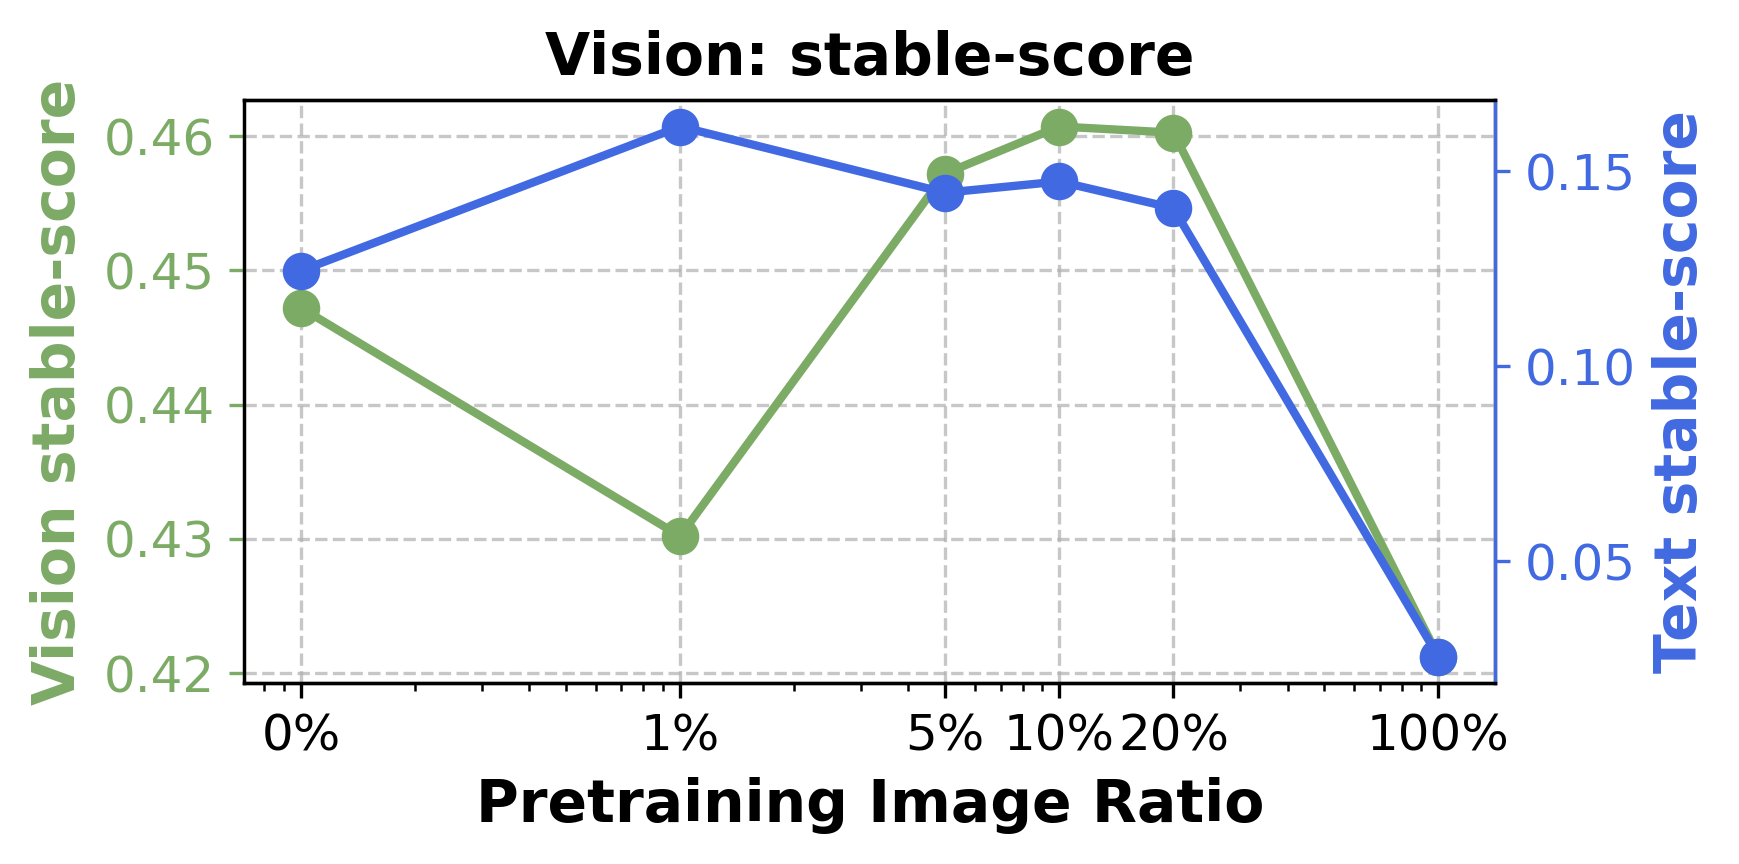
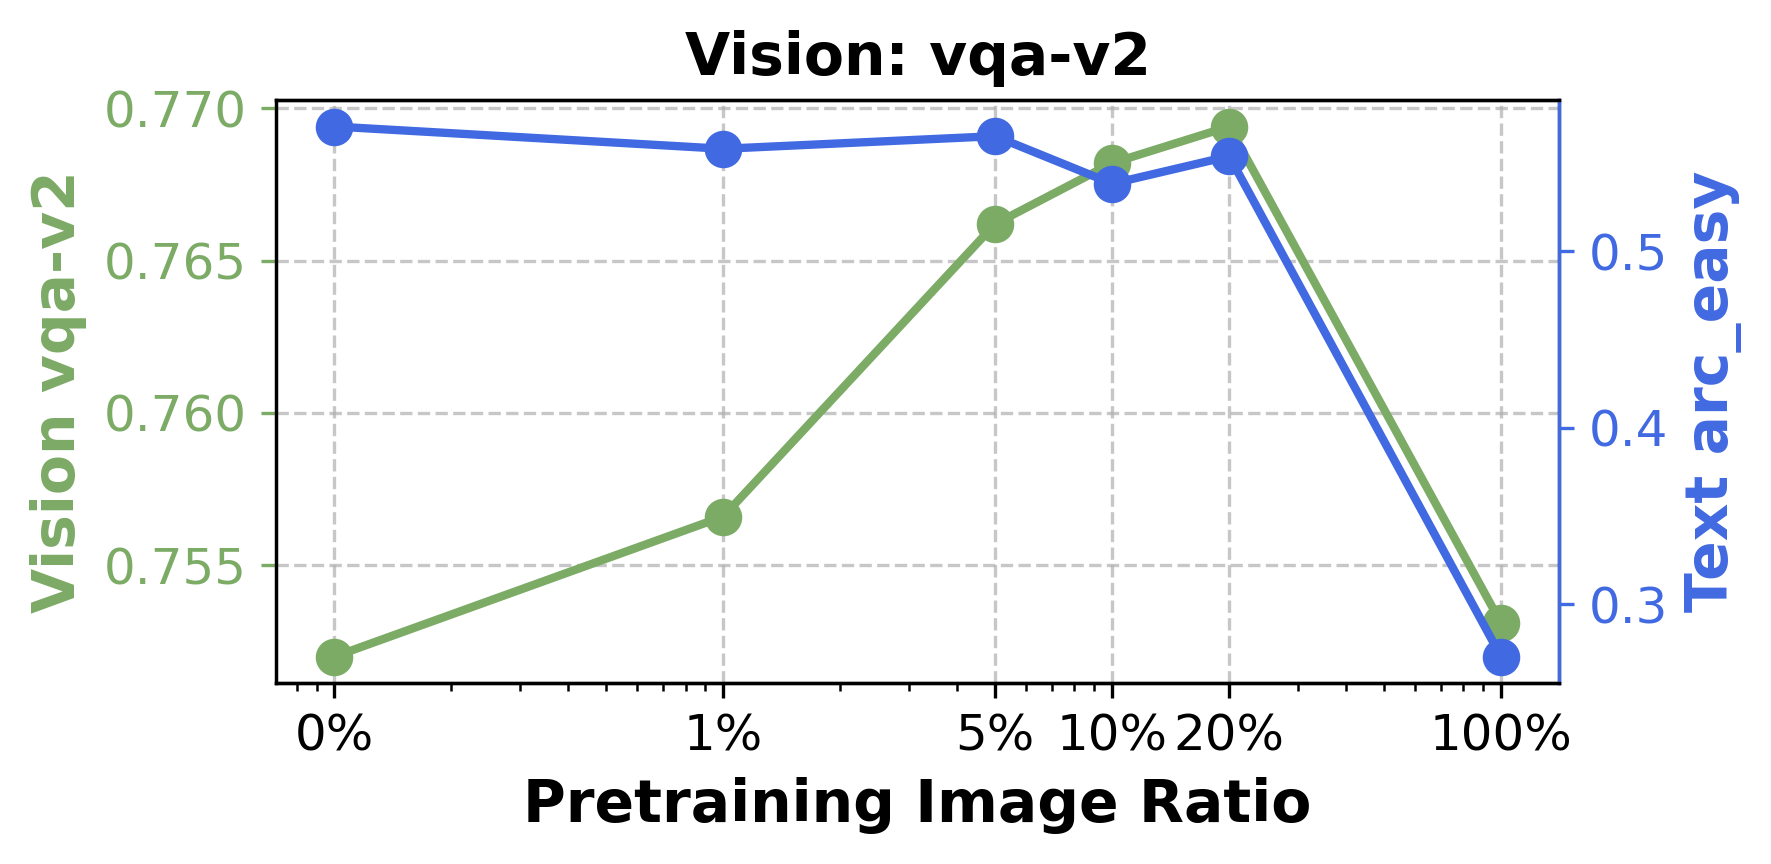
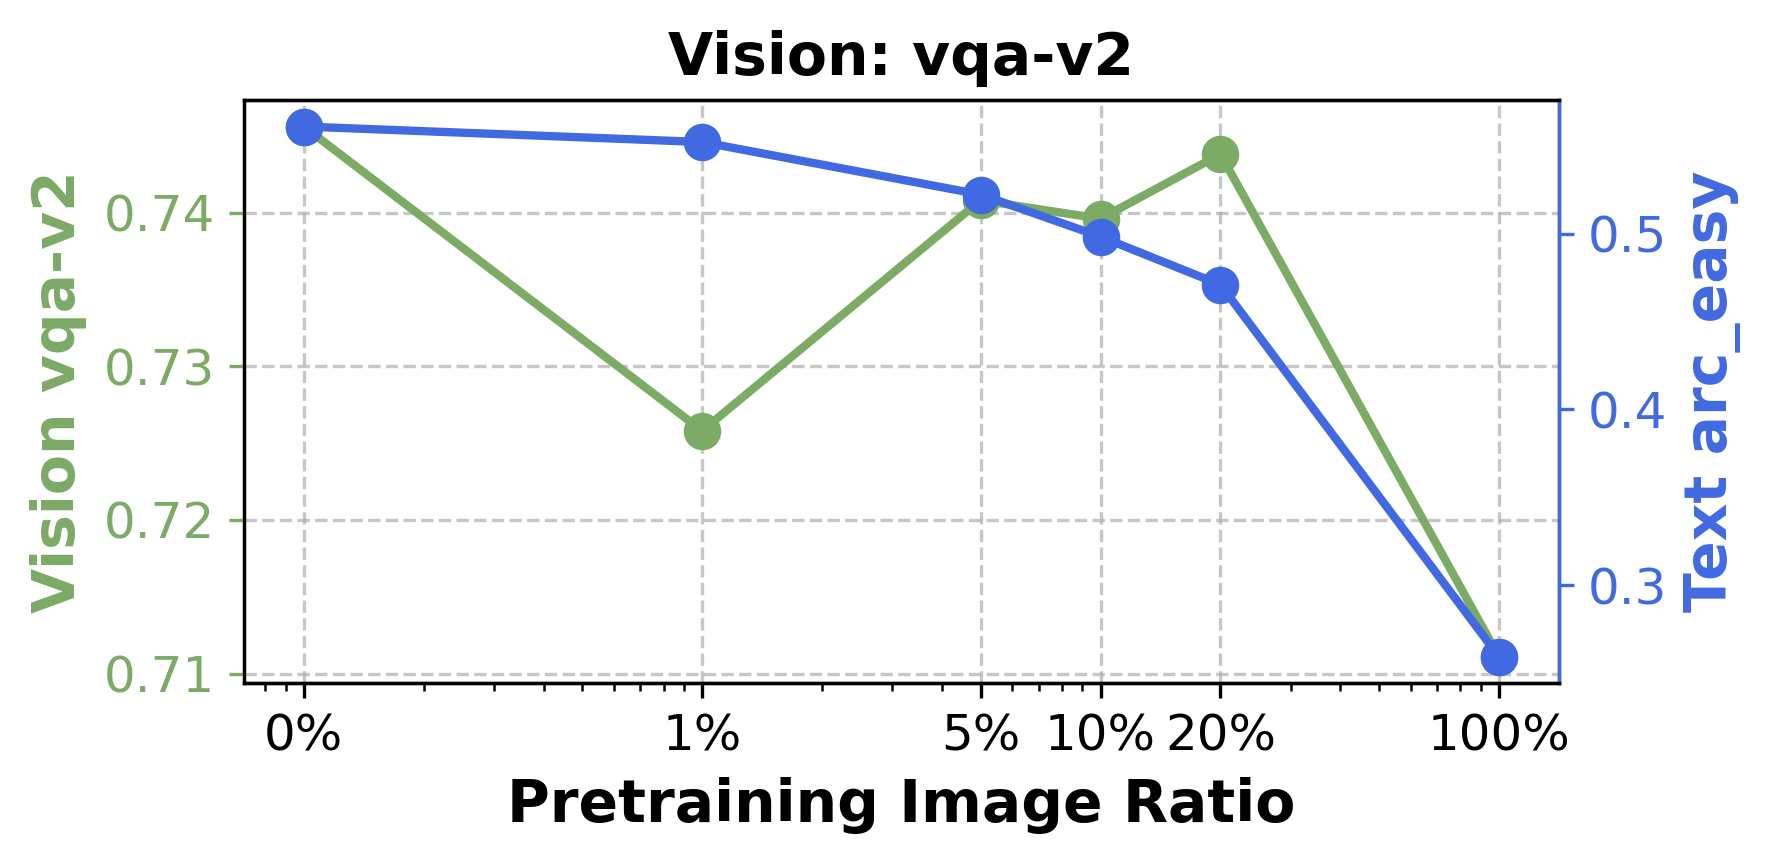
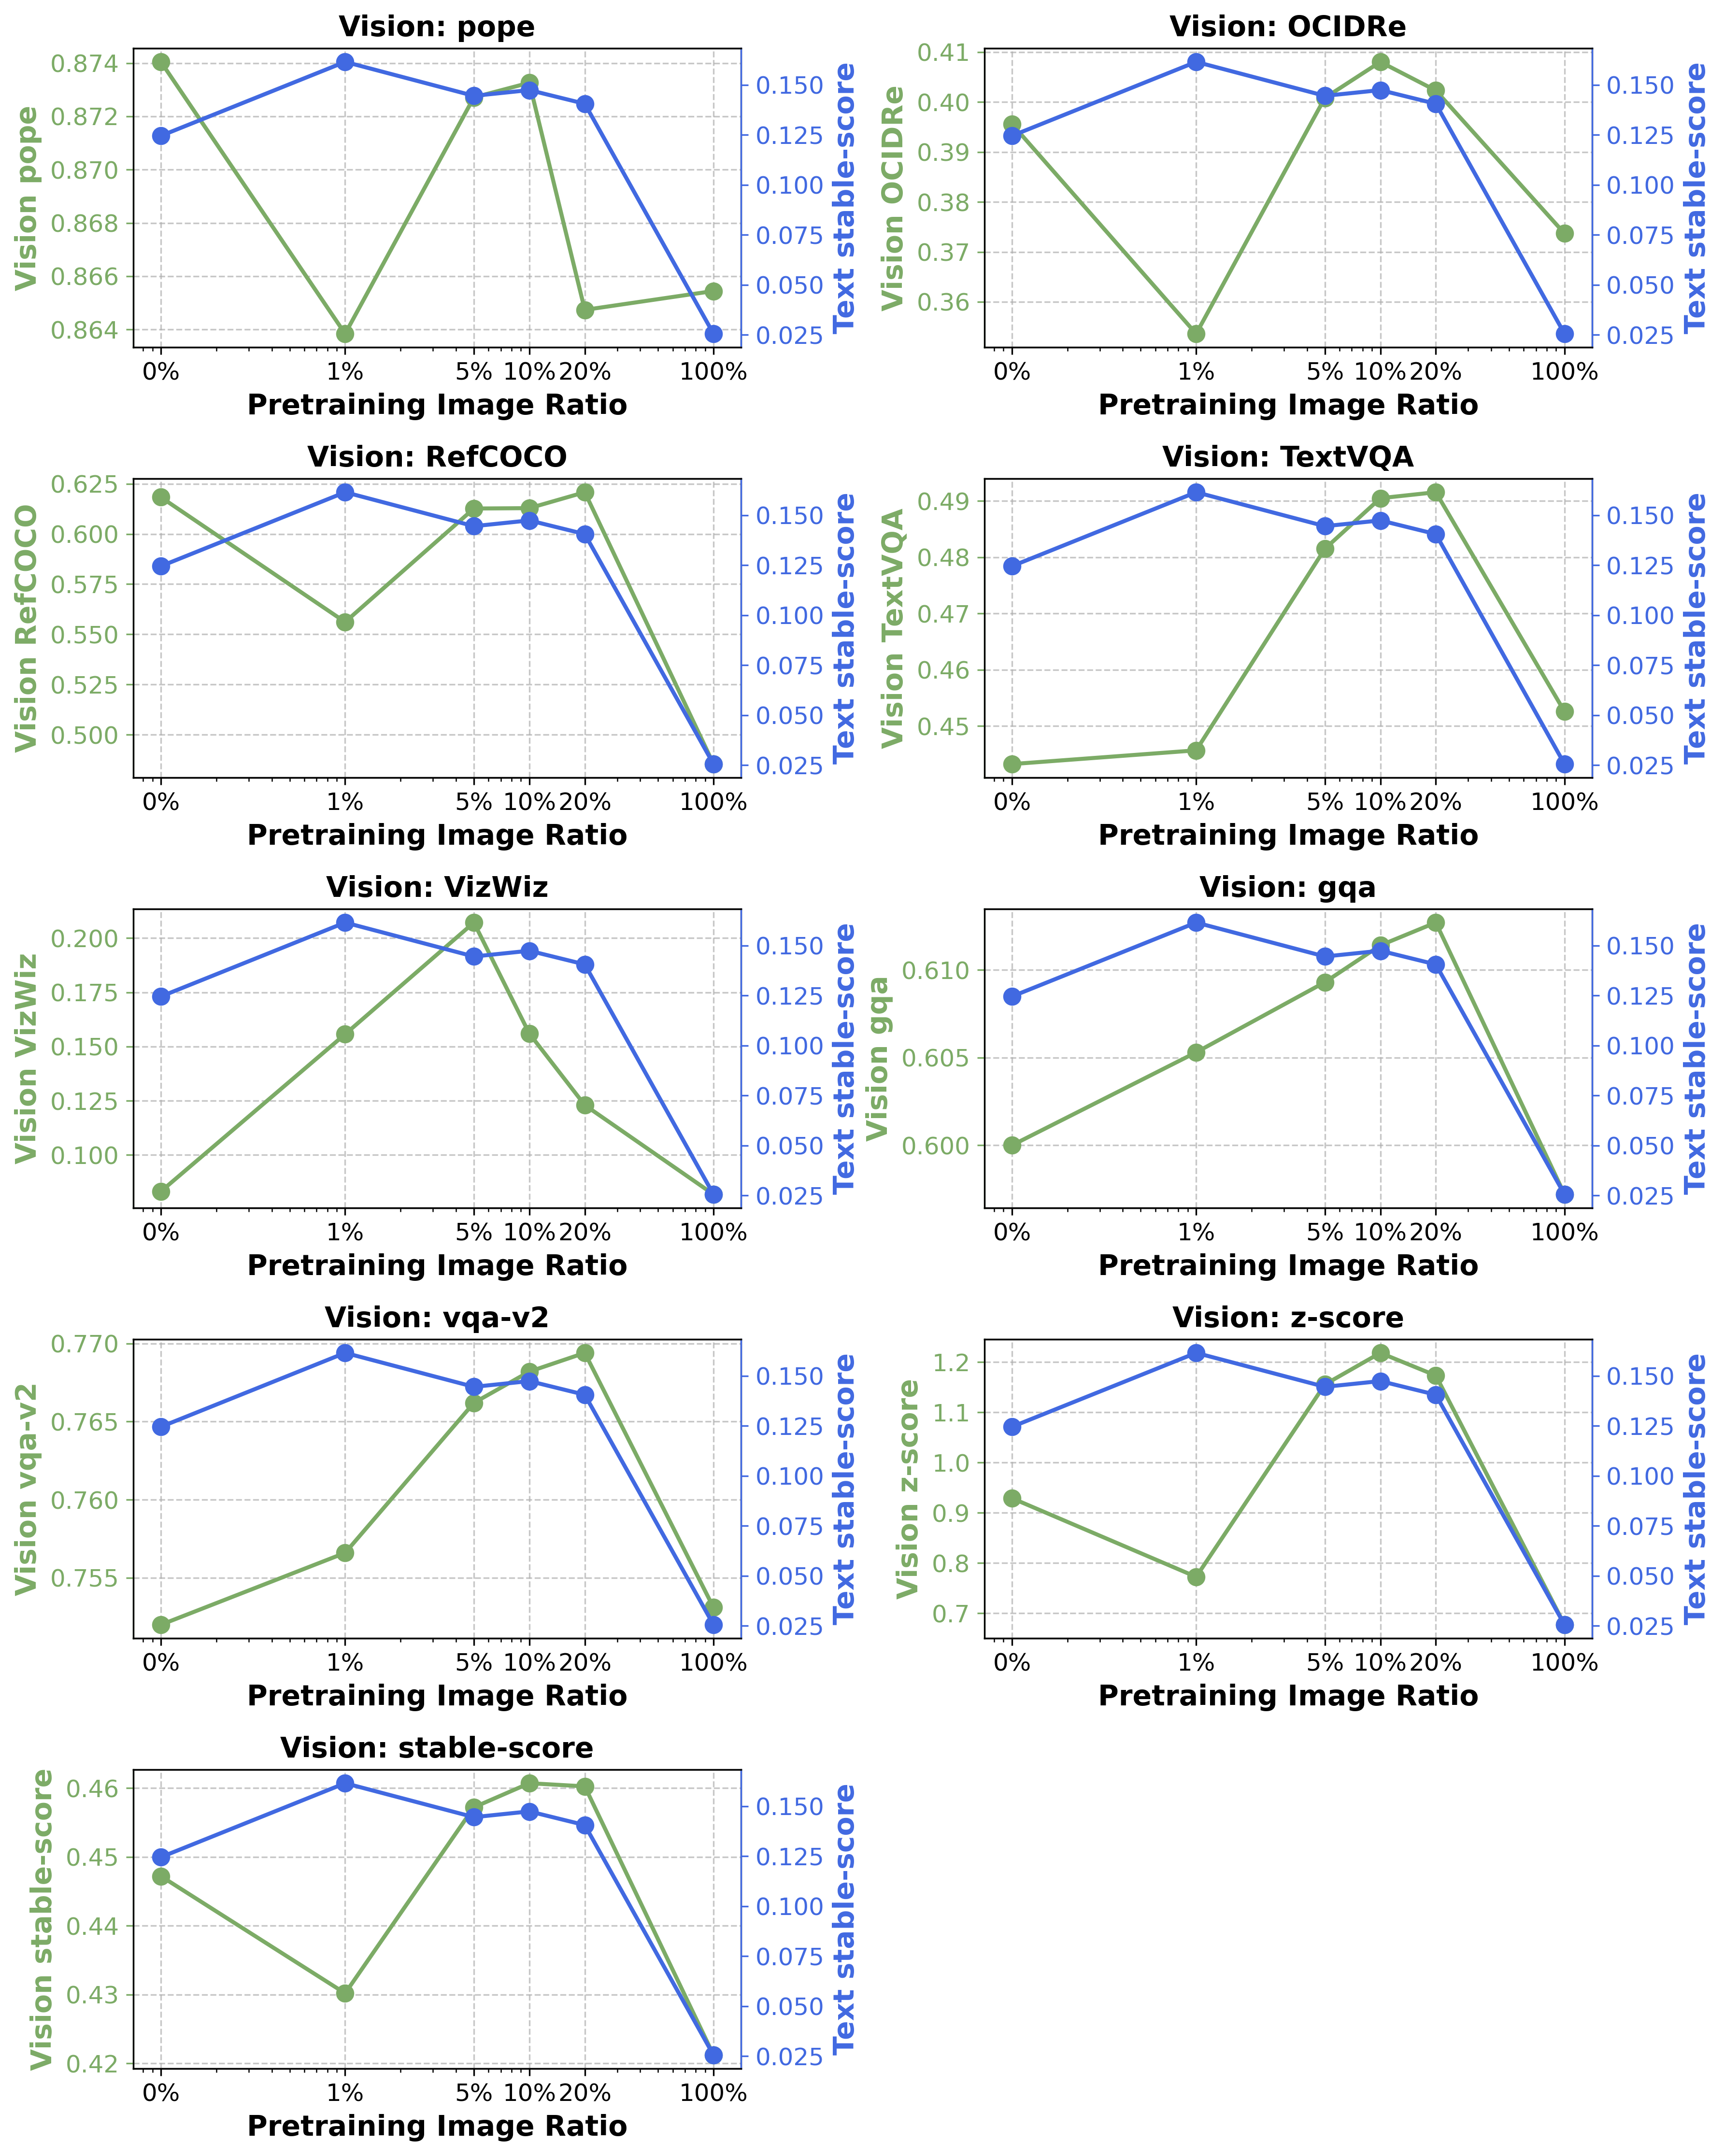
Starting from the 80% checkpoint, a moderate image-caption mixture improves aggregate vision performance, with the paper favoring roughly 10–20% at this scale. Too much image data harms text performance, and an all-image continuation harms both modalities. A small image fraction can slightly improve text scores, while the 1% setting unexpectedly reduces vision scores. The study suggests an empirical mixture range rather than a scale-independent optimum.
3.3 The impact of adding images when training from scratch
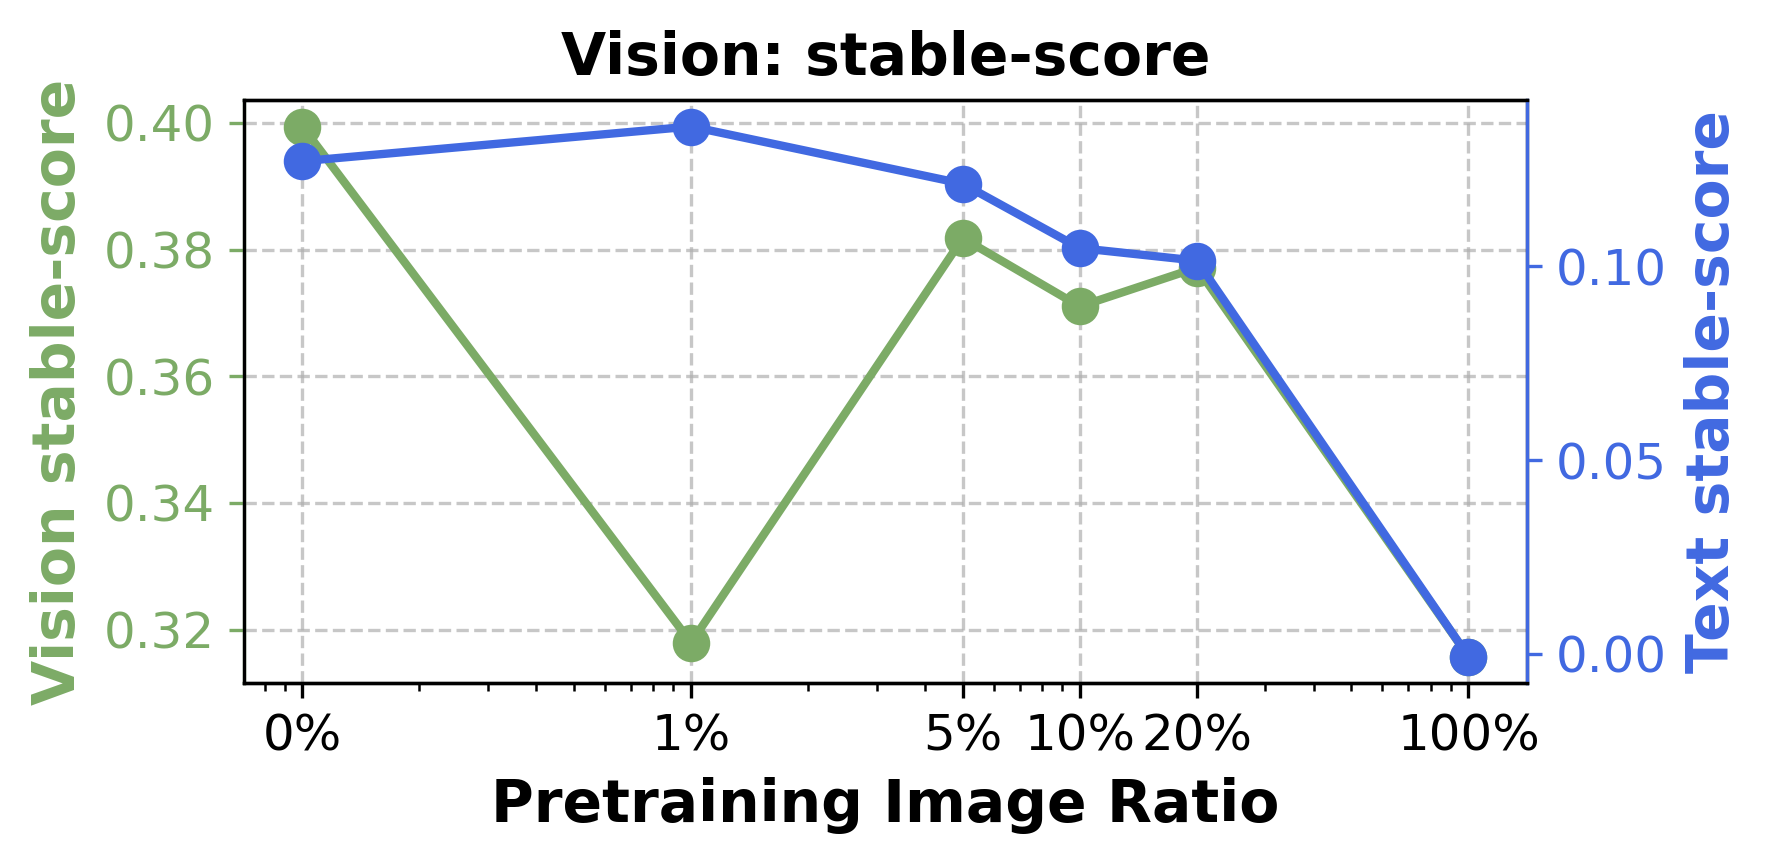
When the language backbone starts from scratch and receives only 28 billion total pretraining tokens, adding more image data generally worsens both vision and text results after finetuning. These models have vastly less text training than the intermediate-checkpoint models. The result therefore describes a short-training regime, not evidence that training multimodal models from scratch is inherently inferior at matched large compute.
3.4 The impact of instruction tuning data in pre-training
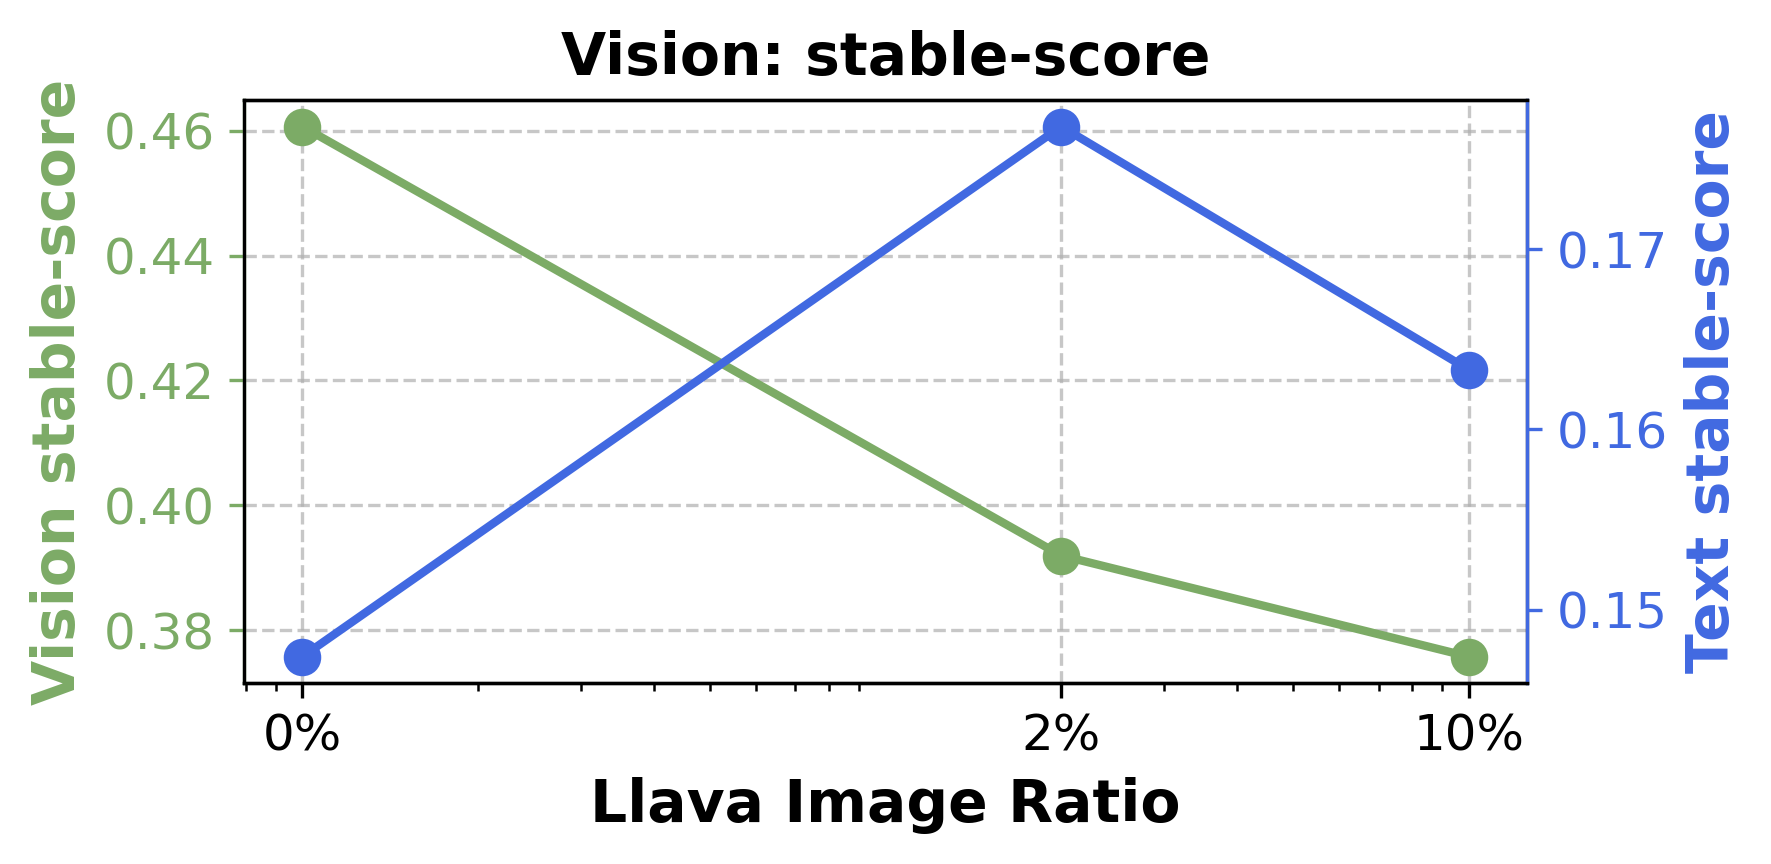
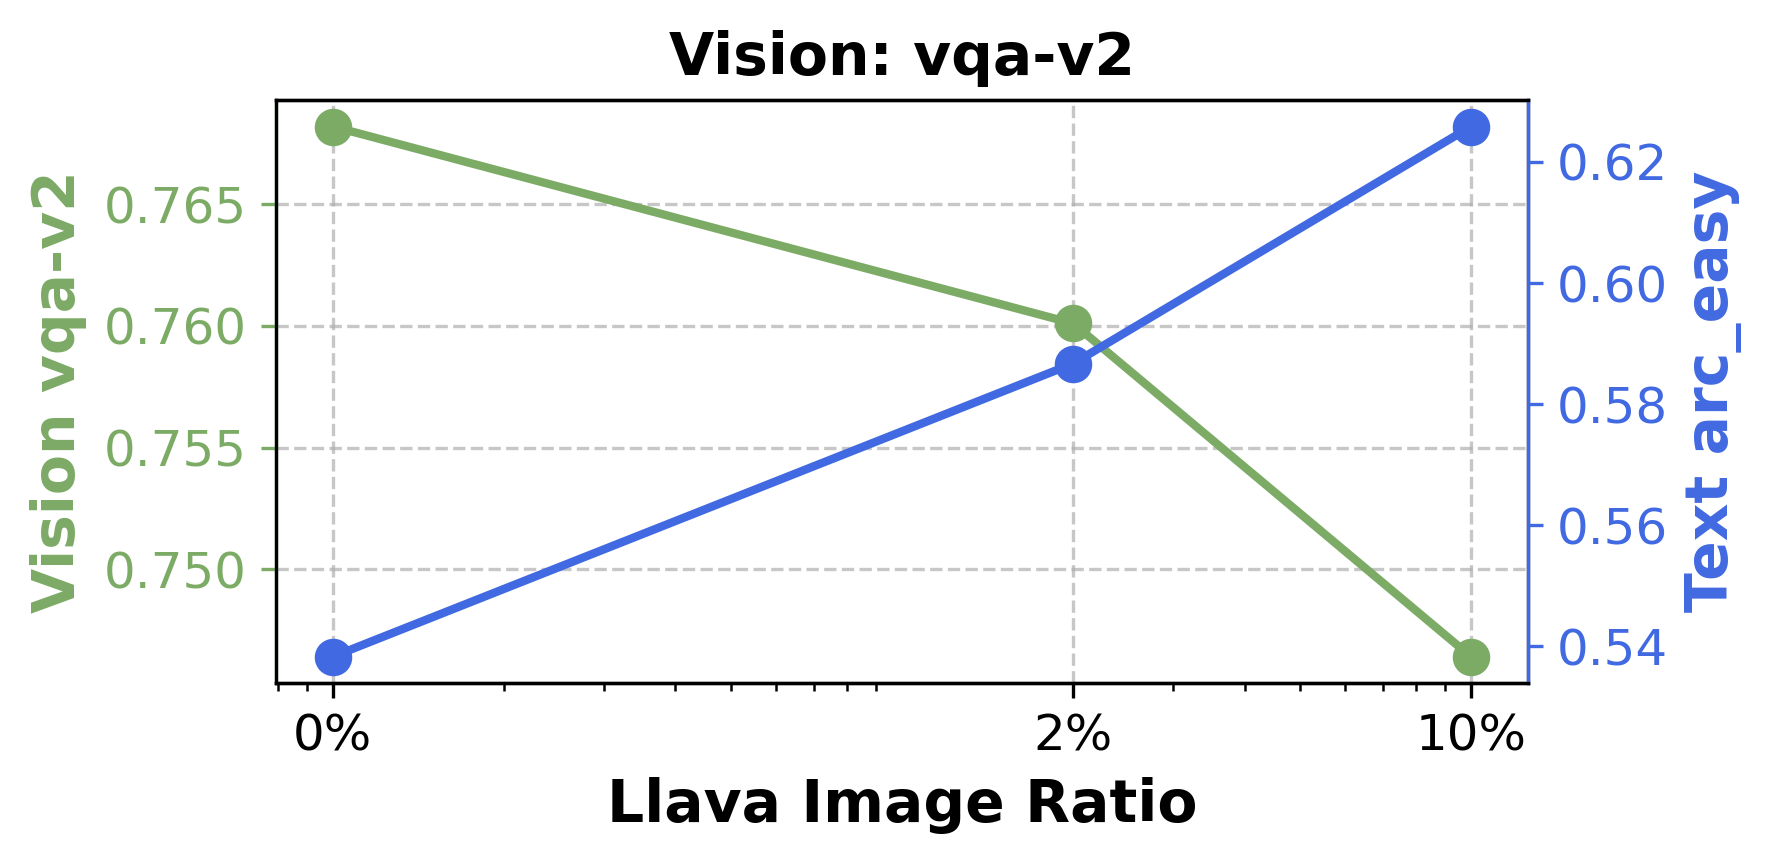
Within a fixed 10% image-related mixture, replacing captions with instruction examples hurts downstream vision performance but can improve text-task scores. The authors favor keeping captions in multimodal pretraining and reserving image instructions for a later phase. This finding applies to the tested data and schedule; it is not a prohibition on every form of instruction data during pretraining.
3.5 The impact of fine-tuning on vision and text performance
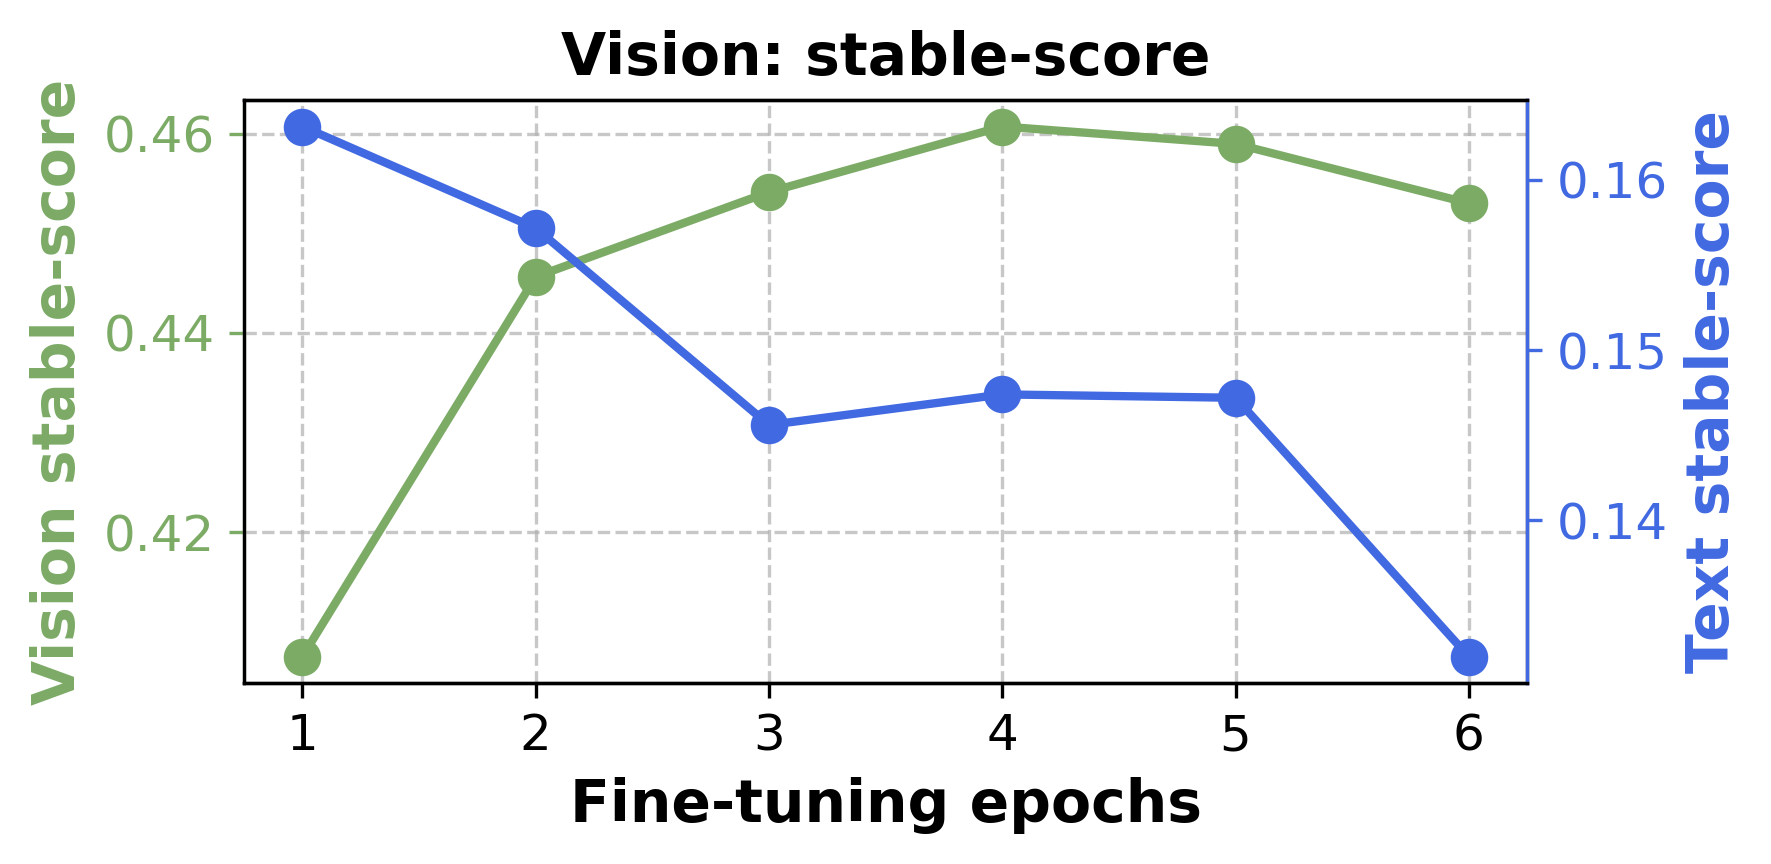
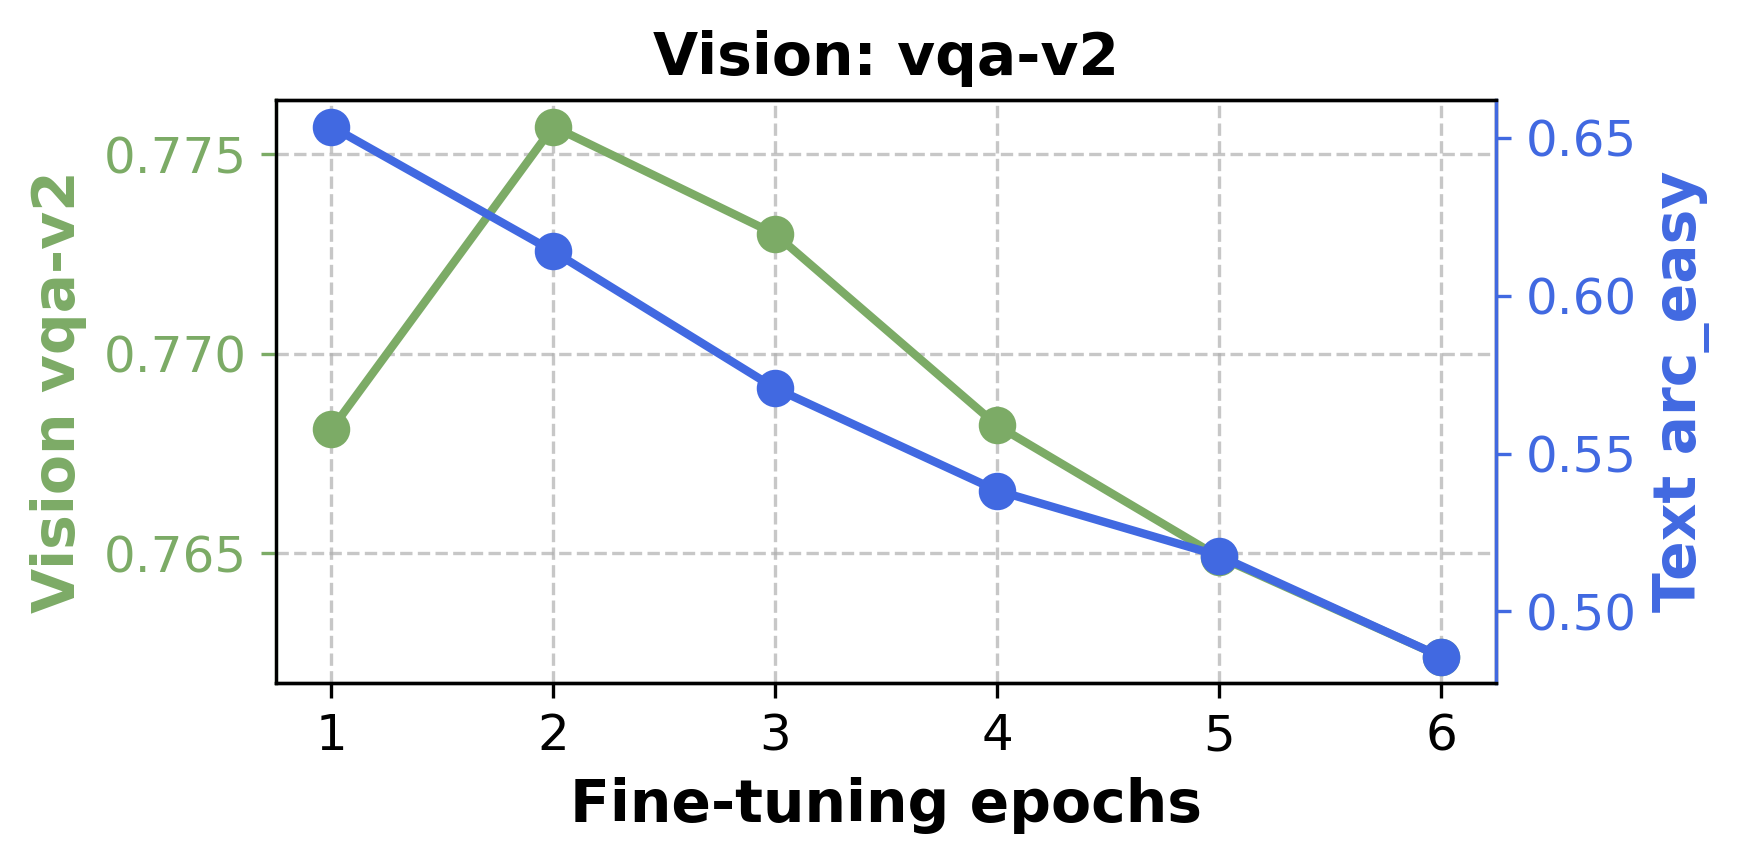
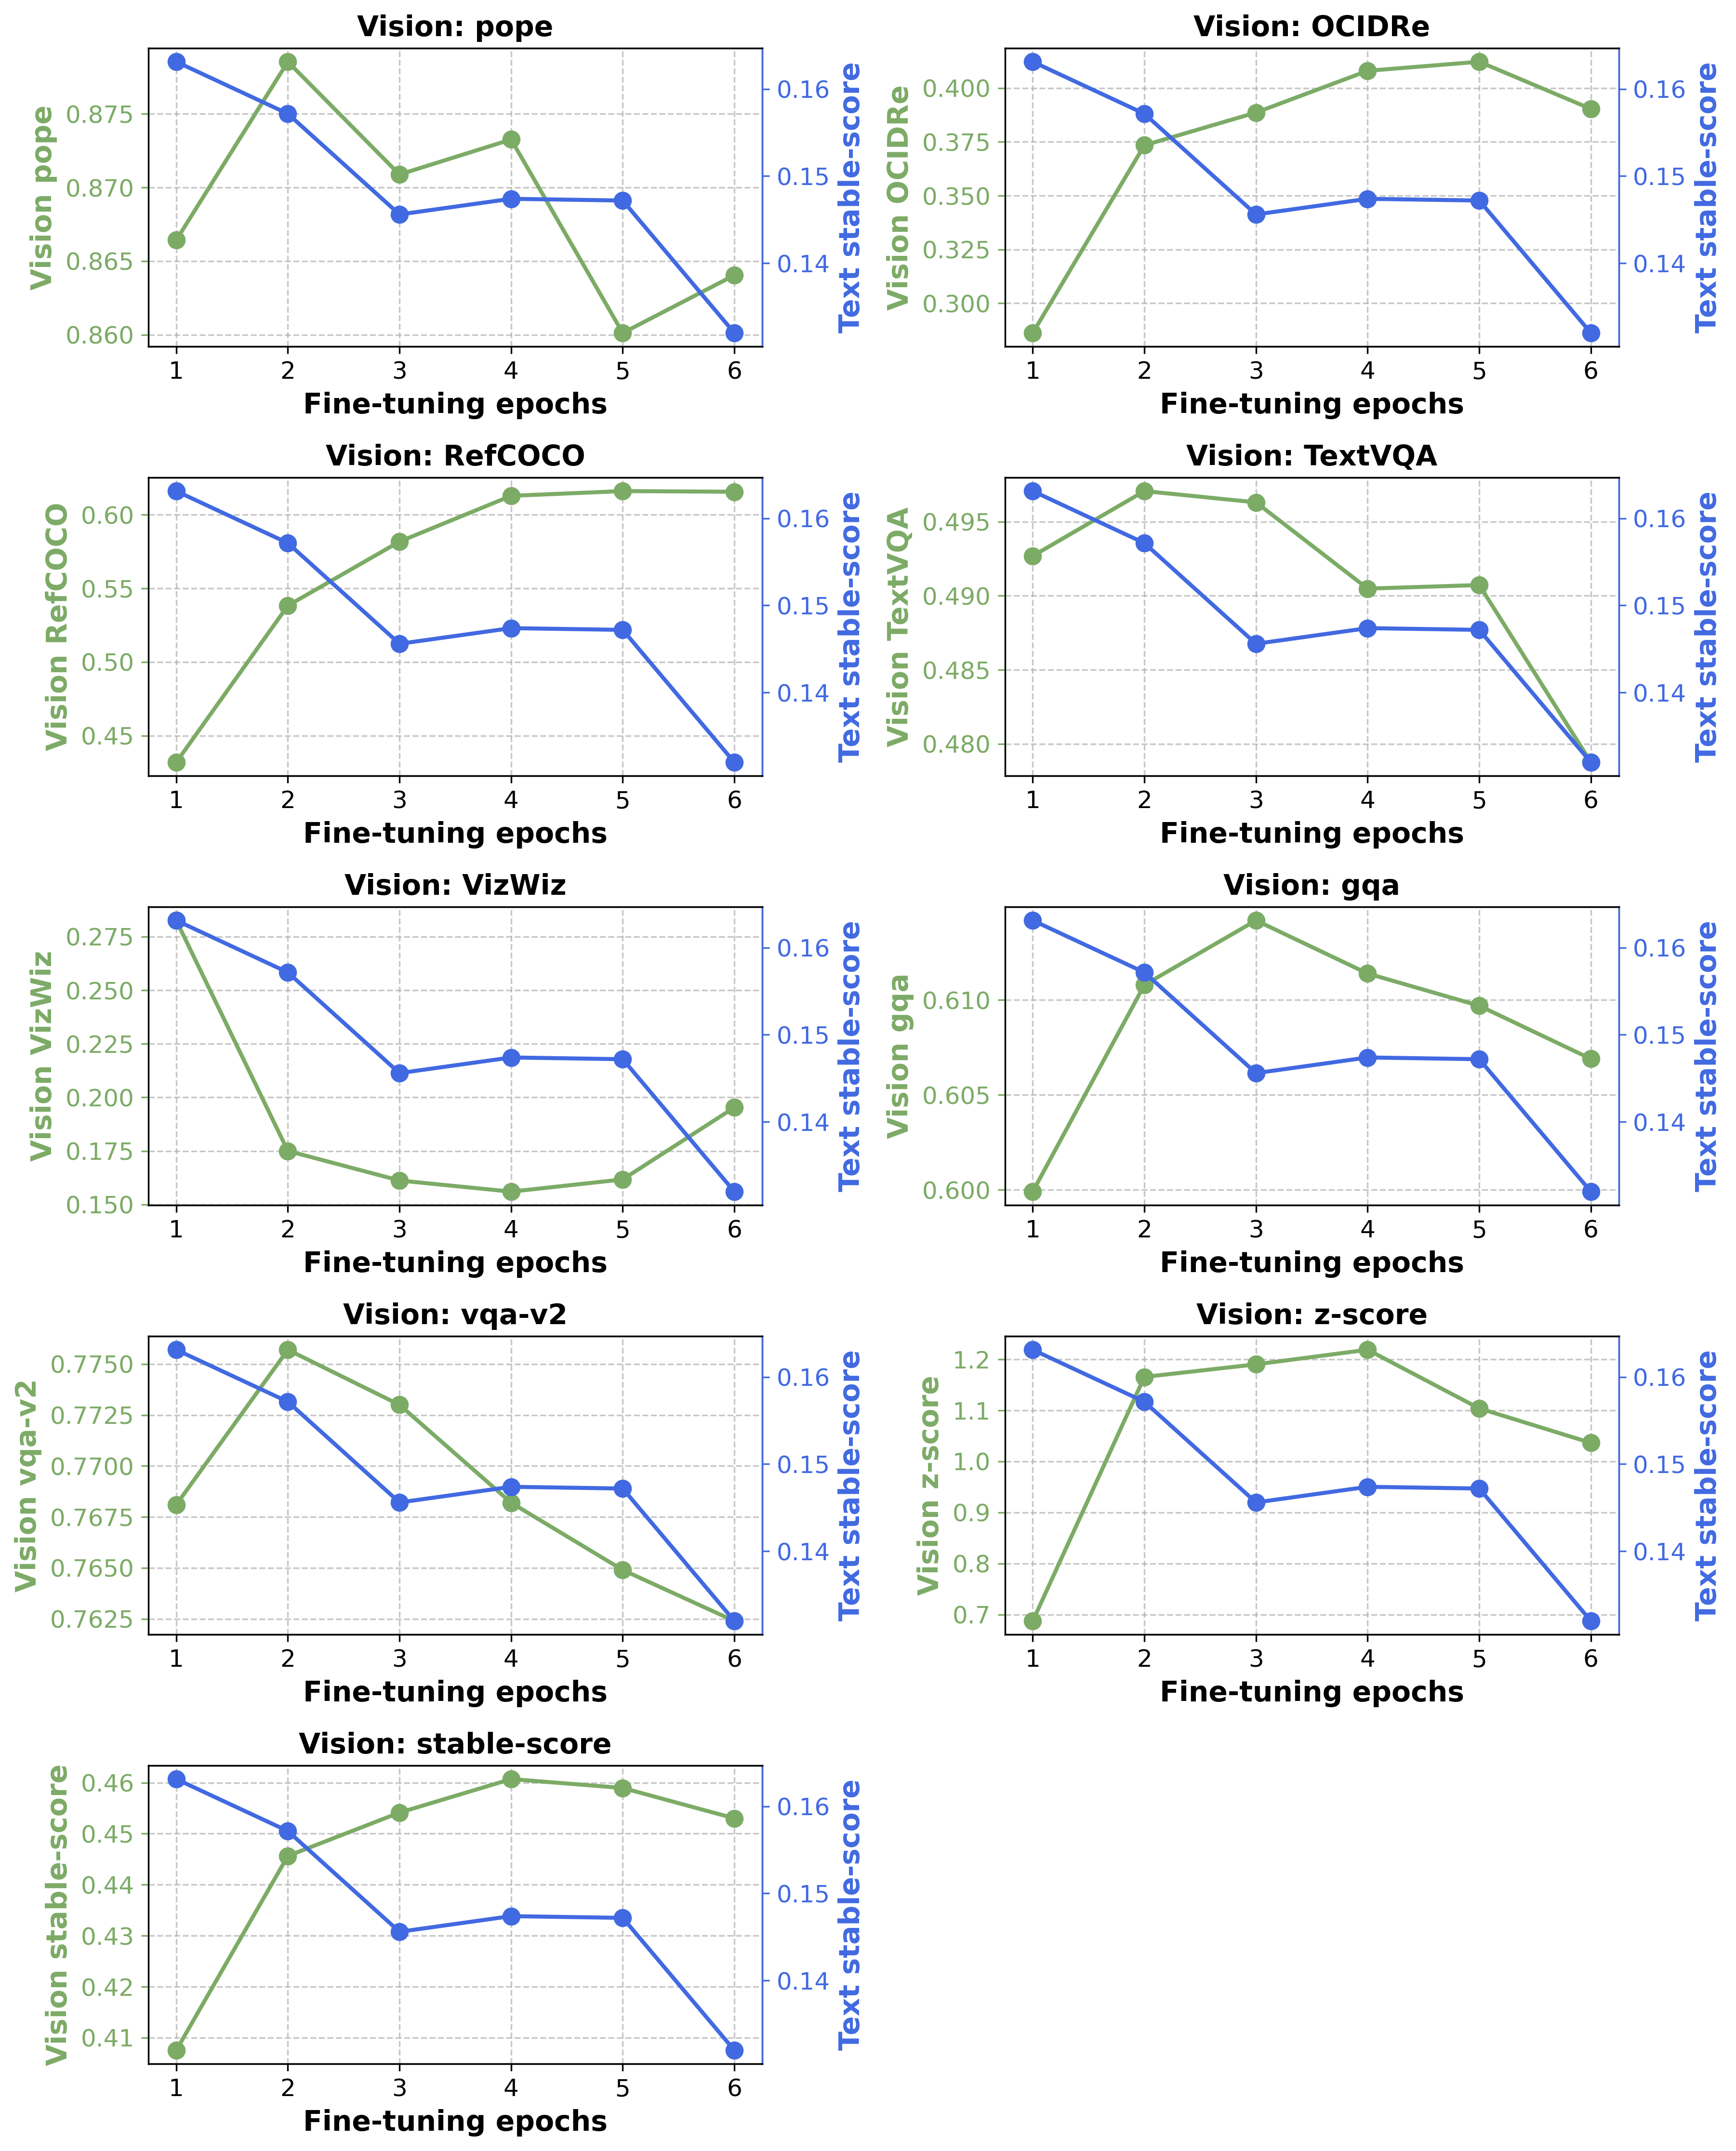
Vision scores improve through roughly four instruction-tuning epochs while text performance declines. Beyond four epochs, both deteriorate in the tested sweep. Figure 8 identifies about two epochs as a compromise when retaining text ability matters. The best individual vision-task epoch is not always the best aggregate epoch.
4 Related Work
Related work contrasts conventional post-language visual adaptation, early multimodal pretraining, and the data sources that make these recipes possible.
Two-stage VLMs.
LLaVA, Flamingo, BLIP, IDEFICS, Janus, and other systems adapt pretrained language models using different connectors, visual corpora, and instruction stages. These published systems motivate the comparison but are not all retrained under a common compute budget here. The original recipe-comparison table is retained.
Pre-training with visual data.
Early-fusion models and multimodal scaling studies show other ways to introduce vision, but some training recipes are undocumented or evaluated mainly through likelihood. This study emphasizes downstream task performance under controlled small-model variations, complementing those broader systems.
Datasets
Caption quality varies across internet sources, filtering pipelines, and model-generated recaptioning. The study uses DataCompDR for its main caption mixture and LLaVA-style curated/synthetic instruction data for finetuning. Interleaved datasets such as OBELICS and MINT-1T are discussed but not tested.
5 Conclusion
Intermediate-checkpoint multimodal continuation and moderate caption/text mixtures are useful choices in the studied regime. The practical result is to tune checkpoint timing, learning-rate continuation, mixture, and finetuning jointly. Limited scale coverage, single-image inputs, differing pretraining budgets, and text forgetting prevent treating the recipe as a universal optimum.
Appendix A Text-only pre-training hyperparameters
The language-model settings include an exploratory 79M model and a 1.4B model using OpenLM next-token prediction. Table 2 preserves layer counts, attention dimensions, batch sizes, learning rates, token budgets, and reported A100-hour estimates. Those costs describe the specified text-pretraining configurations rather than the cost of every multimodal run.
| Warmup | Learning rate | Batch size | Training tokens | A100 hours | |||||
|---|---|---|---|---|---|---|---|---|---|
| 79M | 8 | 4 | 512 | 128 | 400 | 3-3 | 512 | 237B | 1.2k |
| 1.4B | 24 | 16 | 2,048 | 128 | 5000 | 1-2 | 256 | 4.3T | 106k |
Appendix B Image-text pre-training hyperparameters
The image encoder feeds a two-layer GELU projection block that first expands its feature dimension and then maps to the language embedding size. Image patches condition autoregressive prediction but are excluded from the cross-entropy targets. This is image-conditioned text training rather than autoregressive image-token prediction.
Appendix C Image Encoding Implementation Details
An image precedes caption text with a separator, and its 729 embeddings are masked from the prediction loss. For instruction examples, system prompts and user questions are also masked, leaving assistant responses as targets. The architecture retains causal attention rather than a bidirectional PrefixLM image prefix.
Appendix D Fine-tuning hyperparameters
The instruction mixture contains about 665,000 examples. The listed main settings use learning rate 0.0003, warmup fraction 0.05, Adam second-moment coefficient 0.95, batch size 256, letterbox resizing, and four epochs. Other epoch counts belong to the explicit tuning sweeps.
Appendix E Evaluation benchmark descriptions
The benchmark appendix specifies the included tasks and explains exclusions. The six-task vision average and selected text suite should be interpreted in that scope.
VQA benchmarks:
Question-answering evaluations include VQAv2 for general visual questions, GQA for compositional/spatial questions, TextVQA for reading-related questions, and POPE for yes/no object-presence hallucination tests. Their accuracies measure different capabilities and have different chance baselines.
Object localisation benchmarks:
RefCOCO and OCID-Ref test referring-expression localization, including cluttered scenes. VizWiz is reported separately because the small model often mishandles its unanswerable-response convention, producing unstable exact-match scores. VSR, TallyQA, and AI2D are omitted as too difficult for the small-scale setup. These choices influence the aggregate trend.
Text benchmarks:
The text suite samples legal-style reasoning, science questions, conceptual combinations, causal and physical commonsense, sentence continuation, arithmetic questions, and biomedical question answering. Appendix E names BoolQ, while the later detailed results table instead includes BigBench CS alongside BigBench CC; the original listings and reported metrics are preserved without assuming identical task membership everywhere.
Appendix F Detailed results
Per-task plots show how checkpoint age, image ratio, instruction mixing, and finetuning affect each benchmark independently.
F.1 The impact of text-only pre-training
All plotted vision tasks except VizWiz favor the 80% language checkpoint in this sweep. The final-checkpoint points use a different learning-rate restart, so the detailed curves retain the same schedule confound as the aggregate result.
F.2 The impact of adding images before the end of pre-training
Most vision tasks benefit from image-caption continuation, but POPE and RefCOCO achieve their best plotted results without images in that phase. The favorable aggregate image-mixture result therefore does not mean every task improves.
F.3 The impact of finetuning on vision and text performance
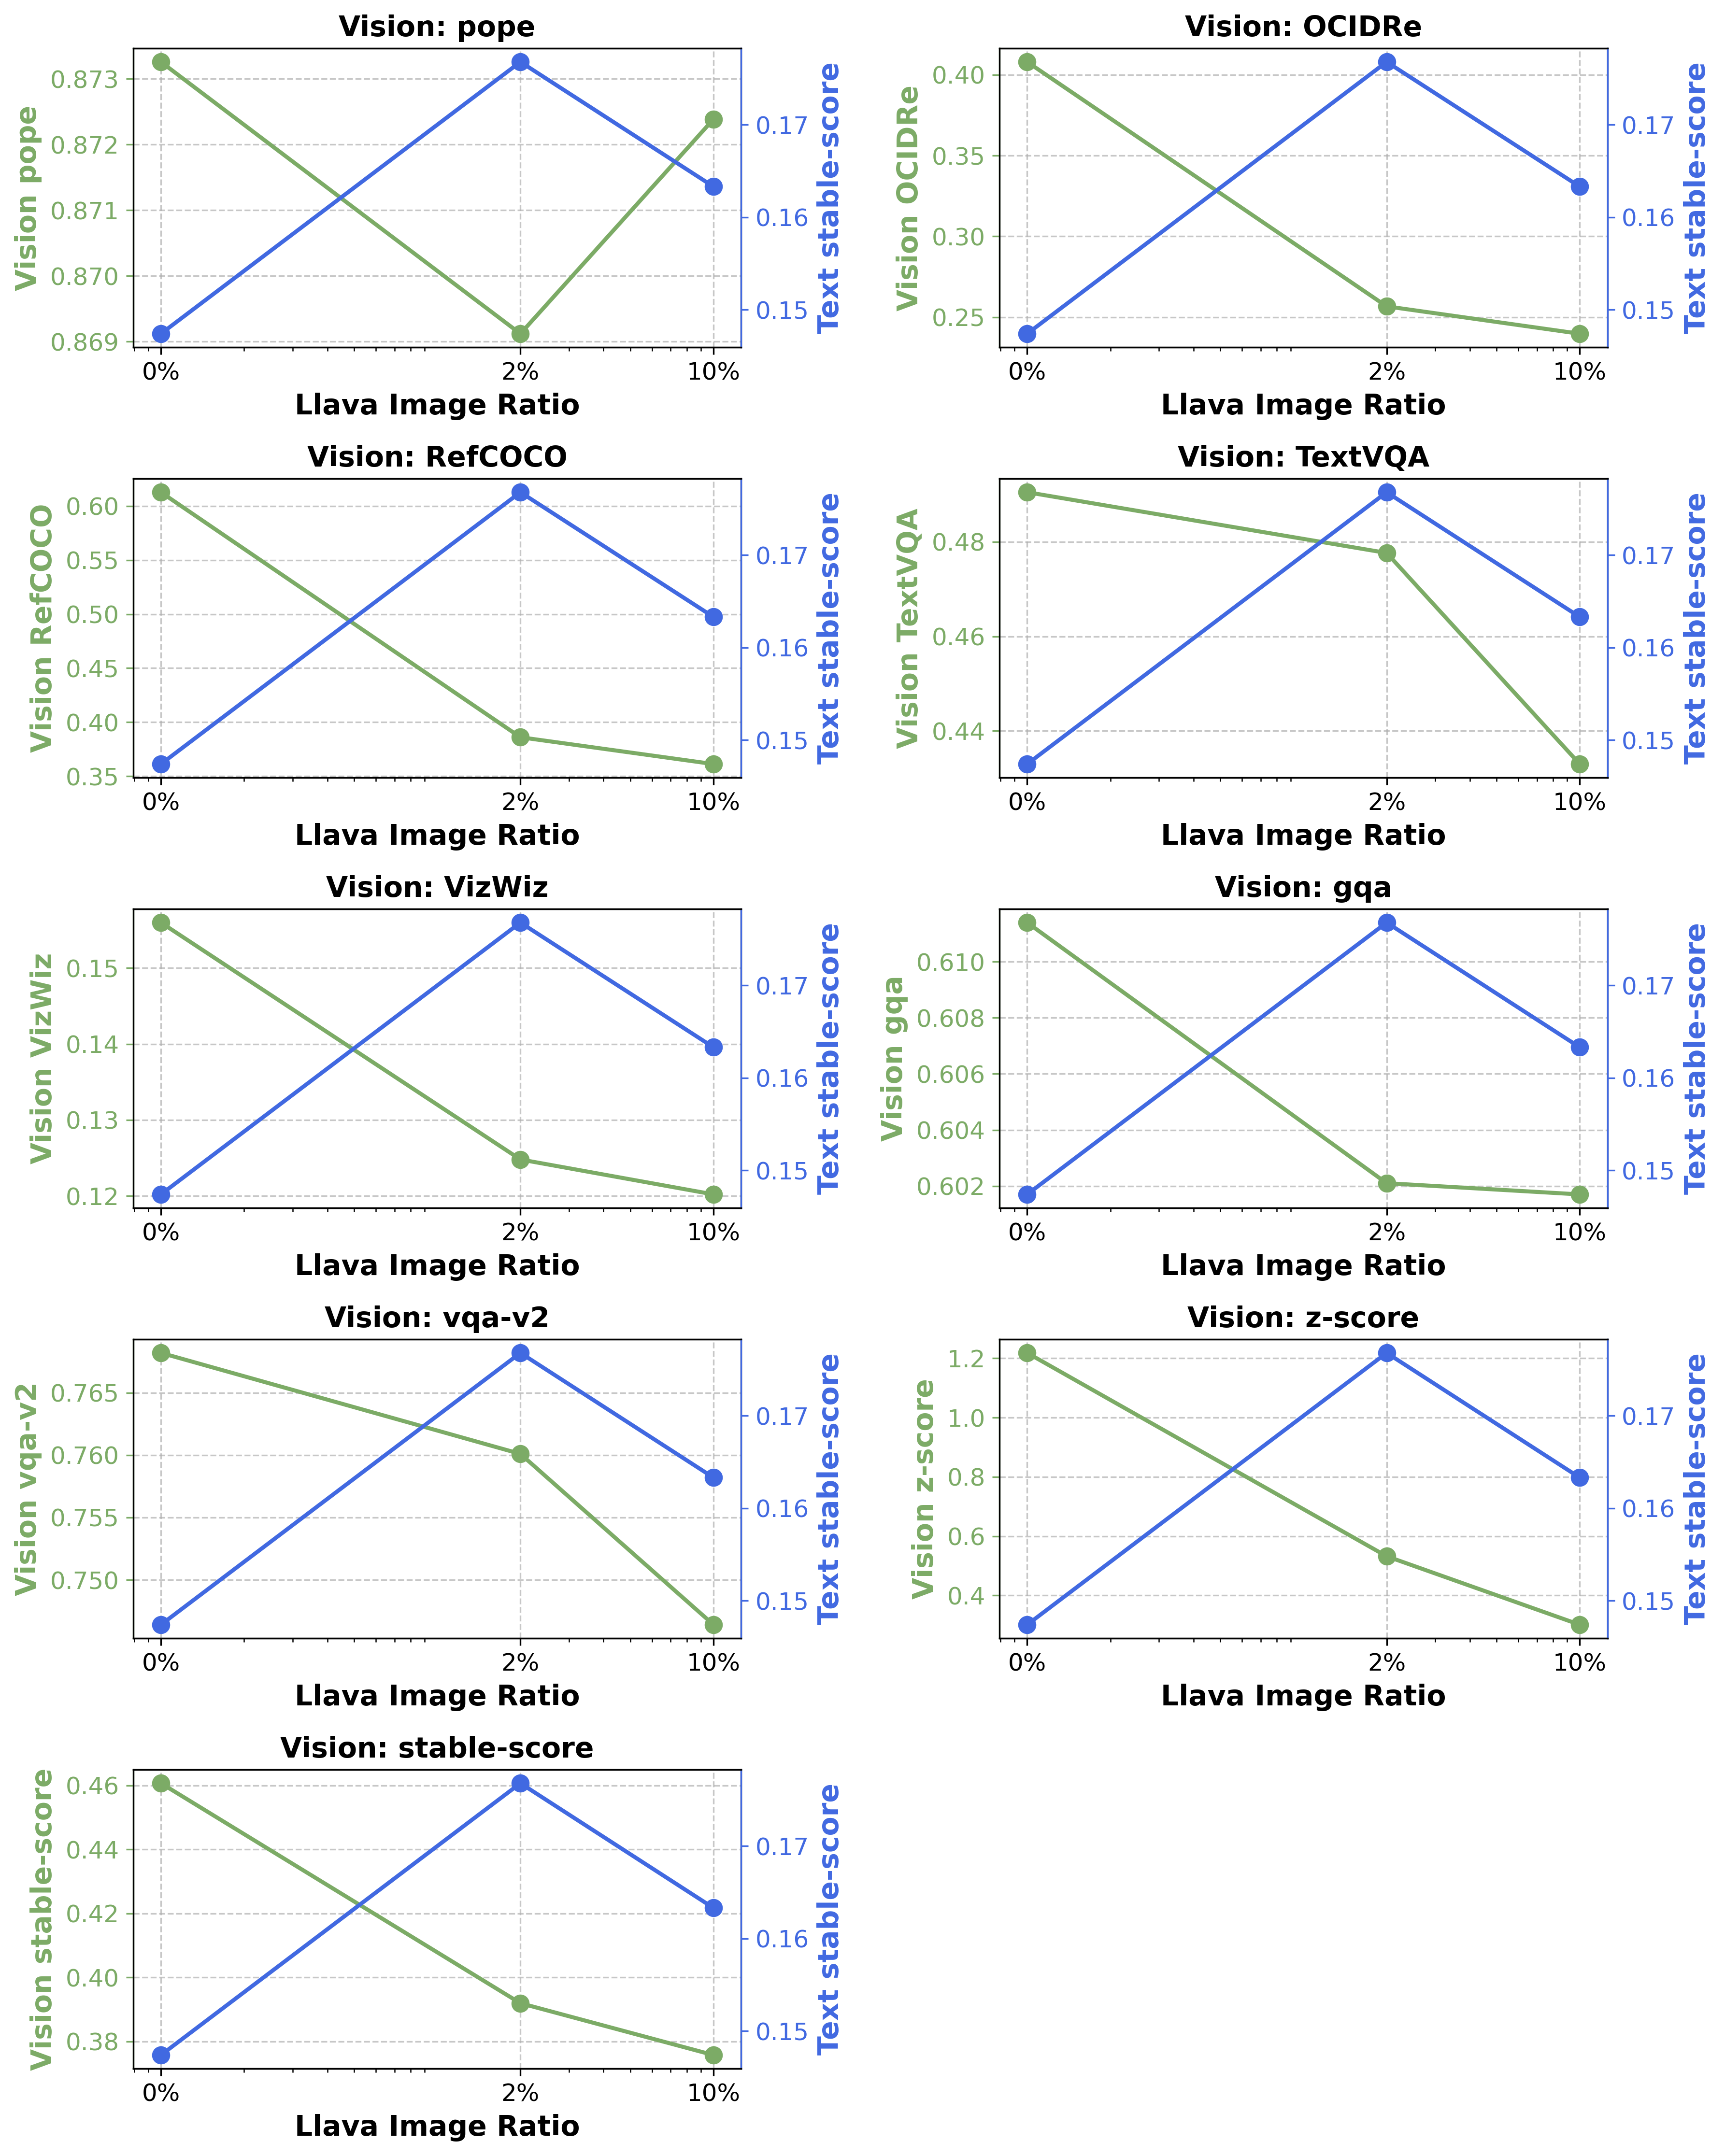
Localization tasks show clearer improvements with additional finetuning. VQAv2, GQA, TextVQA, and POPE peak before four epochs, though their four-epoch results are less than one percentage point below the individual maxima. Text performance still declines across the process.
F.4 The impact of adding images from the start when training from scratch
In the short from-scratch experiment, the best results occur without image data in the pretraining mixture, though differences can be small. Subsequent image instruction tuning still supplies vision supervision, so this is not an image-free final model.
F.5 The impact of instruction tuning data during pre-training
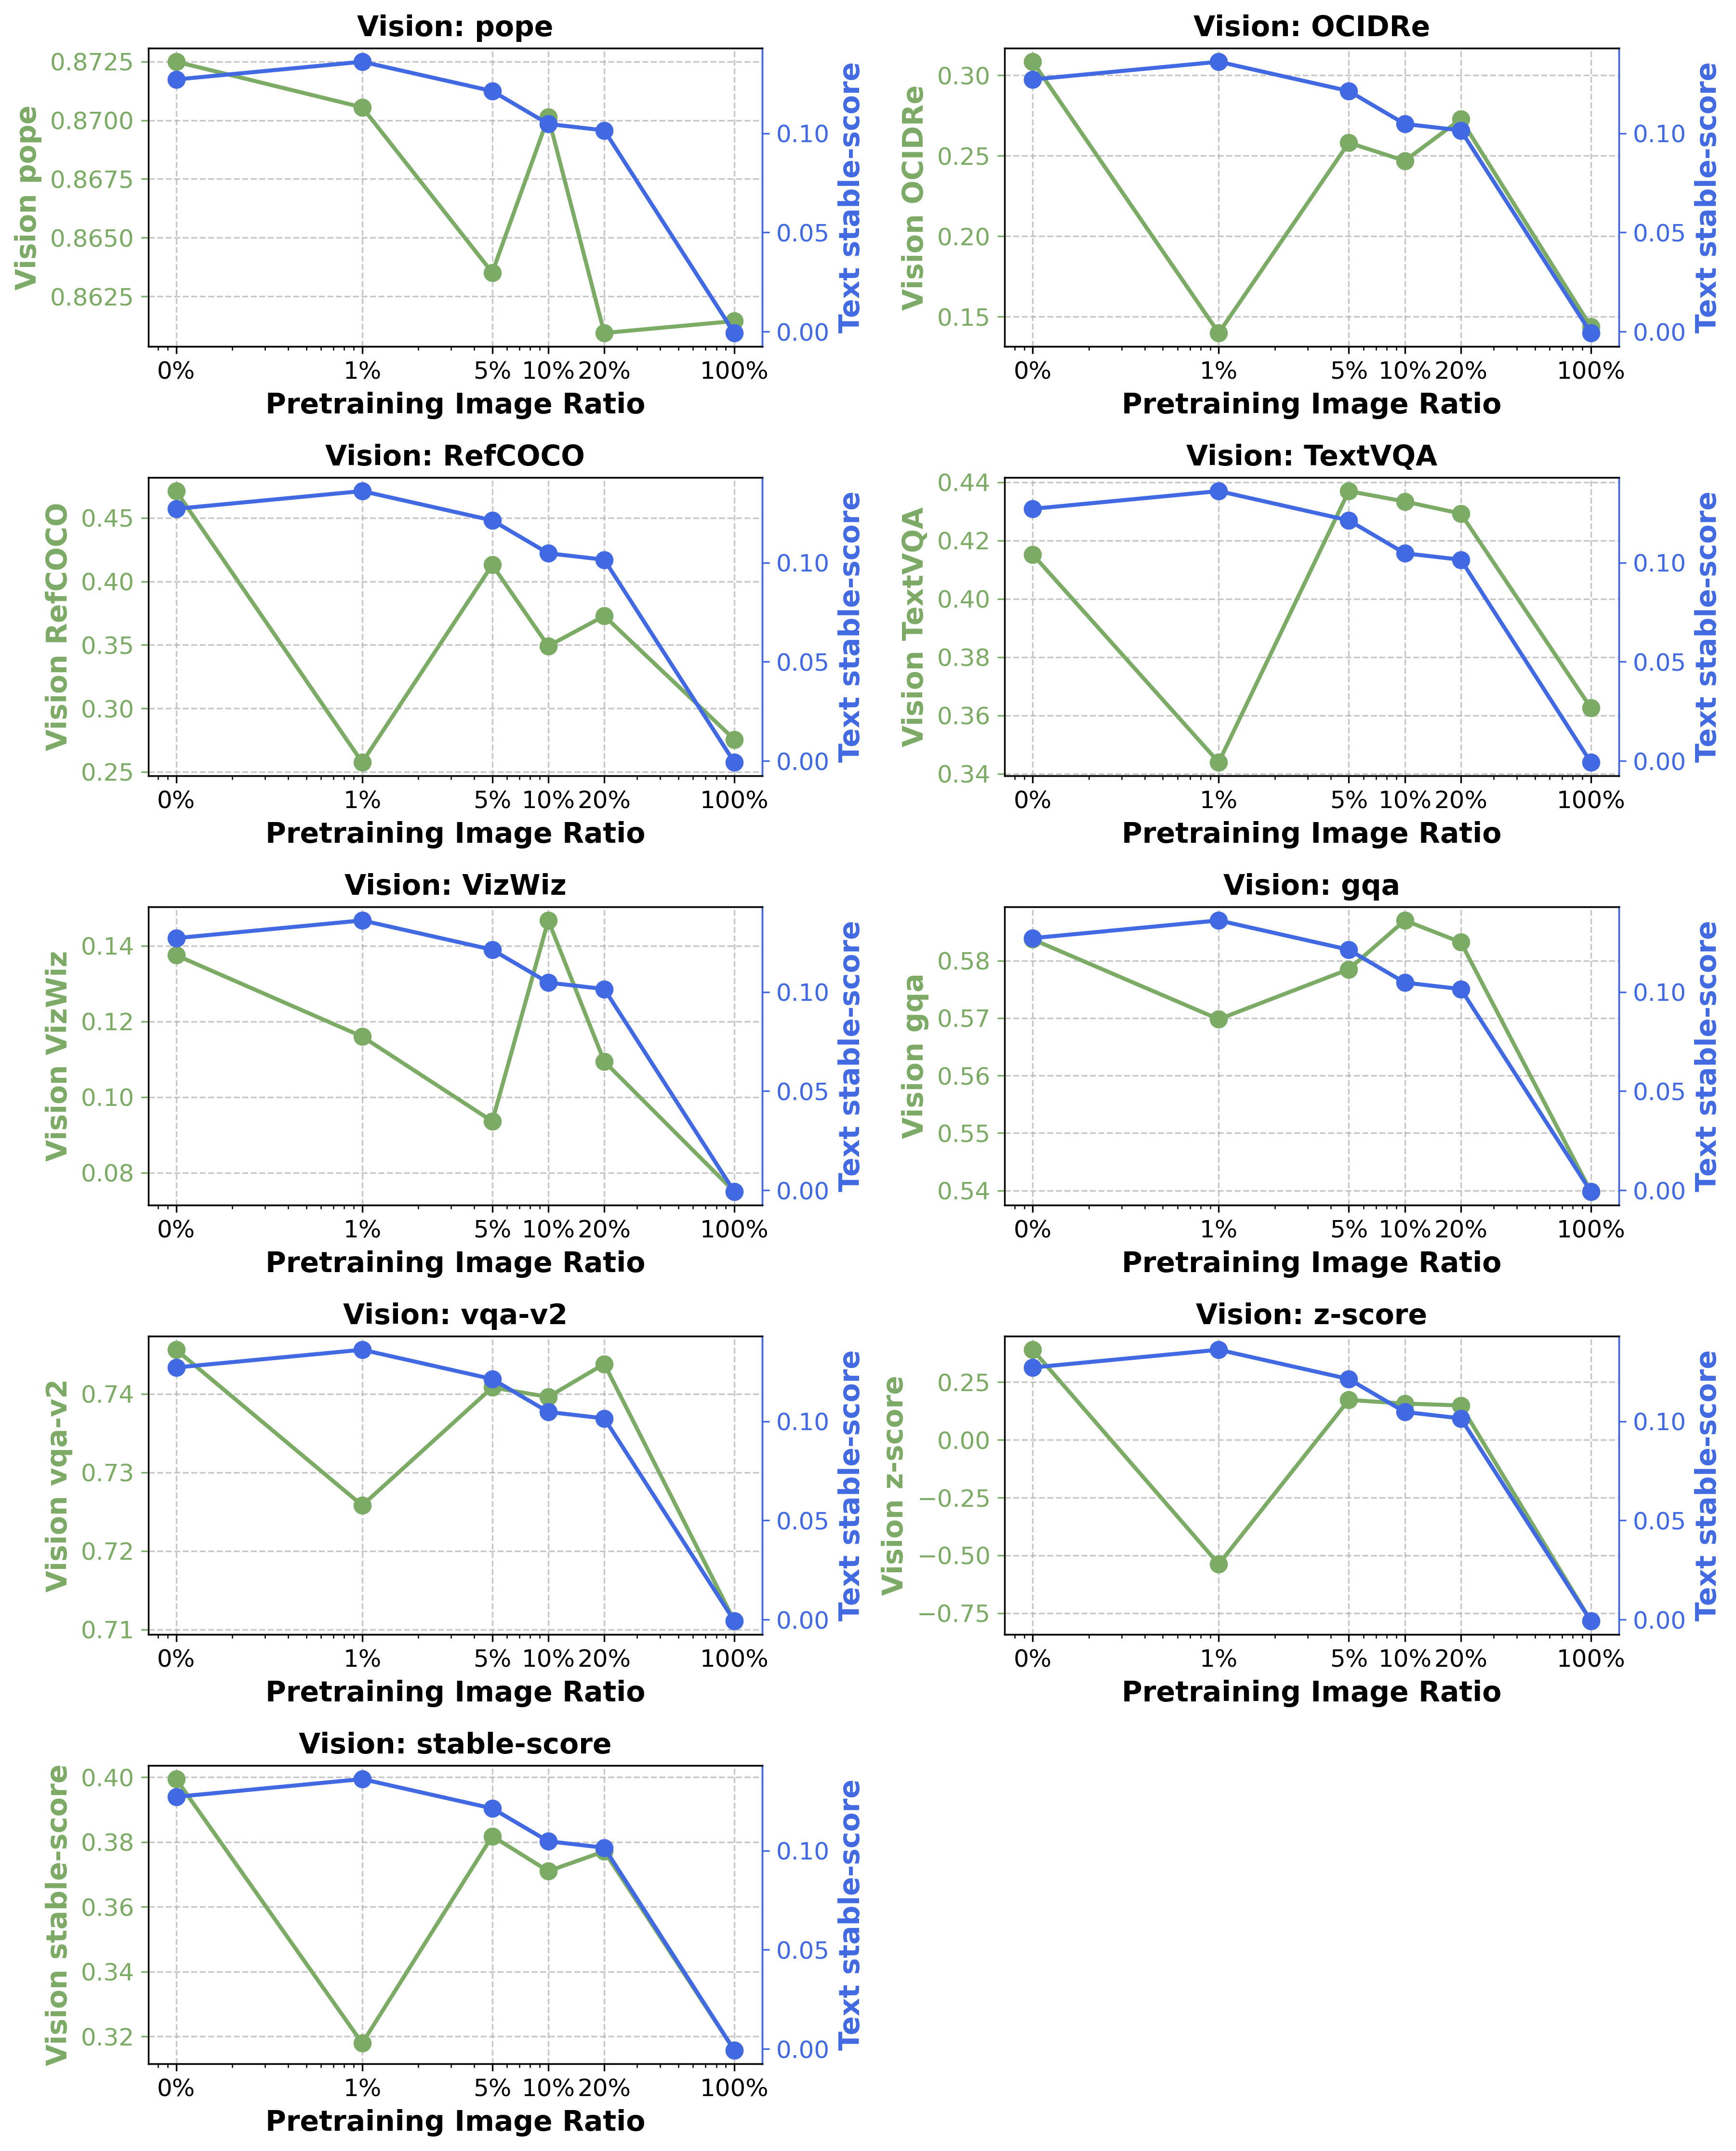
Replacing caption data with instruction data during continuation lowers all tested visual-question-answering results but improves the text aggregate. The proposed explanation is better familiarity with question answering; it is a hypothesis rather than an isolated causal measurement.
Appendix G Training for higher Chinchilla scales
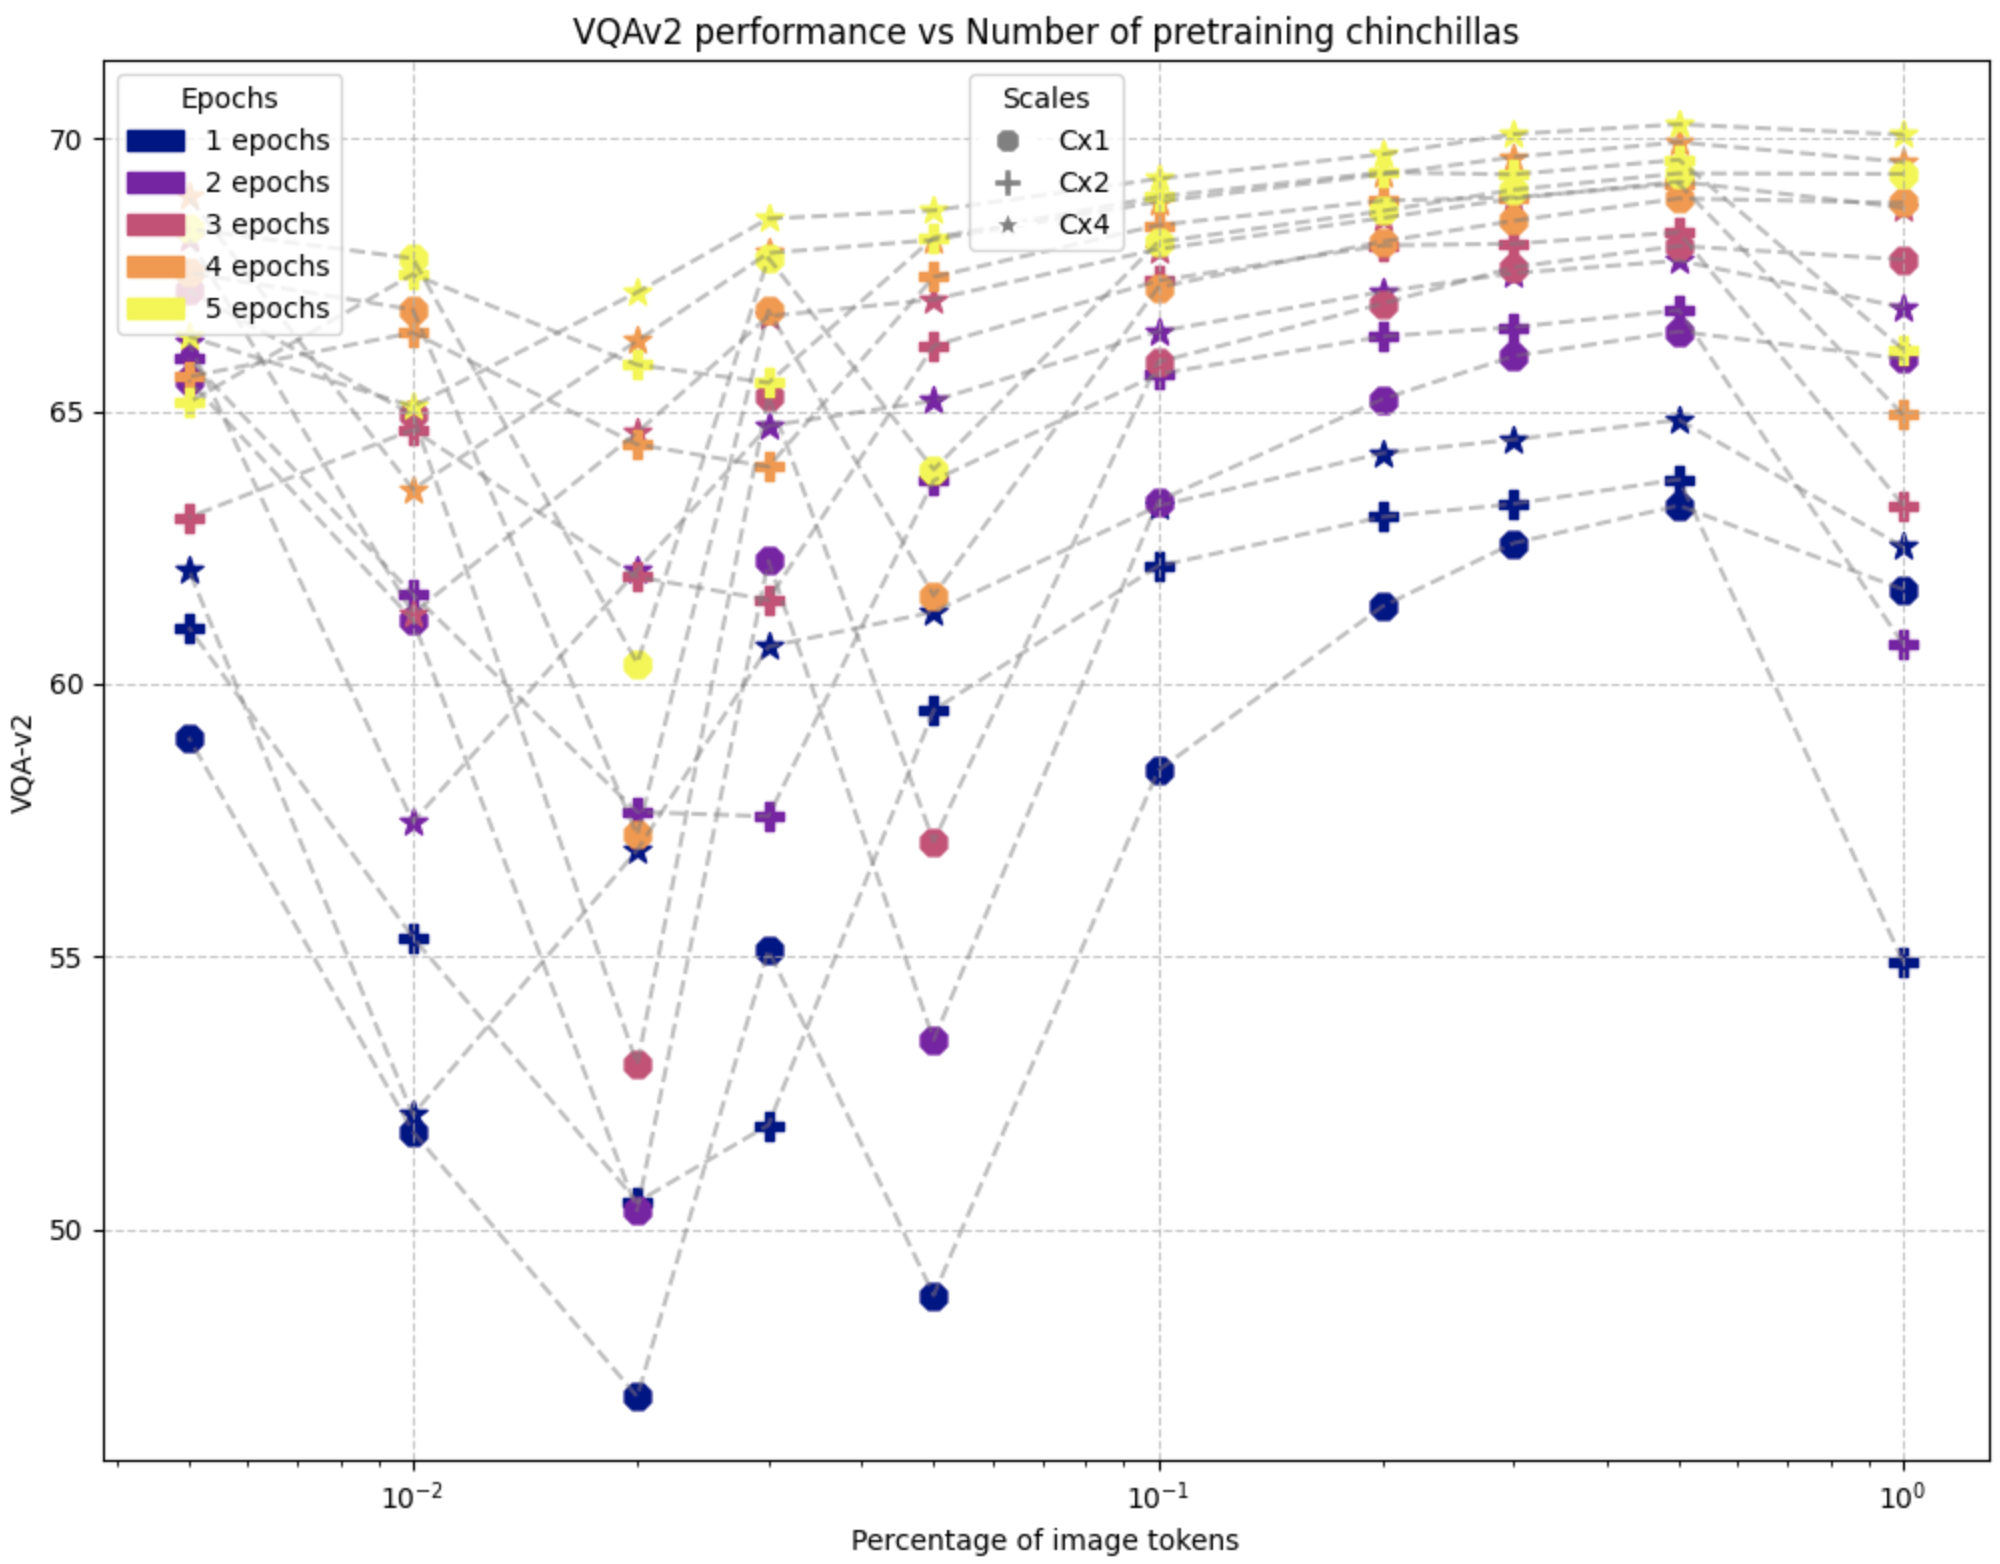
Exploratory 79M models trained at one, two, and four times the nominal compute-optimal token multiplier show broadly similar mixture trends. This extends the small-model evidence only; equivalent high-multiplier sweeps are not run for the 1.4B models.
Appendix H Larger model scales (7B)
The 7B check uses the available 2.3-trillion-token intermediate checkpoint from a planned 4.3-trillion-token schedule, since later intermediate checkpoints do not exist. One model receives 140 billion mixed tokens at 90:10 text/image before finetuning. The comparison starts from a checkpoint that has already undergone an additional 270-billion-token text cooldown, receives 140 billion further text tokens, and then finetunes.
The mixed recipe improves VQAv2 from 74.69 to 76.39 and most other listed vision metrics, while VizWiz is worse. The table mixes percentage and fractional units across rows, which are preserved. This is supportive evidence for the recipe but not a clean test of 80% timing at 7B: prior cooldown history and whether the added stage contains images also differ.
| Dataset | Model 1 (with image data in pre-training) | Model 2 (no image data in pre-training) |
| VQAv2 | 76.39 | 74.69 |
| GQA | 61.08 | 60.6 |
| VizWiz | 10.88 | 11.69 |
| TextVQA | 0.46828 | 0.41624 |
| RefCOCO | 0.64168 | 0.58889 |
| OCID | 0.46107 | 0.39696 |
| POPE | 0.87478 | 0.87113 |
Appendix I What do the results look like if we unfreeze all the weights?
The freezing ablation is internally contradictory. Its prose and caption say unfreezing performs worse, but Table 4 labels frozen=yes rows with VQAv2 scores 58.71/60.22/60.85 and frozen=no rows with higher scores 68.55/69.42/71.0 at the three ratios. The main experiments do freeze the encoder, but this table cannot establish the claimed advantage without resolving its labels or prose. No silent correction is made.
| Checkpoint | Frozen? | Text-Image Ratio | VQA-v2 score |
|---|---|---|---|
| 80% | yes | 5% | 58.71 |
| 80% | yes | 30% | 60.22 |
| 80% | yes | 50% | 60.85 |
| 80% | no | 5% | 68.55 |
| 80% | no | 30% | 69.42 |
| 80% | no | 50% | 71.0 |
Appendix J Ablations
Additional ablations select the main caption dataset and image encoder; these are local recipe comparisons rather than broad model rankings.
J.1 Effect of Image Dataset
DataCompDR yields vision/text stable scores 0.4607/0.1503, compared with DataComp’s 0.4603/0.1168, CC12M’s 0.4556/0.1298, and Shutterstock’s 0.4518/0.1310. The vision difference between the two DataComp variants is very small, while the text difference is larger.
J.2 Effect of Image Encoder
Adding DINO to SigLIP raises vision stable score from 0.4607 to 0.4696 but lowers text score from 0.1503 to 0.1347. A simple patch projection performs much worse visually, 0.1564. The main recipe chooses SigLIP for simplicity and its text/vision balance; the result does not show every stronger vision encoder necessarily improves the joint system.
Appendix K Random Seeds
Two random seeds are compared for selected 20%-checkpoint runs at 1%, 5%, and 10% image ratios and one or two finetuning epochs. VQAv2 differences are small in those cases, reaching 0.63 percentage points at the most variable listed setting. This limited check does not provide uncertainty estimates for every model or aggregate result in the study.
| Random Seed | Image Ratio | FT epochs | VQA-v2 score |
|---|---|---|---|
| 7 | 1% | 1 | 73.83 |
| 7 | 1% | 2 | 75.39 |
| 7 | 5% | 1 | 75.36 |
| 7 | 5% | 2 | 76.39 |
| 7 | 10% | 1 | 75.39 |
| 7 | 10% | 2 | 76.5 |
| 365 | 1% | 1 | 74.46 |
| 365 | 1% | 2 | 75.9 |
| 365 | 5% | 1 | 75.39 |
| 365 | 5% | 2 | 76.47 |
| 365 | 10% | 1 | 75.55 |
| 365 | 10% | 2 | 76.58 |
Appendix L Limitations and Future Work
Untested directions include interleaved images, higher token multipliers at larger scale, broader multimodal scaling laws, resolution schedules, and PrefixLM attention. The strong differences between 79M and 1.4B behavior already indicate that mixture choices depend on scale and prior language training. Compute limits restrict the search space.
Appendix M Benchmark Results
The detailed text table shows substantial losses through visual adaptation: stable score falls from 25.73 for the 80% language checkpoint to 21.26 before instruction finetuning and 15.44 afterward. ARC Easy falls from 74.7 to 72.3 to 59.3, and PubMedQA from 66.2 to 38.6 to 35.0; AGIEval instead improves. Thus preserving text performance is a relative recipe objective, not a demonstration that the final VLM retains its base language model’s abilities unchanged. External qualitative samples are linked by the source but are not a substitute for these metrics.
| Metric | Ours | Ours (No FT) | Base 80% | Base 100% | LLaMA 3.2 1B | Qwen 2.5 1.5B |
|---|---|---|---|---|---|---|
| AGIEval | 32.5 | 27.7 | 19.4 | 28.2 | 21.4 | 63.6 |
| ARC Easy | 59.3 | 72.3 | 74.7 | 77.1 | 69.5 | 80.6 |
| BigBench CC | 27.2 | 30.1 | 40.8 | 47.6 | 27.2 | 57.3 |
| BigBench CS | 35.8 | 46.2 | 44.6 | 46.7 | 46.5 | 56.5 |
| COPA | 71.0 | 83.0 | 86.0 | 92.0 | 83.0 | 85.0 |
| HellaSwag | 58.2 | 66.5 | 69.2 | 72.8 | 65.1 | 67.78 |
| MathQA | 22.9 | 25.9 | 26.9 | 27.3 | 30.52 | 40.84 |
| PIQA | 70.5 | 74.4 | 76.6 | 79.1 | 76.0 | 76.22 |
| PubMedQA | 35.0 | 38.6 | 66.2 | 69.6 | 65.8 | 66.6 |
| Stable-Score | 15.44 | 21.26 | 25.73 | 29.67 | 23.52 | 35.68 |
Appendix N Comparison with Prior SOTA Models
The final model trails the larger Prismatic 7B and PaliGemma 3B systems on most listed vision tasks, while its POPE score is slightly above PaliGemma’s. The comparison has different model sizes and training recipes and is included for context, not to claim state-of-the-art performance. Qwen evaluation is described as planned rather than an available result.
| Metric | Ours | Prismatic 7B | PaliGemma 3B |
|---|---|---|---|
| TextVQA | 49.05 | 51.78 | 73.2 0.2 |
| RefCOCO | 61.29 | 73.62 | 77.9 0.1 |
| POPE | 87.33 | 88.28 | 87.0 |
| GQA | 61.11 | 64.16 | 67.0 0.3 |
| VQAv2 | 76.82 | 79.05 | 85.6 0.2 |
| OCID | 40.80 | 50.56 | N/A |
| Stable Score (No OCID) | 47.13 | 51.38 | 58.14 |
| Stable Score (With OCID) | 46.08 | 51.25 | N/A |