Overview
MOMA-QA pairs entity-specific video questions with scene graphs and time intervals. This edition includes the main dataset/model study and all four supplementary sections on graph prediction, answer scoring, training, and attention-mask ablation.
At a glance
MOMA-QA tests video question answering with explicit time intervals, object relationships, and queries about a highlighted person. It derives 300,791 question–answer pairs from MOMA’s human scene graphs, including videos augmented with actor outlines.
SGVLM predicts scene relationships, retrieves relevant frames, and passes separate scene and visual representations to a language model. Fine-tuning improves overall MOMA-QA accuracy from SeViLA’s 77.19% to 79.66%. Results support the value of structured supervision, while zero-shot relationship accuracy remains only 13.03% and gains are not uniform across external benchmarks.
1 Introduction
A correct video answer can require identifying both when an event occurs and which of several similar people or objects the question concerns. Many earlier datasets emphasize short clips, coarse actions, or temporal reasoning without human scene-relationship annotations.
MOMA-QA builds on MOMA to supply question-specific time intervals and frame-level scene graphs. Relationship questions comprise 71.6% of the dataset. Visual outlines identify the target actor in crowded scenes without giving the answering model numerical box coordinates.
The accompanying SGVLM architecture makes spatial relationships and frame selection explicit intermediate representations. These can help diagnose mistakes; the examples do not establish that a predicted graph is a complete causal explanation of a language model’s answer.
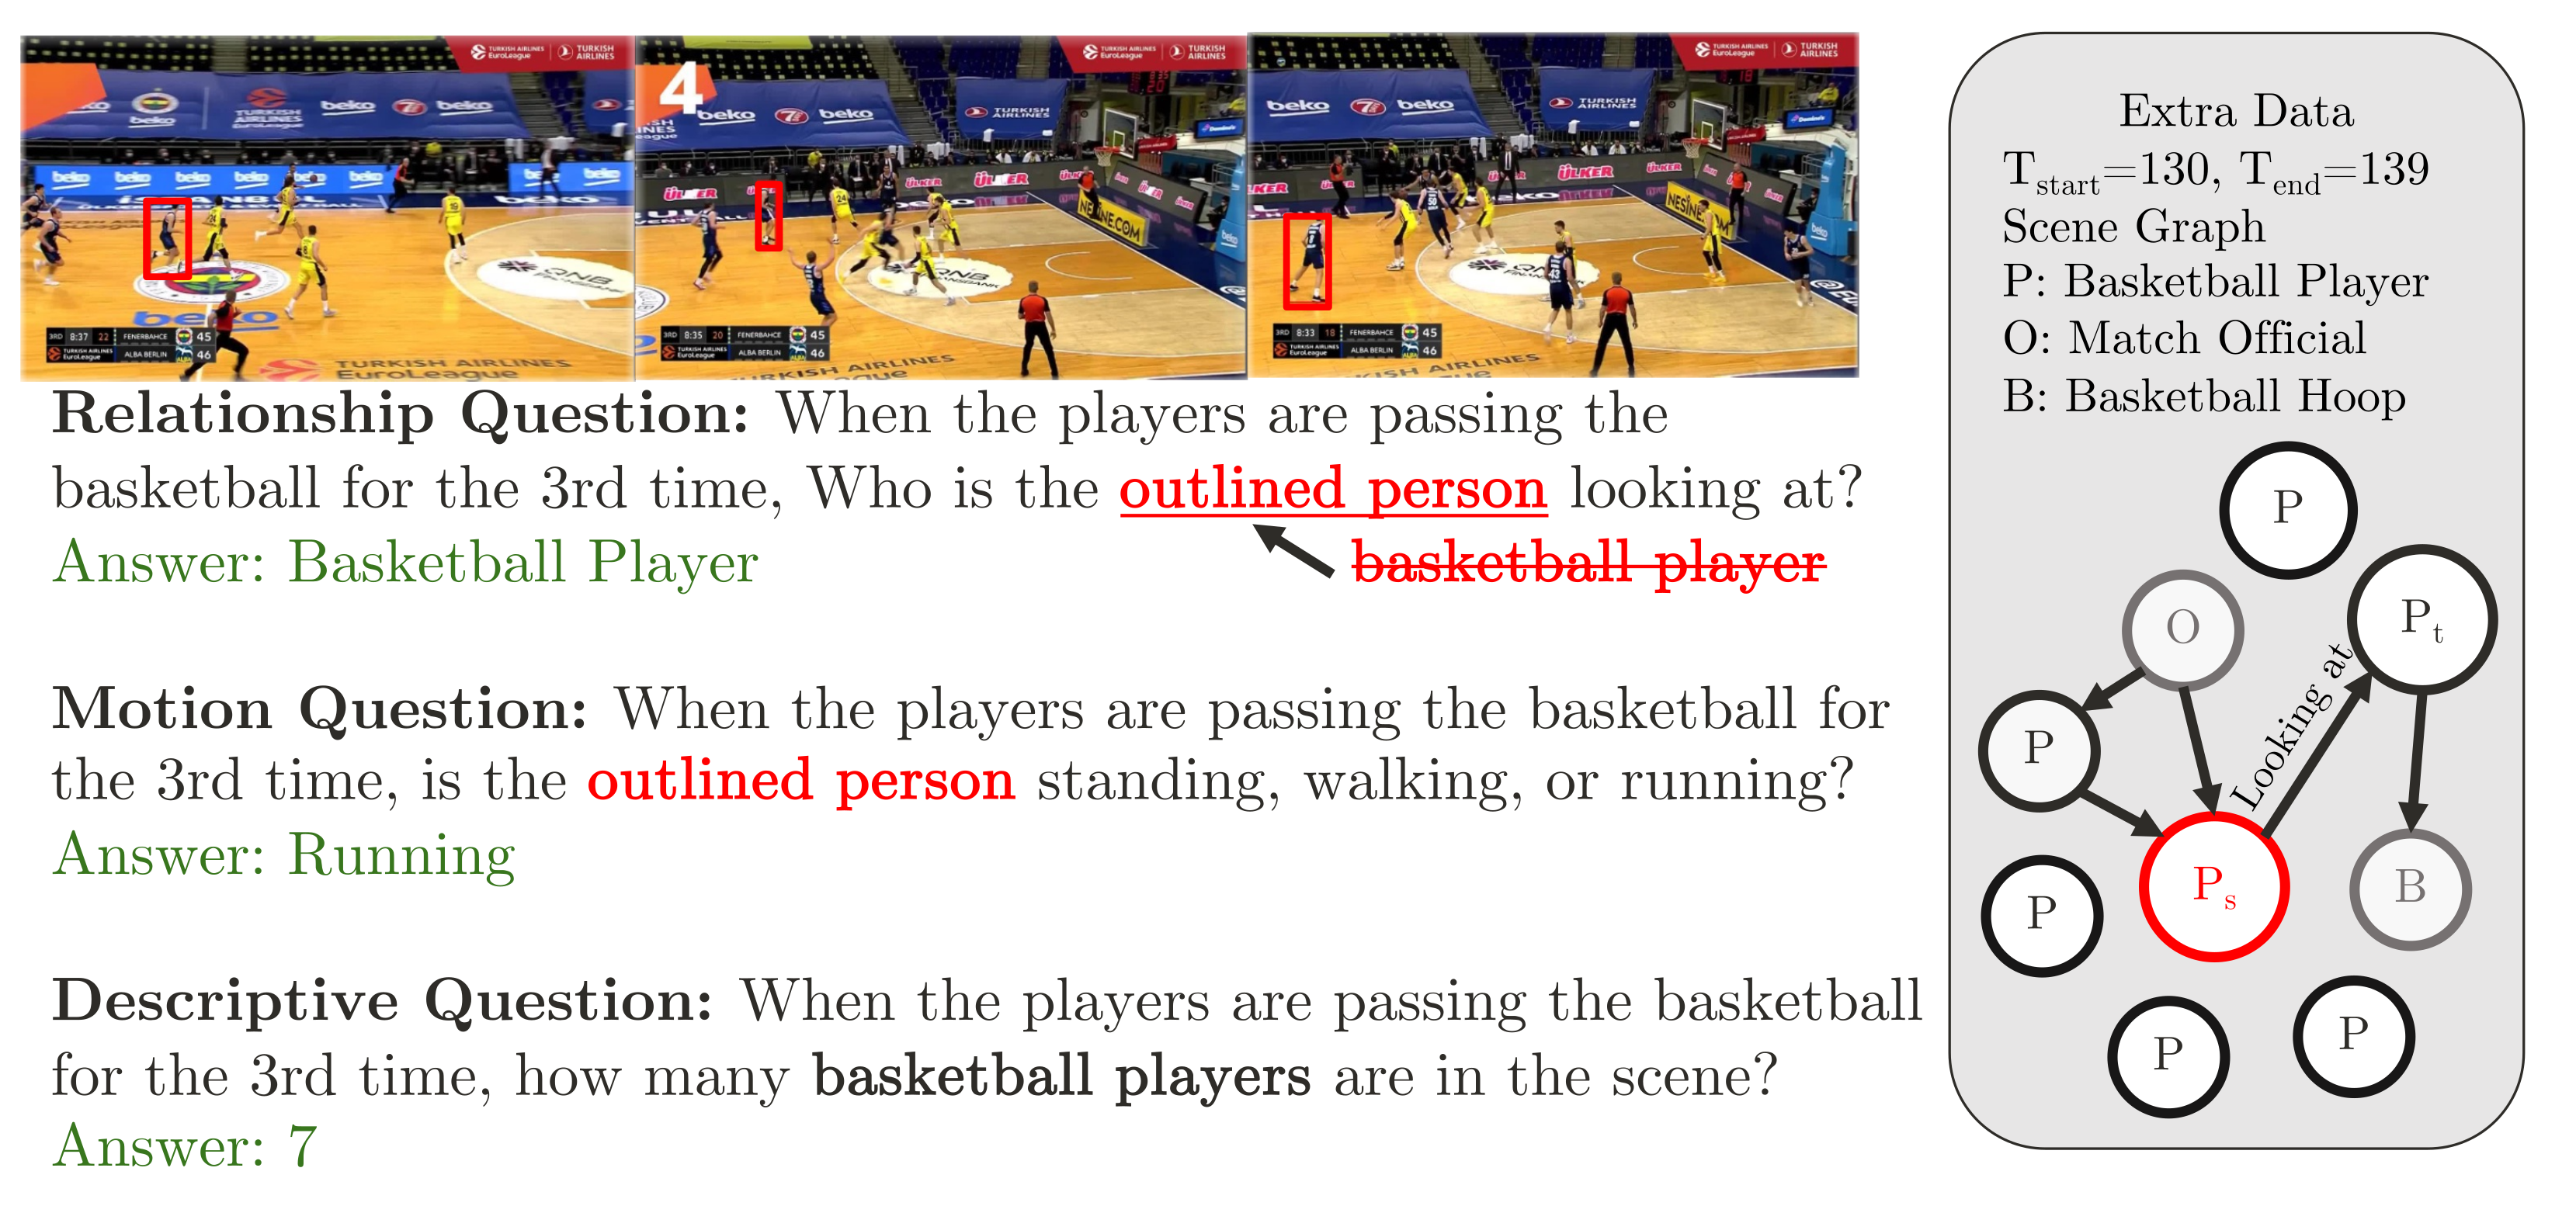
| Category | Question Format | Answer Format | Example Question | Example Answer |
| Relationship | When , what is ? | When the players are passing the basketball for the 3rd time, Who is the outlined person looking at? | Basketball Player | |
| Motion | When , is standing, walking or running? | [Att()] | When the players are passing the basketball for the 3rd time, is the outlined person standing, walking, or running? | Running |
| Description | When , how many [Identity] are in the scene? | [Id. Count] | When the players are passing the basketball for the 3rd time, how many basketball players are in the scene? | 7 |
2 Related Works
Earlier benchmarks span short-clip QA, temporal reasoning, long-video understanding, and entity grounding. The retained comparison table distinguishes video length, answer format, boxes, and scene annotations. Its temporal-localization checkmarks should not be read as equivalent annotation quality across datasets.
Graph-based models encode relations among objects, while language-model approaches such as SeViLA select a small number of informative frames to meet input limits. SGVLM combines both approaches, using Neural Motifs for scene structure and UniVTG for temporal grounding.
| Dataset | Video Source | #Videos |
#QA
Pairs
|
Average
Length (s)
|
Open
Ended
|
Temporal
Localization
|
Bounding Box
Augmentation
|
Scene Graph
Annotation
|
| MSVD-QA [52] | MSVD | ✓ | ✗ | ✗ | ✗ | |||
| MSRVTT-QA [52] | MSRVTT | ✓ | ✗ | ✗ | ✗ | |||
| TGIF-QA [11] | TGIF | ✓ | ✓ | ✗ | ✗ | |||
| TVQA [16] | TV Show | ✗ | ✓ | ✗ | ✗ | |||
| ActivityNet-QA [57] | ActivityNet | ✓ | ✓ | ✗ | ✗ | |||
| Social-IQ [58] | YouTube | ✗ | ✗ | ✗ | ✗ | |||
| EgoSchema [27] | Ego4D | ✗ | ✗ | ✗ | ✗ | |||
| NExT-QA [51] | YFCC-100M | ✓ | ✓ | ✗ | ✗ | |||
| STAR [49] | Charades | ✗ | ✓ | ✗ | ||||
| TVQA+ [17] | TV Show | ✓ | ✓ | ✓ | ✗ | |||
| MOMA-QA (Raw only) | MOMA | ✓ | ✓ | ✗ | ✓ | |||
| MOMA-QA (Aug.) | MOMA | ✓ | ✓ | ✓ | ✓ |
3 MOMA-QA Dataset
Dataset construction uses MOMA’s existing video-wise training, validation, and test split. Questions and outlined variants derive from the same source videos; the augmented-video count represents edited versions rather than that many independent recordings.
3.1 Annotations
Each annotated frame has a graph whose nodes are entities with boxes and attributes, and whose edges describe relationships. Consecutive frames belong to labeled sub-activities with start and end times. These annotations support both question generation and intermediate scene/temporal supervision.
3.2 Bounding Box Augmentations
Bounding-box augmentation edits a video to outline the actor named by a question. Replacing an identity such as “basketball player” with “outlined person” reduces linguistic hints and resolves which actor is meant. The models see the modified pixels, not the ground-truth box coordinates as an additional QA input.
3.3 Questions
Templates generate relationship, motion, and descriptive questions tied to a particular sub-activity, as retained in Table 1. The paper reports manual verification of each question and wording adjustments. Every question has temporal-interval and scene-graph annotations; the paper does not quantify annotator agreement or template-related answer biases.
3.4 Dataset Statistics
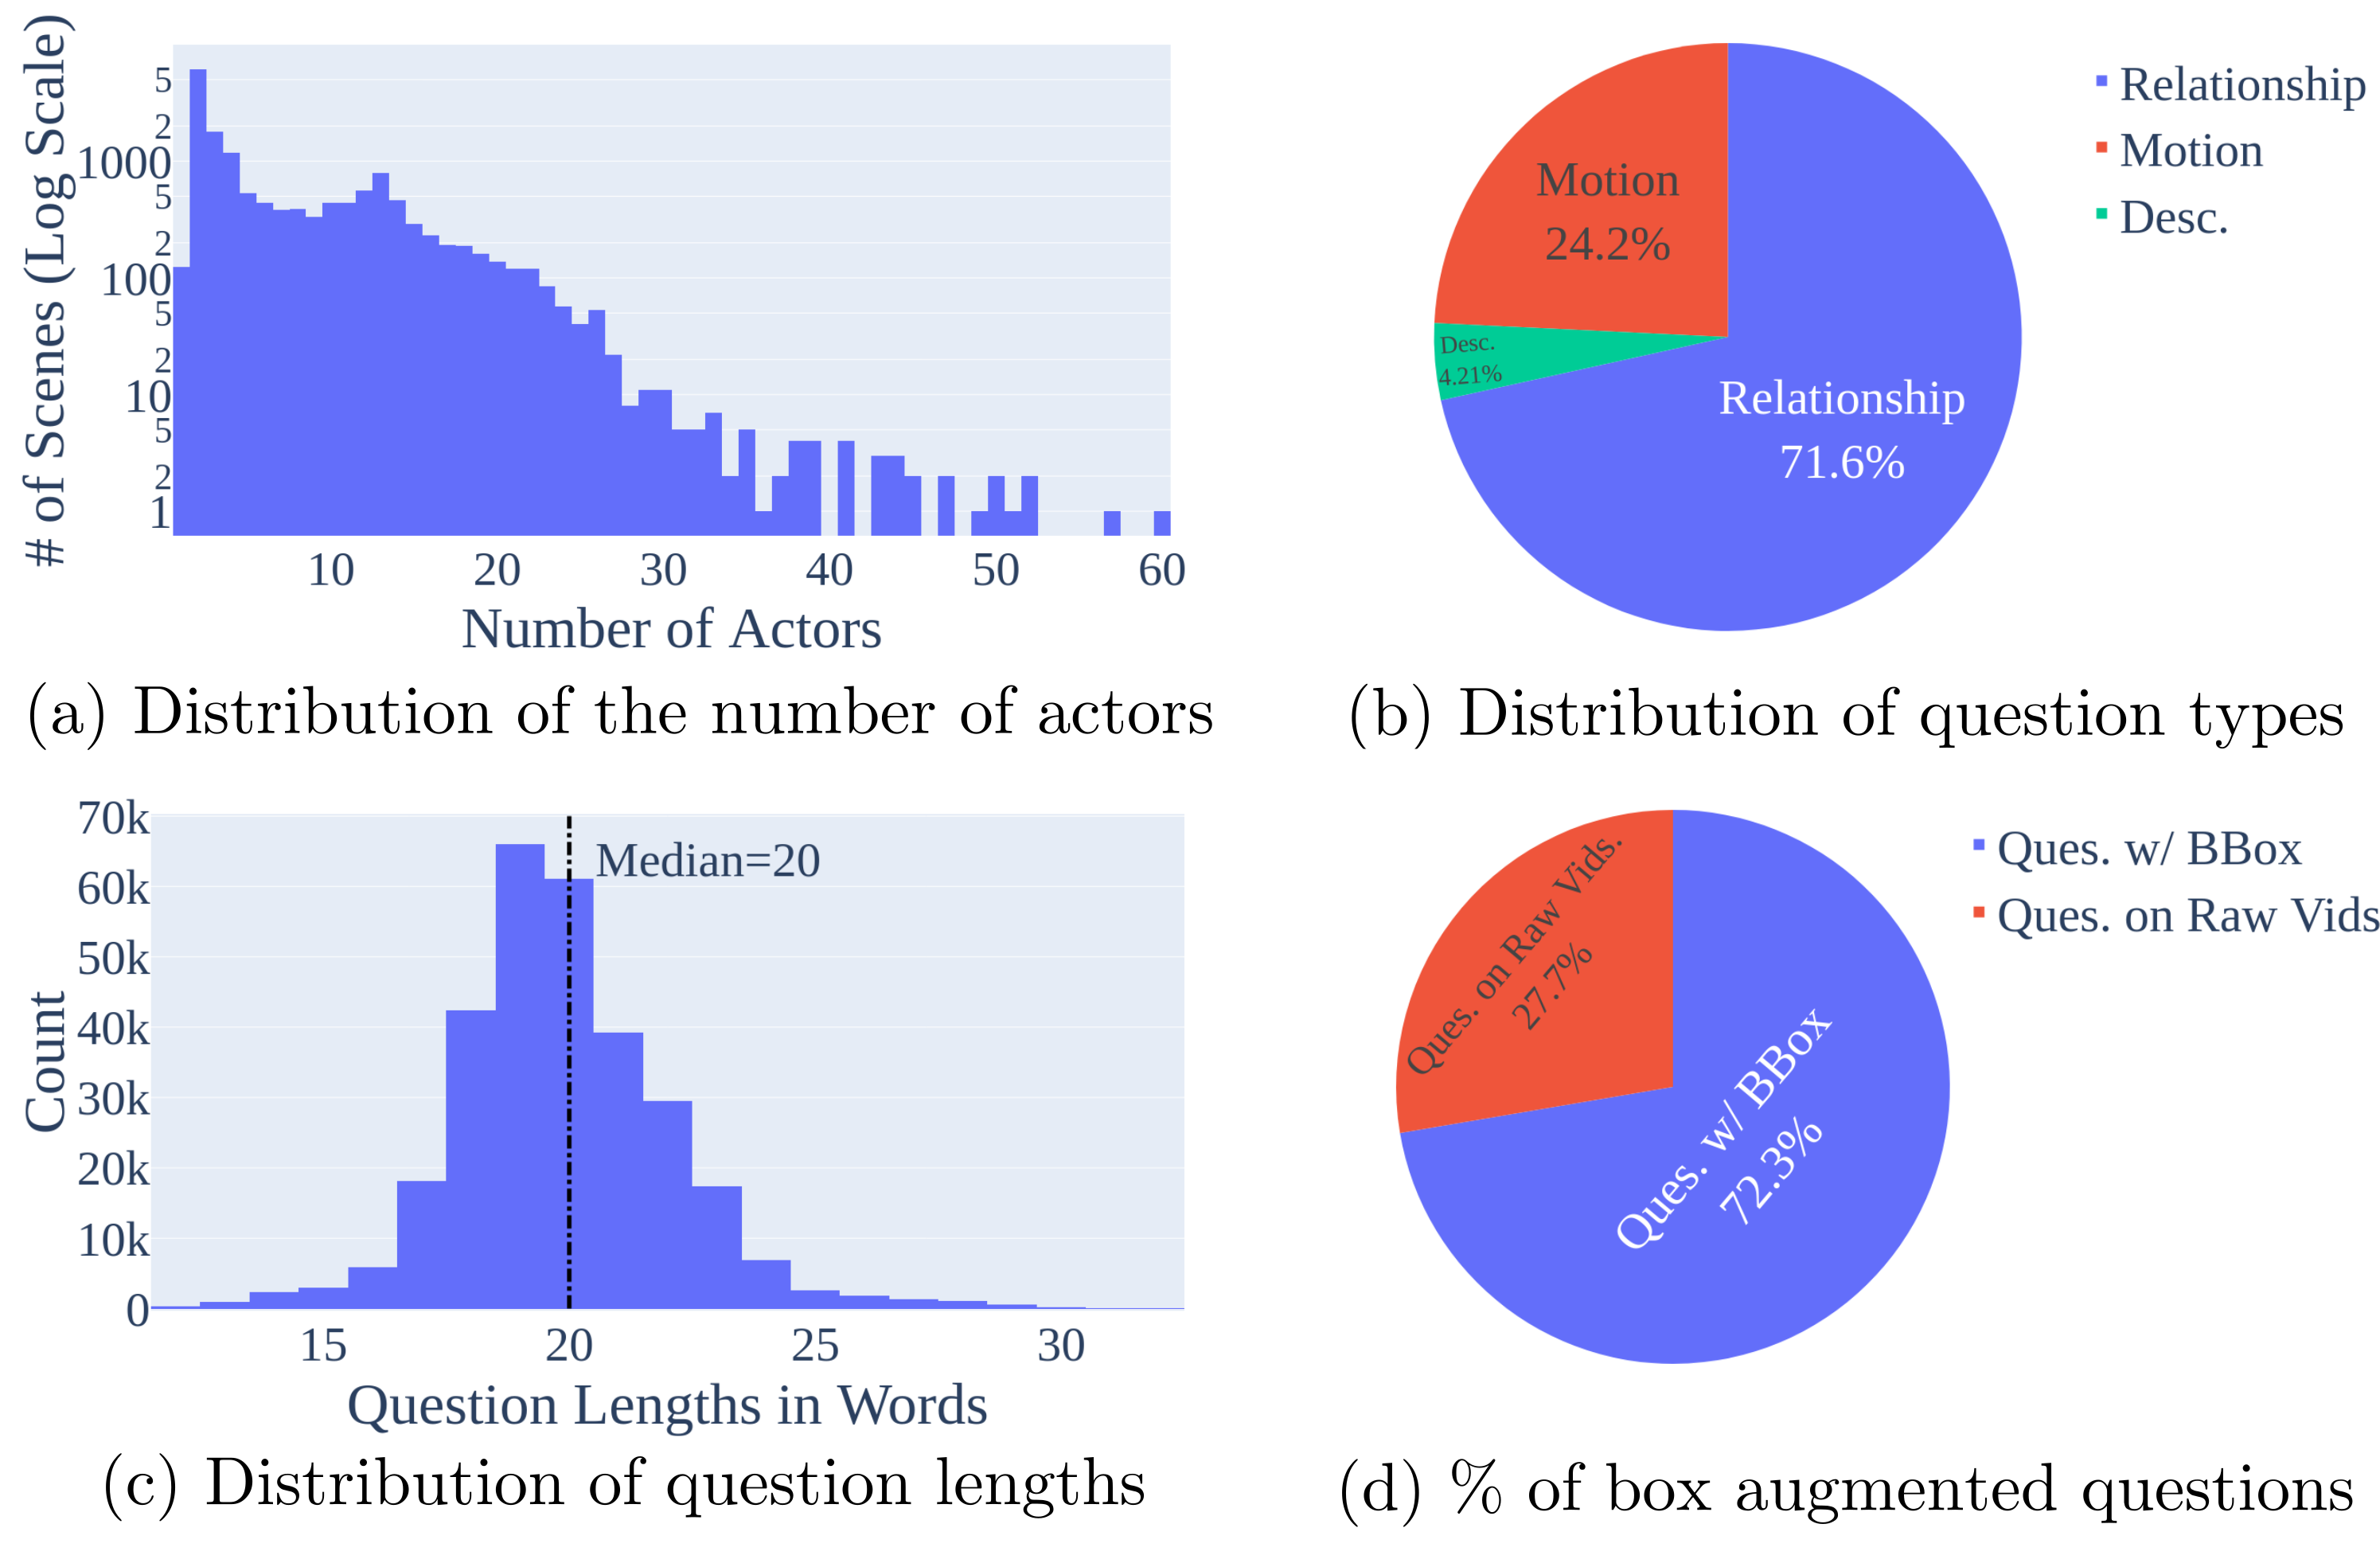
The dataset contains 300,791 QA pairs from 147 hours of original video plus 956 hours of outlined variants. Table 2 lists 1,412 raw videos and 27,586 videos including augmentation, with mean durations of 376 and 144 seconds respectively.
Questions are 71.6% relationship, 24.2% motion, and 4.21% description, with a median length of 20 words. The text reports 4,045 scenes with more than ten actors and 72.3% of questions using outlined videos. These are separate scene, video, and question counts; the dataset is strongly weighted toward relationships.
4 Method
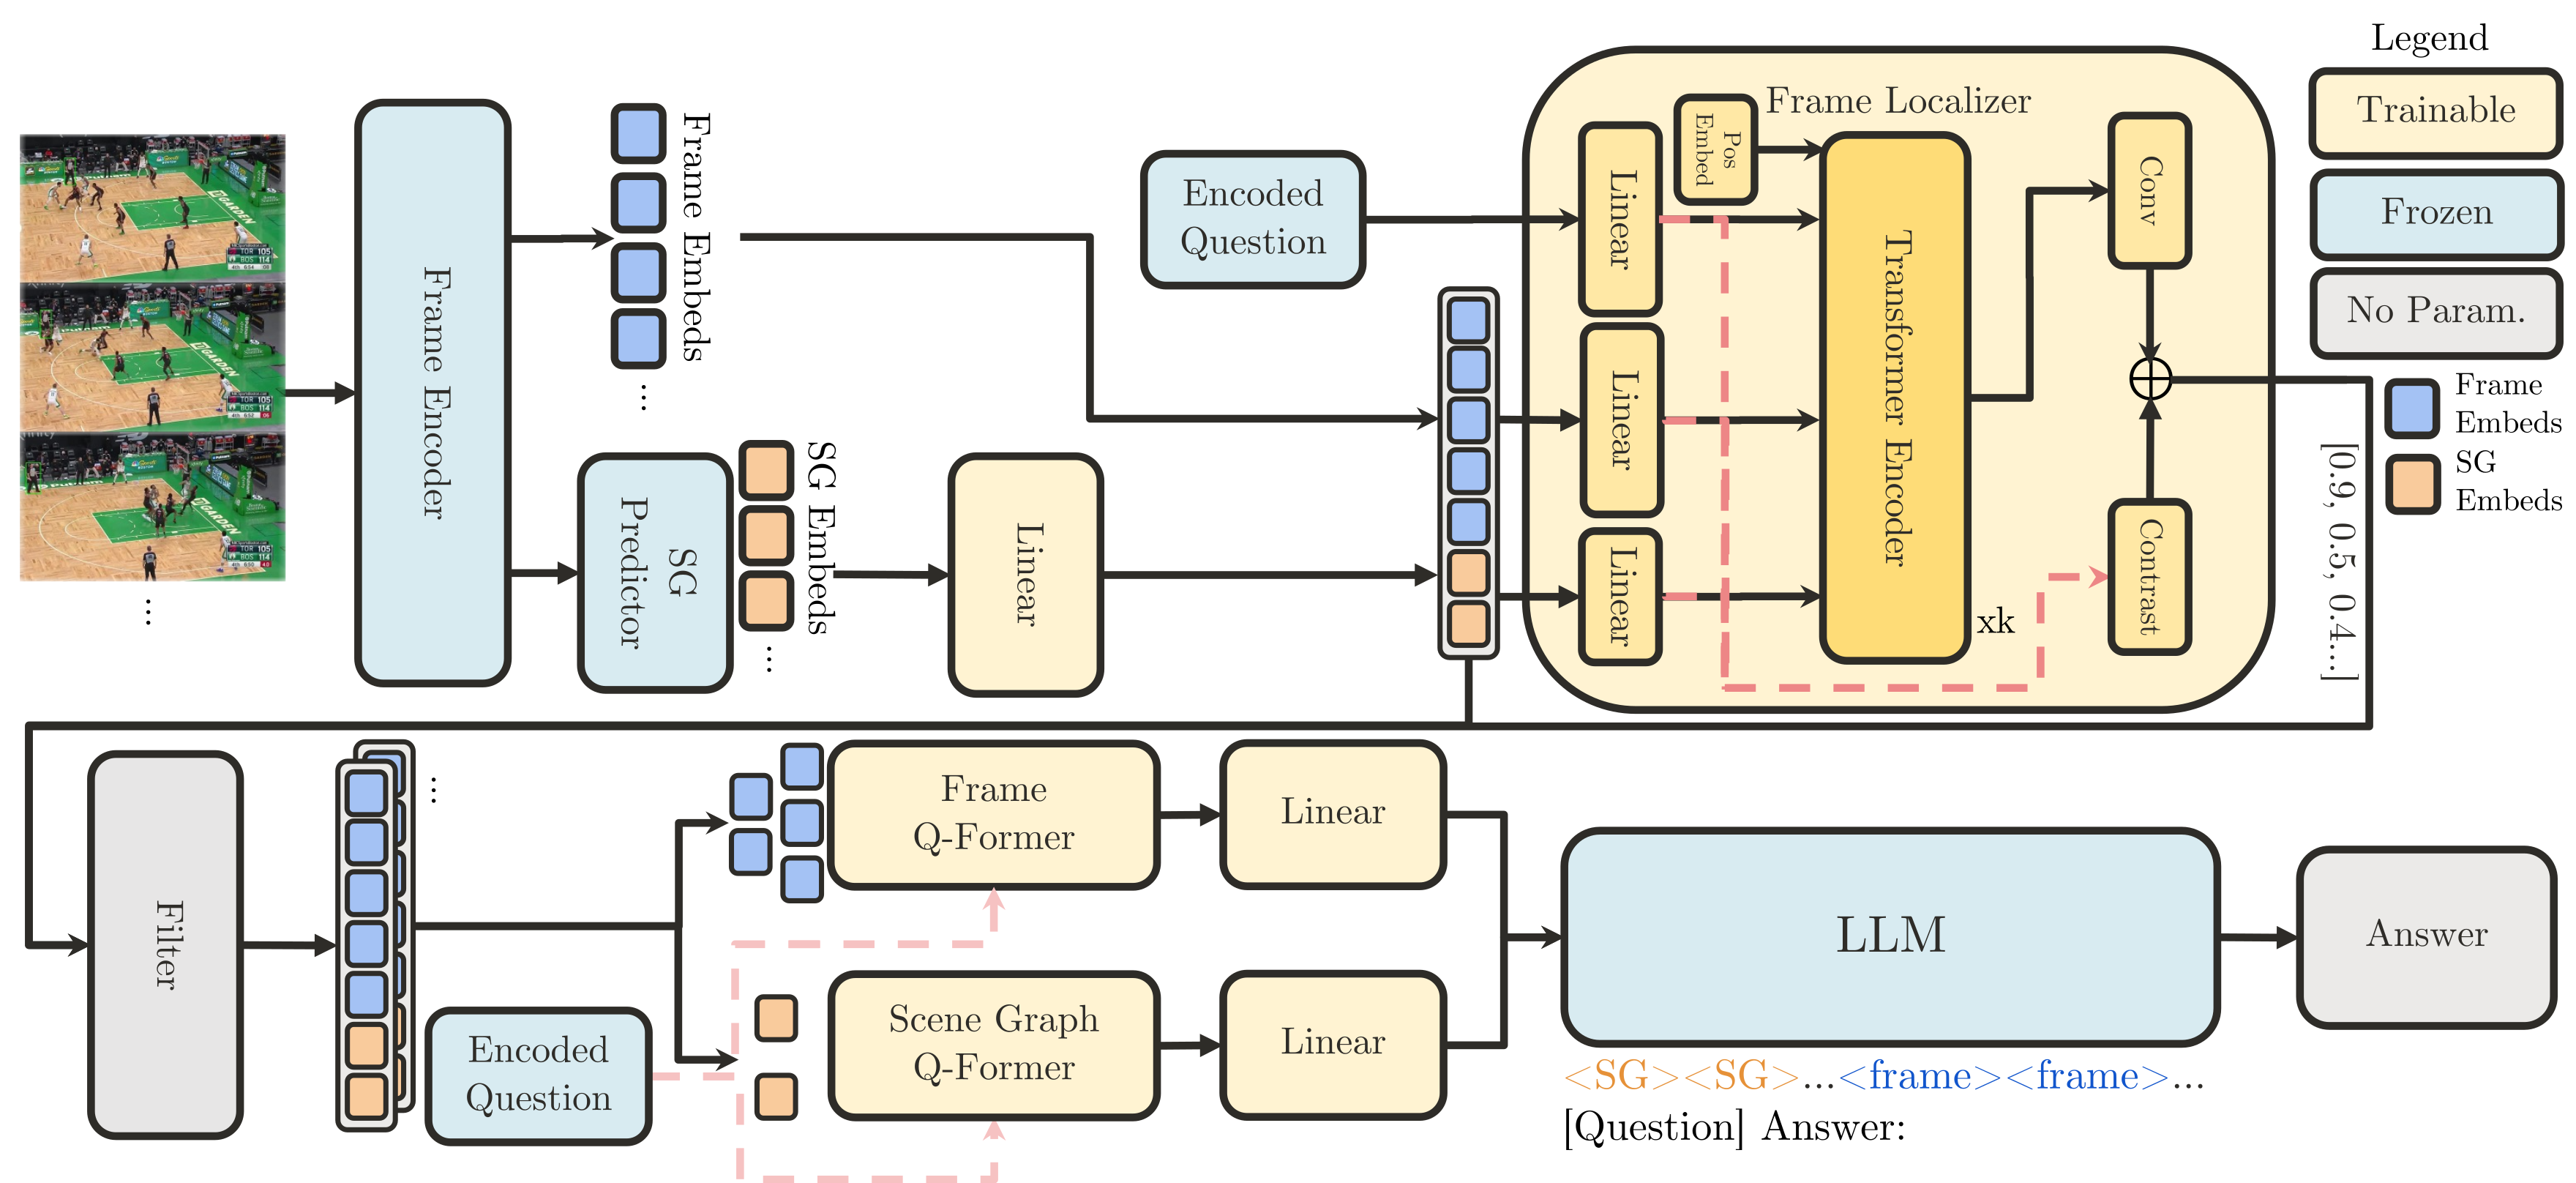
The model has five components. An EVA-02 vision transformer produces image patches and object proposals. A Neural Motifs-style predictor uses bidirectional LSTMs to build object and edge contexts, retaining the highest-scoring relation features. The vision and graph components receive Visual Genome pretraining; dataset-specific tuning is described in the supplement.
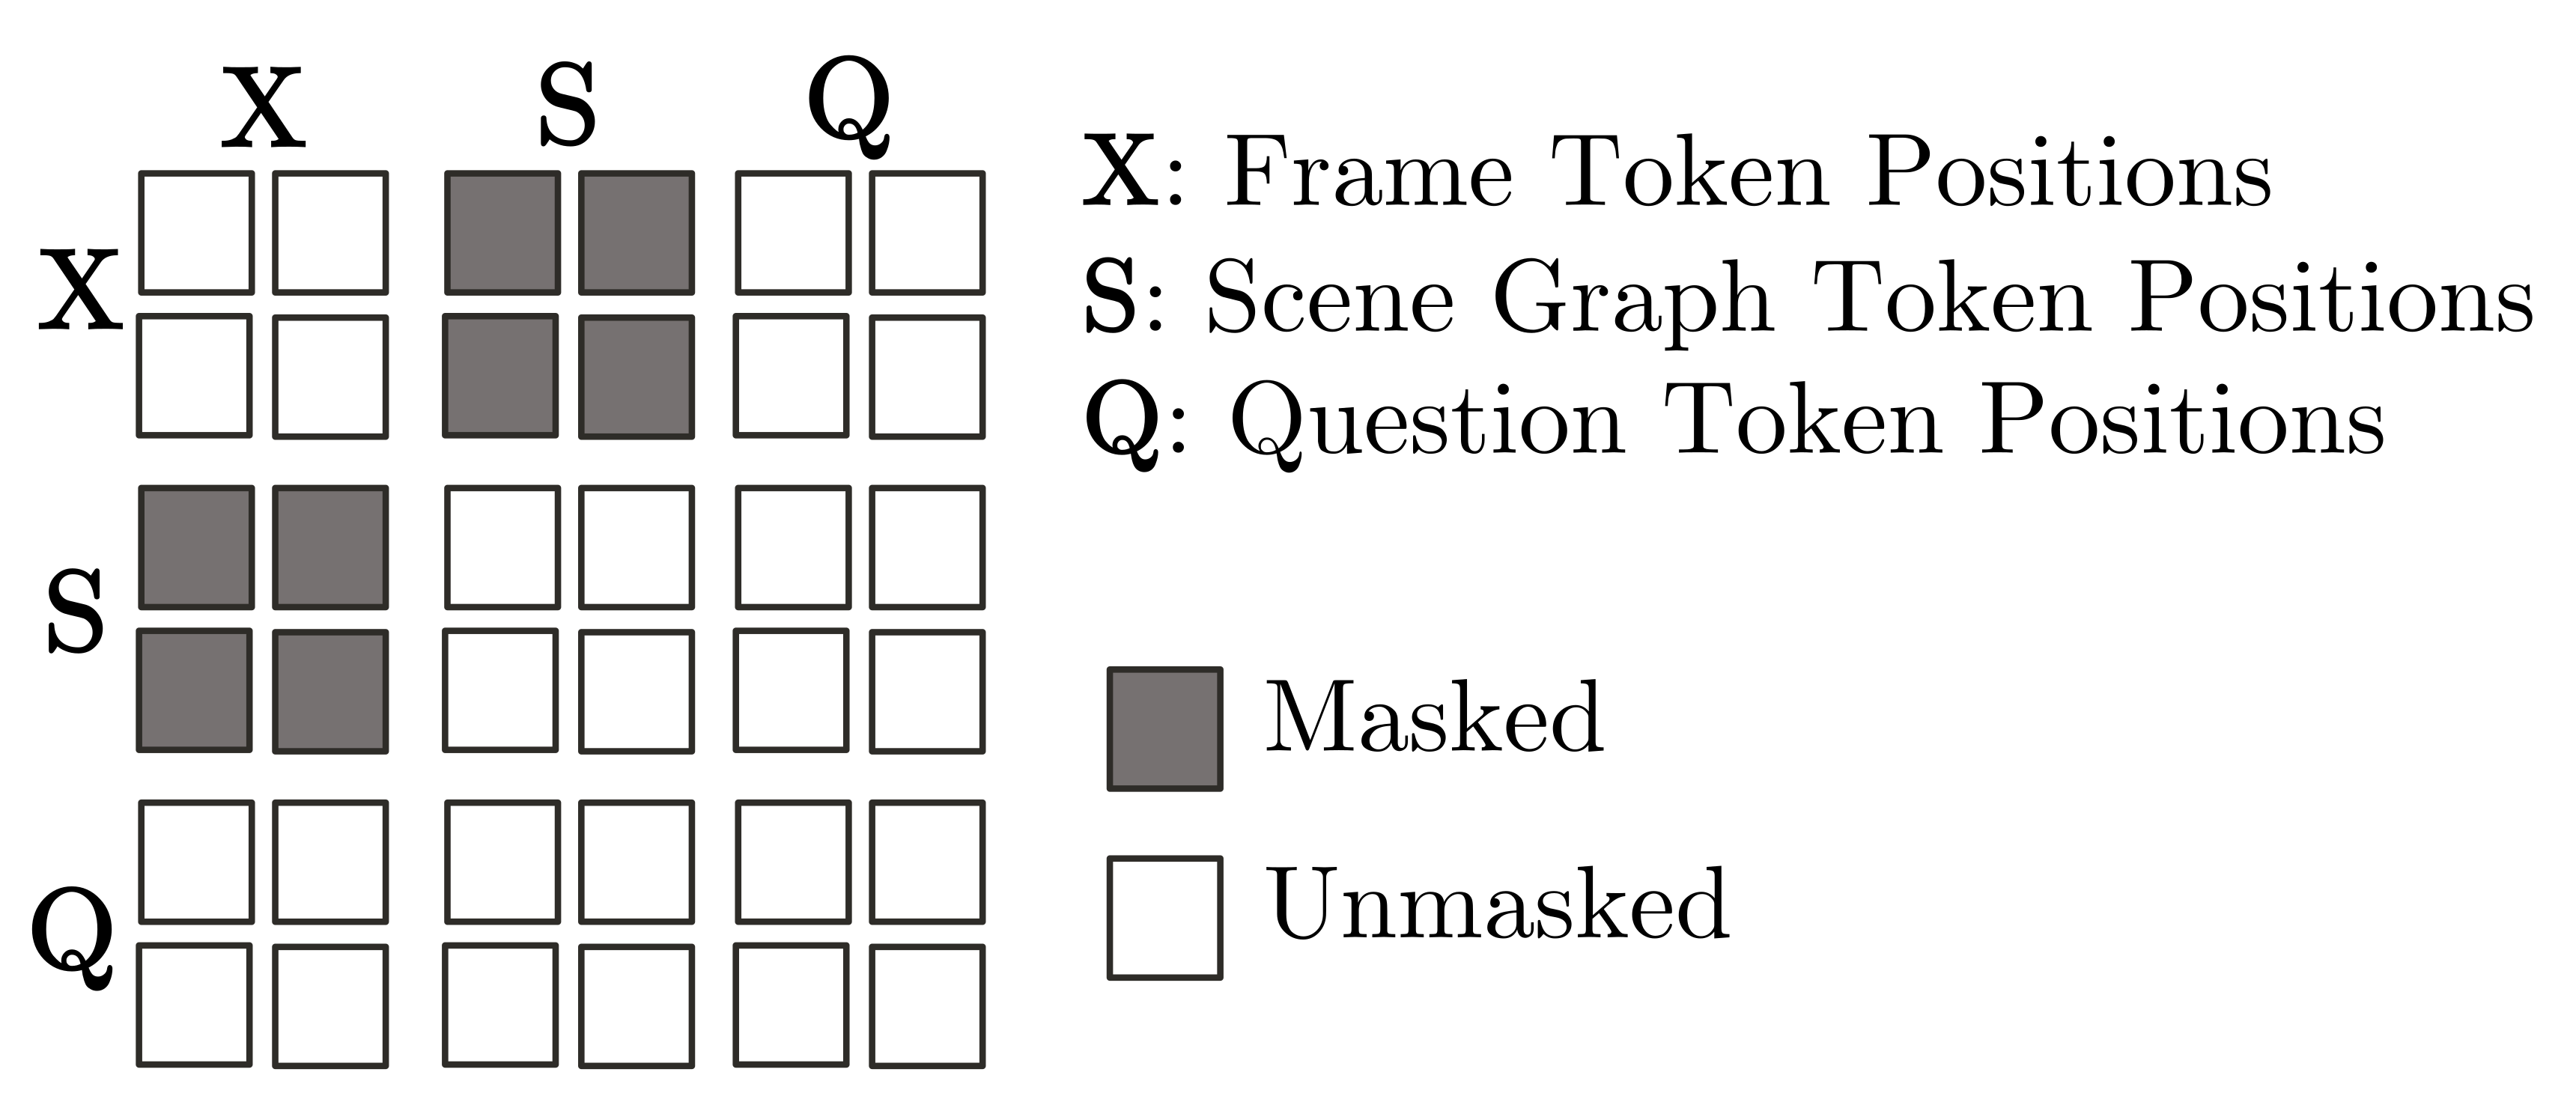
For retrieval, mean-pooled frame and scene features are separately projected, combined with question tokens, and given positional and type embeddings. A transformer alignment branch predicts whether each frame belongs to the relevant interval. Figure 4 masks interactions between frame tokens and scene tokens while leaving within-modality and question interactions unmasked. The accompanying prose instead describes visual tokens interacting exclusively with questions; the diagram and that wording are not fully consistent.
A second branch sums frame–question and scene–question cosine similarities. Intra-video contrastive training favors a positive frame over lower-saliency negatives, while inter-video training uses other batch videos as negatives. The combined objective adds these terms to foreground binary cross-entropy. Learned weights combine foreground probability and saliency to rank frames; only the top-ranked frames proceed.
When interval annotations exist, they supervise the retriever directly. Otherwise, Equation 8 builds pseudo-labels from answer correctness and the frame-selection threshold: retain the selection for a correct answer and reverse it for a wrong one. This is heuristic supervision from QA outcomes, not independently verified temporal grounding.
Separate BLIP-2 Q-Formers process scene and frame features, project them into language-model space, and concatenate them with the question. The paper does not specify all critical choices, including the exact language-model checkpoint, selected-frame count, loss weights, and threshold settings.
The original equations are preserved. Some notation is inconsistent: the feature-pooling sums omit their summation index on the feature term; the contrastive paragraph swaps the frame/scene variable names; the stated intra-video negative set restricts indices to those before the positive frame. These printed details should not be silently replaced by assumed implementation behavior.
Equations 1–8
| (1) |
| (2) |
| (3) |
| (4) |
| (5) |
| (6) |
| (7) |
| (8) |
| Model | Description | Relationship | Action | Total | ||||
| Accuracy | WUPS@0.9 | Accuracy | WUPS@0.9 | Accuracy | WUPS@0.9 | Accuracy | WUPS@0.9 | |
| InternVideo [47] | ||||||||
| mPLUG-2 [53] | ||||||||
| BLIP-2 [21] | ||||||||
| SeViLa [56] | 0.6027 | 0.5045 | 0.6023 | |||||
| SGVLM | 58.69 | 13.03 | 65.43 | 0.9174 | 27.94 | |||
| Model | Description | Relationship | Action | Total | ||||
| Accuracy | WUPS@0.9 | Accuracy | WUPS@0.9 | Accuracy | WUPS@0.9 | Accuracy | WUPS@0.9 | |
| InternVideo [47] | ||||||||
| mPLUG-2 [53] | ||||||||
| BLIP-2 [21] | ||||||||
| Sevila [56] | ||||||||
| 67.01 | 0.6701 | |||||||
| SGVLM | 81.36 | 0.8435 | 77.06 | 0.9771 | 79.66 | 0.8688 | ||
| Model | Causal | Temporal | Descriptive | Average |
| HGA [12] | ||||
| All-in-One [46] | ||||
| Just Ask [54] | ||||
| MIST [7] | ||||
| HiTeA [55] | ||||
| InternVideo [47] | ||||
| BLIP-2 [21] | ||||
| SeViLA [56] | 69.4 | |||
| SGVLM | 75.2 | 83.4 | 74.3 |
5 Experiments
Experiments test MOMA-QA answering, multiple-choice NExT-QA, and QVHighlights retrieval/highlight detection. The last evaluation trains and measures the retriever alone, so its scores do not describe end-to-end answer quality.
| Moment Retrieval | HD | ||||||
| R | mAP | Very Good | |||||
| Model | @ | @ | @ | @ | Avg. | mAP | HIT@ |
| BeautyThumb [39] | |||||||
| DVSE [24] | |||||||
| MCN [2] | |||||||
| CAL [4] | |||||||
| CLIP [31] | |||||||
| XML [18] | |||||||
| XML+ [19] | |||||||
| MDETR [19] | |||||||
| UniVTG [22] | |||||||
| UMT [25] | |||||||
| QD-DETR [28] | 62.52 | 39.86 | 62.40 | ||||
| SeViLA [56] | |||||||
| SGVLM | 63.36 | 46.30 | 42.00 | 39.17 | |||
5.1 Dataset & Metrics
MOMA-QA reports accuracy and WUPS@0.9. The printed accuracy is the average fraction of ground-truth answer tokens matching predicted tokens at the same position, not strict whole-answer exact match; the summation stops at the shorter answer length. Additional predicted tokens beyond that length are not explicitly penalized in Equation 9.
WUPS gives graded semantic credit and is defined in Appendix B. NExT-QA reports categorical and overall multiple-choice accuracy. QVHighlights reports moment Recall@1 at overlap thresholds, mean average precision, and highlight mAP/HIT@1. These different metrics should not be compared as one common accuracy scale.
Equation 9
| (9) |
5.2 Experimental Setup
MOMA-QA comparisons include InternVideo, mPLUG-2, BLIP-2, and SeViLA in both zero-shot and fine-tuned settings. The supplement records pretraining and training hardware, but not a complete common compute budget, hyperparameter search, or repeated-run uncertainty.
6 Results & Discussions
The original result tables and qualitative examples retain both improvements and failures, with separate evidence for QA, temporal retrieval, and component ablations.
6.1 Zero Shot Results
SGVLM has the highest reported zero-shot total accuracy, 27.94%, narrowly above SeViLA’s 27.44%. SeViLA has the higher total WUPS, 0.6023 versus 0.5828. Both struggle on relationship questions: SGVLM reaches 13.03% accuracy, while SeViLA’s relationship WUPS is higher at 0.5045 versus 0.4663.
The source prose’s 13.03%/0.5045 maxima refer to the relationship category, not all questions. Here zero-shot means no MOMA-QA fine-tuning: SGVLM already trains its graph predictor on Visual Genome, retriever on QVHighlights, and QA model on NExT-QA.
6.2 Fine-tuned VideoQA Results
After MOMA-QA fine-tuning, SGVLM reaches 79.66% total accuracy and 0.8688 WUPS, versus SeViLA’s 77.19% and 0.8442. Relationship accuracy is 81.36% versus 78.92%; description accuracy is 66.64% versus 63.60%, a 3.04 percentage-point gain.
Removing the localizer reduces total accuracy to 77.60%; removing scene graphs gives 77.55%. The no-localizer variant has slightly better description accuracy than the full model, 67.01% versus 66.64%, so each component is not uniformly beneficial.
On NExT-QA, SGVLM averages 74.3% versus SeViLA’s 73.8%. Causal and descriptive scores improve to 75.2% and 83.4%, but temporal accuracy falls to 66.3% from 69.4%. No confidence intervals or repeated-seed variation are reported for these modest aggregate gains.
6.3 Frame Localization Results
On the QVHighlights hidden test set, SGVLM leads the listed models on moment R1@0.5 and R1@0.7, at 63.36 and 46.30, and mAP@0.75, at 42.00. QD-DETR remains slightly higher on mAP@0.5, 62.52 versus 62.47, and average mAP, 39.86 versus 39.82.
For highlight detection, SGVLM has the highest listed mAP at 39.17, but HIT@1 is 62.26 versus QD-DETR’s 62.40. This reverses the rankings described in the source prose. The table uses mAP@0.75 rather than the prose’s @0.7. Its “no extra training data” qualifier concerns additional video-retrieval datasets, not the absence of all visual pretraining.
6.4 Qualitative Analysis
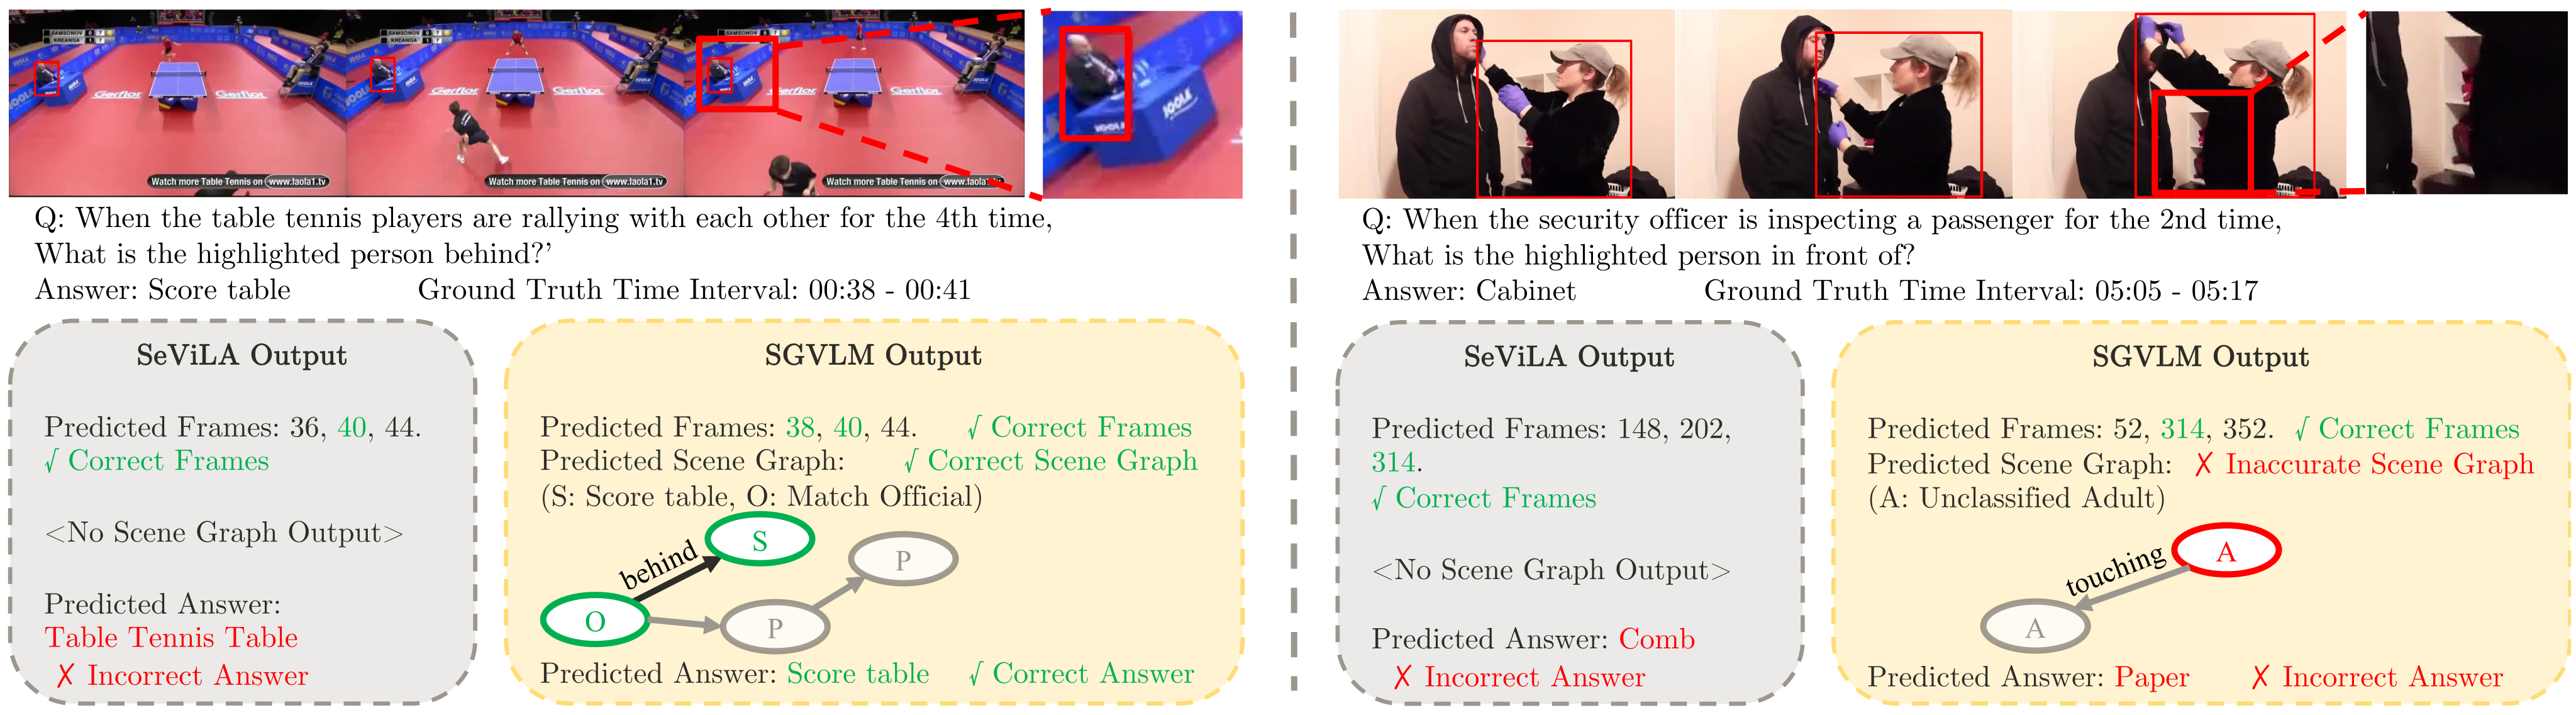
In the table-tennis example, SGVLM identifies a score table through the relation “match official behind score table,” while SeViLA answers table-tennis table. In the security example, both methods miss a cabinet; the cabinet’s absence from SGVLM’s predicted graph suggests a recognition or occlusion failure.
These intermediate graphs make concrete errors inspectable. The two selected examples do not isolate scene graphs as the cause of success, quantify interpretability, or establish robustness to all occlusions.
7 Conclusion
MOMA-QA provides unusually detailed supervision for entity-specific video questions, and SGVLM uses scene representations and temporal retrieval to improve aggregate benchmark results. Remaining limitations include low zero-shot relationship accuracy, dependence on predicted objects and relationships, template/augmentation effects, and incomplete reproduction settings. The paper does not demonstrate deployment performance, inference latency, or broad real-world transfer.
Appendix A Details of Scene Graph Predictor.
The scene predictor encodes each object’s visual feature and class probabilities with a bidirectional LSTM. An autoregressive object decoder and another bidirectional LSTM/MLP produce edge contexts. Pairwise projected object contexts form relation features, with softmax scores used to keep the top-ranked relationships.
The supplement says the predictor is pretrained and frozen during QA training, while its fine-tuning subsection says the predictor and backbone are tuned on MOMA-QA. A staged tuning-then-freezing interpretation is plausible, but the exact schedule is not specified consistently. The original formulas remain available below.
Equations 10
| (10) |
Appendix B Calculation of WUPS@0.9
WUPS compares words in both directions, taking each word’s best semantic match, multiplying within each answer, and retaining the smaller directional score. Similarities below 0.9 are downweighted by a factor of ten. The appendix preserves this expression but does not explicitly define the underlying similarity function W or the symbol A appearing in one product; tokenization and semantic-resource details are also absent.
Equations
Appendix C Experimental Setup
The supplement distinguishes transfer before MOMA-QA evaluation, direct dataset fine-tuning, and separate public-benchmark training.
C.1 Zero Shot
Baselines use their selected pretrained weights. Closed-vocabulary models map unavailable answers to the nearest vocabulary word. SGVLM trains its scene predictor on Visual Genome, localizer on QVHighlights, and full QA model on NExT-QA before MOMA-QA testing.
The appendix cites reference 50 for Visual Genome, although the dataset’s actual bibliography entry is reference 15. The intended dataset is clear from the main text; both original references are retained.
C.2 Fine-tuned
Each model trains for at most five epochs on one node with four NVIDIA A6000 GPUs, using the model’s default hyperparameters. SGVLM starts from the zero-shot configuration, tunes its visual/graph components on MOMA-QA, and tunes the localizer during full QA training. A shared epoch limit does not establish equal compute or tuning effort.
C.3 Experiments on Public Datasets
For NExT-QA, the paper uses multiple-choice evaluation and describes choosing among the highest-probability answer letters A–D. The exact stated candidate set is retained; the source does not further reconcile it with alternative benchmark configurations.
On QVHighlights, only the retriever is trained and evaluated. Hyperparameters are selected using validation data, then training and validation are combined for the reported hidden-test evaluation. Appendix D’s validation ablation is a different comparison from Table 6’s test results.
Appendix D Effect of Attention Masks
On QVHighlights validation, adding the attention mask improves all seven reported metrics: R1@0.5 rises 63.81→64.65, R1@0.7 47.35→48.06, and mAP@0.5 62.21→63.12. The largest listed gain is 0.91 percentage points. This ablation supports the mask in the tested setup; no run-to-run uncertainty is provided.
| Moment Retrieval | HD | ||||||
| R | mAP | Very Good | |||||
| Model | @ | @ | @ | @ | Avg. | mAP | HIT@ |
| Without Mask | |||||||
| With Mask | 64.65 | 48.06 | 63.12 | 43.19 | 41.13 | 40.17 | 64.19 |