At a glance
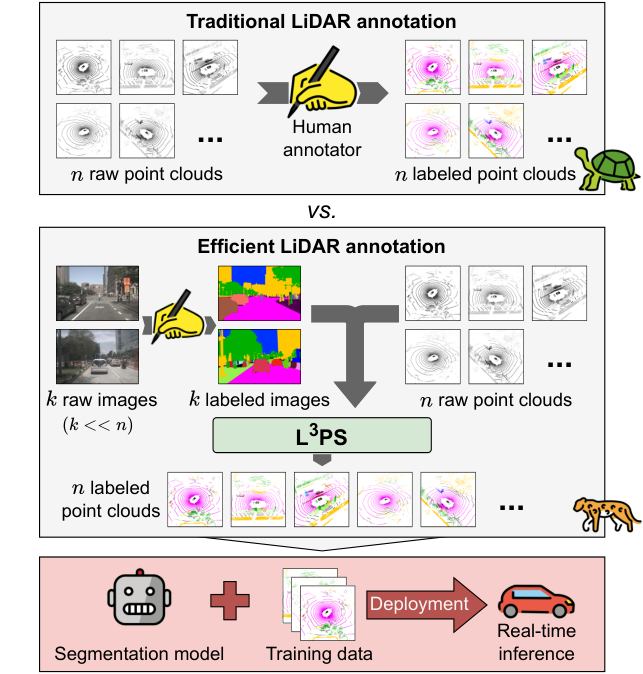
Limited-Label LiDAR Panoptic Segmentation (L3PS) uses a small labeled image set to generate camera pseudo-labels, projects them onto LiDAR scans, and refines them with geometry and temporal accumulation. On nuScenes, refined labels improve from 37.5 to 48.1 panoptic quality and from 48.6 to 56.5 mean intersection over union. They can train conventional LiDAR networks without manually labeling the full point-cloud training set. The method still uses pretrained visual models, carefully selected labeled images, and synchronized sensor data.
I Introduction
Point-wise semantic and instance annotation is expensive. The proposal shifts the supervised input toward a small number of images and uses 3D structure to repair projected labels. It targets annotation efficiency in the evaluated driving domain, rather than eliminating all supervision or solving unrestricted cross-domain generalization.
II Related Work
Prior LiDAR panoptic methods generally rely on extensive point annotations. Label-efficient alternatives use self-supervision, sparse labels, or knowledge transferred from image models. L3PS combines limited image supervision with geometry-based label refinement and then trains standard downstream models. Annotation counts across modalities are not identical measures of human effort, and pretrained-model supervision is a separate resource.
III Technical Approach
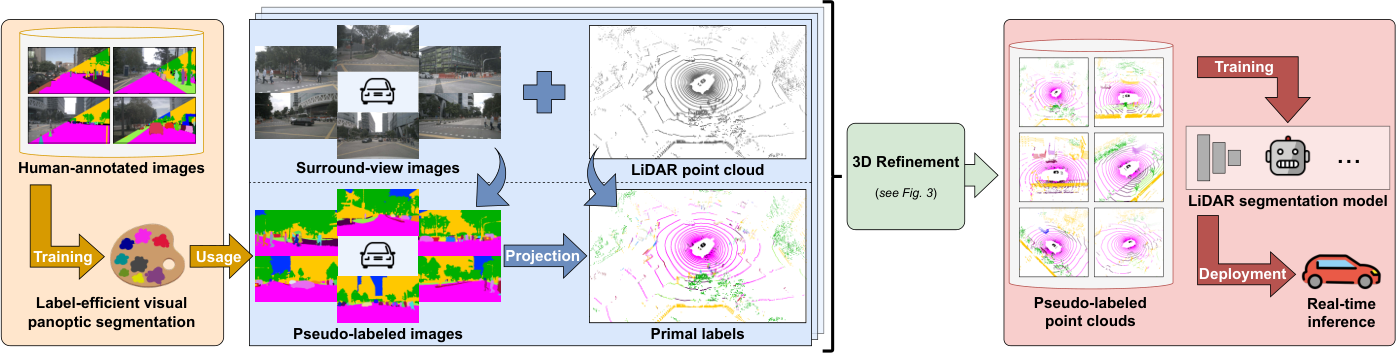
The pipeline generates initial image-derived labels, refines them over accumulated 3D scenes, and uses the results as supervision for LiDAR-only inference.
III-A Problem Definition
Inputs are LiDAR scans with corresponding surround-view images, plus panoptic annotations for a small image subset. The goal is to label the whole point-cloud set. This assumes sensor calibration and correspondence sufficient to project points into camera images.
III-B Overview
A label-efficient visual model predicts semantic classes and object instances. Projected labels are processed using accumulated geometry, ground separation, clustering, and instance correction. Downstream models learn from these refined labels, separating the relatively expensive labeling pipeline from deployment-time segmentation.
III-C Primal Label Generation
PASTEL trains lightweight semantic and object-boundary heads over a frozen DINOv2 backbone. Its pixel-level predictions assign semantic and instance labels to visible projected points. Points outside every camera view initially receive a void label. These initial projection results are called primal labels.
Equations 1–3
| (1) |
| (2) | ||||
| (3) |
III-D 3D Refinement
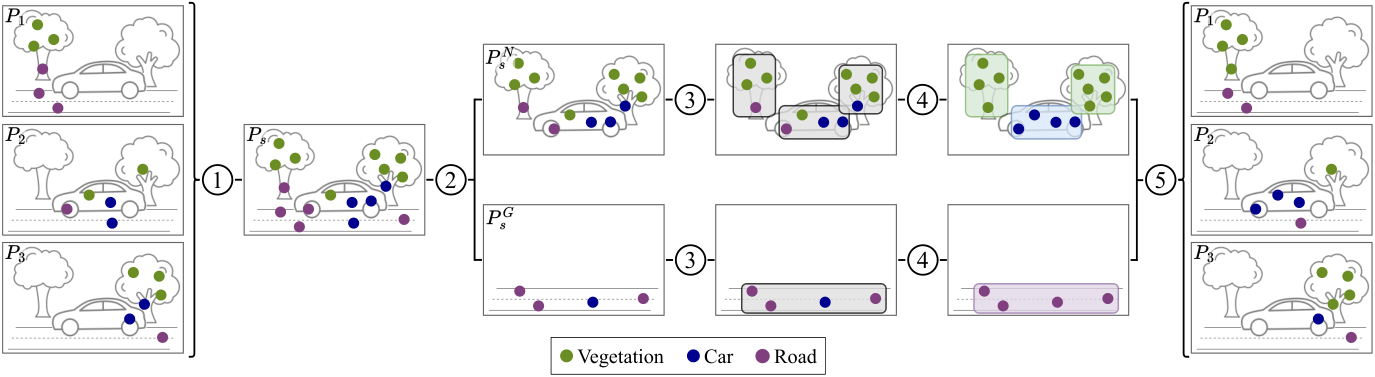
KISS-ICP estimates scan alignment, and contiguous scans are accumulated into scenes. Patchwork++ separates ground from non-ground before HDBSCAN clustering. Unclustered points are reassigned to nearby clusters, and cluster votes correct semantics, with thresholds for void and underrepresented classes. Instance labels are then corrected on individual scans, propagating valid instance identities to newly relabeled points. The approach assumes geometric clusters approximate consistent objects; alignment errors, motion, or merged structures can undermine that assumption.
Equations 4–5
| (4) |
| (5) |
III-E Segmentation Network Training
ScaLR is fine-tuned for semantic segmentation using pseudo-labels in place of point-wise ground truth. P3Former is trained for panoptic segmentation with the generated semantic and instance labels. The preserved losses include cross entropy, Lovász loss, and the original P3Former components. Real-time inference refers to the trained downstream models, not to scene accumulation and refinement.
Equations 6–8
| (6) |
| (7) |
| (8) |
IV Experimental Evaluation
Evaluation measures pseudo-label quality and the performance of networks trained from those labels. These are separate results and should not be combined into one claimed improvement.
IV-A Dataset and Evaluation Metrics
The study uses nuScenes validation data and 30 selected nuImages images. The images are chosen to cover all semantic categories, and five missing stuff classes are manually added to the available labels. This is curated limited supervision, not 30 arbitrary unlabeled photographs. Panoptic quality evaluates joint semantic/instance performance; mean intersection over union evaluates semantic segmentation.
| Method | Human annotations | PQ | mIoU |
| Fully supervised: | |||
| Panoptic PH-Net [21] | 28,130 LiDAR scans () | 74.7 | 79.7 |
| MostLPS [22] | —"— | 77.1 | 80.3 |
| P3Former [4] | —"— | 75.9 | 76.8 |
| Semi-supervised: | |||
| ST-SLidR [34] | 281 LiDAR scans () | – | 40.8 |
| SEAL [36] | —"— | – | 45.8 |
| ScaLR [35] | —"— | – | 51.0 |
| Zero-shot: | |||
| SAL† [38] | n/a | 38.4 | 33.9 |
| Few labels: | |||
| ST-SLidR‡ [34] | 30 LiDAR scans () | – | 44.3 |
| ScaLR‡ [35] | —"— | – | 58.0 |
| L3PS pseudo-labels (ours) | 30 images | 48.1 | 56.5 |
| L3PS + ScaLR (ours) | —"— | – | 60.1 |
| L3PS + P3Former (ours) | —"— | 51.4 | 48.2 |
Segmentation results on the nuScenes [16] validation set. The percentage in parentheses is relative to the size of the full training set. The highest metrics among the non-fully supervised approaches are highlighted in bold. †: SAL uses SAM [30] that is trained with human supervision. ‡: Baselines trained by us. The other metrics are from the respective publication.
IV-B Main Results
Using 30 labeled images, L3PS plus ScaLR reaches 60.1 mean IoU, while L3PS plus P3Former reaches 51.4 panoptic quality and 48.2 mean IoU. Fully supervised methods remain substantially better. Among the authors’ 30-point-cloud baselines, ScaLR reaches 58.0 mean IoU, so the image-based pipeline gains 2.1 points under different annotation modalities. The zero-shot and one-percent-supervision comparisons also differ in pretrained resources and label budgets. Results support a useful tradeoff in this domain, not equal-cost superiority under every supervision regime.
IV-C Ablation Studies
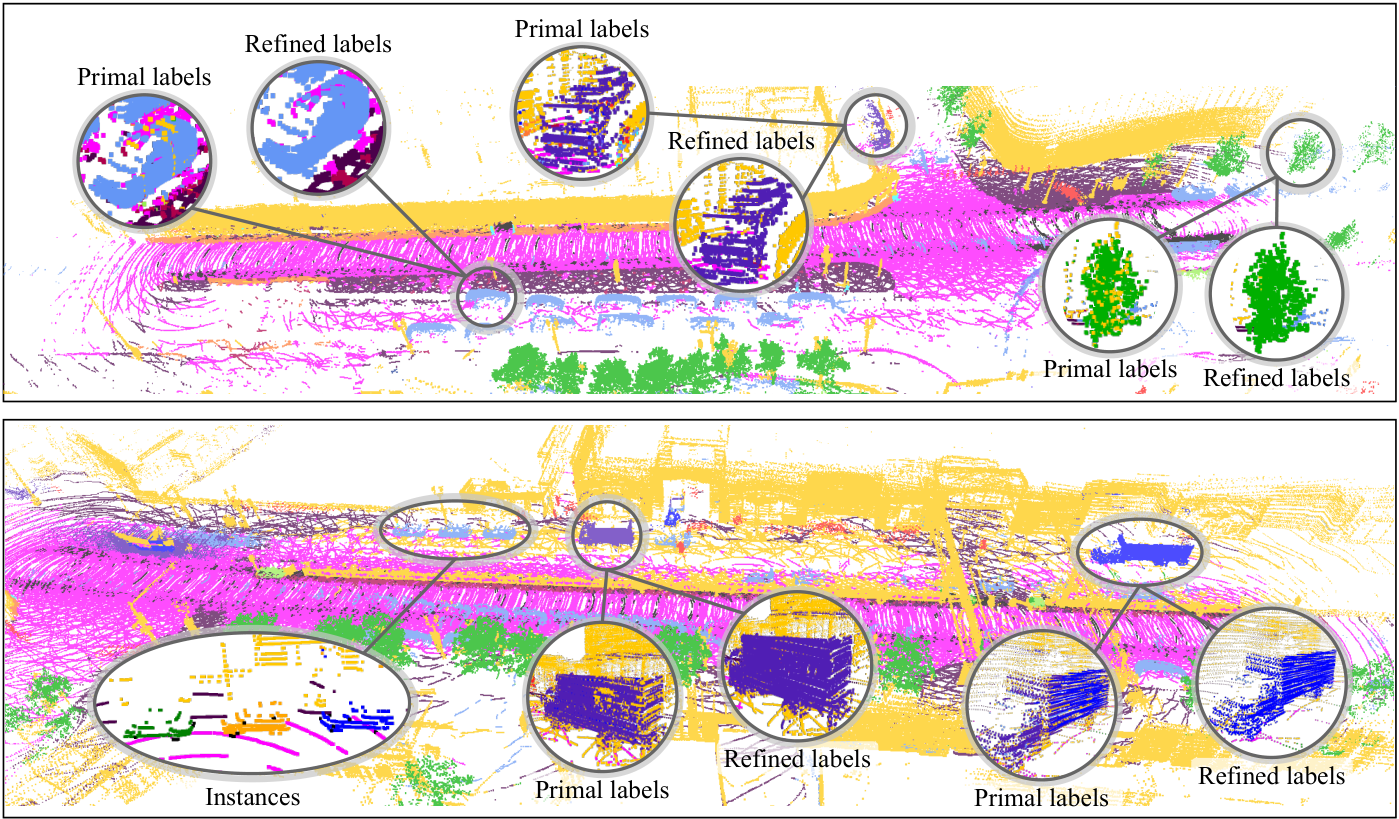
Table II gives refinement gains of 10.6 panoptic-quality and 7.9 mean-IoU points for pseudo-labels, 8.9 mean-IoU points for ScaLR, and 23.9 panoptic-quality/19.5 mean-IoU points for P3Former. Several prose deltas disagree with those table entries; this summary follows the explicit table. Cluster voting supplies most of the pseudo-label gain, with smaller additions from ground separation and rare-class preference. Minimum cluster size five gives the best listed quality at 20.8 seconds per scene; size ten is faster at 7.6 seconds but slightly less accurate. These are preprocessing runtimes, not per-scan model inference latency.
| Method |
Mean |
⚫ Barrier |
⚫ Bicycle |
⚫ Bus |
⚫ Car |
⚫ Constr. veh. |
⚫ Motorcycle |
⚫ Pedestrian |
⚫ Traffic cone |
⚫ Trailer |
⚫ Truck |
⚫ Driv. space |
⚫ Other flat |
⚫ Sidewalk |
⚫ Terrain |
⚫ Manmade |
⚫ Vegetation | |
| Primal labels | PQ | 37.5 | 28.5 | 24.8 | 39.4 | 42.0 | 26.3 | 46.9 | 38.6 | 45.0 | 11.4 | 23.7 | 79.5 | 6.6 | 25.6 | 35.1 | 62.9 | 63.9 |
| mIoU | 48.6 | 51.3 | 25.4 | 35.4 | 68.7 | 35.7 | 49.3 | 51.8 | 41.0 | 24.9 | 48.7 | 81.2 | 15.5 | 45.7 | 59.7 | 71.4 | 71.1 | |
| 3D refinement (L3PS) | PQ | 48.1 | 29.1 | 64.1 | 37.2 | 46.3 | 47.4 | 65.1 | 63.4 | 67.5 | 17.0 | 29.3 | 83.2 | 7.9 | 30.7 | 37.6 | 71.4 | 72.9 |
| mIoU | 56.5 | 60.0 | 40.4 | 43.0 | 75.4 | 50.3 | 62.6 | 71.1 | 52.8 | 28.8 | 53.4 | 84.7 | 19.1 | 48.0 | 61.8 | 76.5 | 76.7 | |
Class-wise segmentation results on the nuScenes [16] validation set for both primal and refined labels.
| Method | PQ | mIoU | ||
| Primal labels | 37.5 | 48.6 | ||
| + In-cluster majority voting | 47.6 | (+10.1) | 54.5 | (+5.9) |
| + Ground separation | 48.0 | (+0.4) | 55.9 | (+1.4) |
| + Favoring rare classes | 48.1 | (+0.1) | 56.5 | (+0.6) |
We analyze the impact of the steps of our 3D refinement module. Starting with the primal labels, we initially employ vanilla majority voting within each cluster. Next, we add ground and non-ground partition separations. Finally, we customize the voting mechanism by prioritizing rare classes.
V Conclusion
Image-derived pseudo-labels plus 3D refinement reduce reliance on dense point-cloud annotation in the tested setup. The results remain dependent on selected class-covering images, pretrained representations, sensor alignment, and driving-domain structure. Further domain adaptation and stronger 3D representations are future directions.