Overview
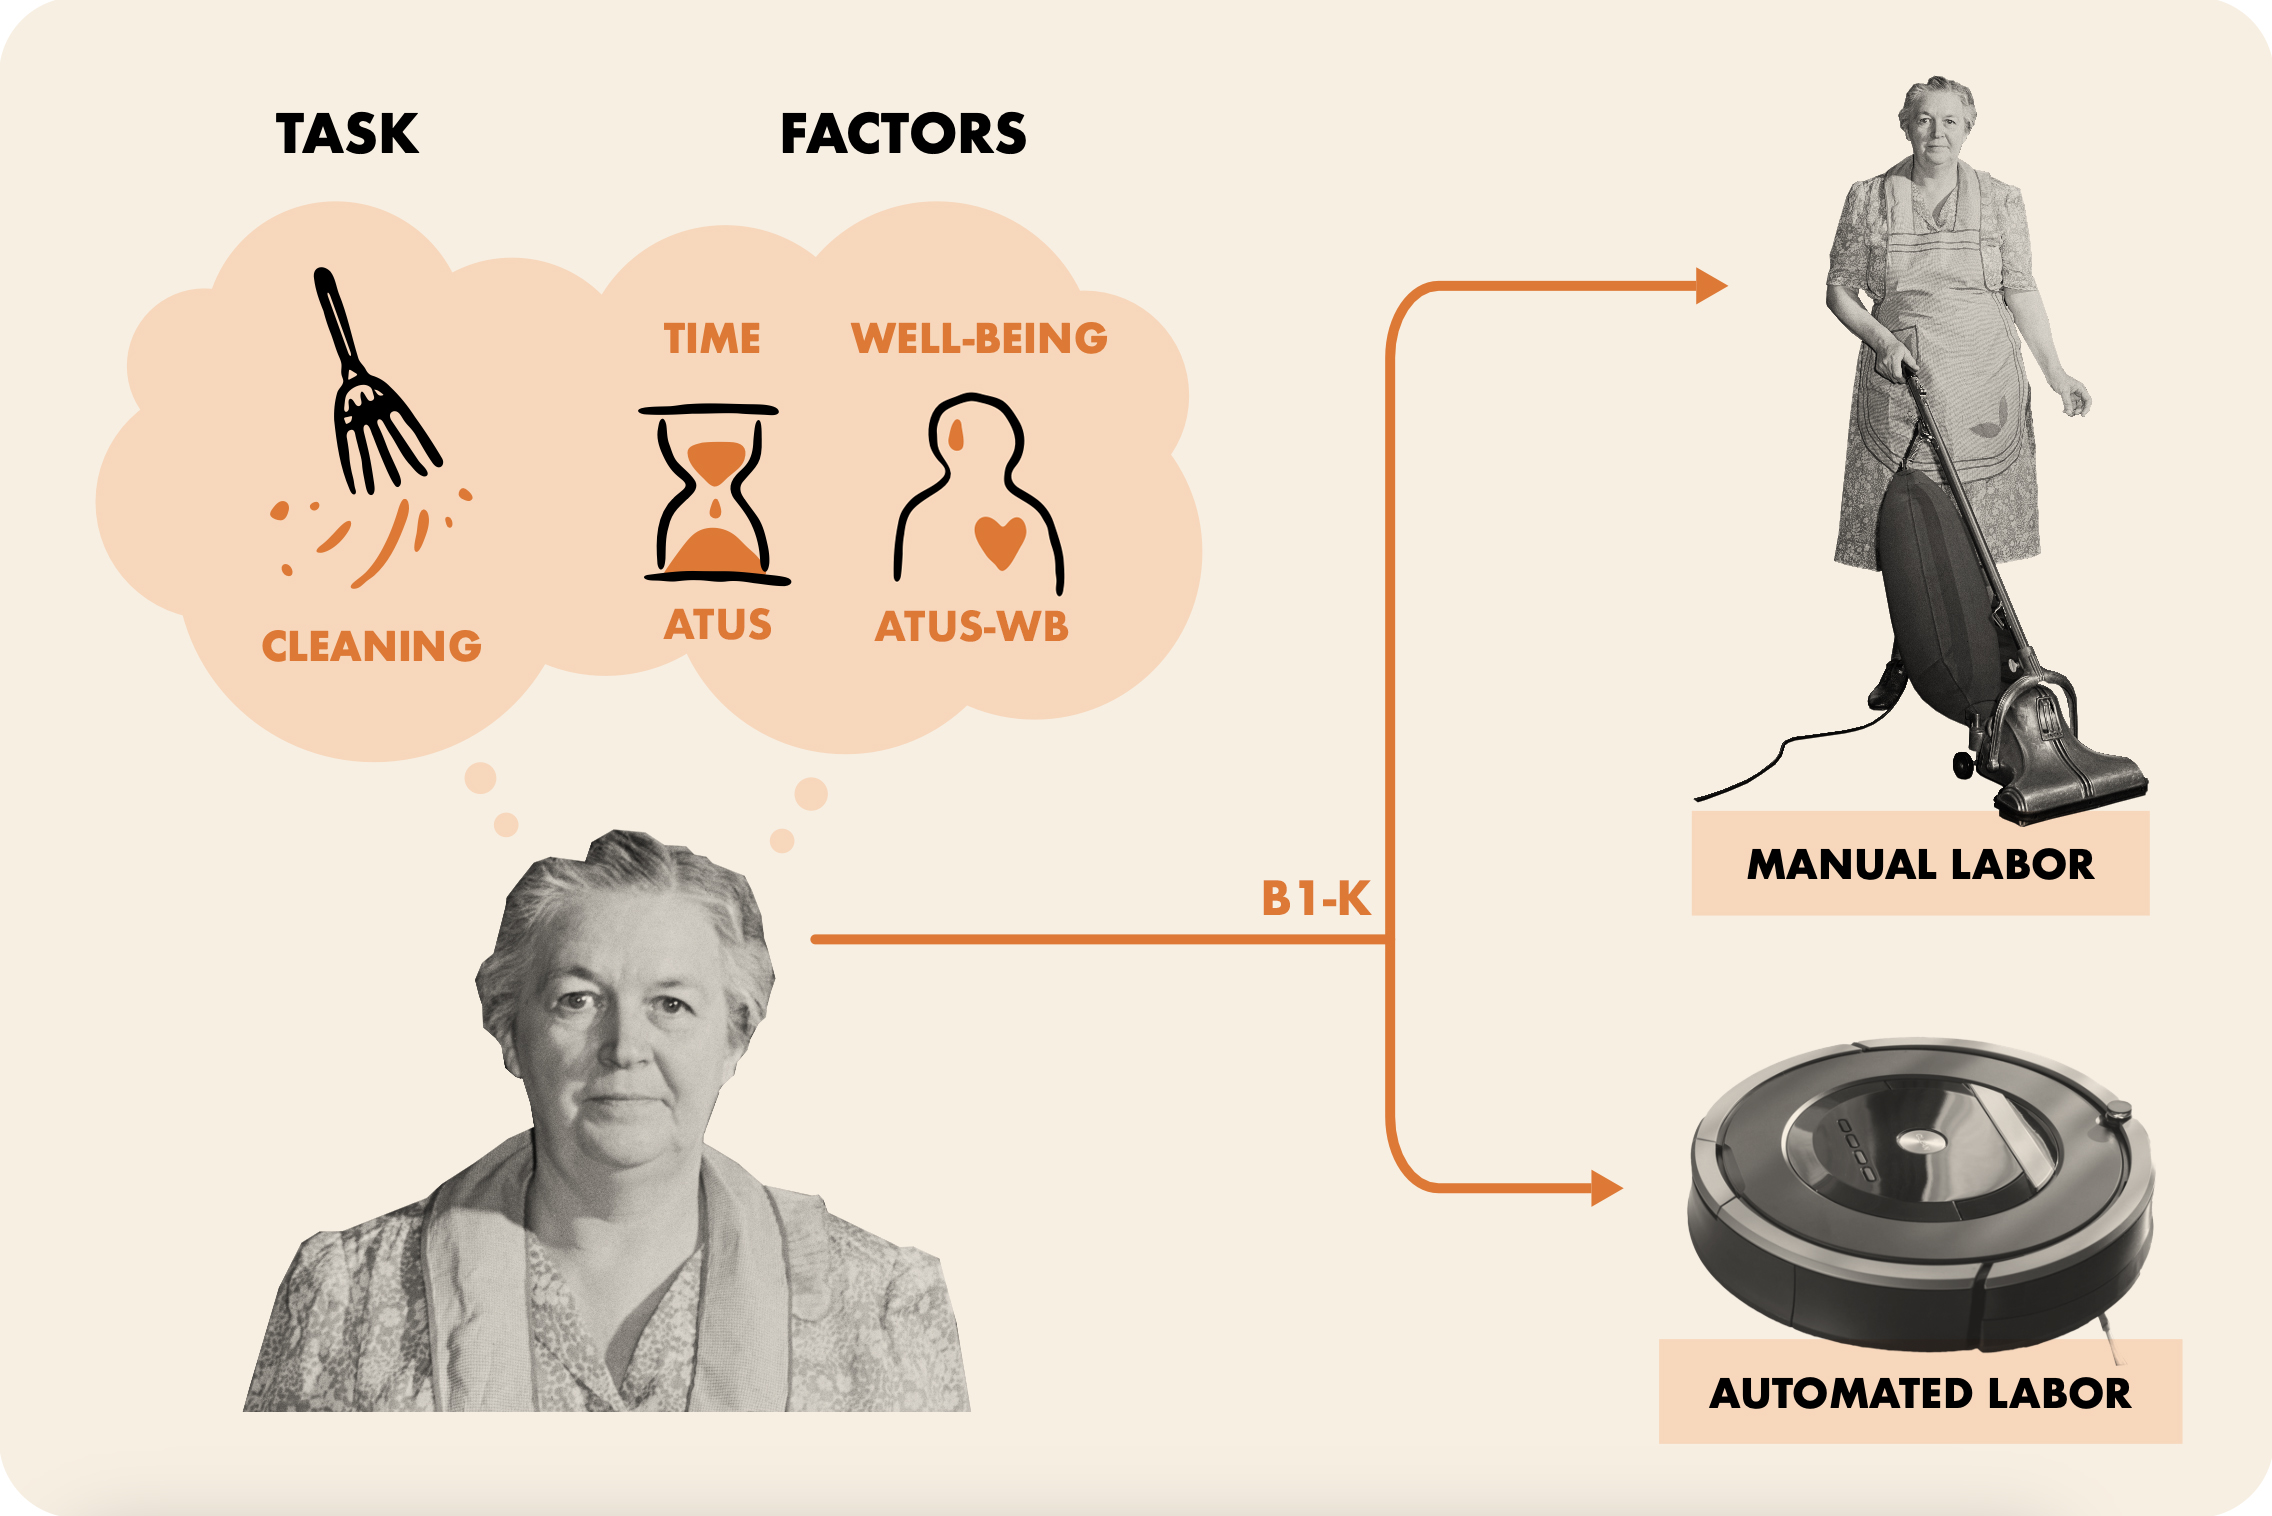
This exploratory study relates task-level preferences for household robot automation to time use and emotional experience, joining three surveys at the activity-category level.
At a glance
Across matched activities, greater desire for robot automation correlates with lower happiness and greater pain, while average time spent shows little association. Some gender-category and income-group patterns differ. These are correlations between aggregated activity rankings from different samples, not evidence that an individual’s emotions cause their automation preferences. Small subgroups, multiple exploratory comparisons, and imperfect category alignment limit how strongly the results can guide design.
1 Introduction
The BEHAVIOR-1K survey [1] identifies tasks people would like robots to perform. This study asks whether preferences align with time burden or feelings during those activities, using the American Time Use Survey [2] and its Well-Being Module [3]. It also compares gender categories and household-income groups.
The intended design implication is to consider unpleasant experiences as well as time savings when choosing domestic robot tasks. Because respondents are not linked across all three sources, the analysis establishes activity-level associations rather than individual motivations or expected product adoption.
2 Literature Review
Domestic-robot studies often identify cleaning and physical chores as desired capabilities, while research on household experience emphasizes enjoyment, meaning, burden, and social relationships. Time-use research describes unequal domestic labor and differences in task type. Robots can also redistribute setup and maintenance work, potentially changing rather than simply removing household responsibilities. The paper draws on feminist human–robot interaction [27] to motivate looking beyond efficiency metrics.
3 Methods
The analysis aligns automation-preference scores, population-average time, and six reported feelings across activity categories. It compares the whole available sample and demographic subsets. The statistical unit is an activity ranking, not a person with jointly observed preference, time, and emotion.
3.1 Hypotheses
Working hypotheses predict that higher time, pain, sadness, stress, and tiredness will accompany more automation desire, while happiness and meaningfulness will accompany less. Additional hypotheses test whether between-group shifts in those rankings align with shifts in automation rankings. These relative-rank questions differ from within-group correlations.
3.2 Research Design
Detailed tasks are mapped to common activity categories before averaging, ranking, and subgroup comparison. Household activities are used for readable main figures, while the appendix retains broader rankings and demographic differences.
3.2.1 Datasets
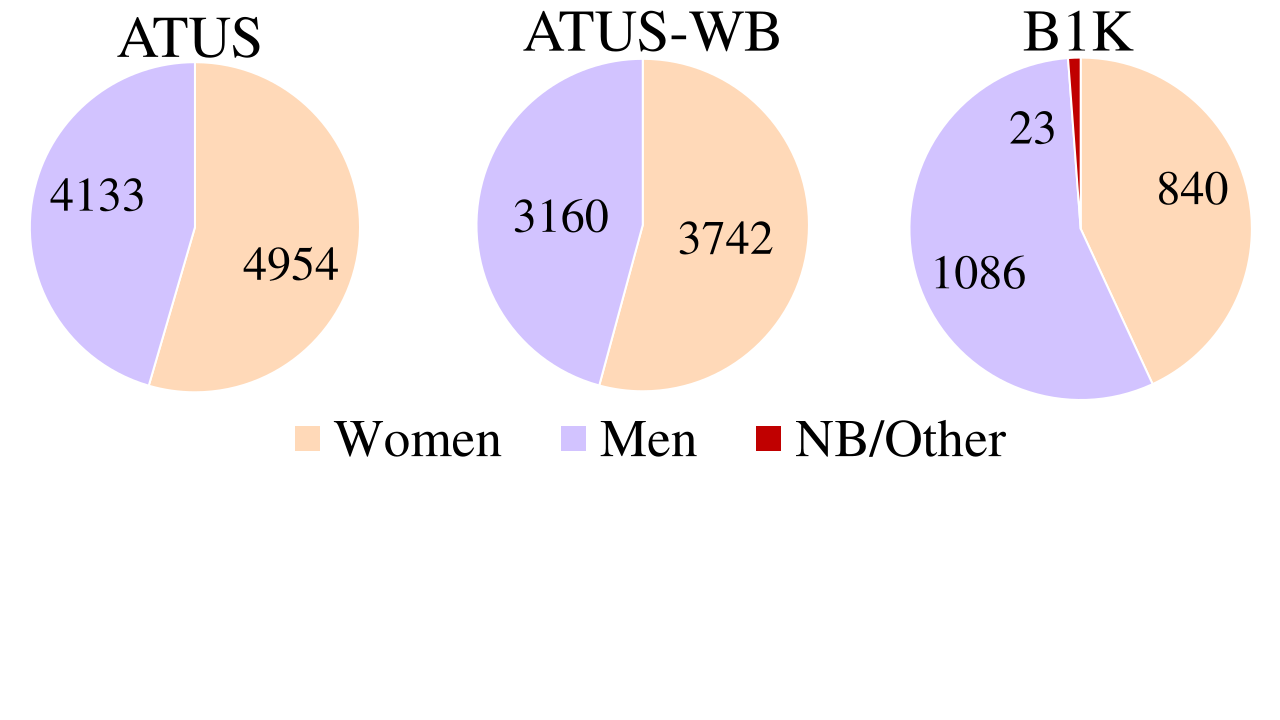
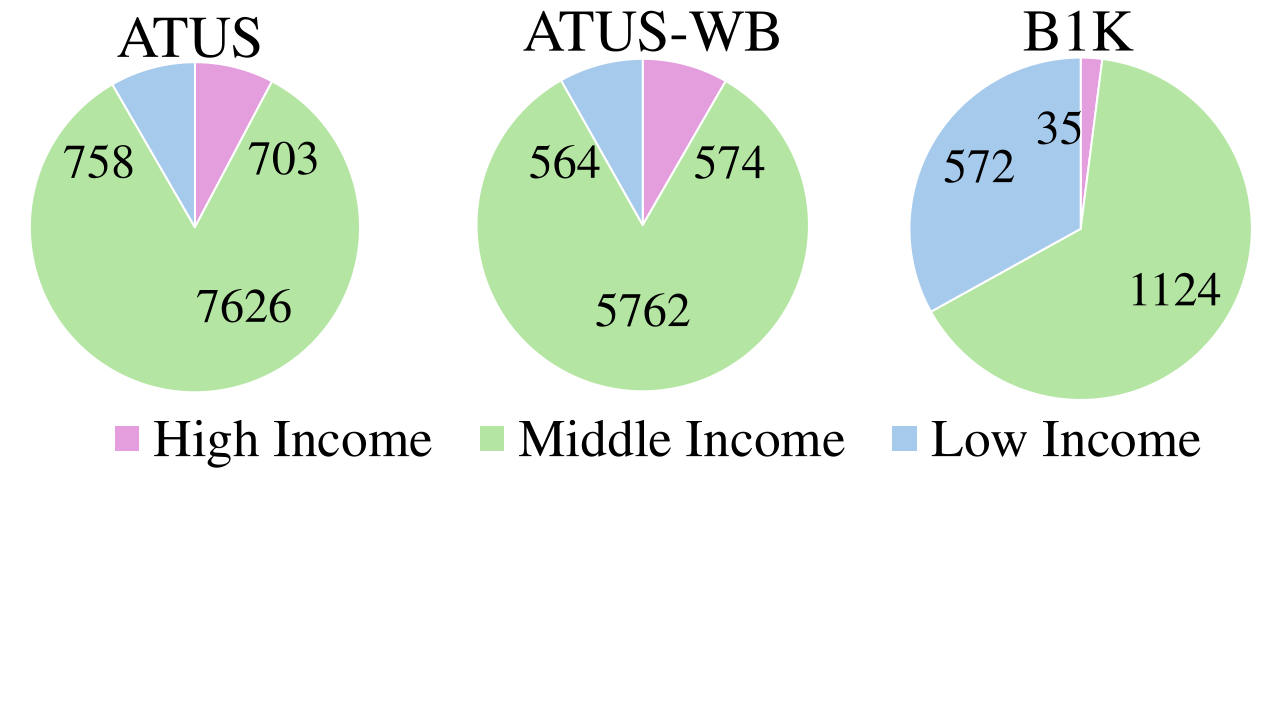
BEHAVIOR-1K contains 1,949 Mechanical Turk participants, each rating fifty tasks from roughly two thousand possibilities on a one-to-ten automation-desire scale. Time-use diaries describe daily activities, and the wellbeing module asks about six feelings during three activities from the previous day on zero-to-six scales. Fine-grained robot tasks are manually assigned to broader time-use categories. Paid main-job work is excluded. Feelings rely on respondents’ ordinary interpretations rather than further operational definitions.
 |
 |
 |
 |
 |
 |
 |
 |
3.2.2 Dependent Variables
Automation desire averages task ratings within an activity category. Time is averaged over the population, including zero for people who did not perform an activity, so it combines participation frequency and duration rather than measuring only the burden on participants. Feelings average available activity ratings. These separate aggregates do not describe the same individuals, and the method description does not clearly document survey-design weighting or uncertainty propagation through category averages.
3.2.3 Independent Variables
The study aligns self-reported men/women categories in BEHAVIOR-1K with binary sex responses in time-use data. The authors acknowledge that these measure different constructs and omit adequately analyzing gender-diverse respondents. Income groups use household size, census poverty thresholds, and a Pew-based high-income boundary. BEHAVIOR-1K is approximately 64.9% middle-income, 33.0% low-income, and only 2.0% high-income, making the last group particularly limited.
3.3 Measures
Spearman and Kendall correlations compare descending activity rankings. The paper uses a p-value threshold below 0.05 and also correlates between-group changes in rank. The many variable/group comparisons are exploratory; no multiple-comparison adjustment is reported. A nonsignificant result does not establish independence, and a p-value is not the probability that the null hypothesis is true. Rank correlations also do not estimate the size of a causal effect or validate a predictive model.
4 Results
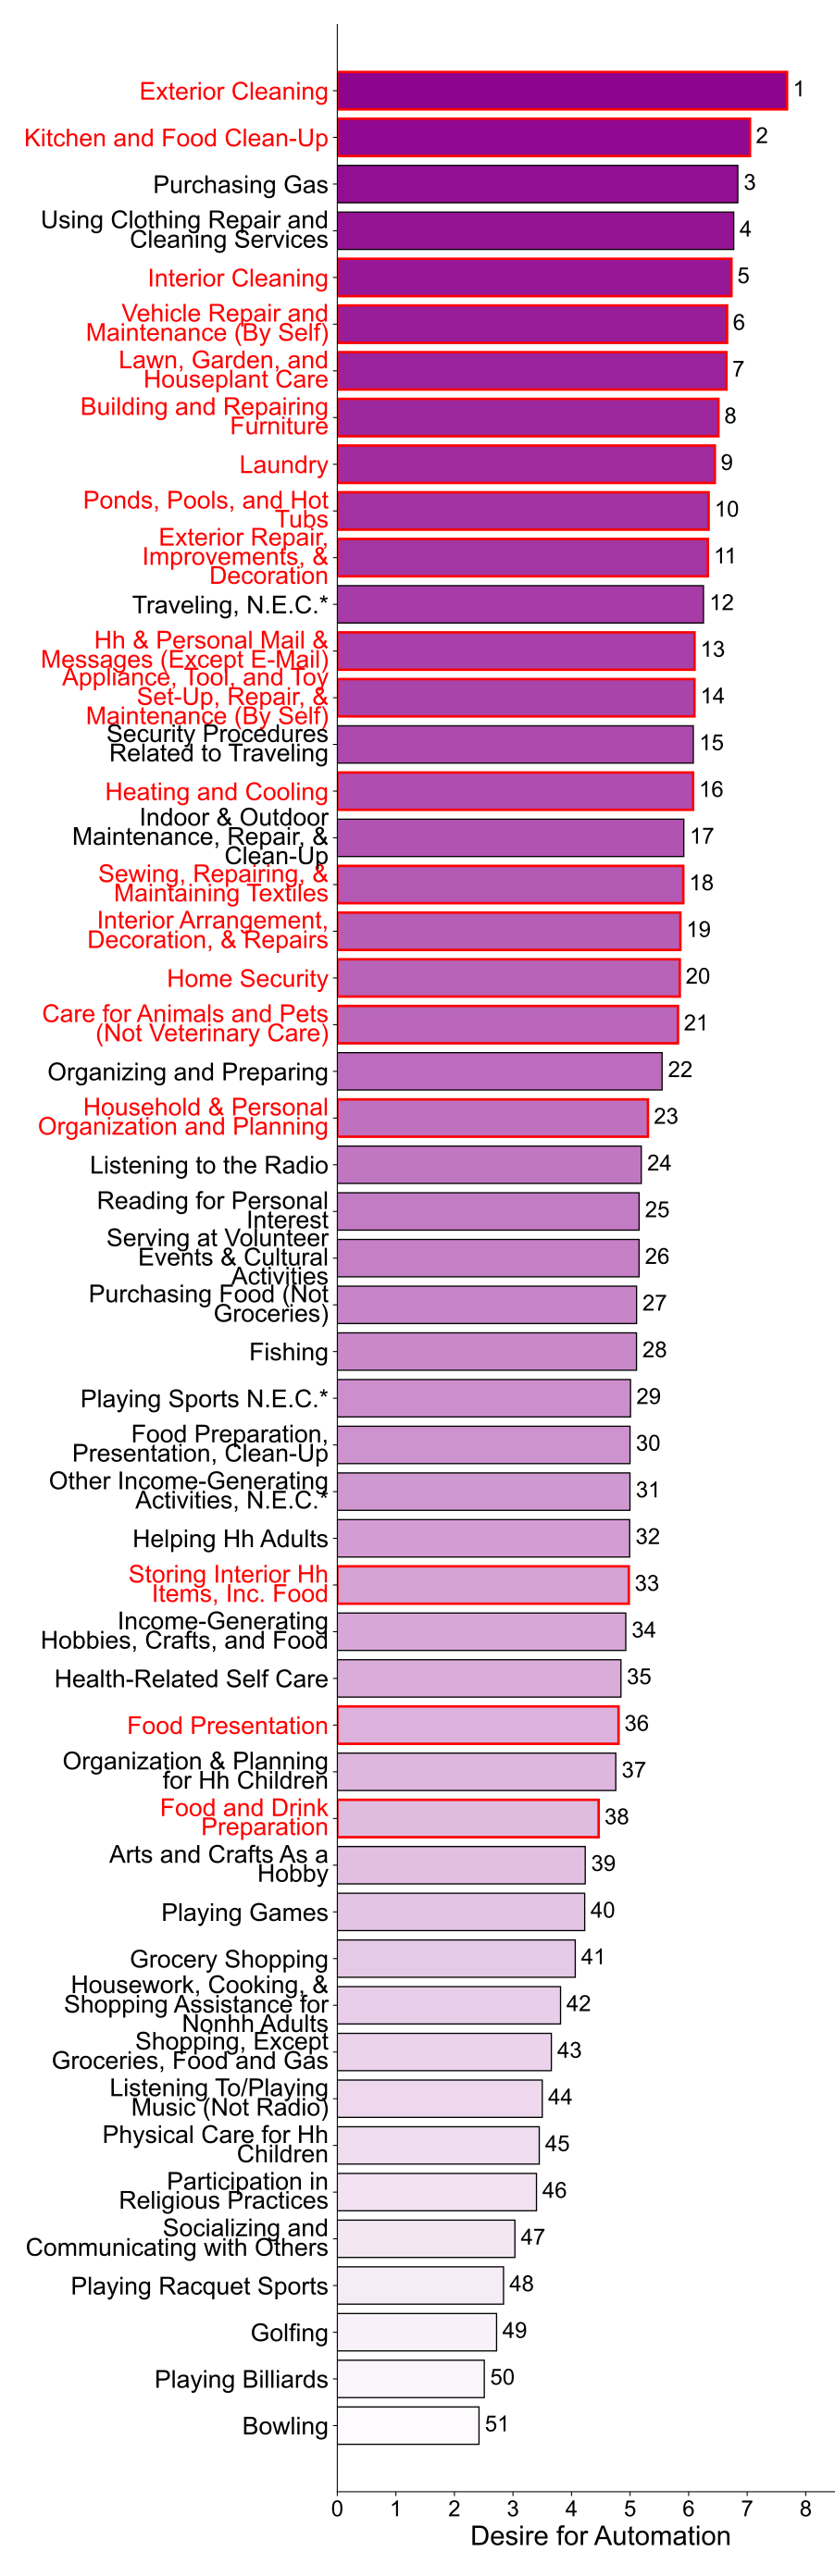
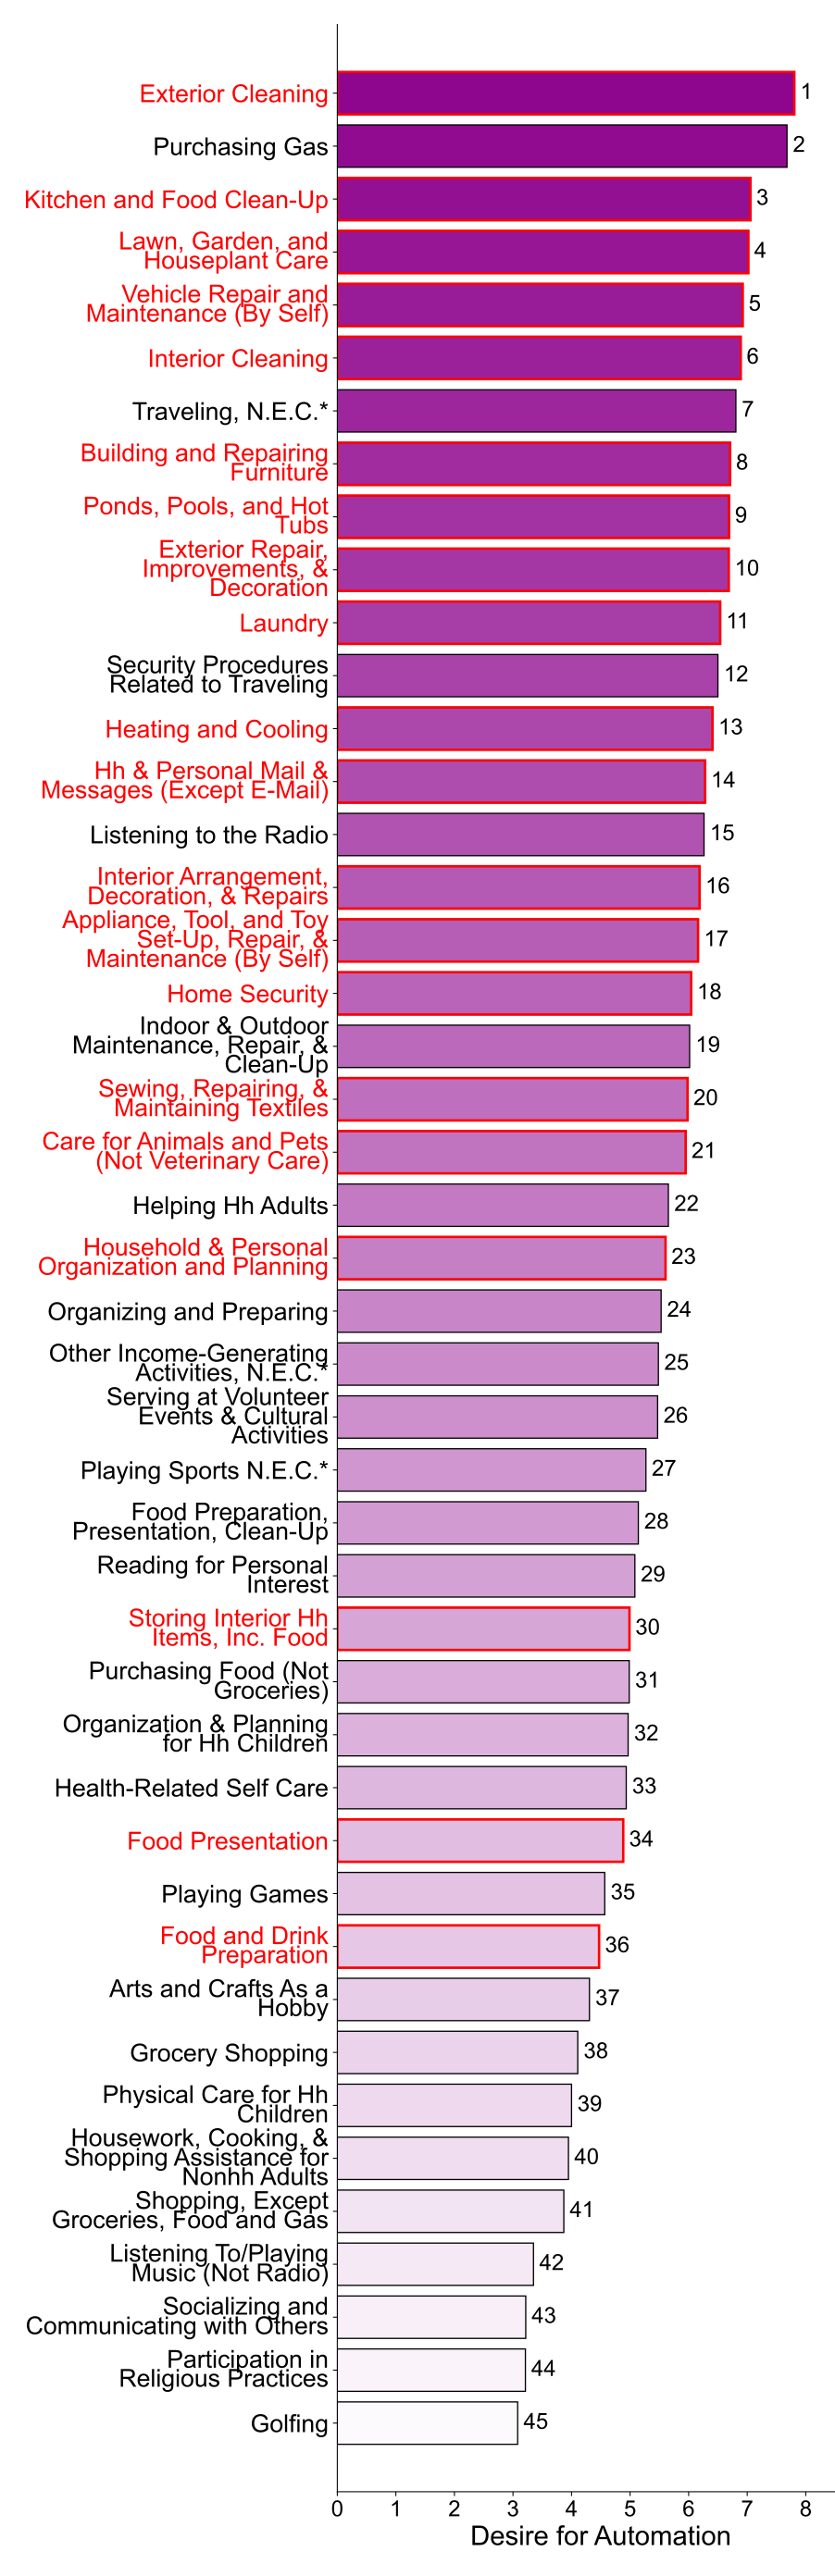
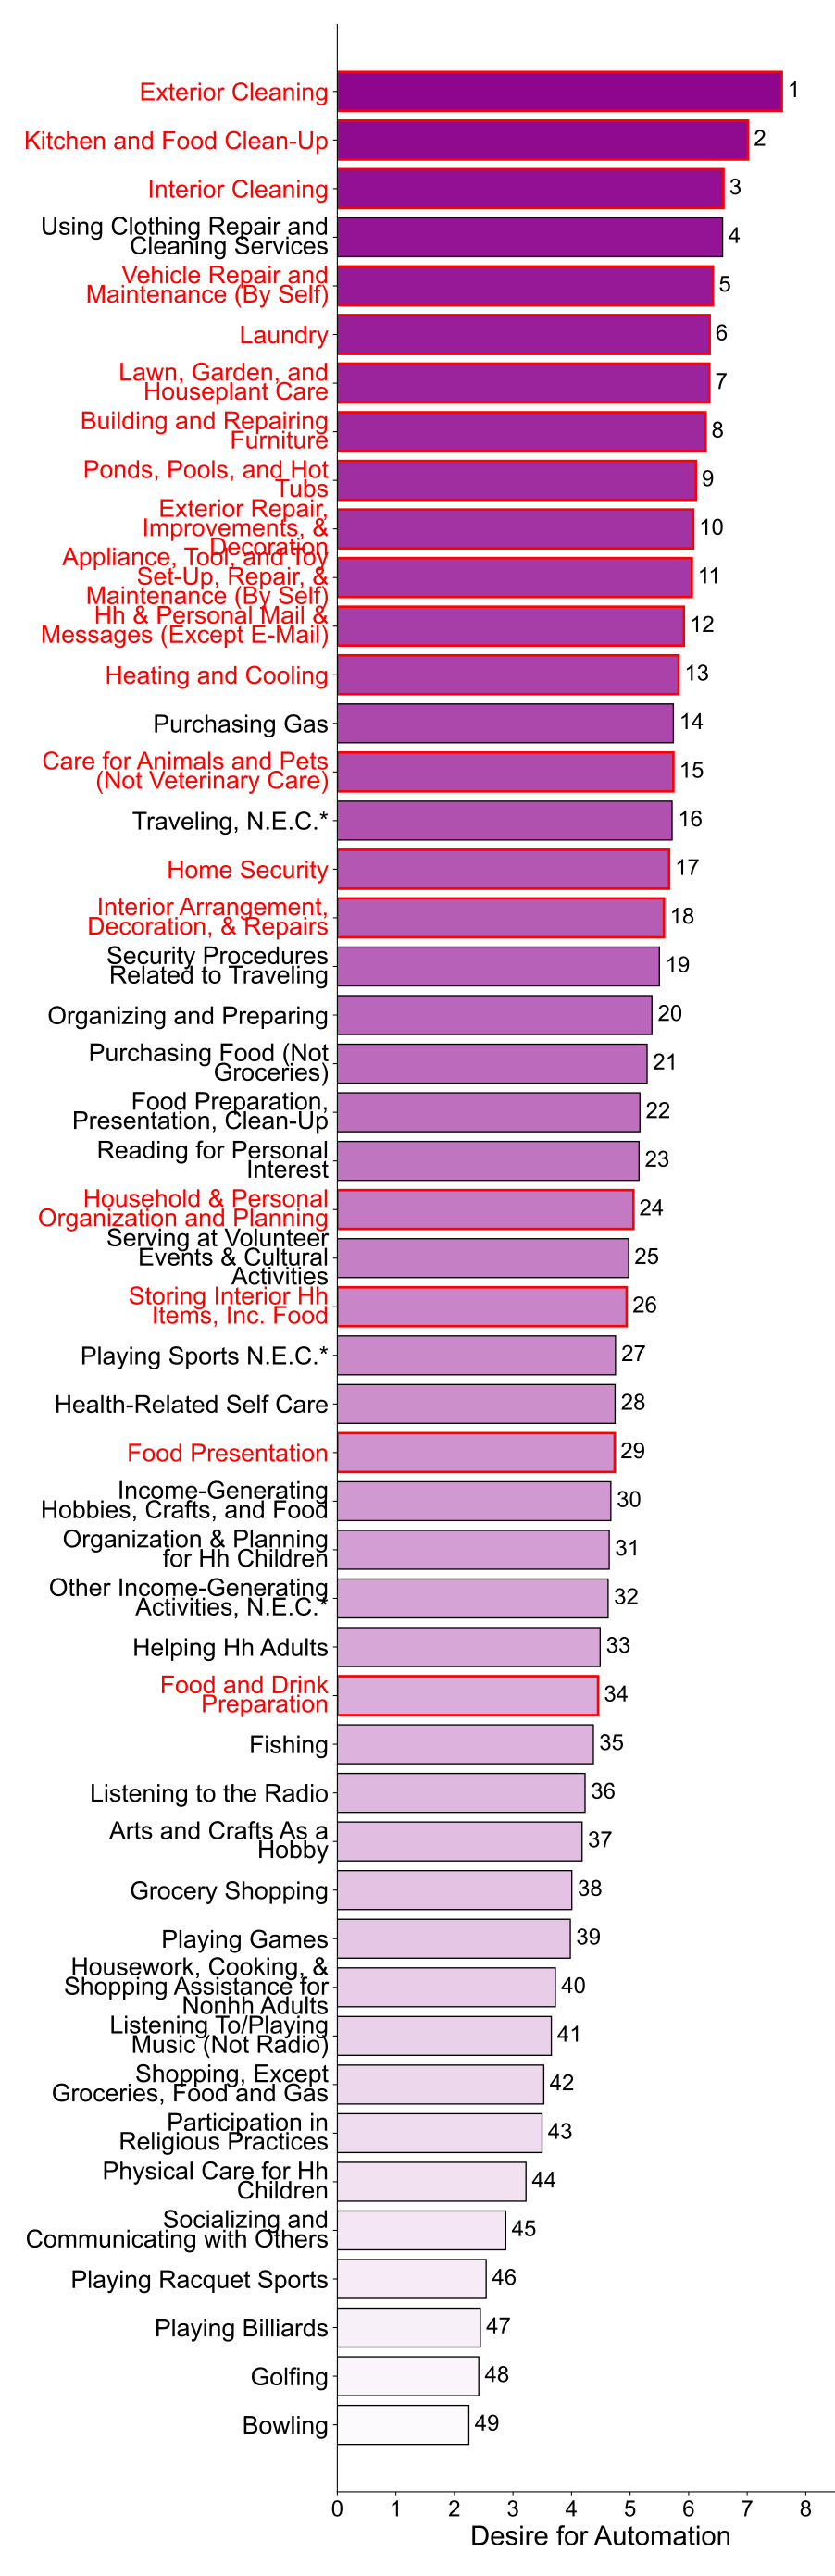
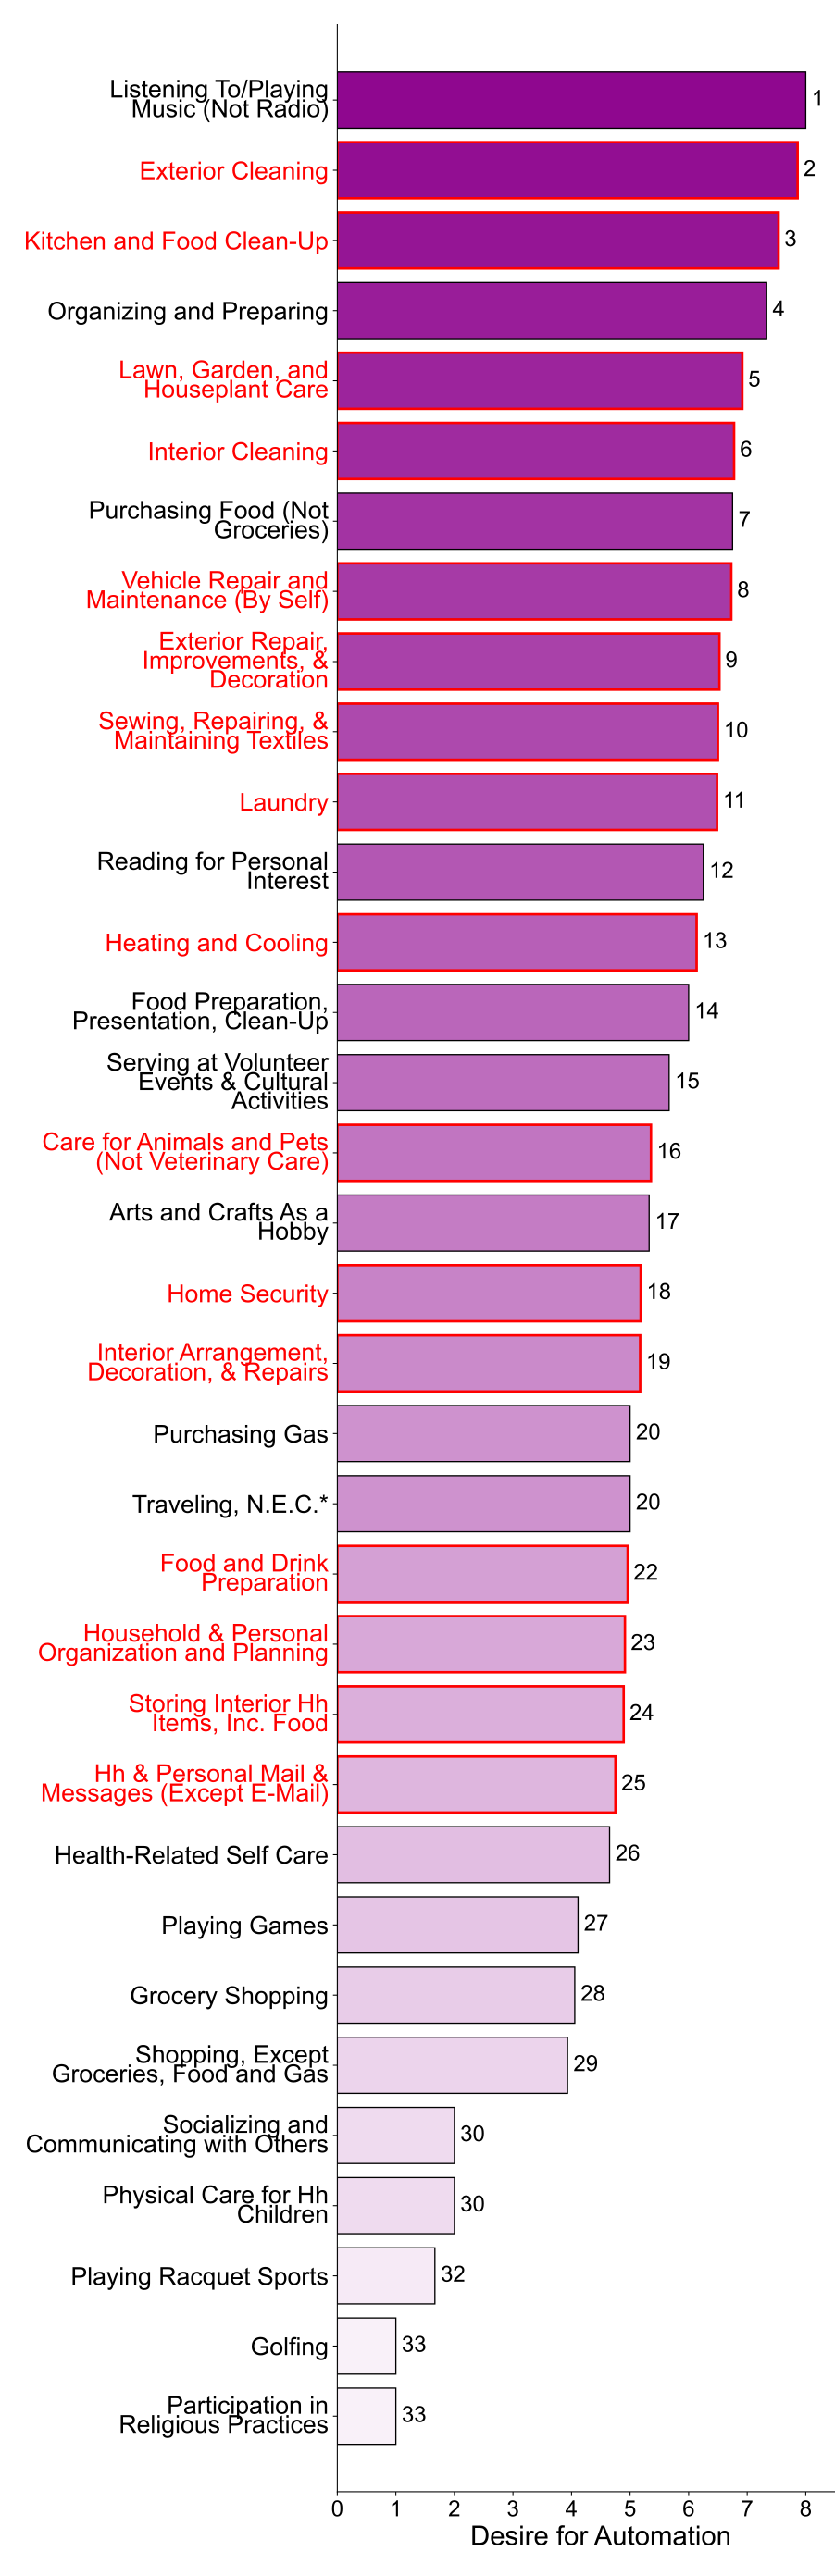
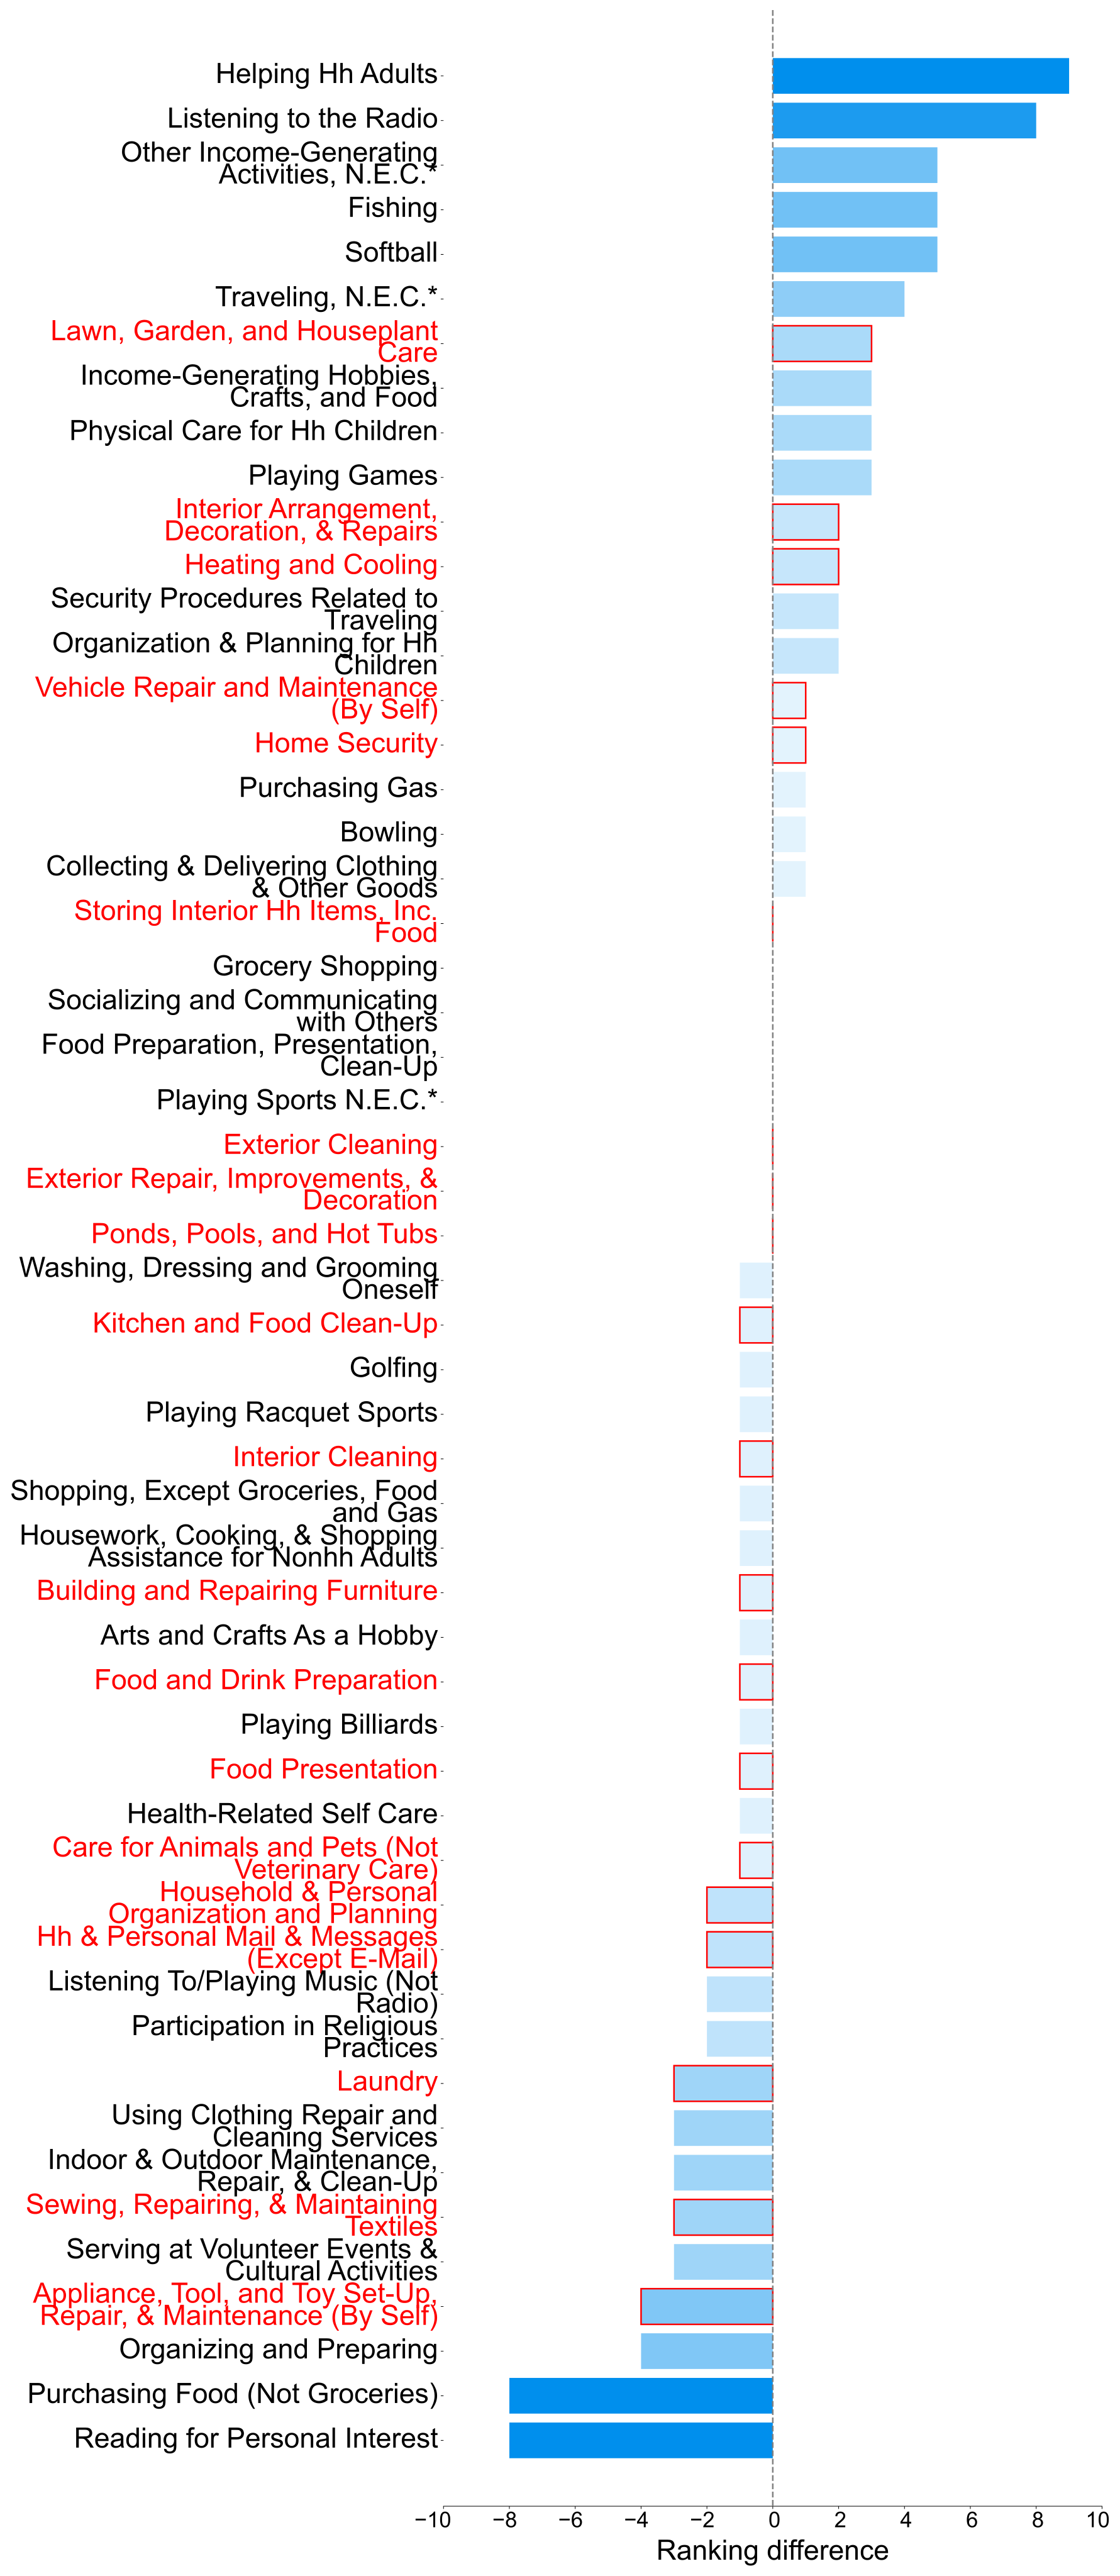
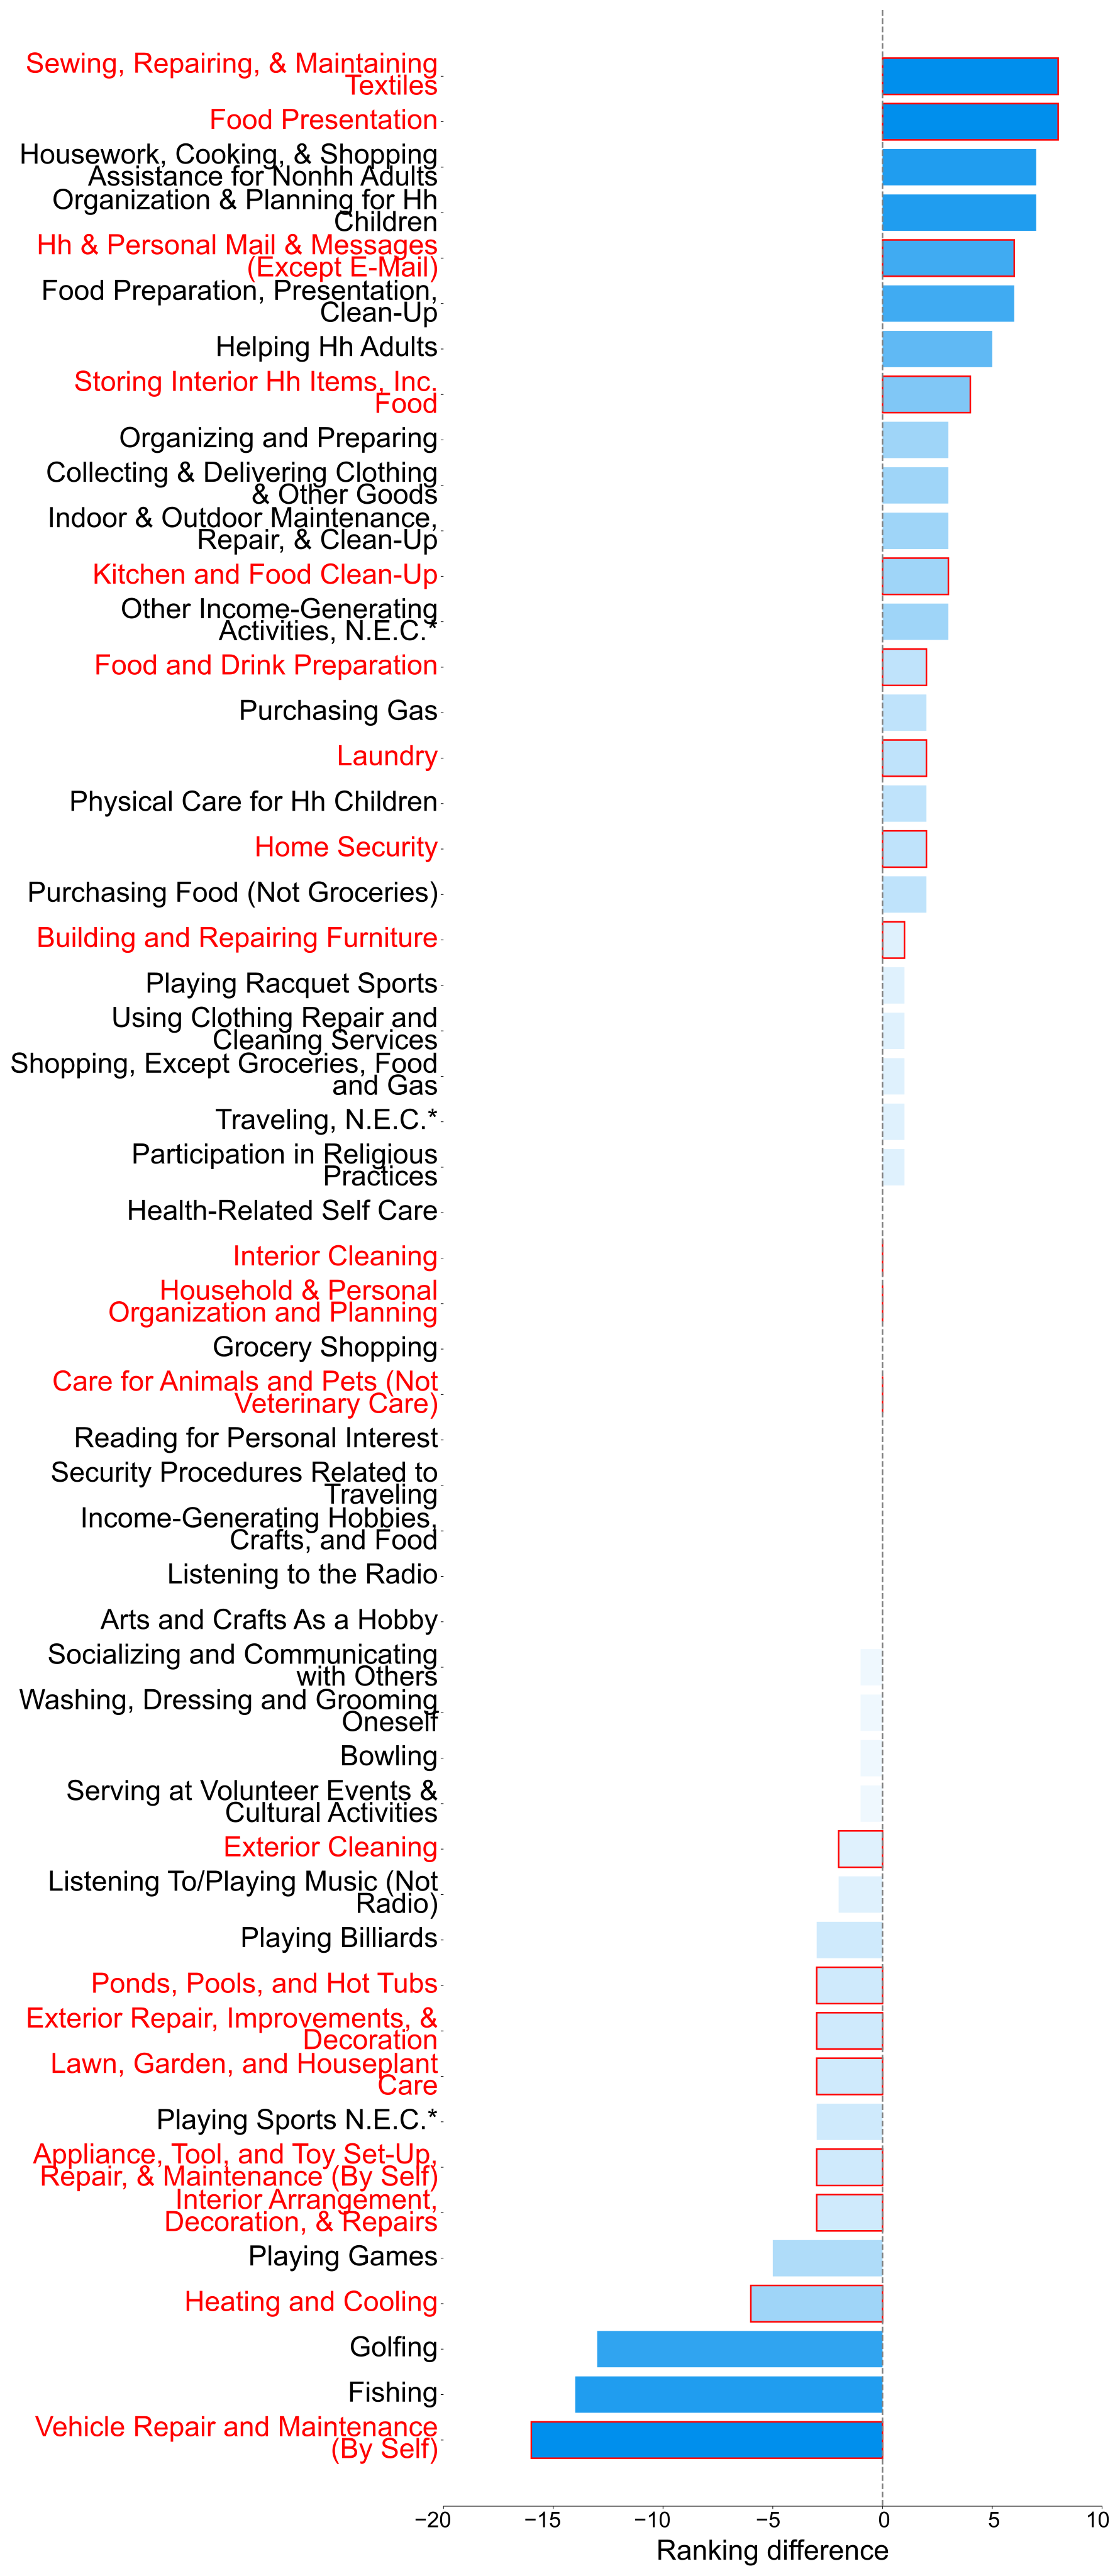
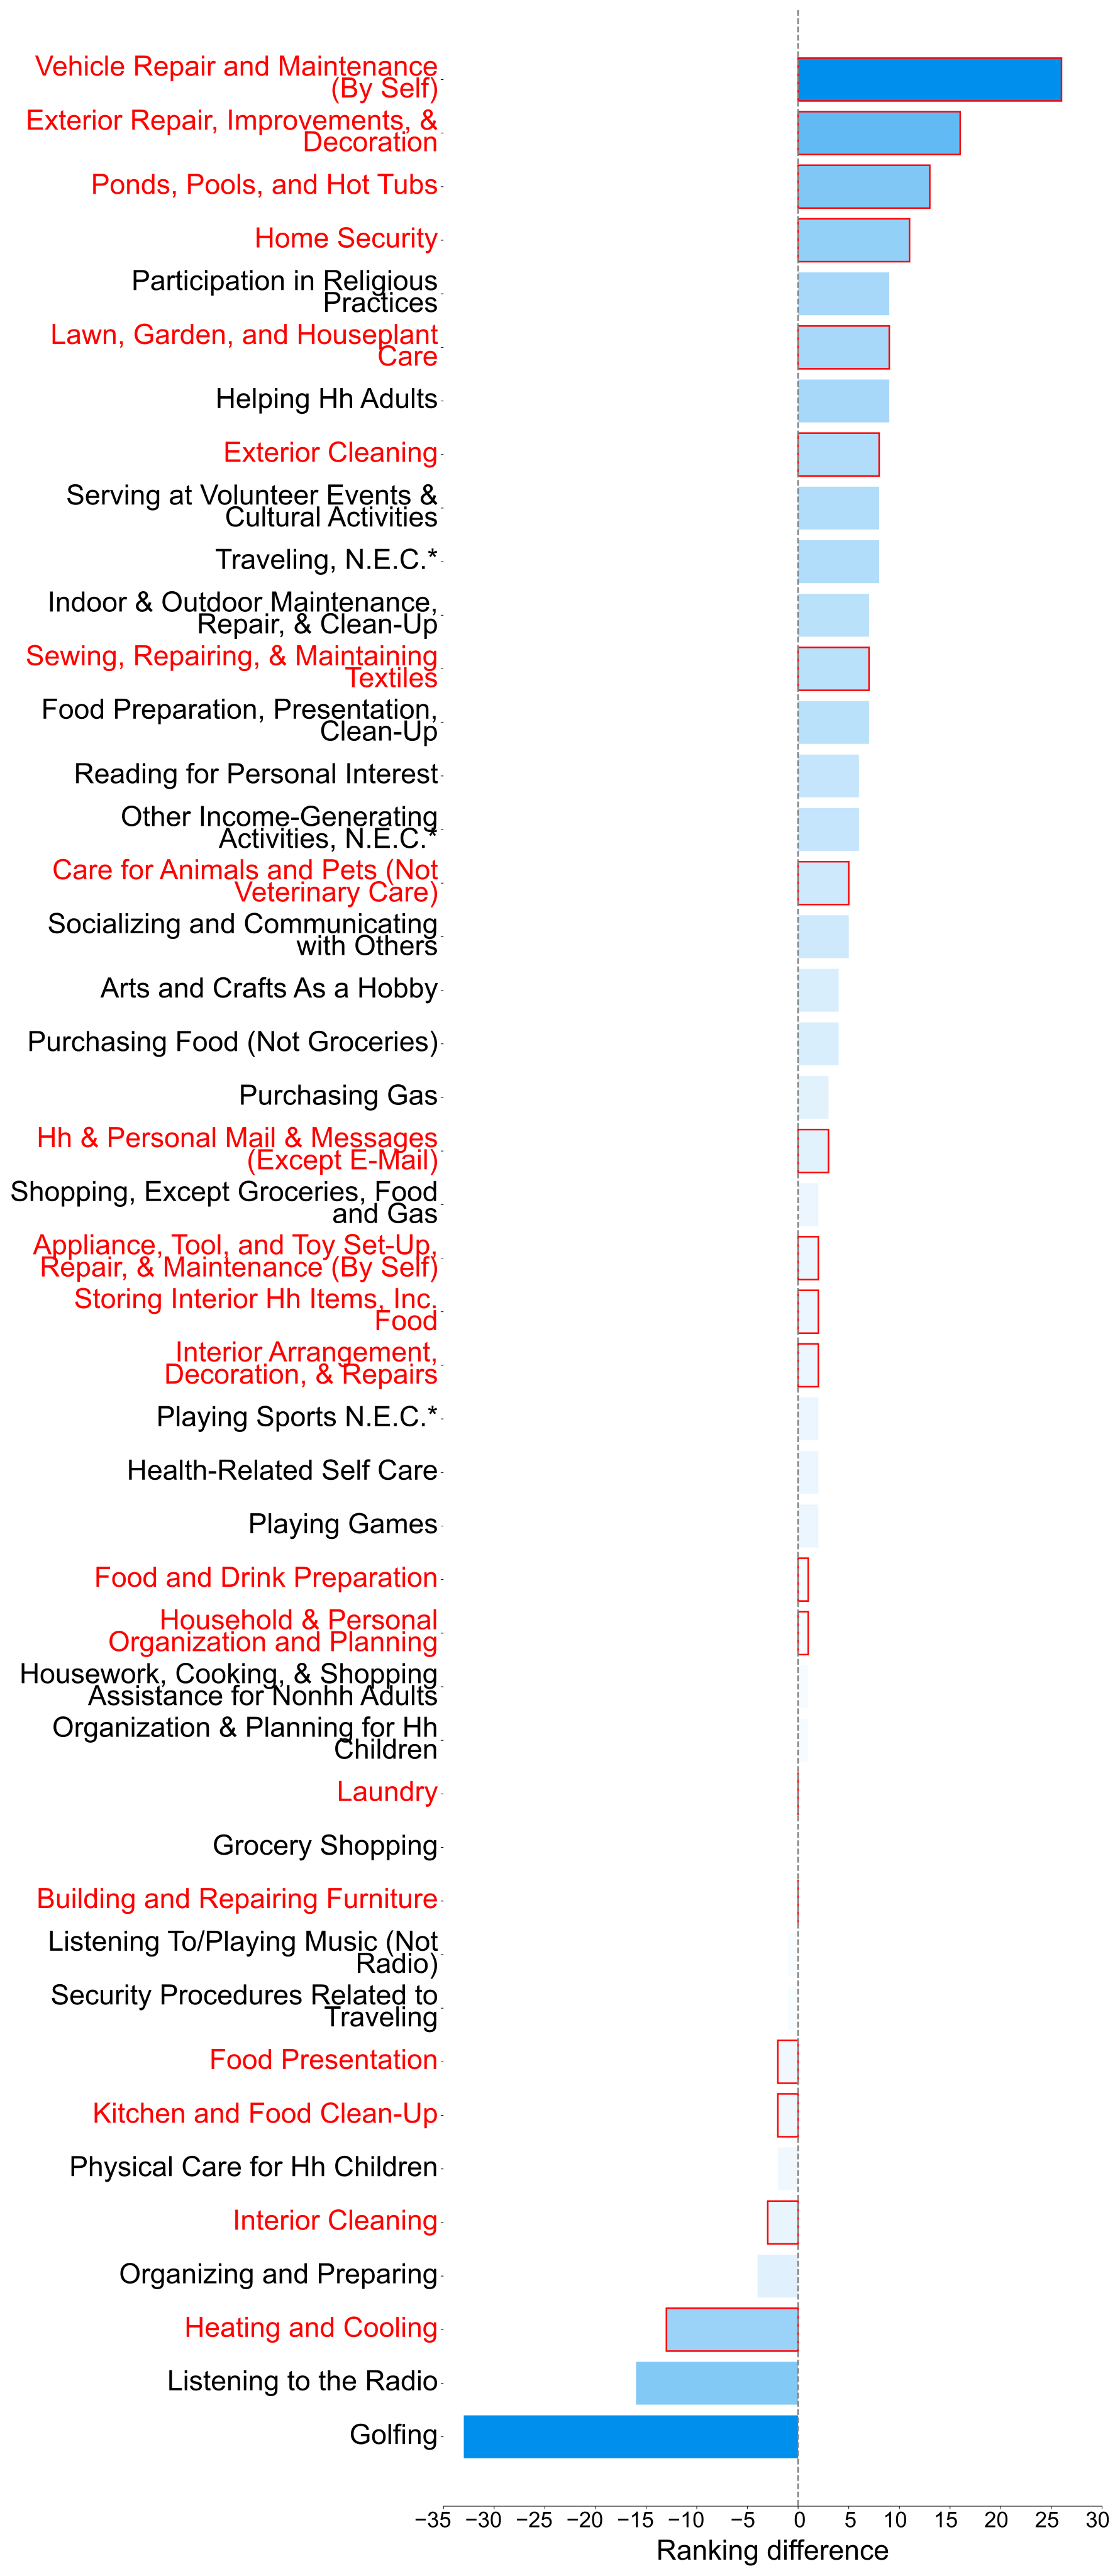
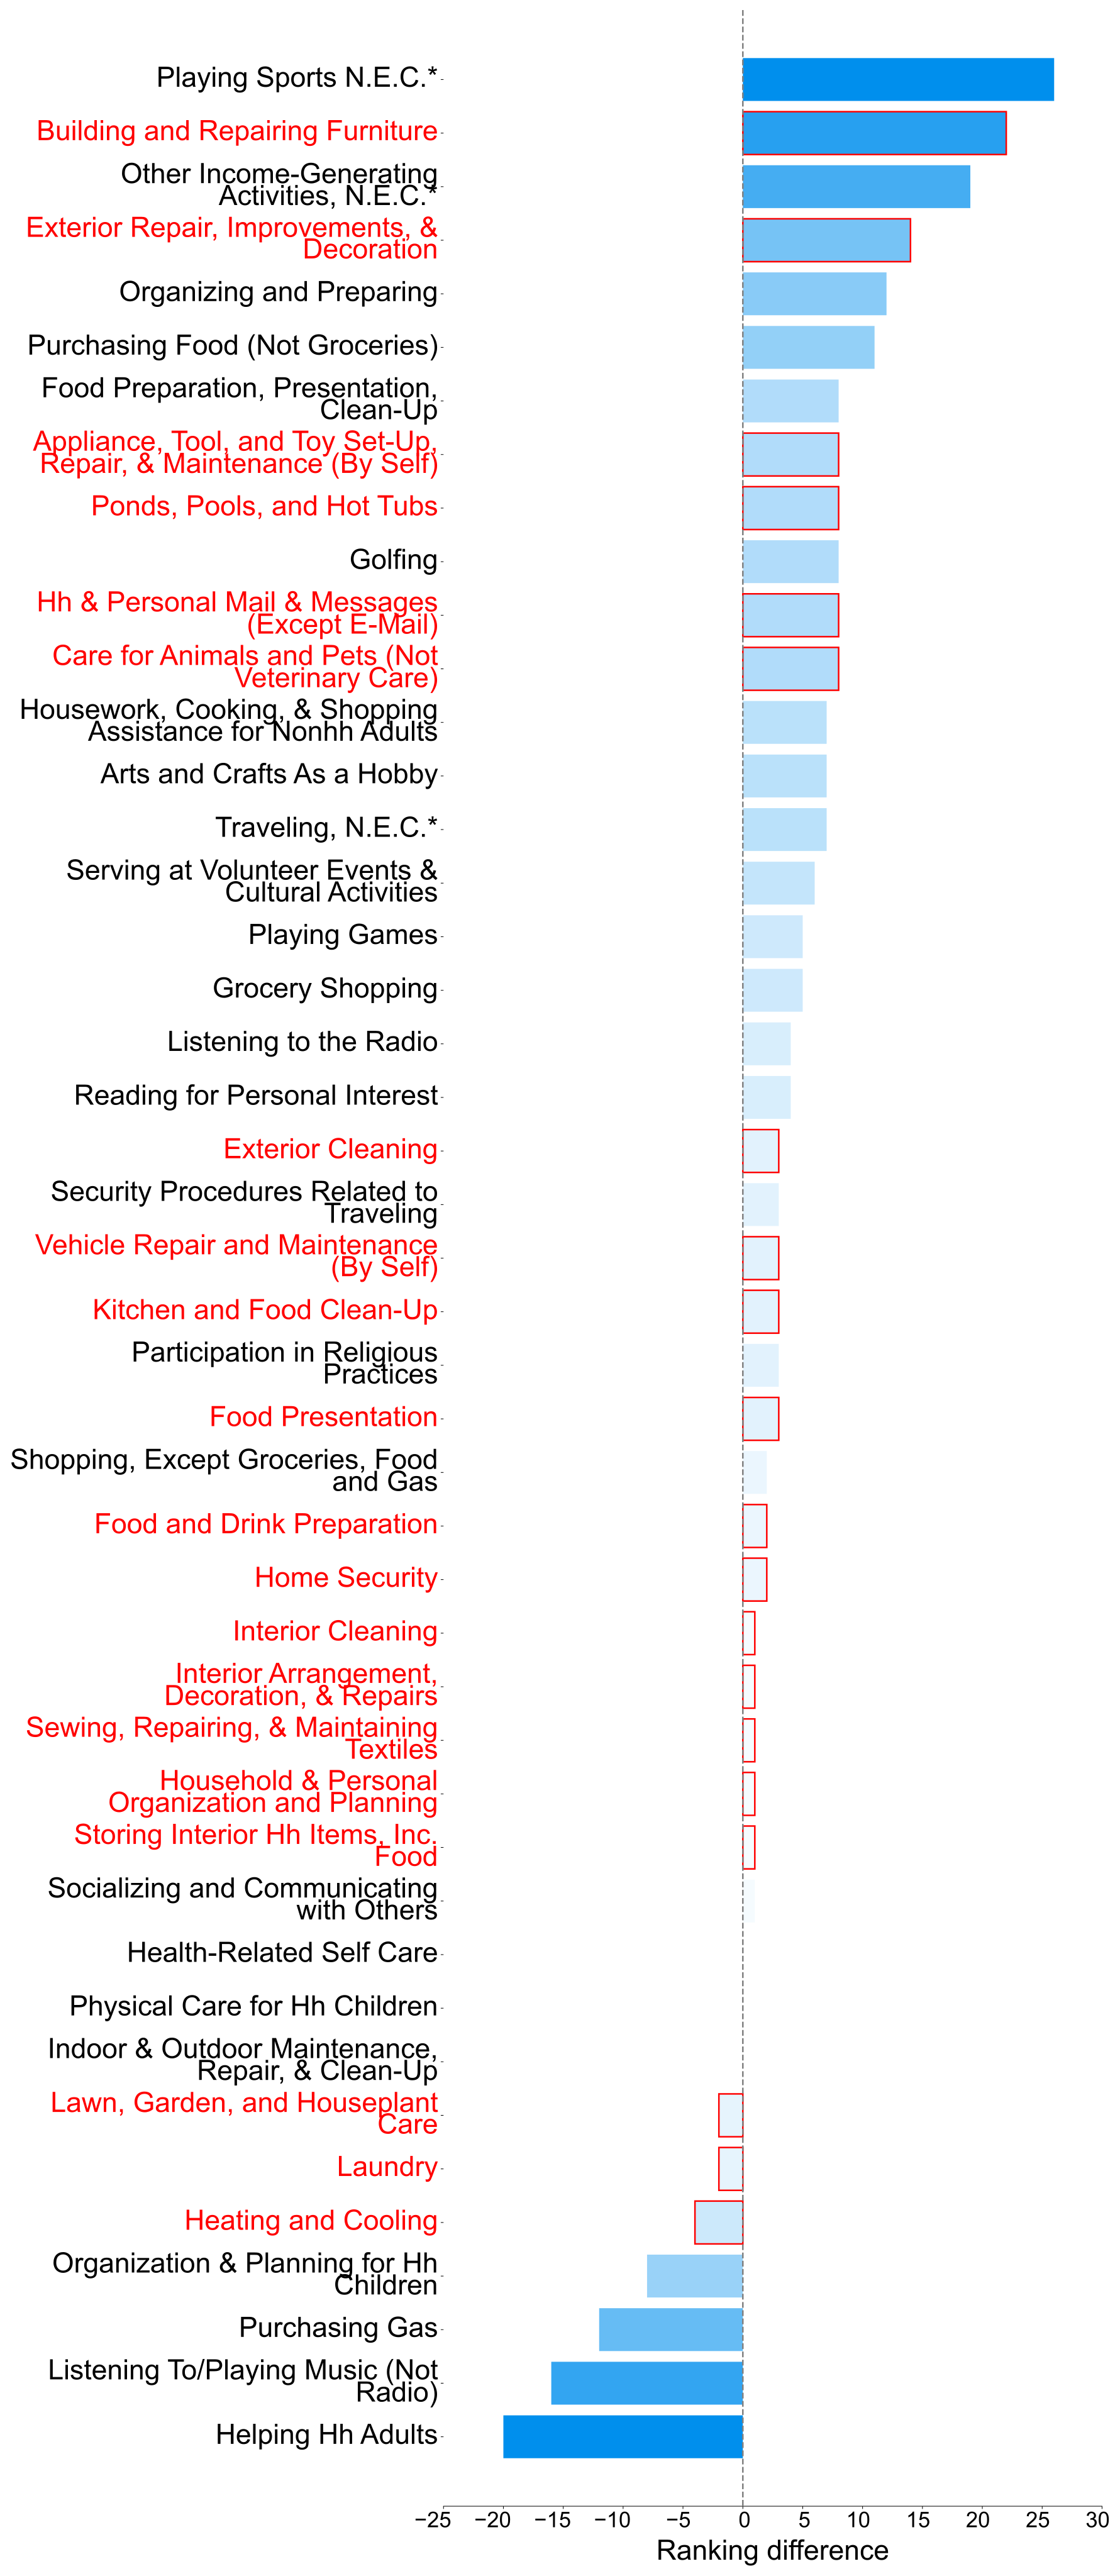
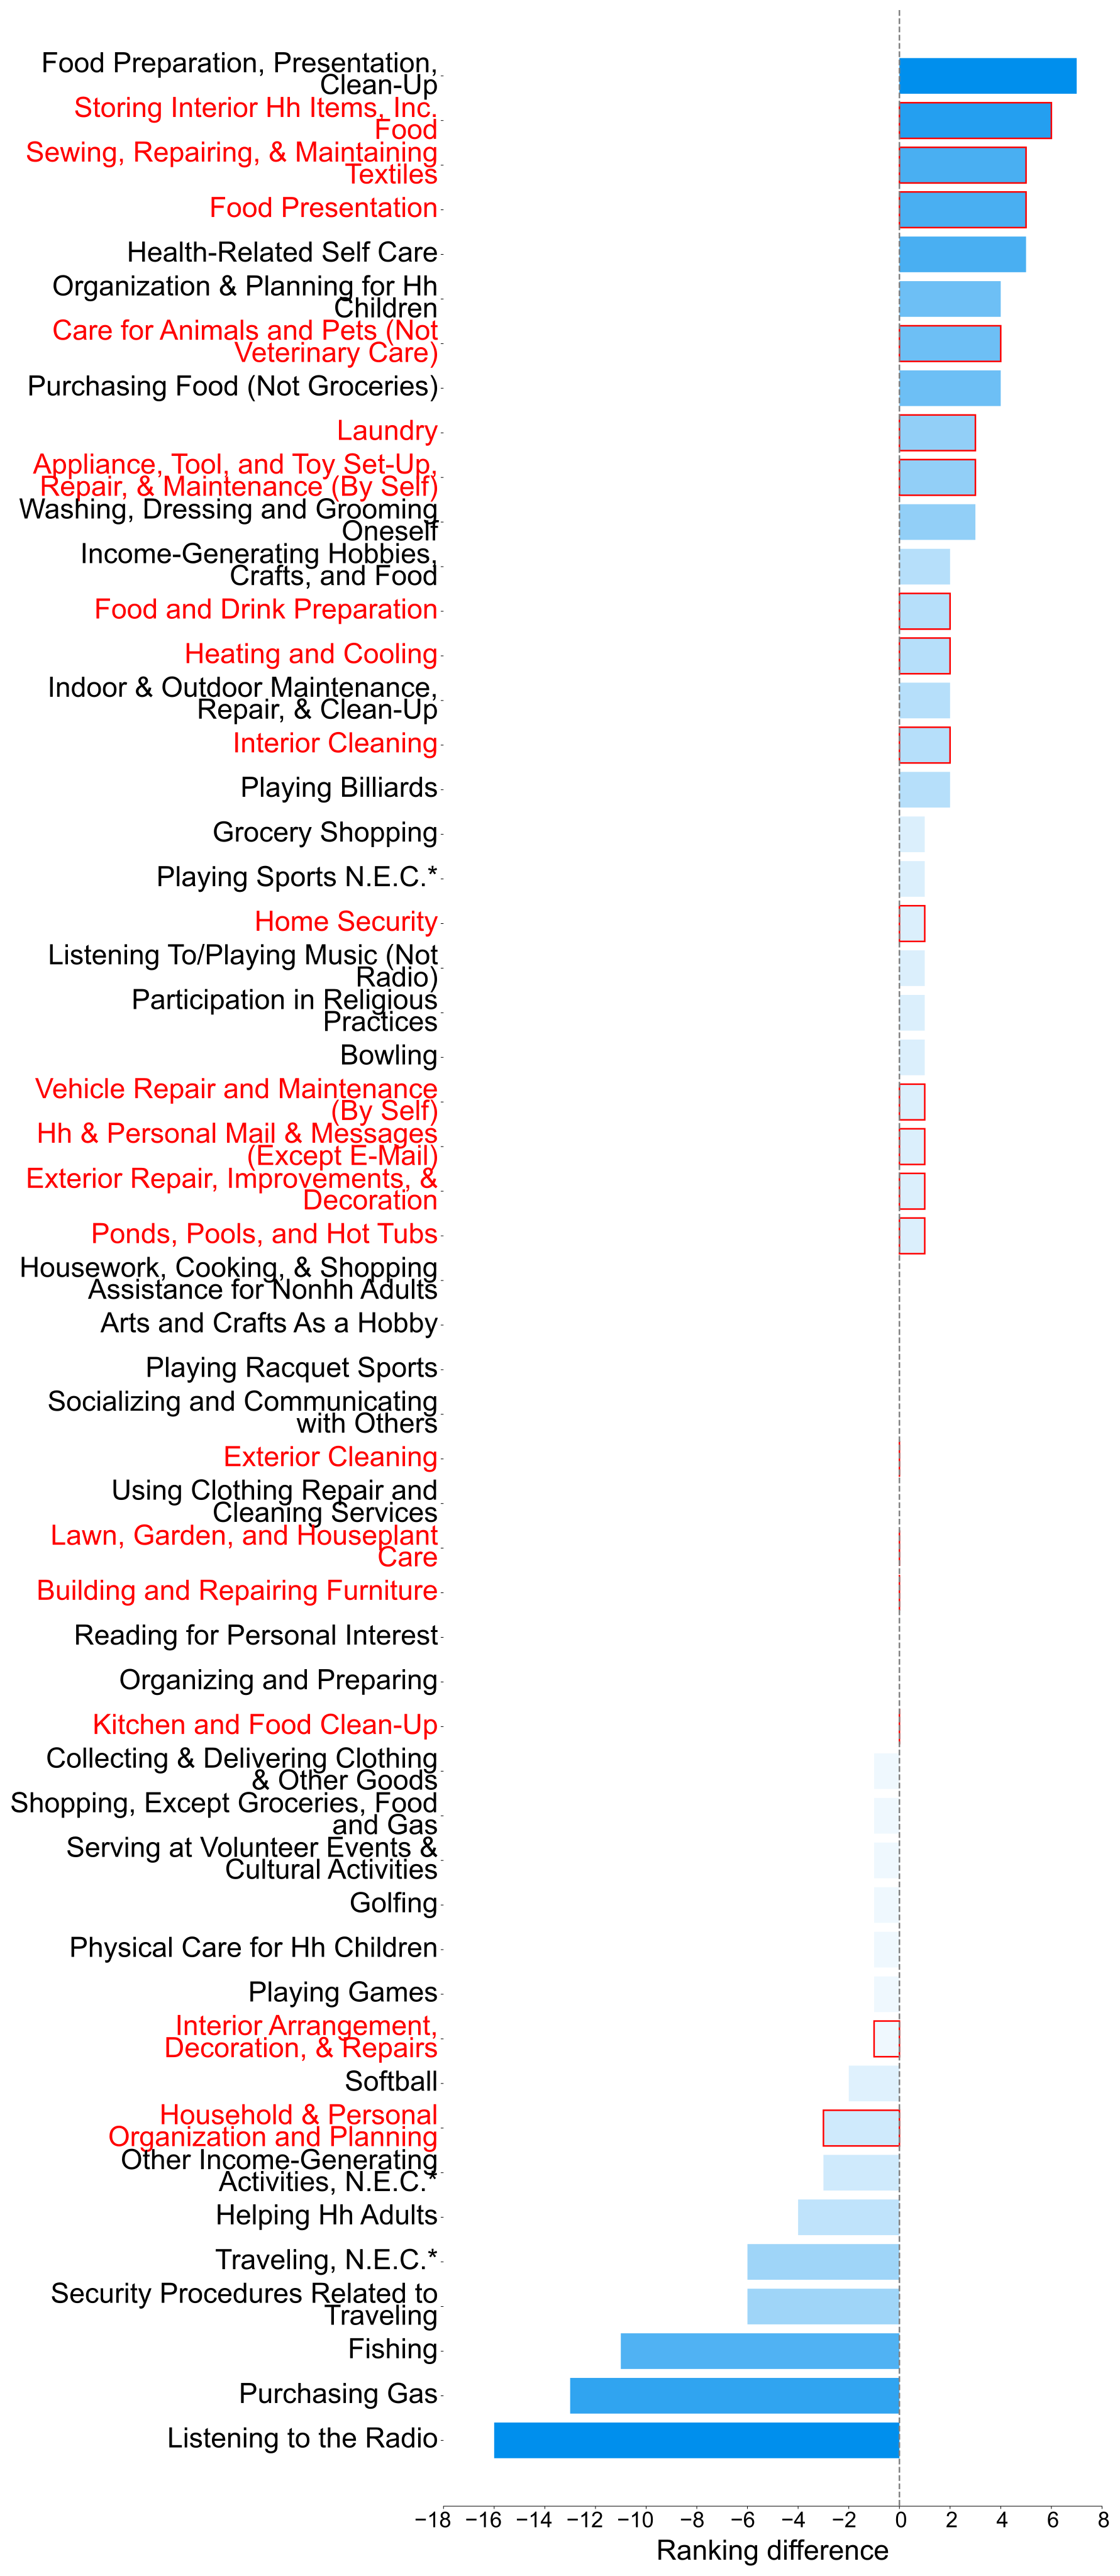
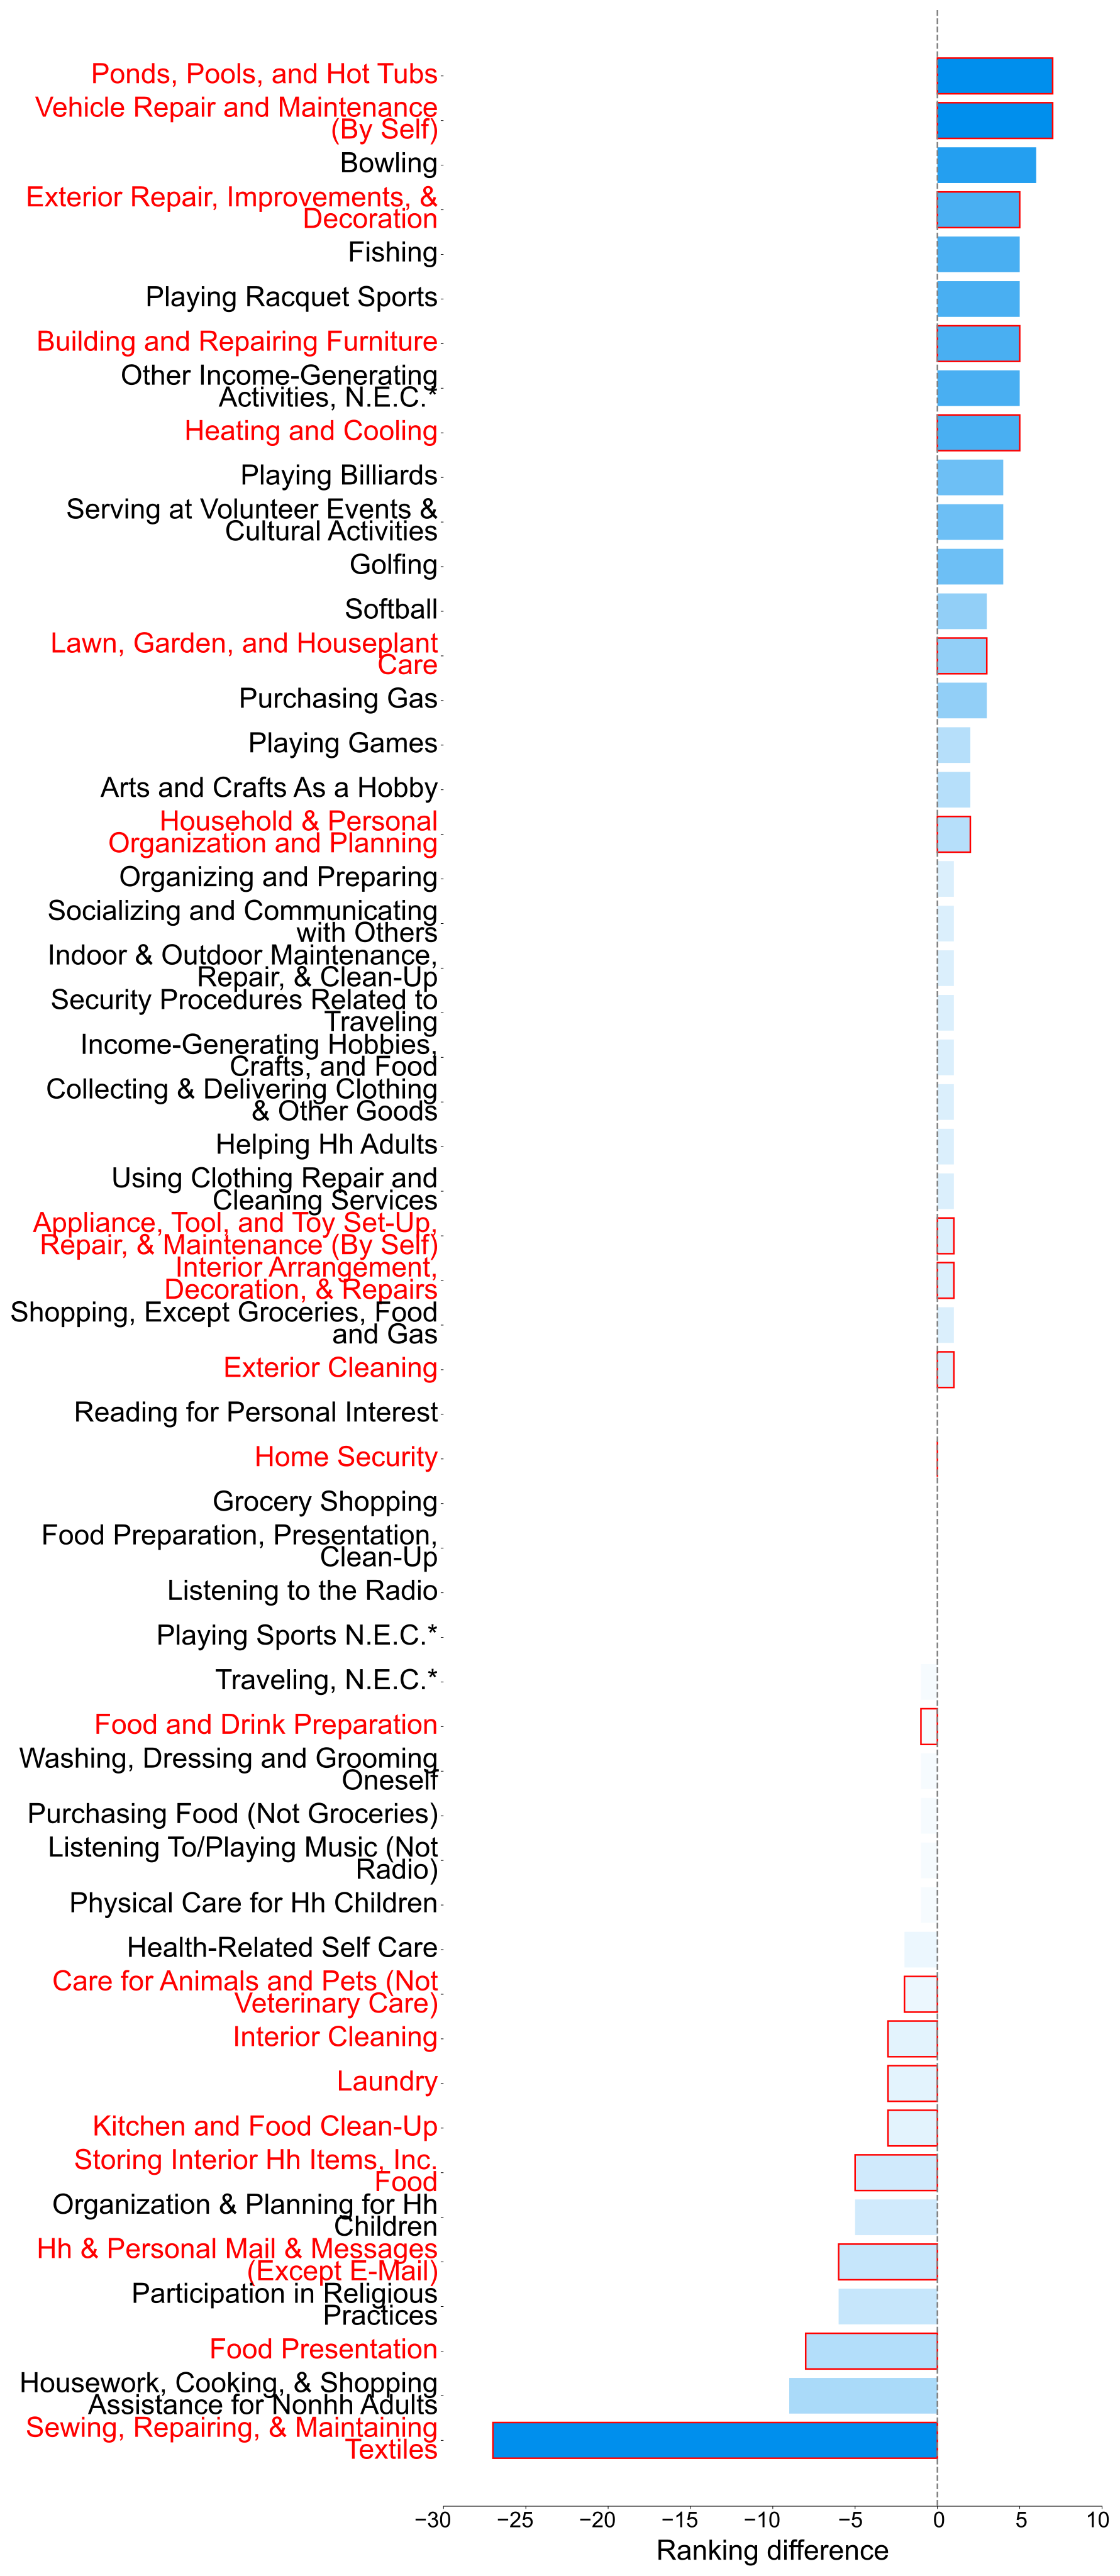
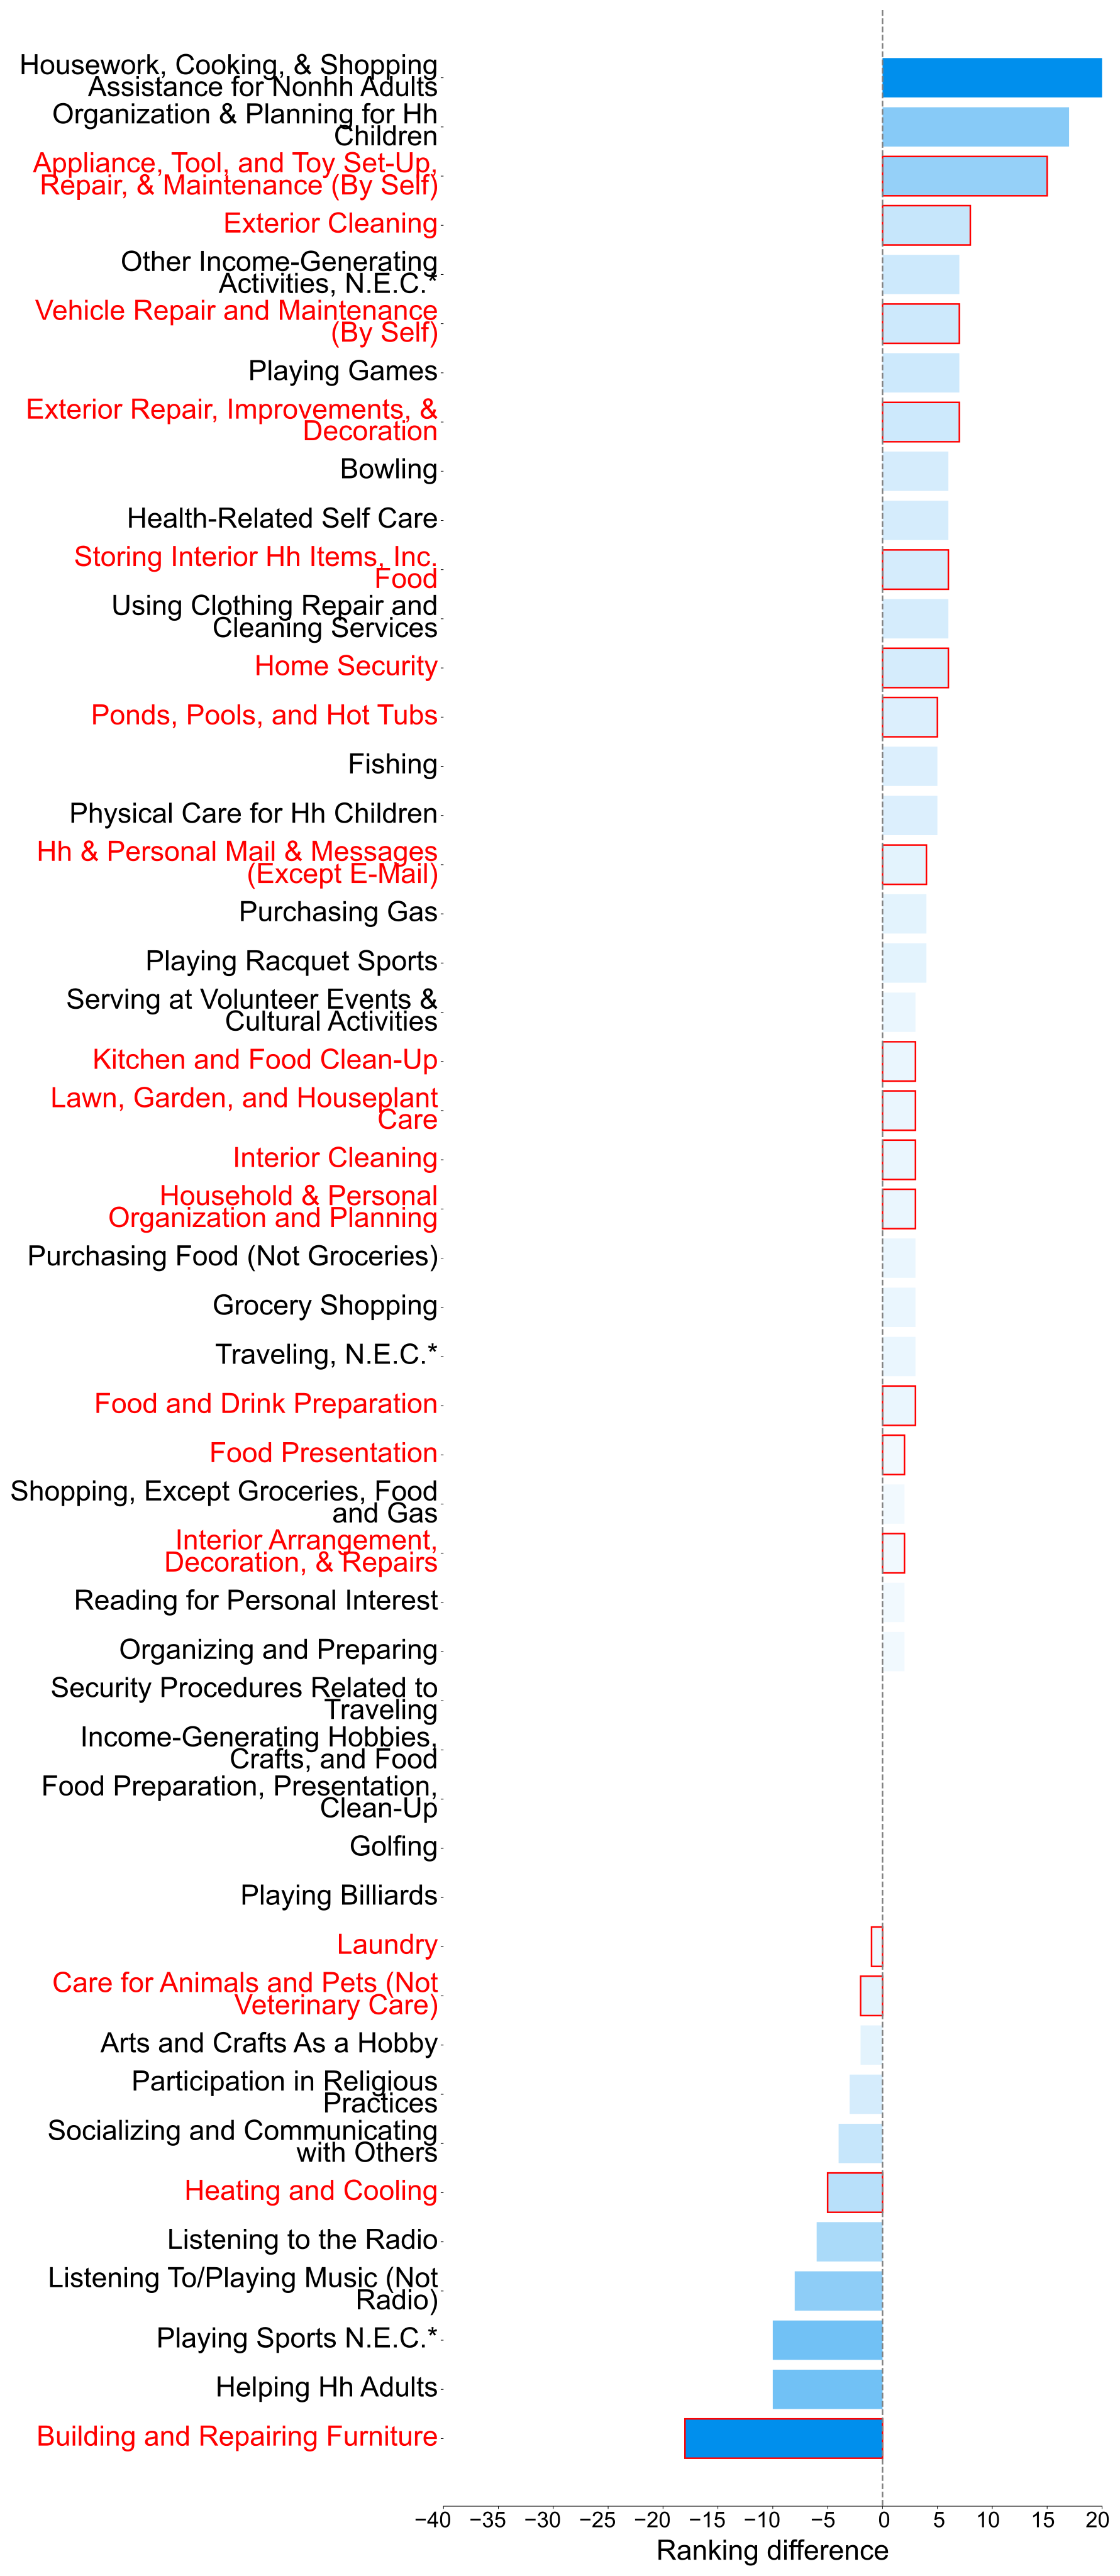
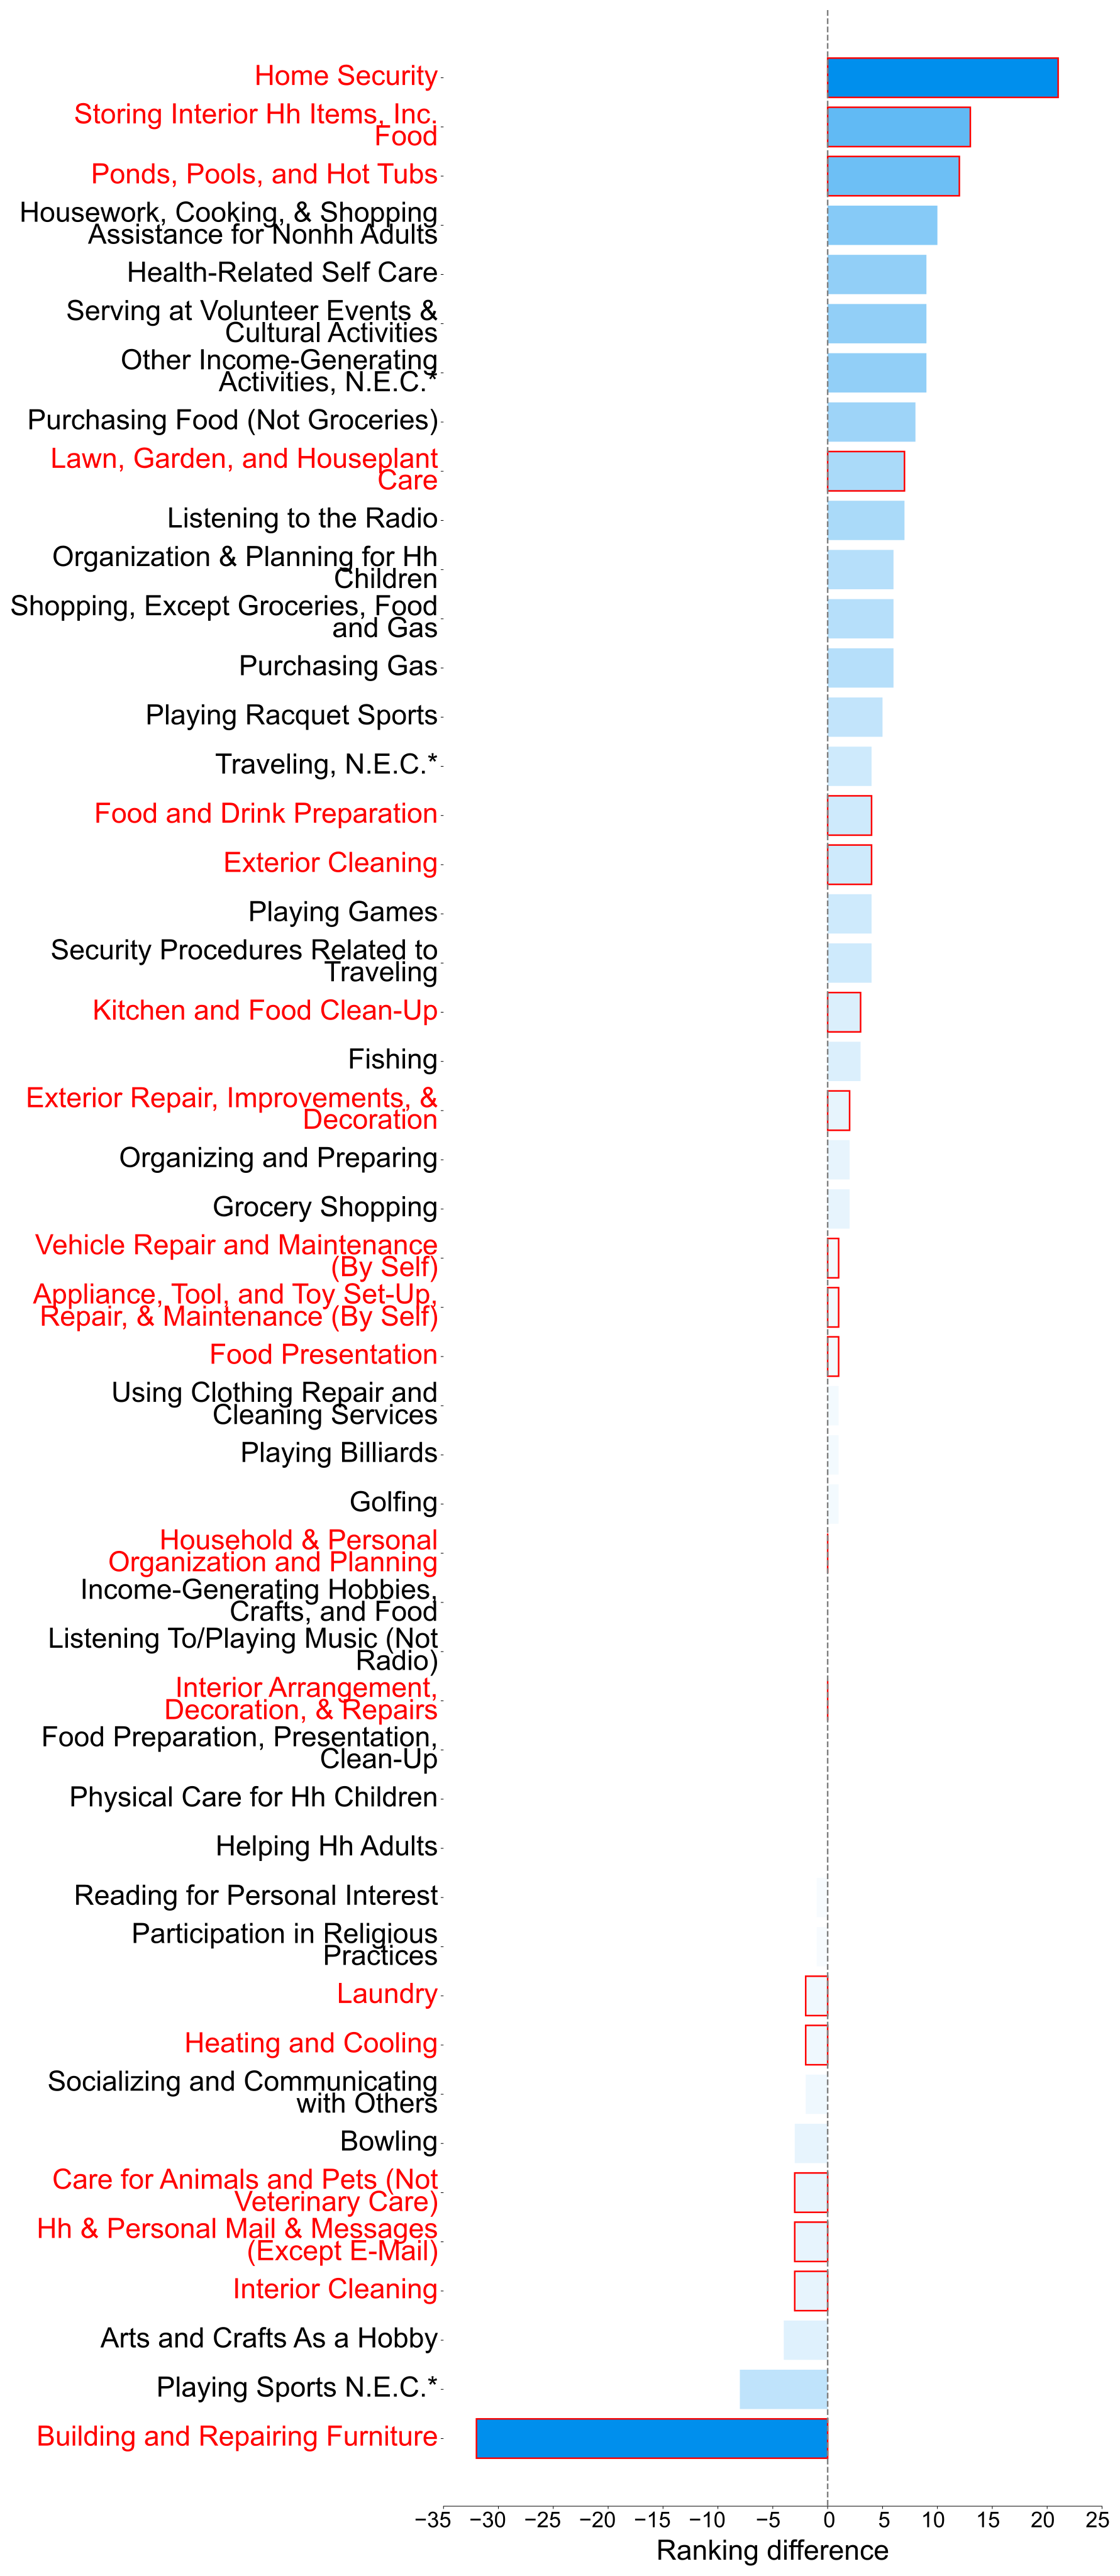
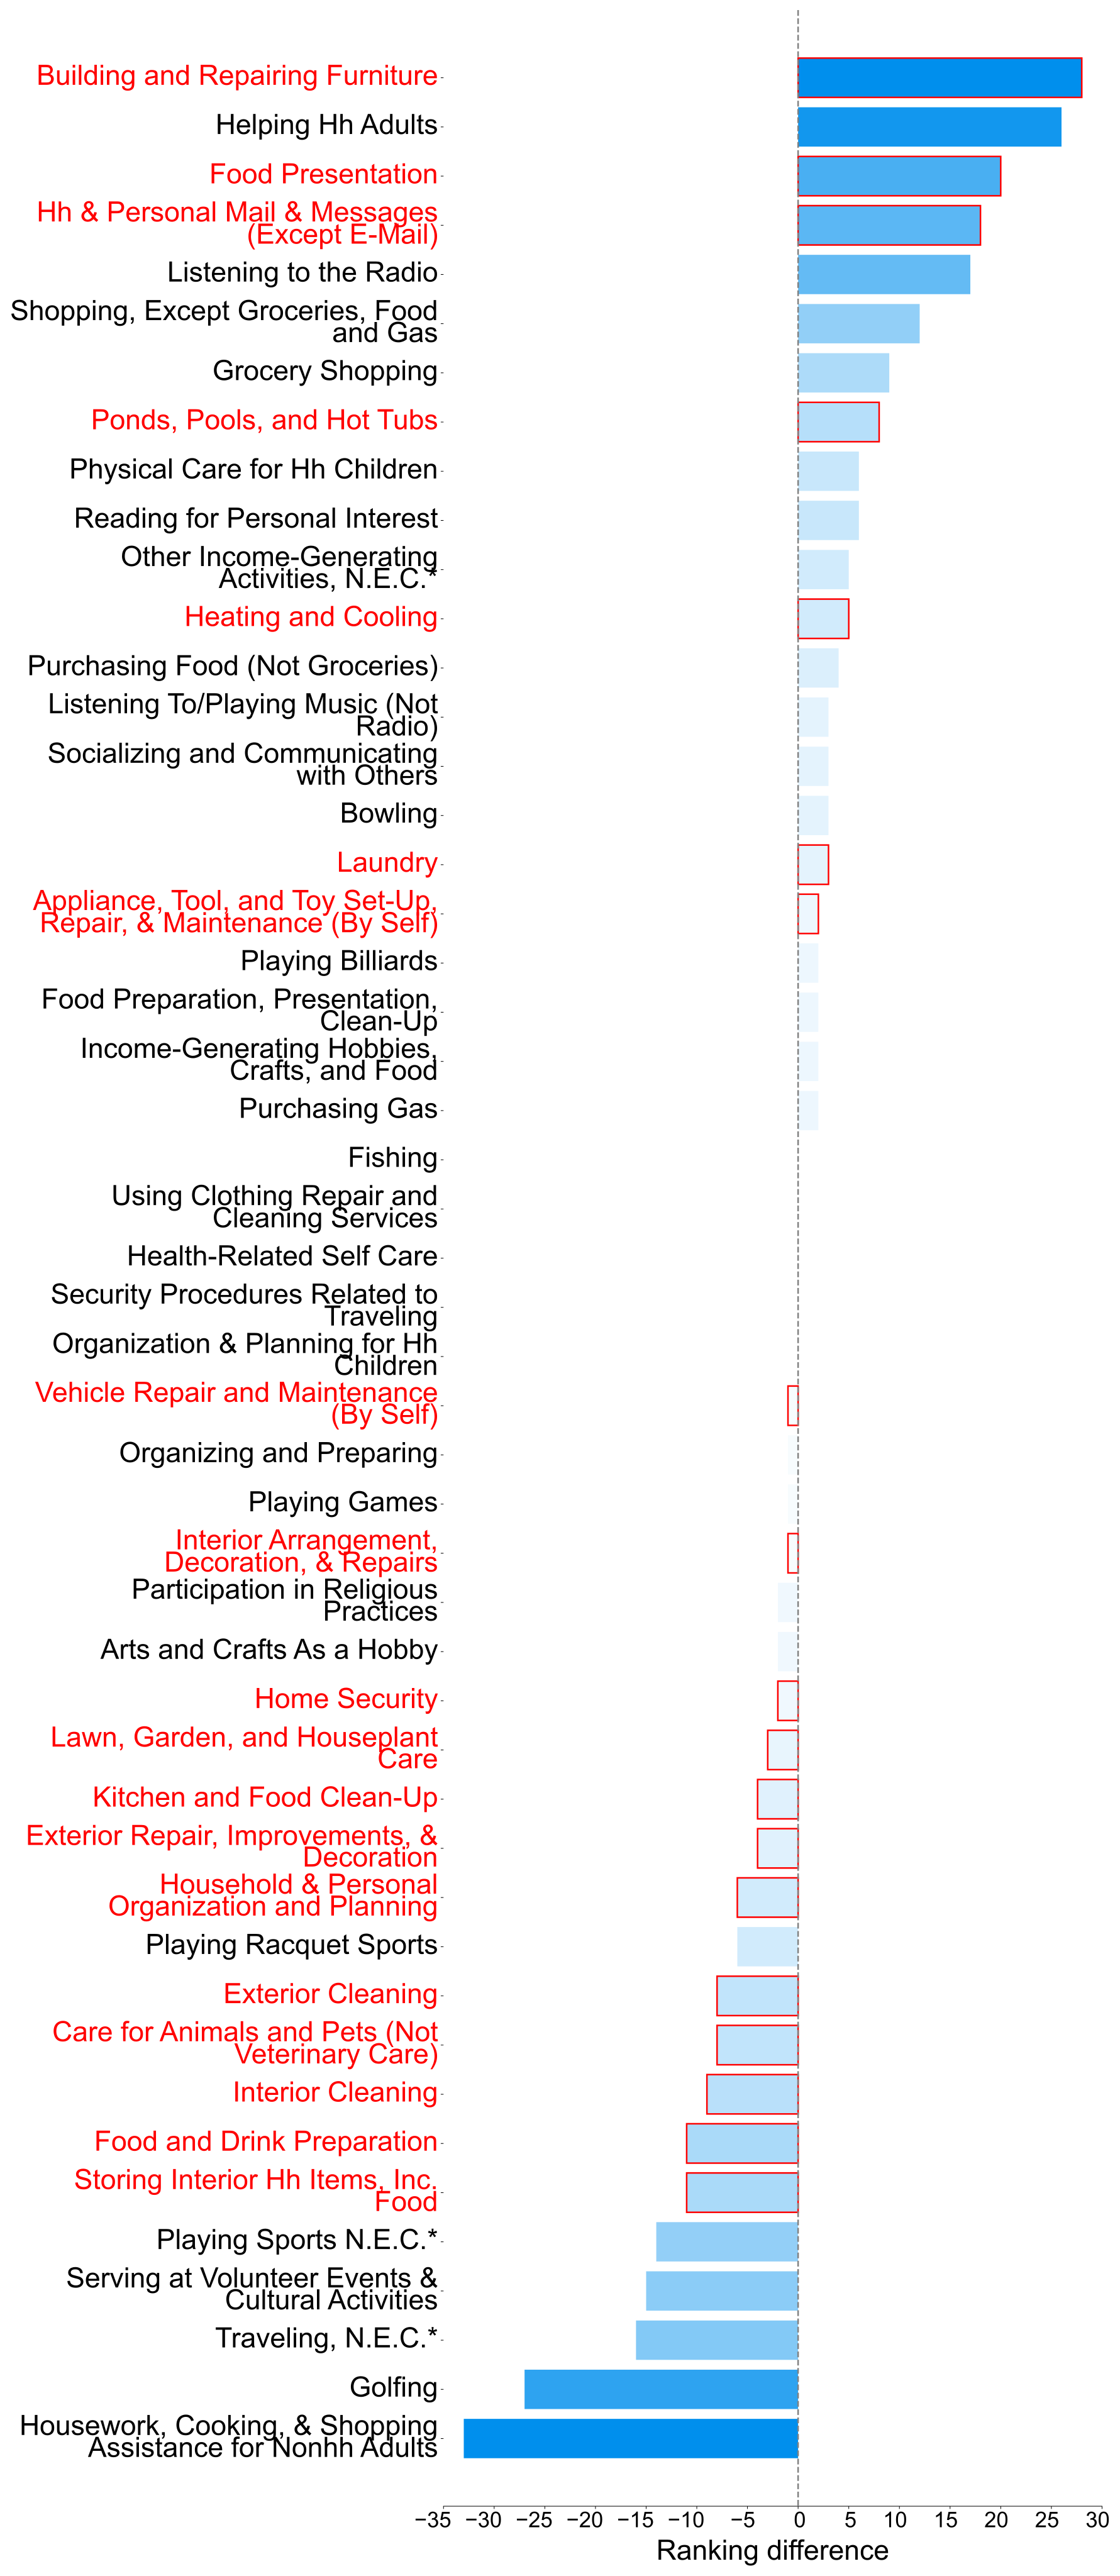
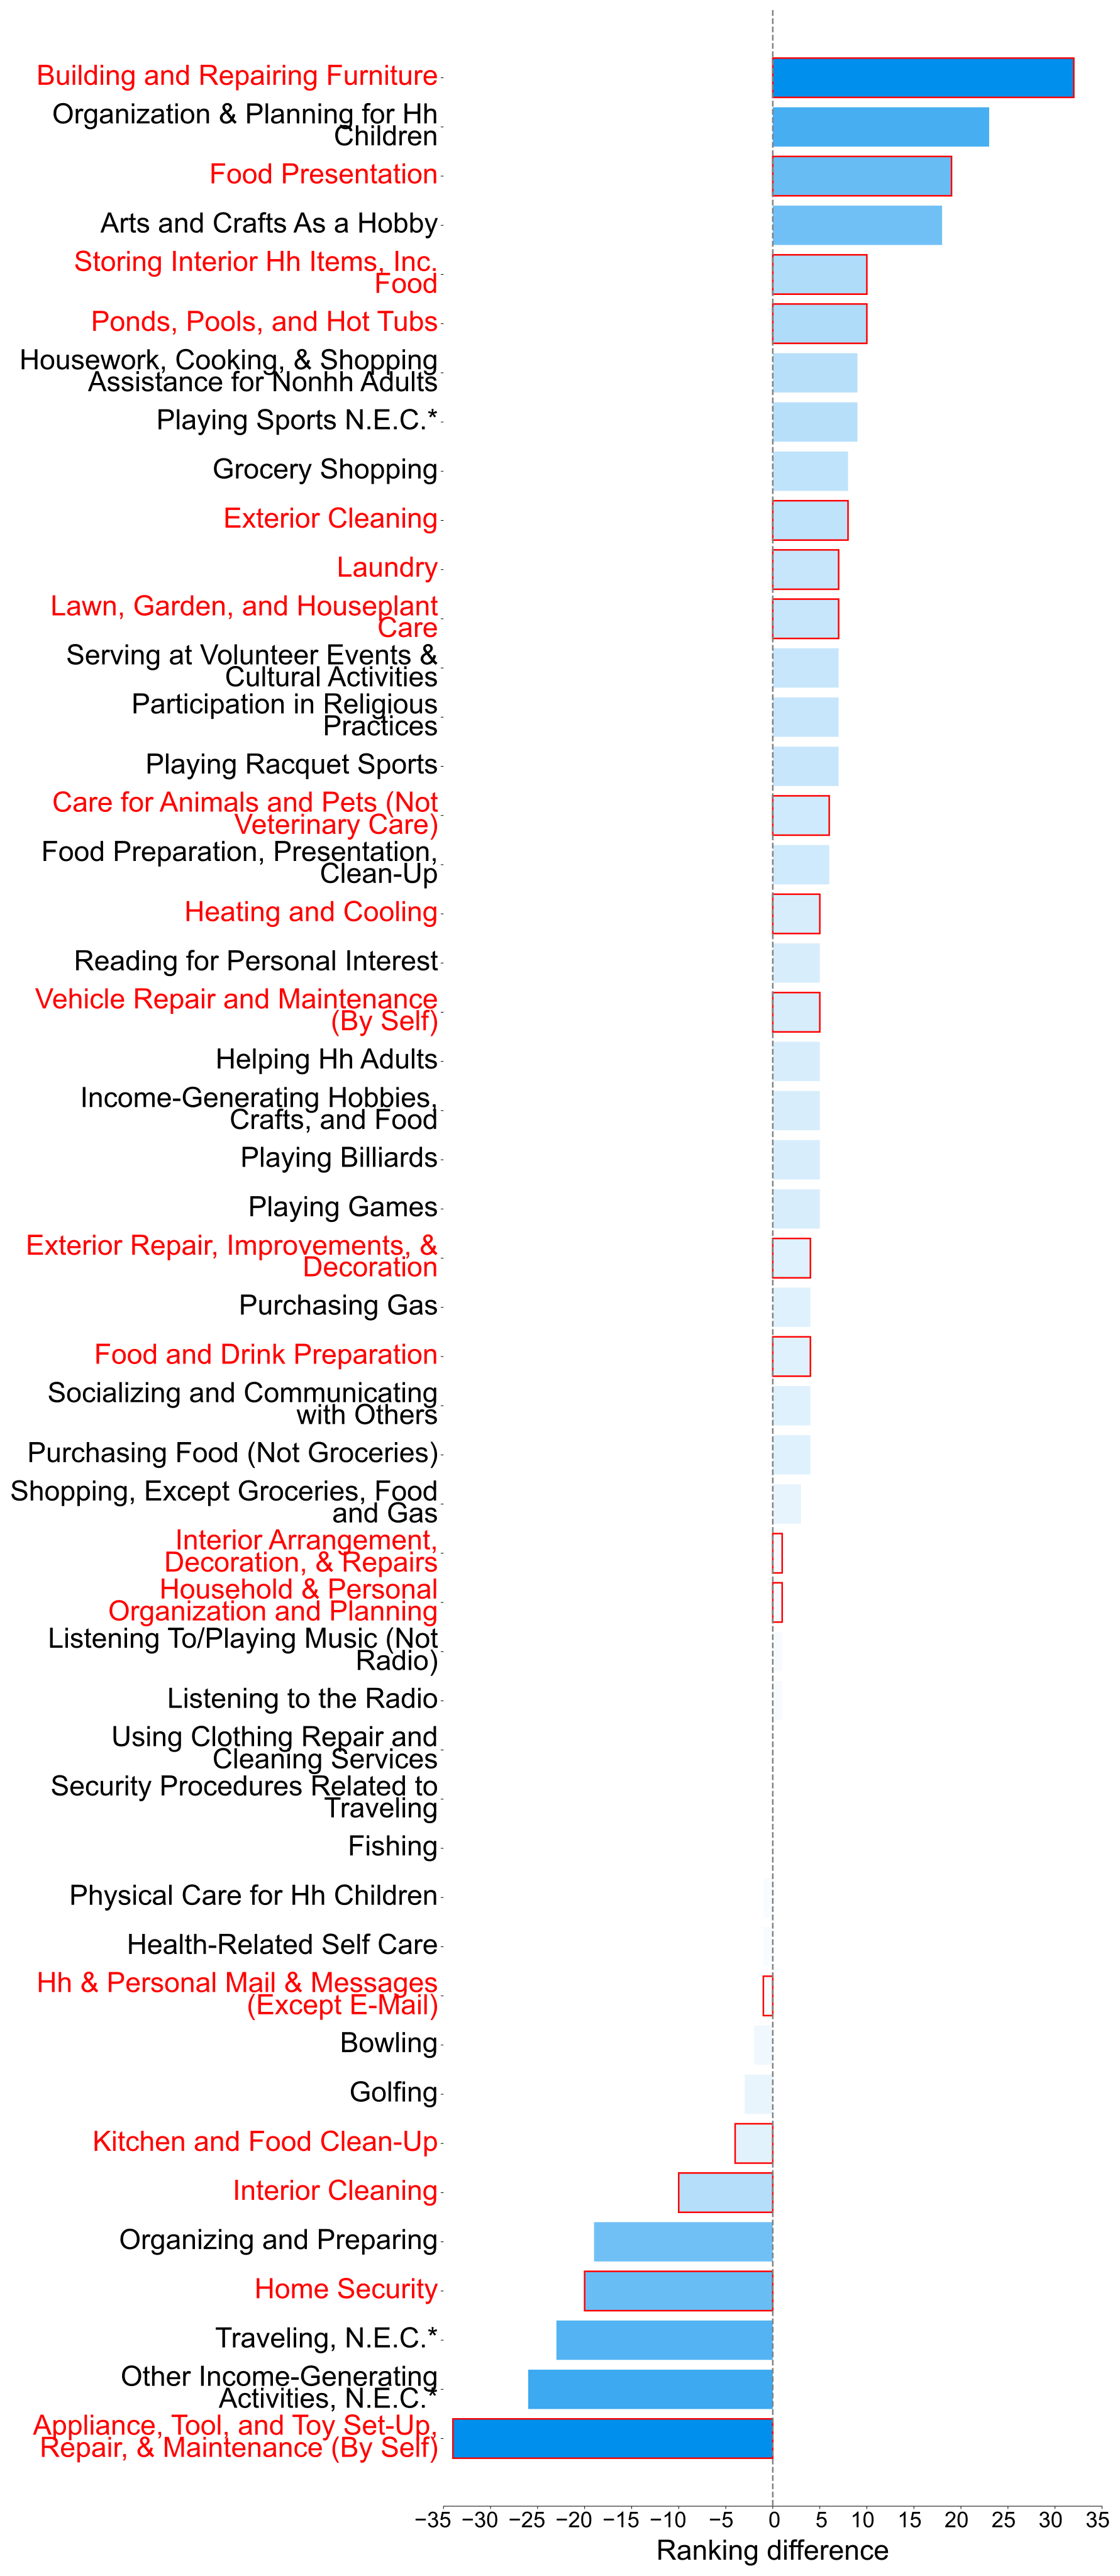
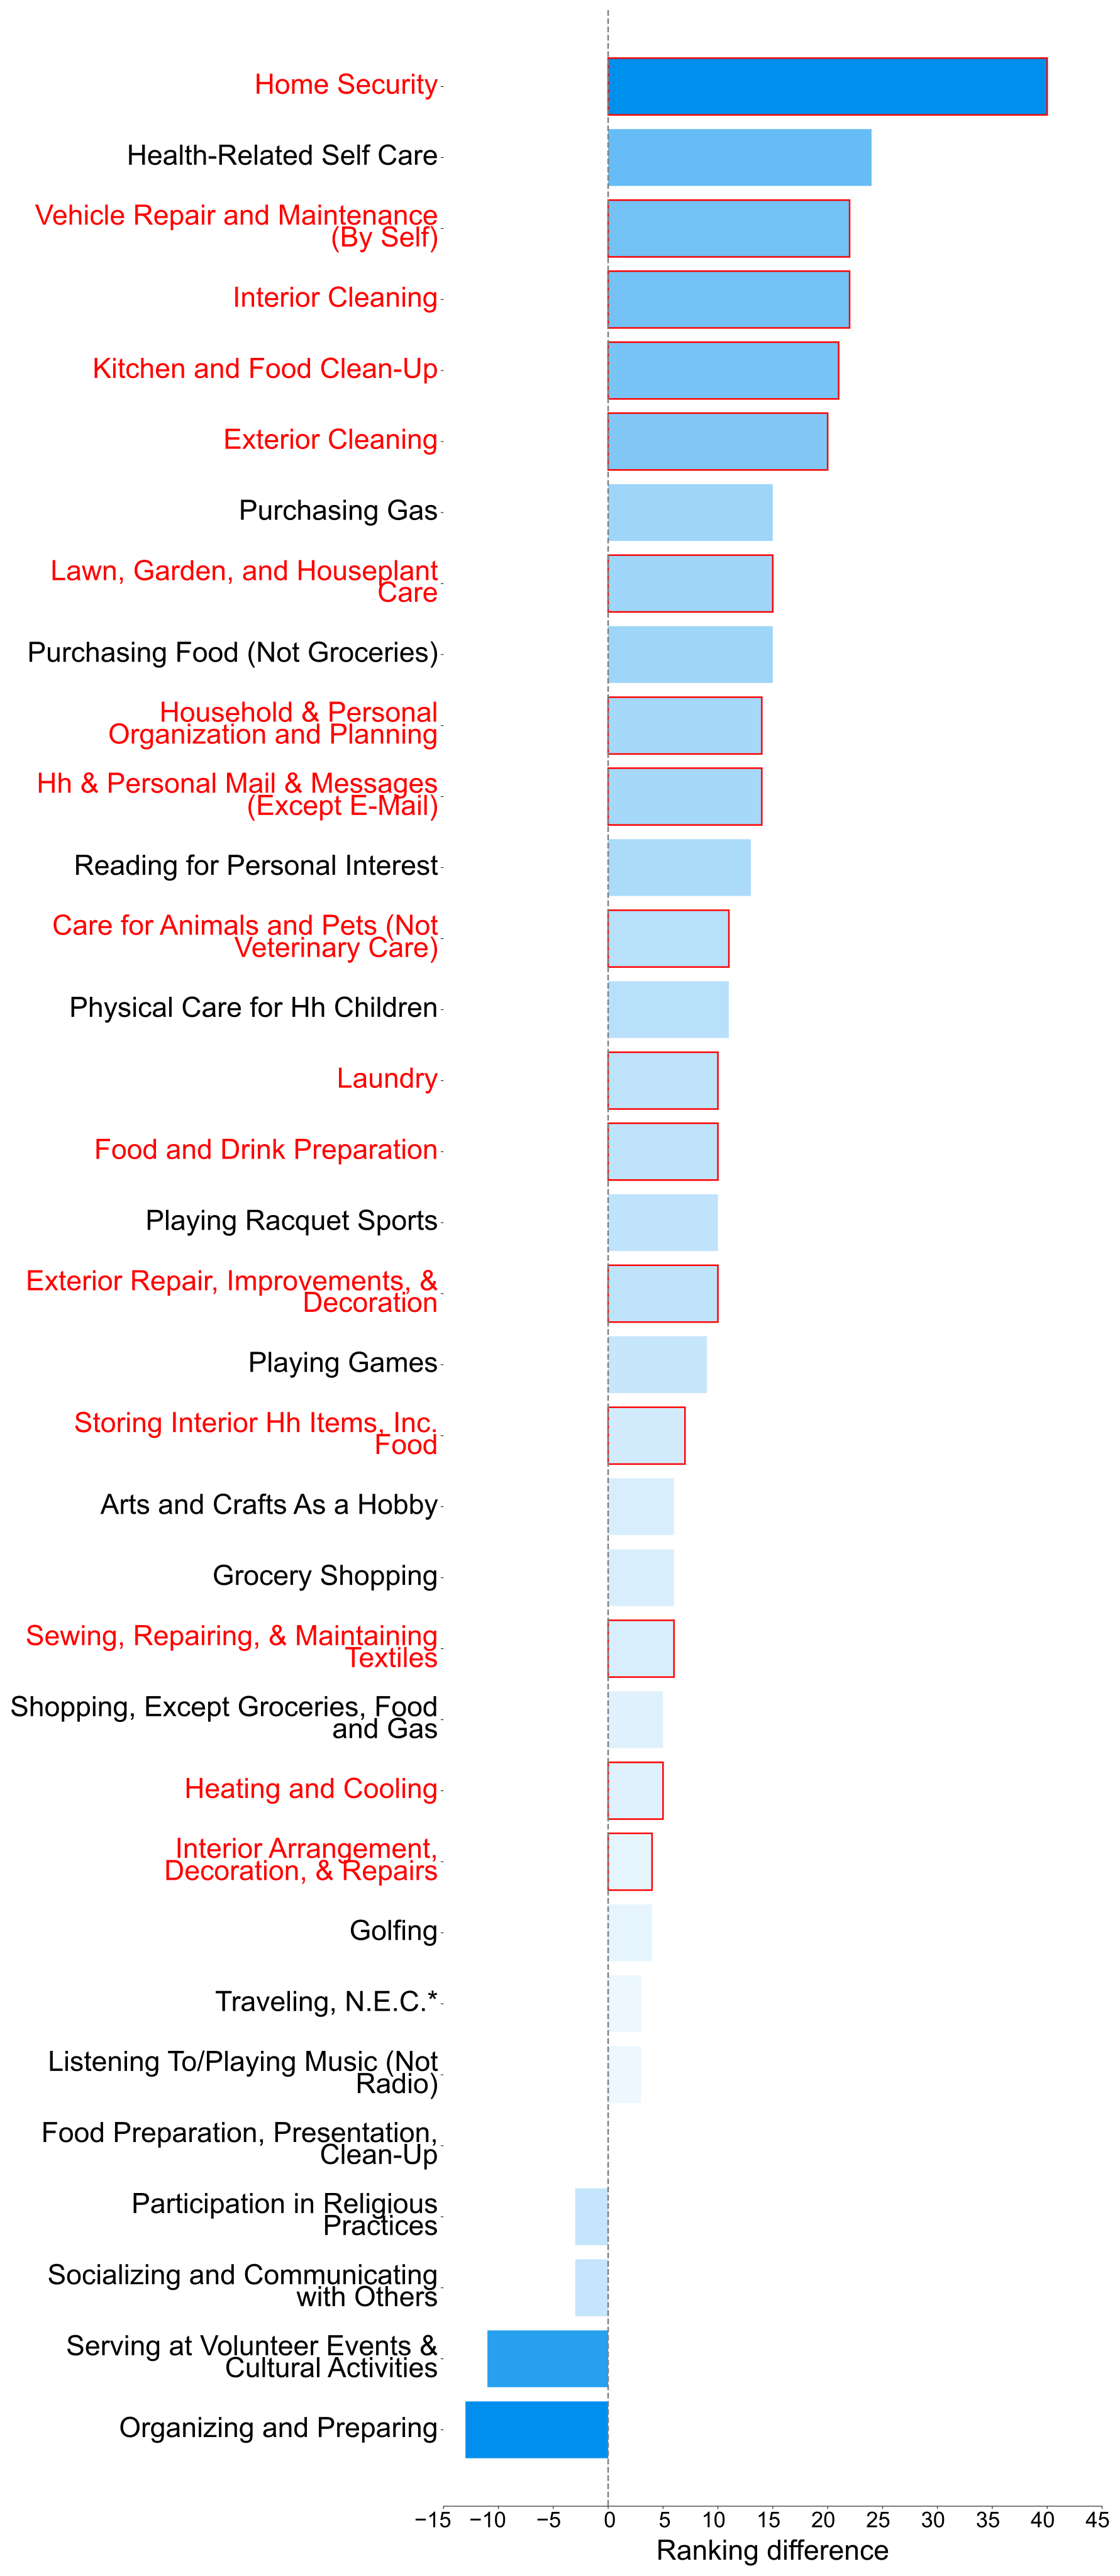
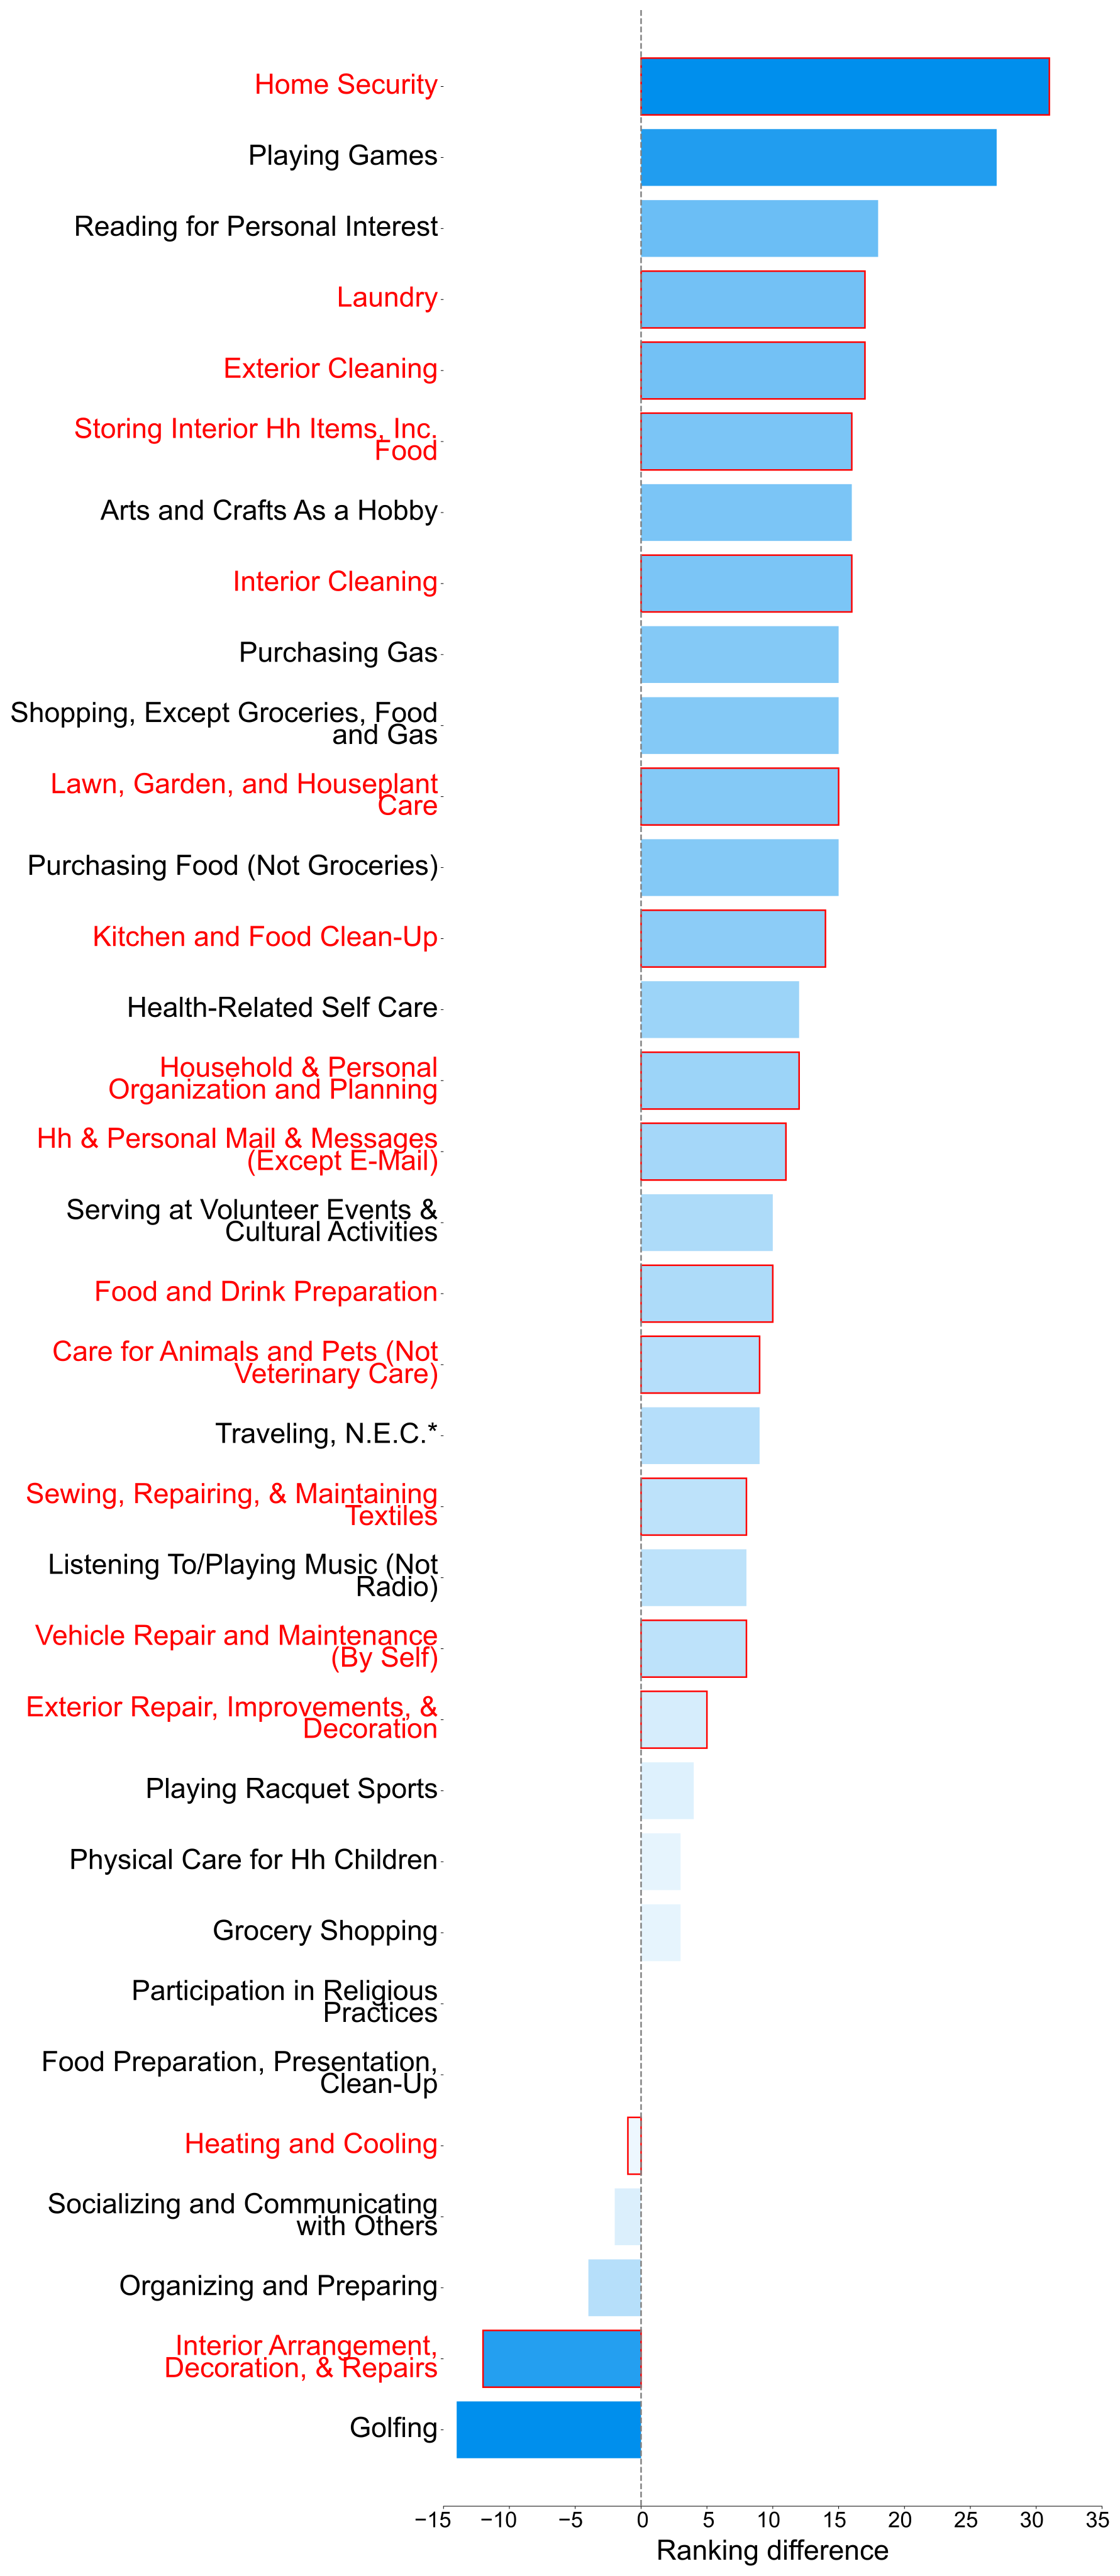
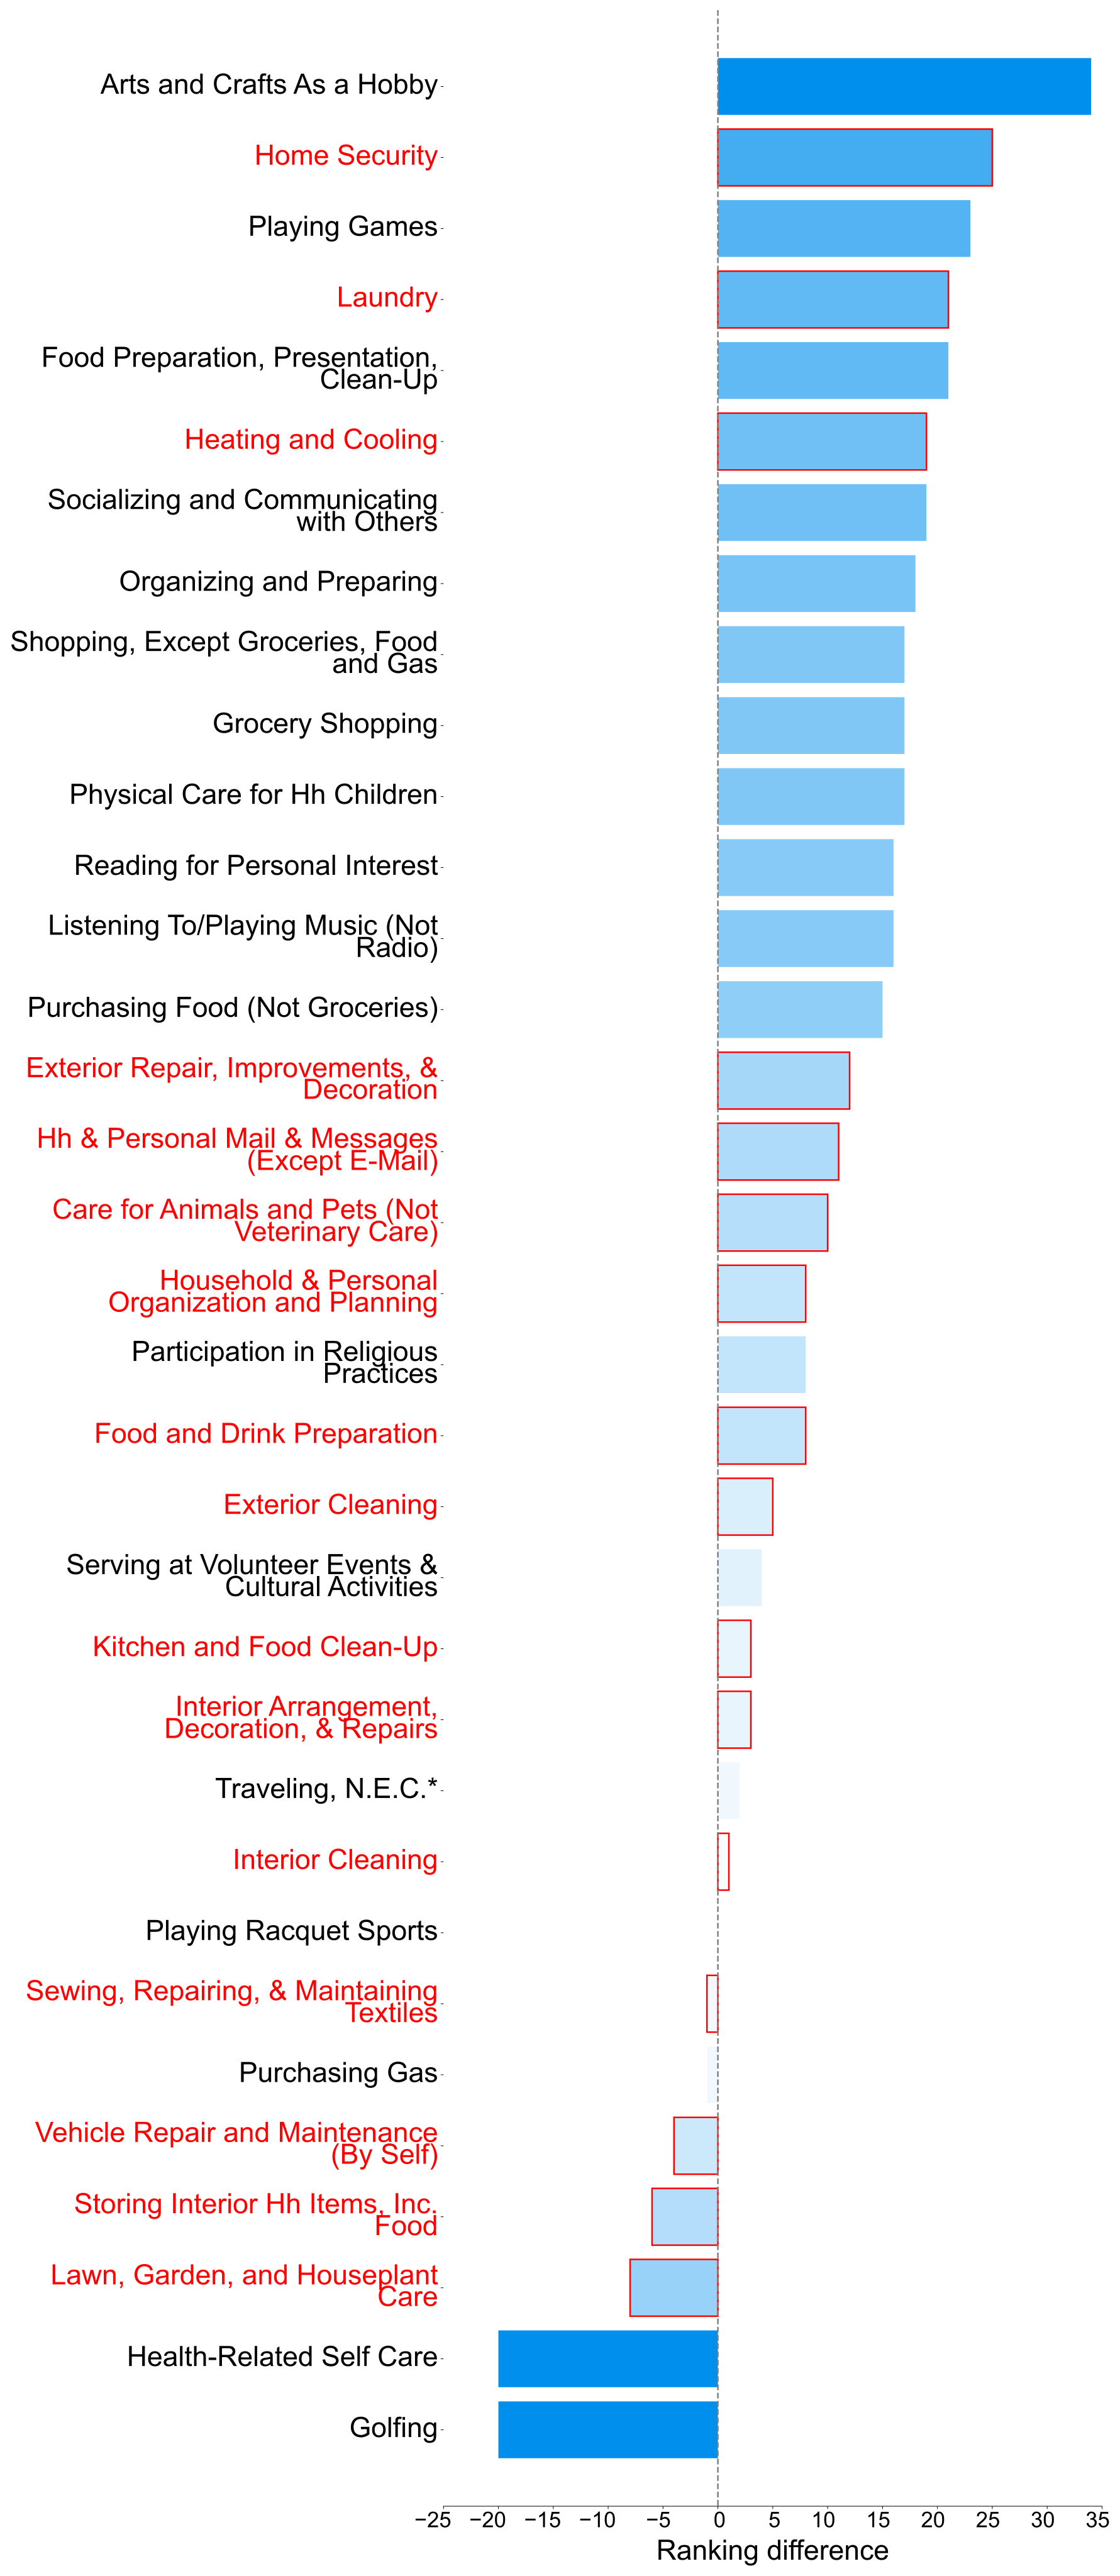
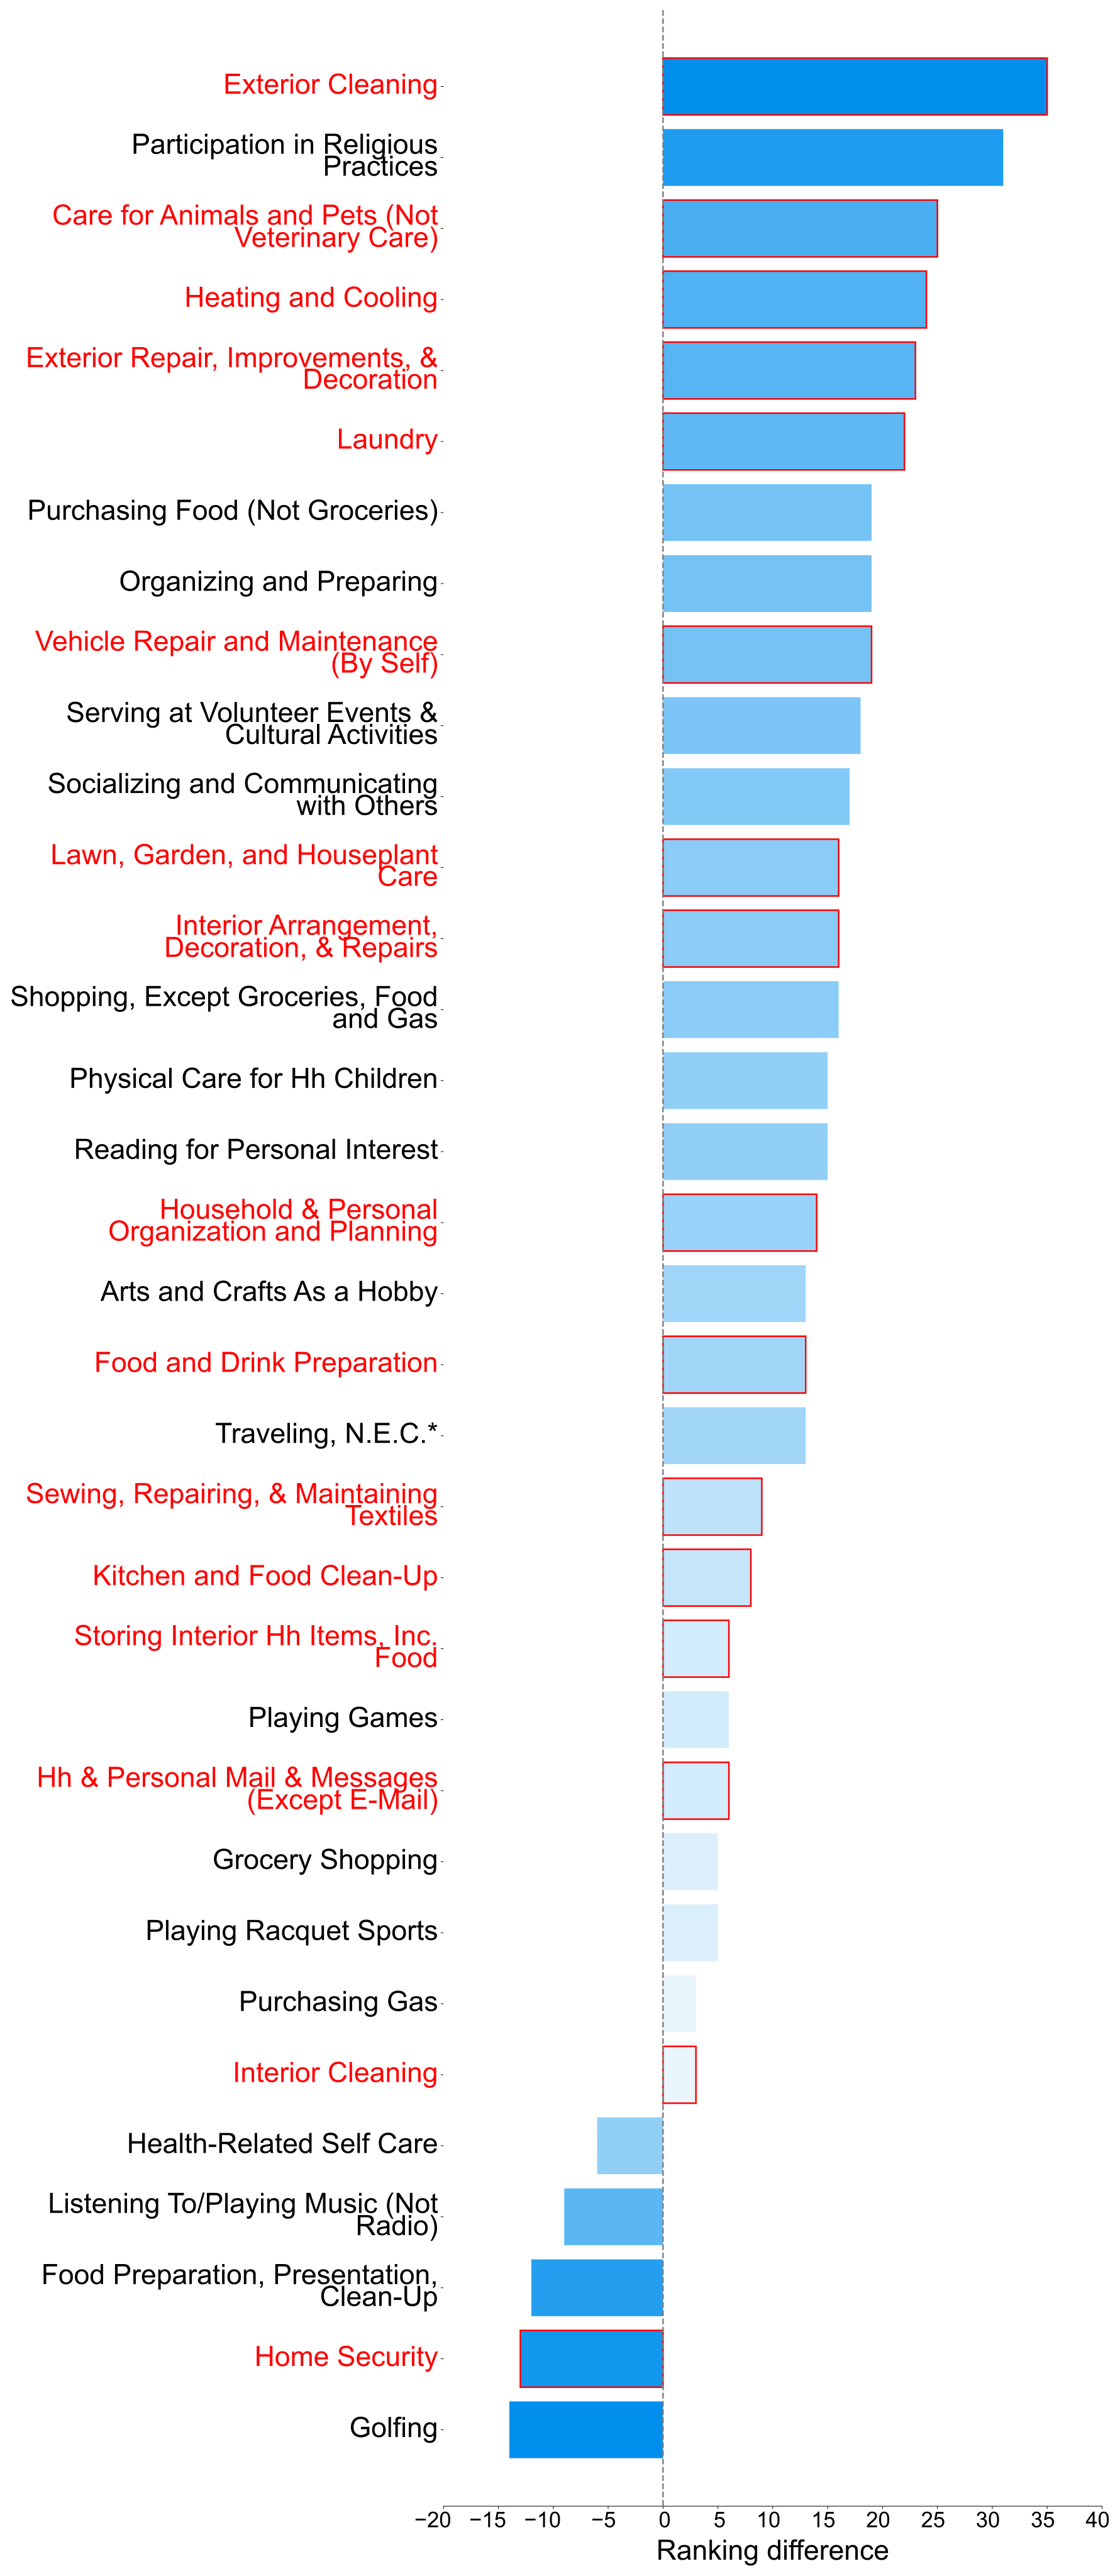
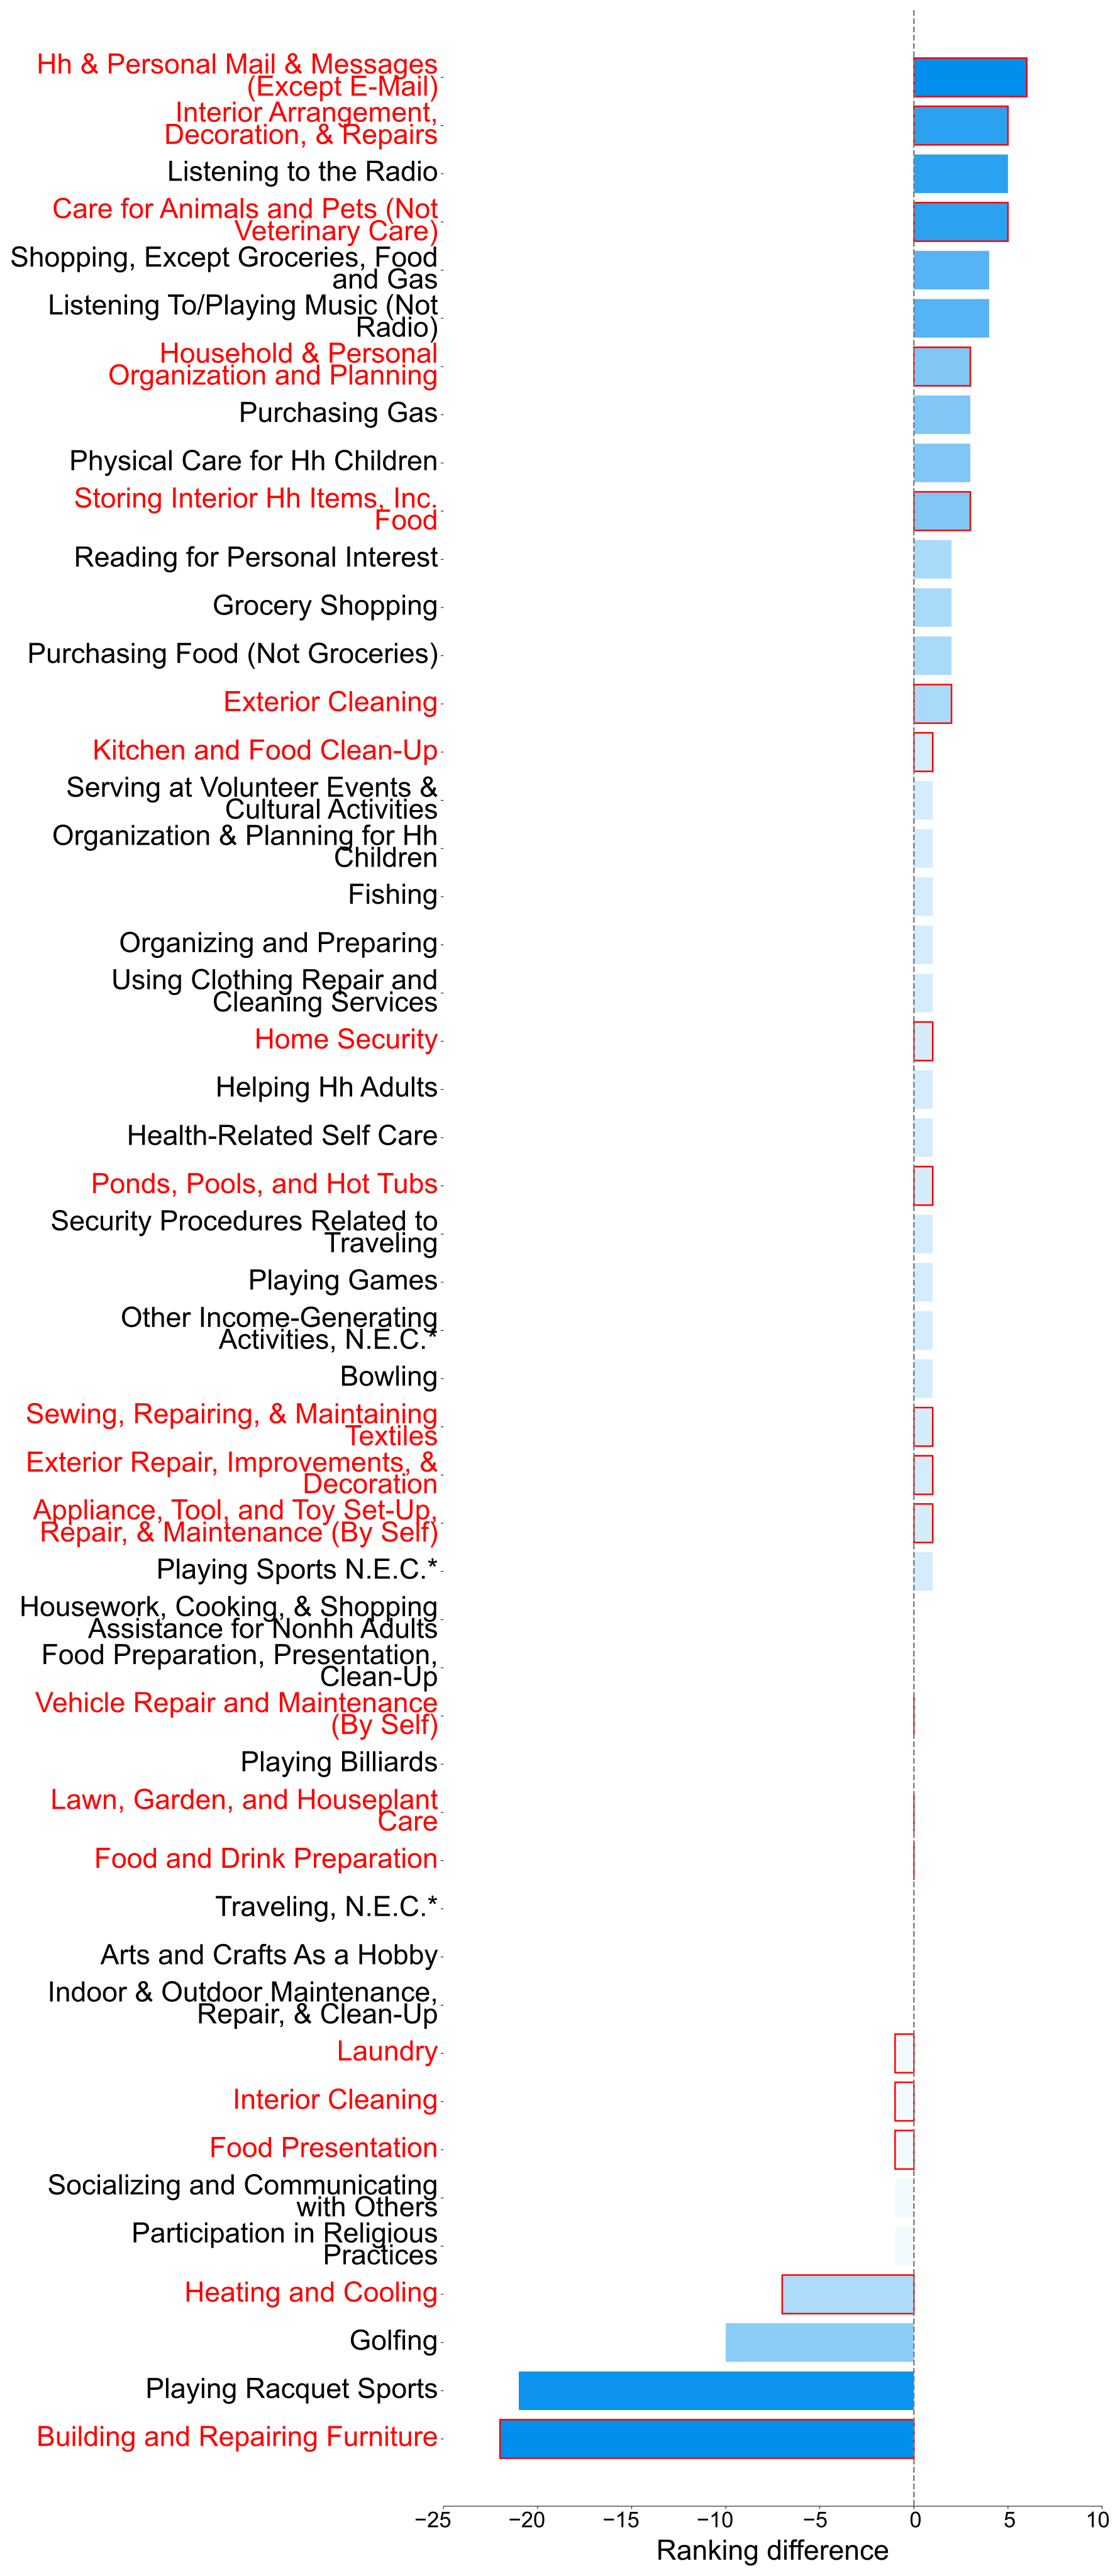
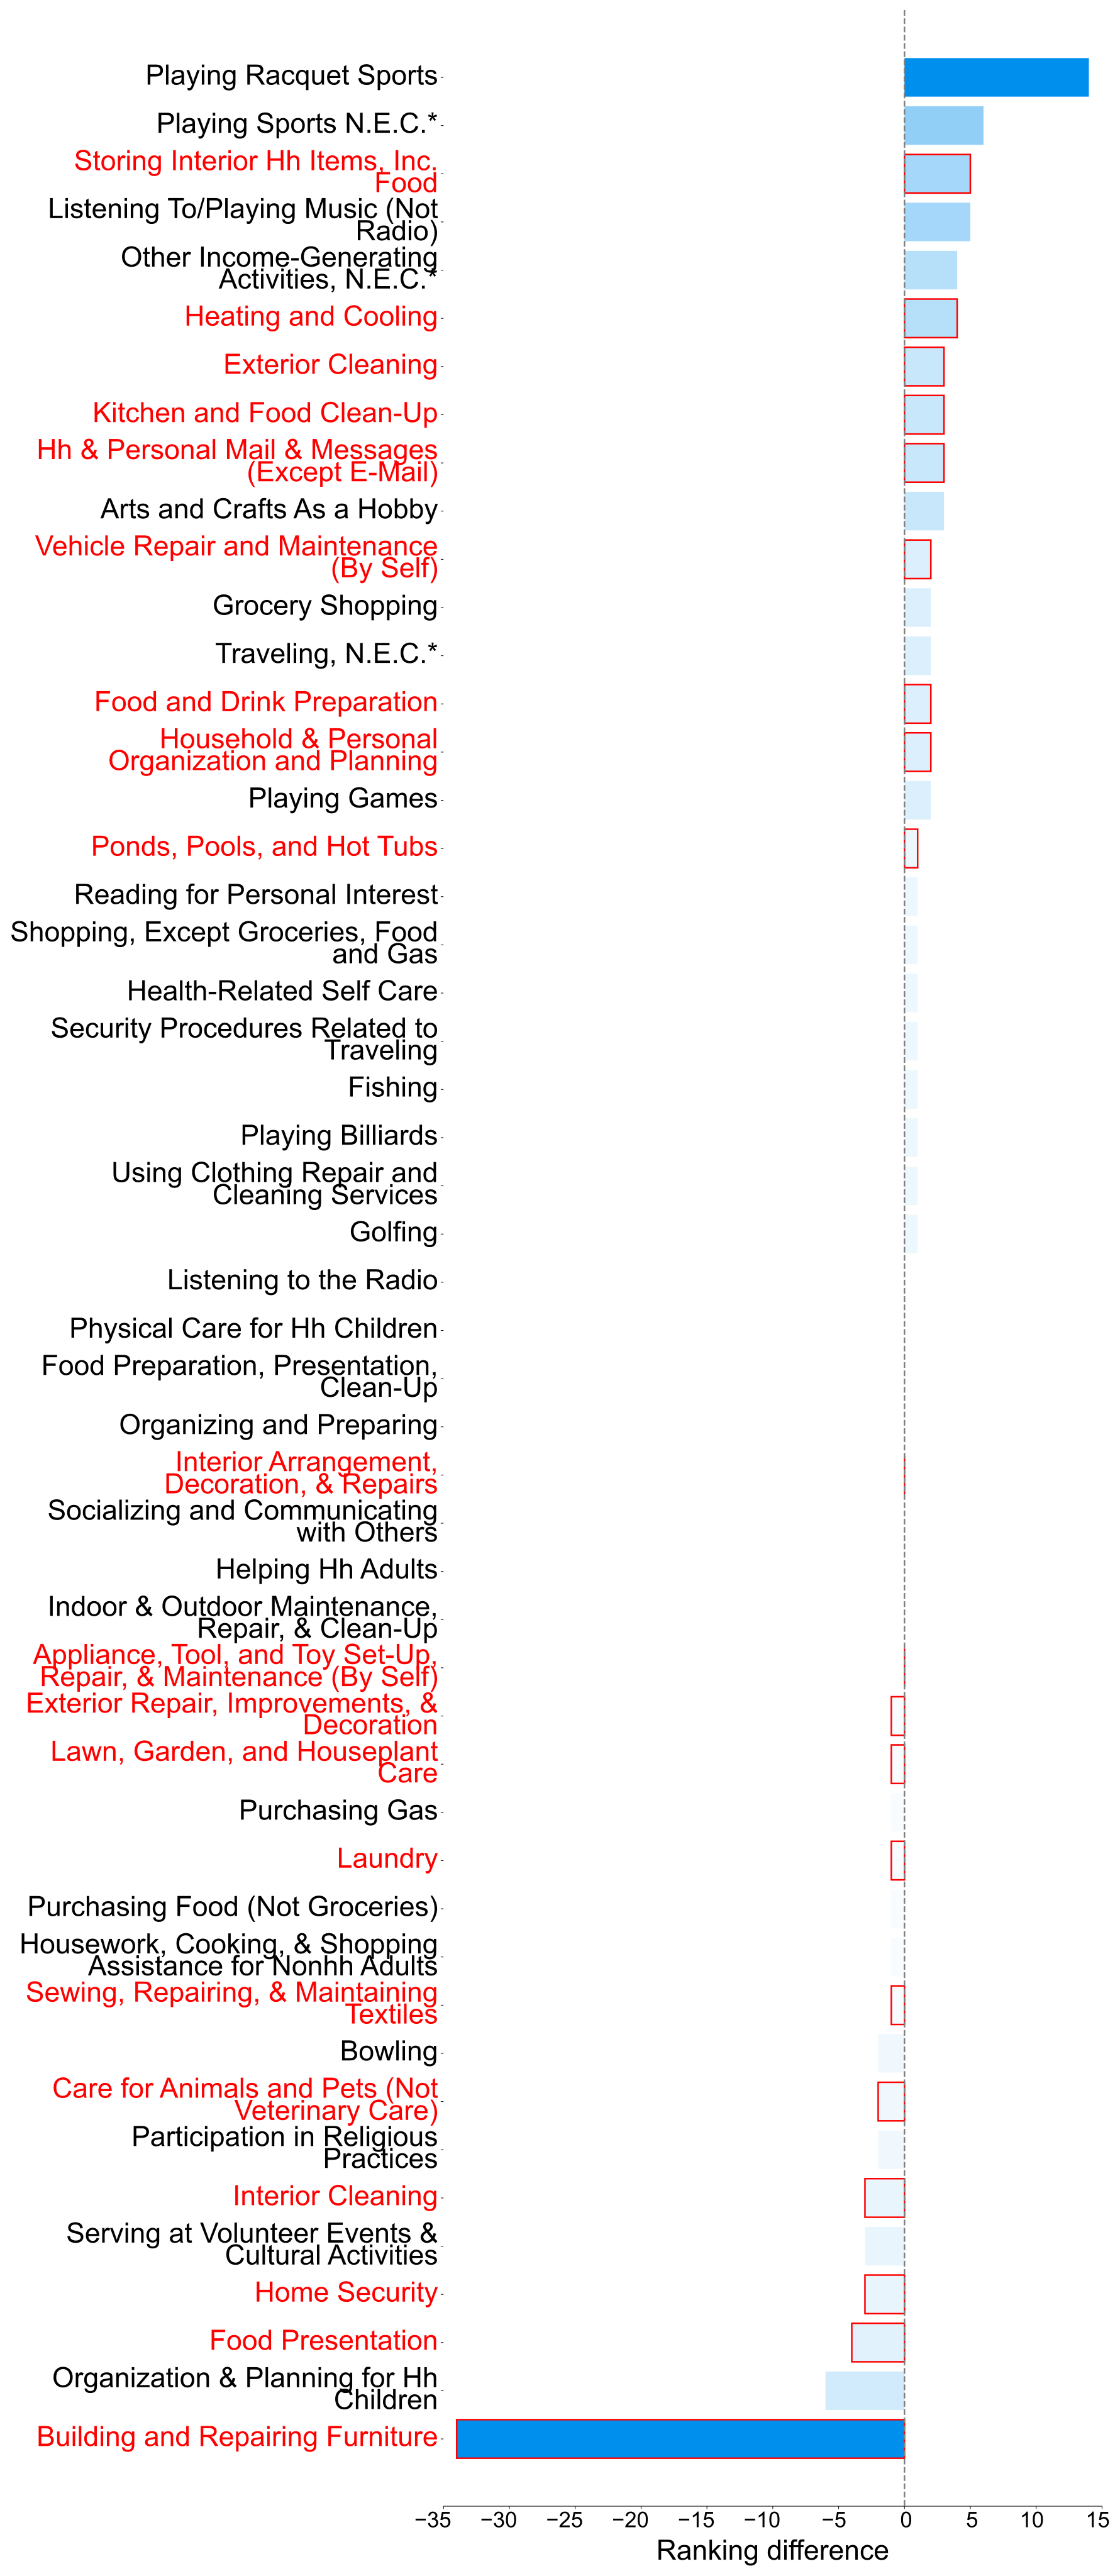
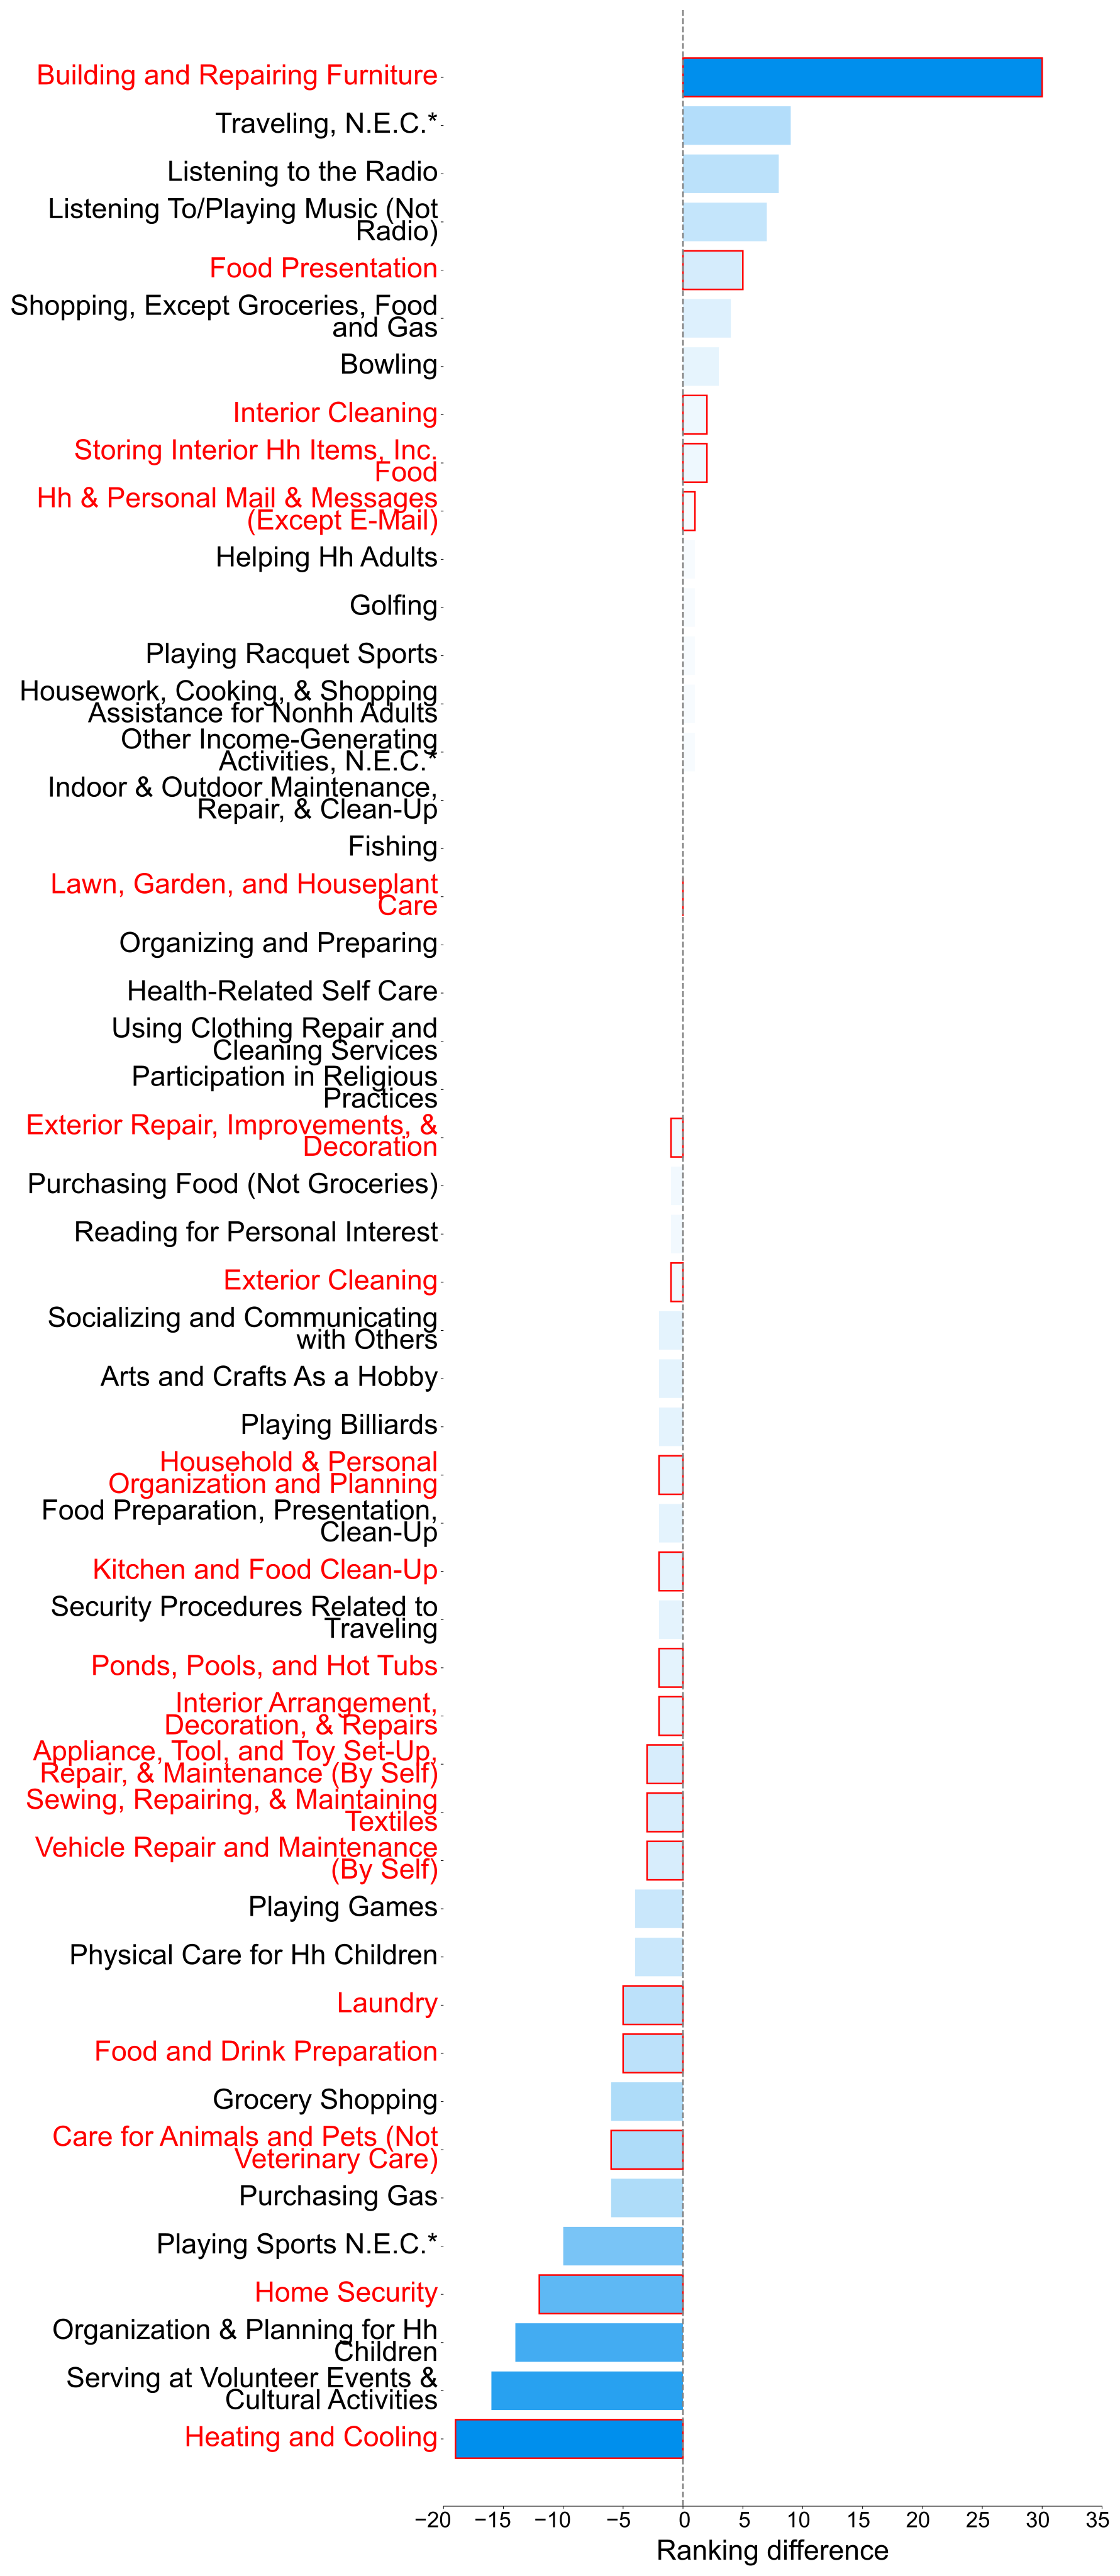
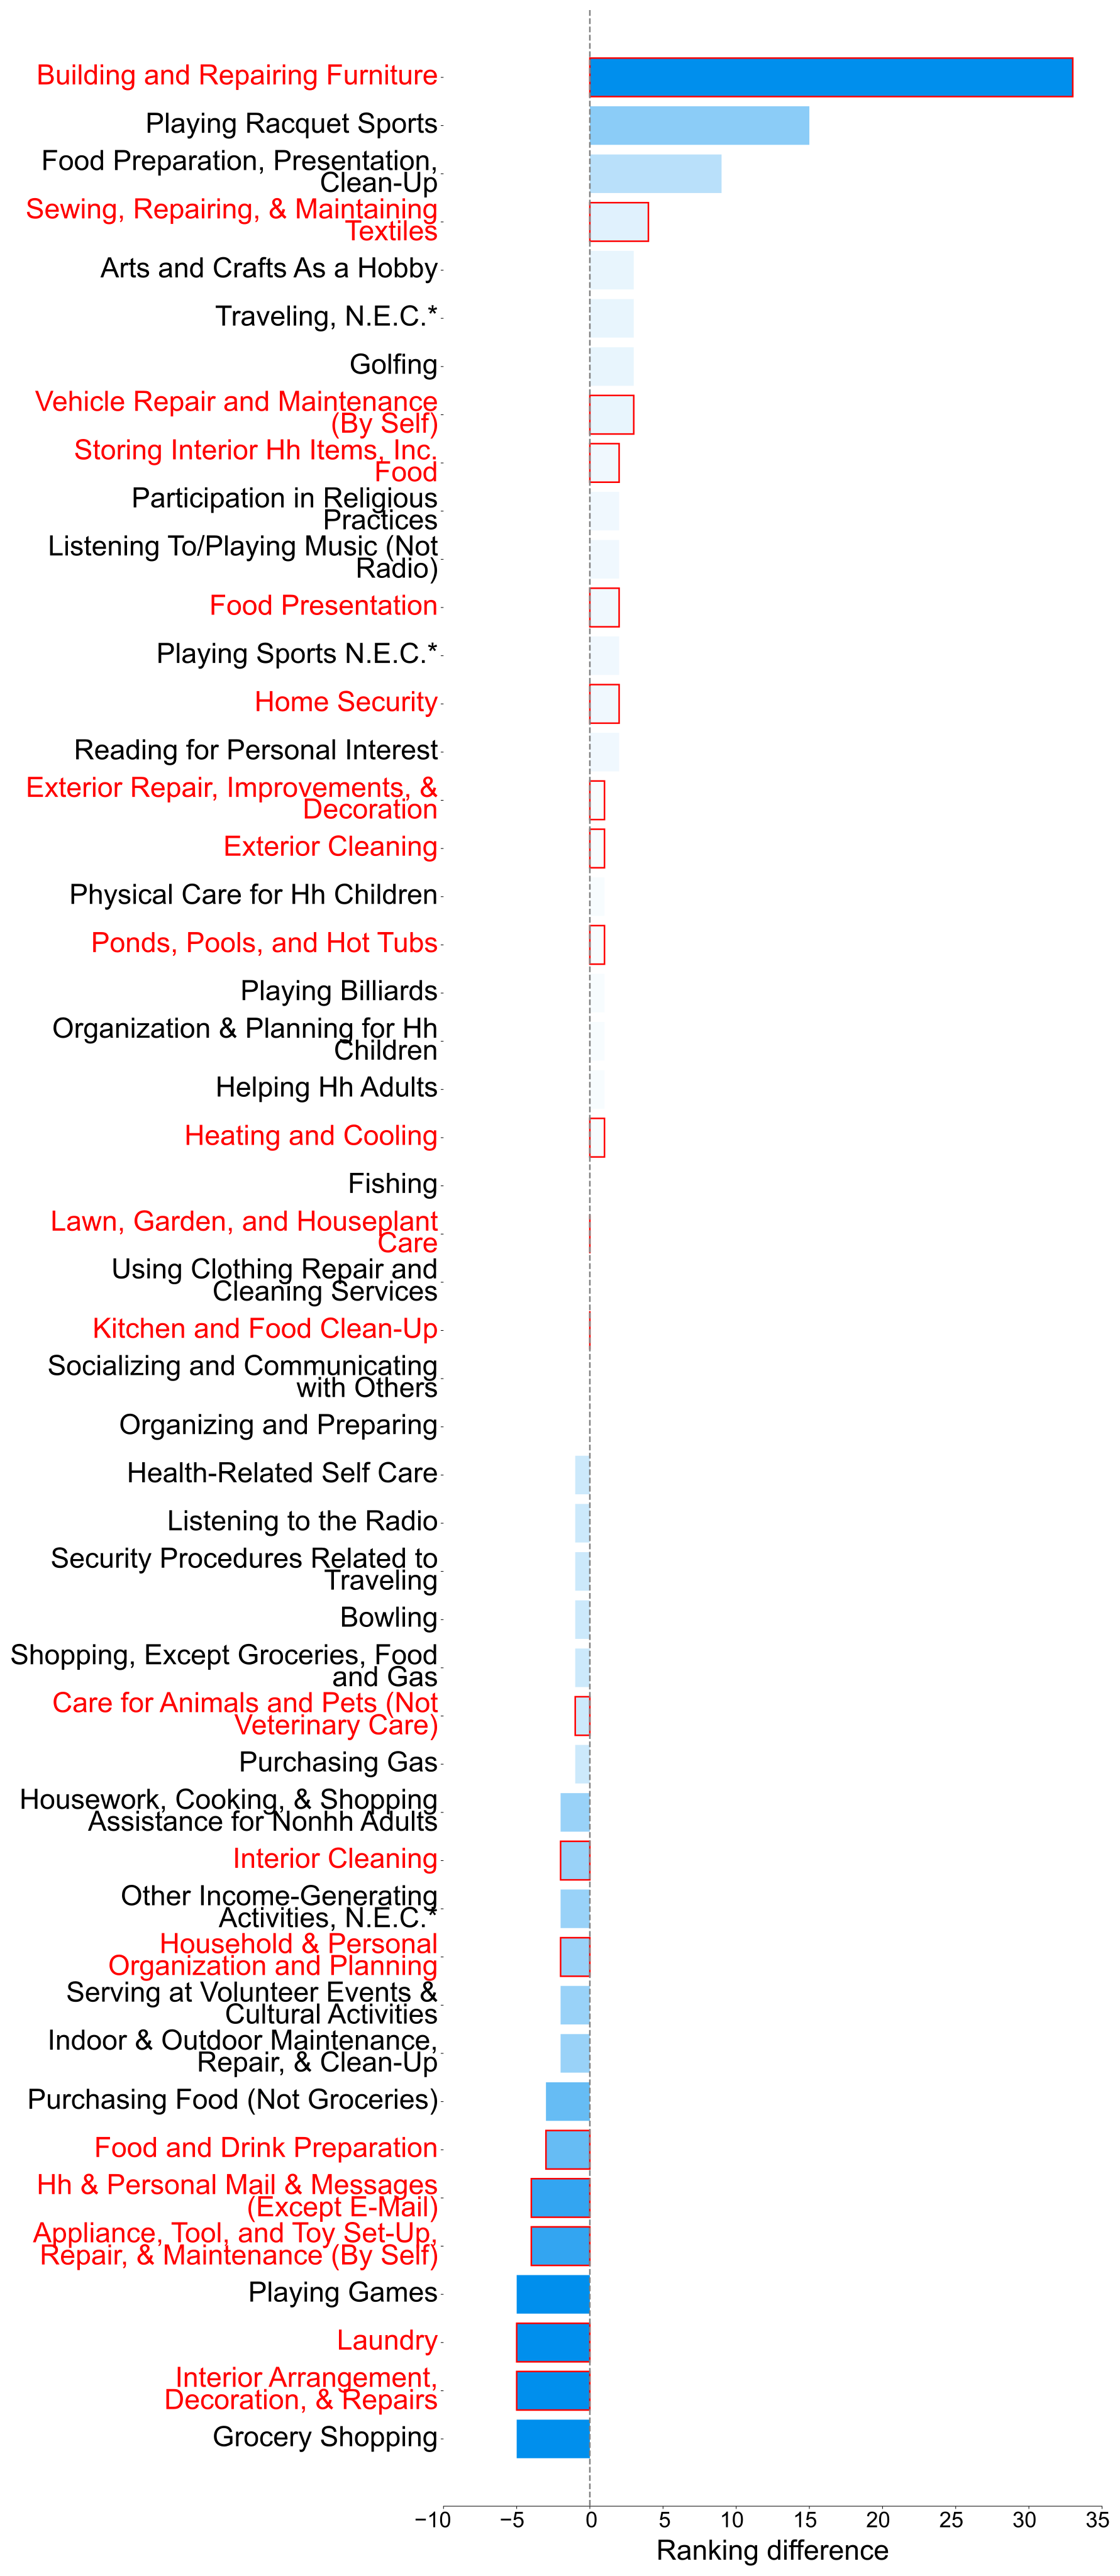
Table 1 gives within-population and subgroup correlations; Table 2 compares demographic differences in ranks. All coefficients and rounded p-values are retained. The two analyses answer different questions, and rounded values at 0.05 should not be treated as clearly meeting the paper’s strict threshold.
4.1 Time as predictor for desire for robotic automation
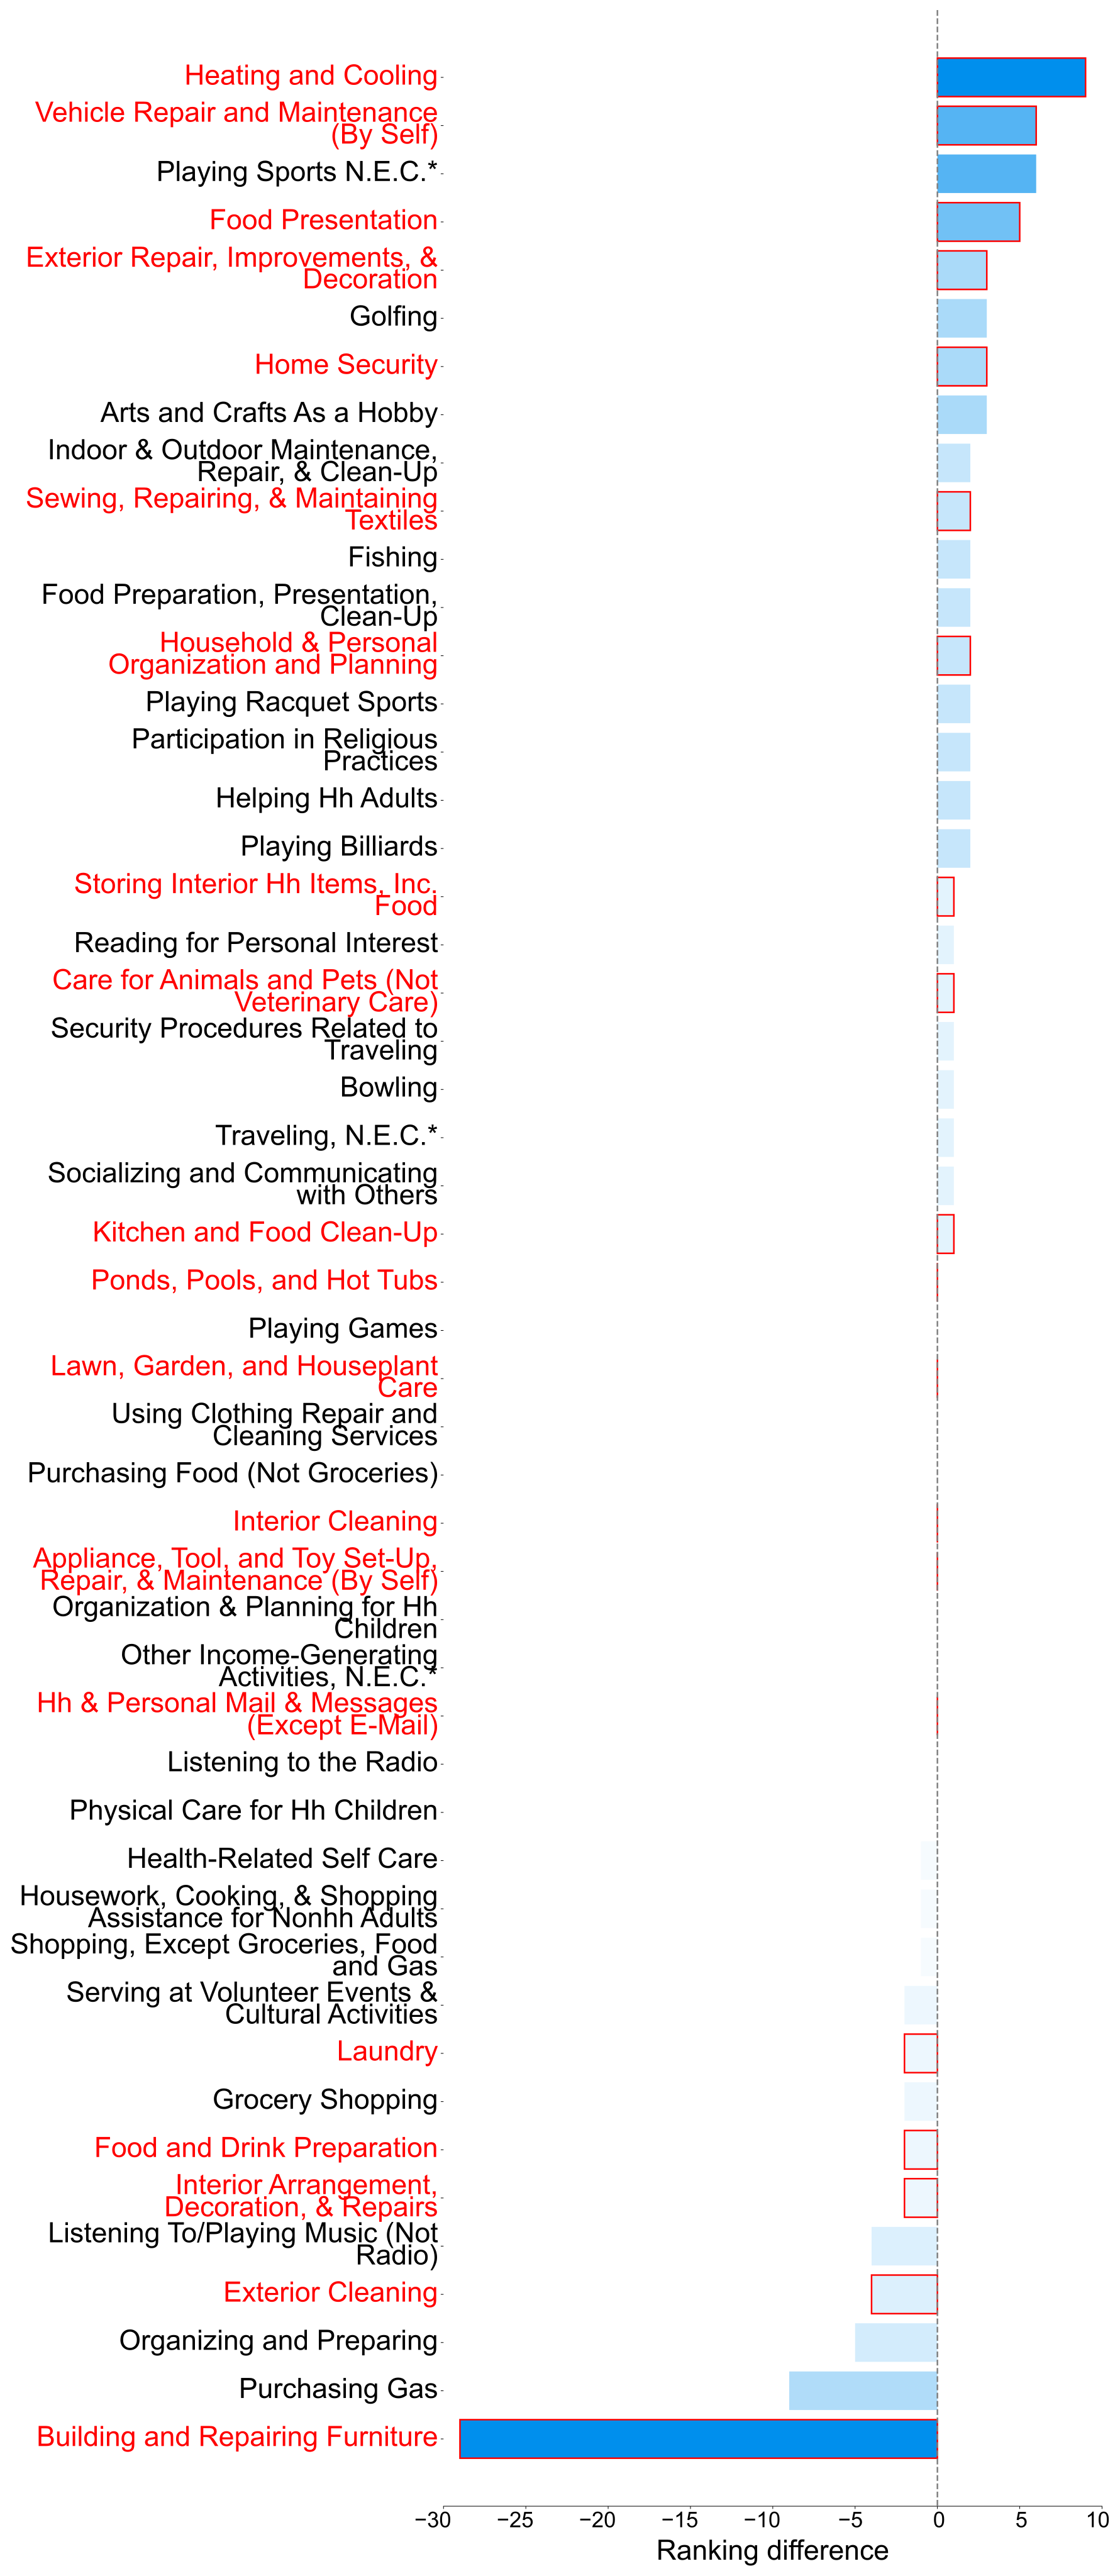
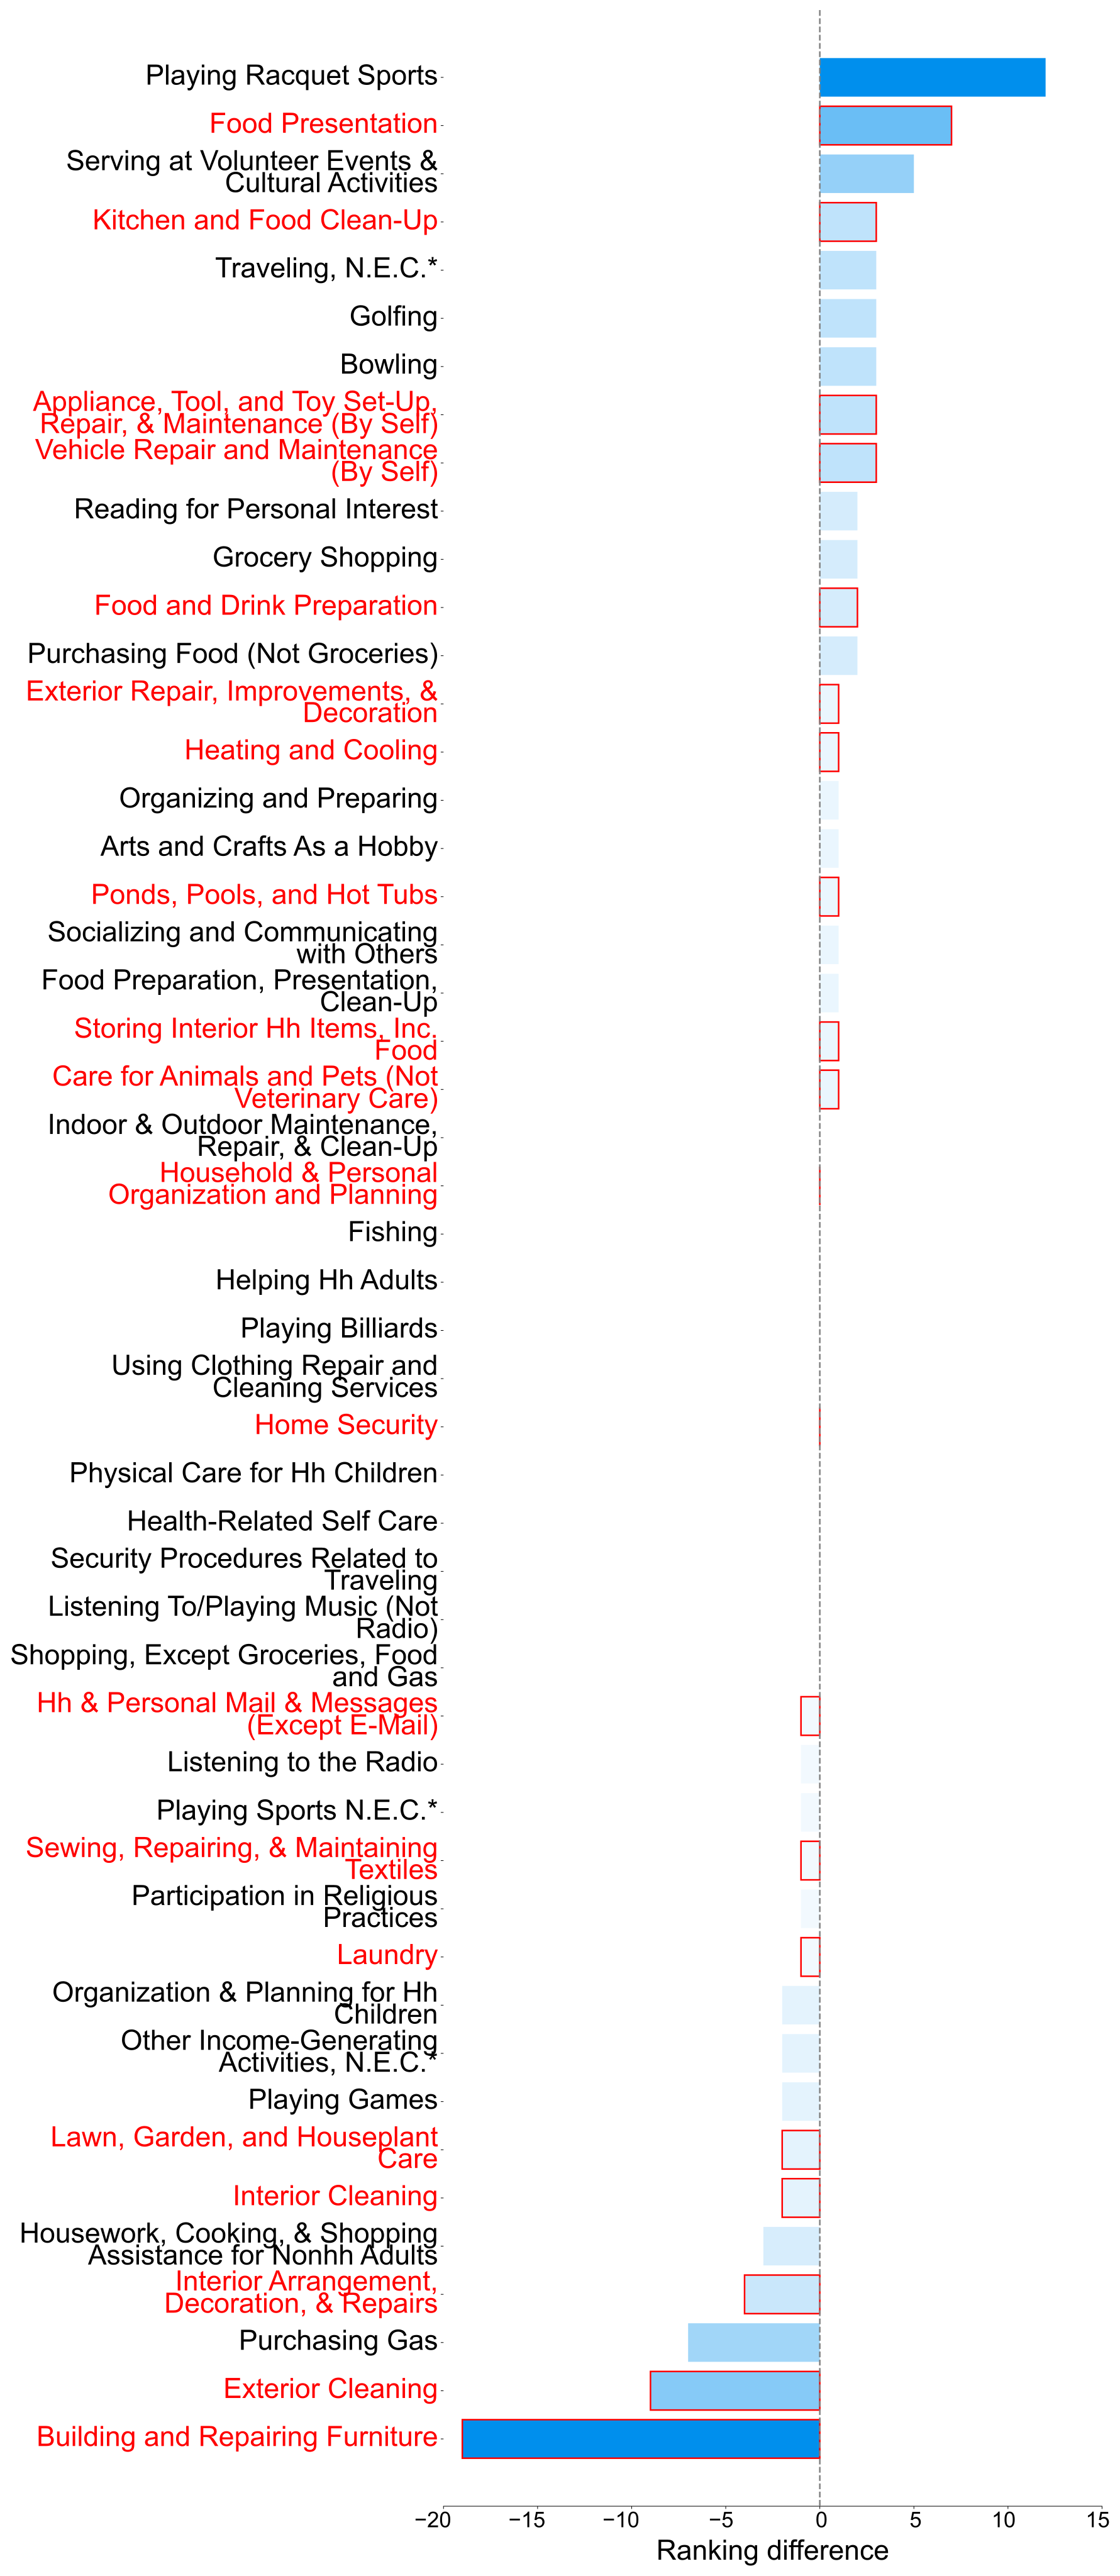
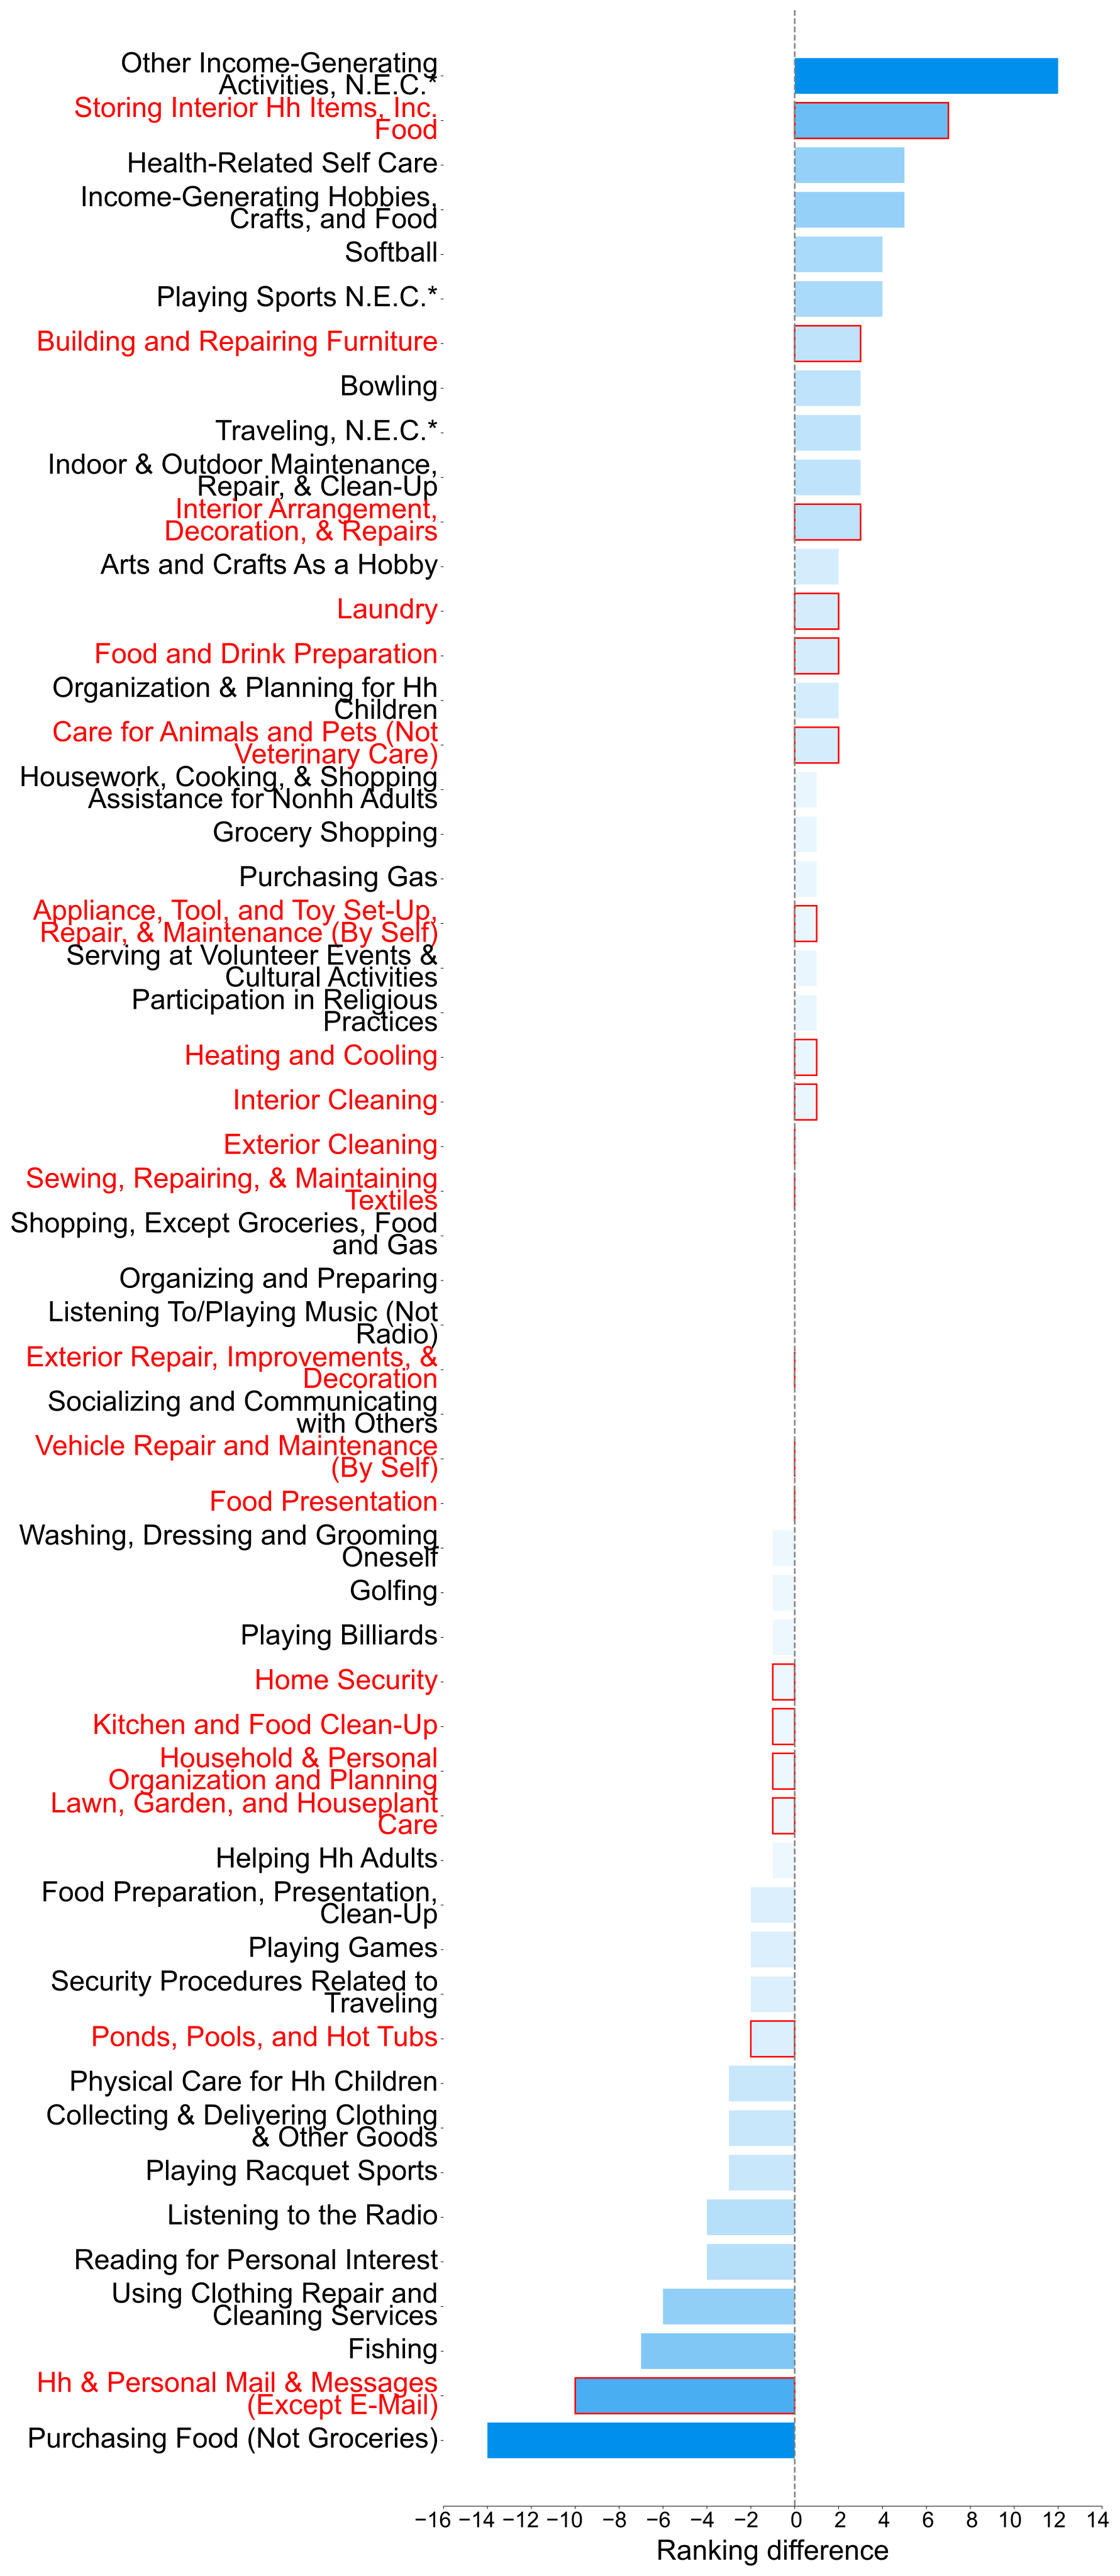
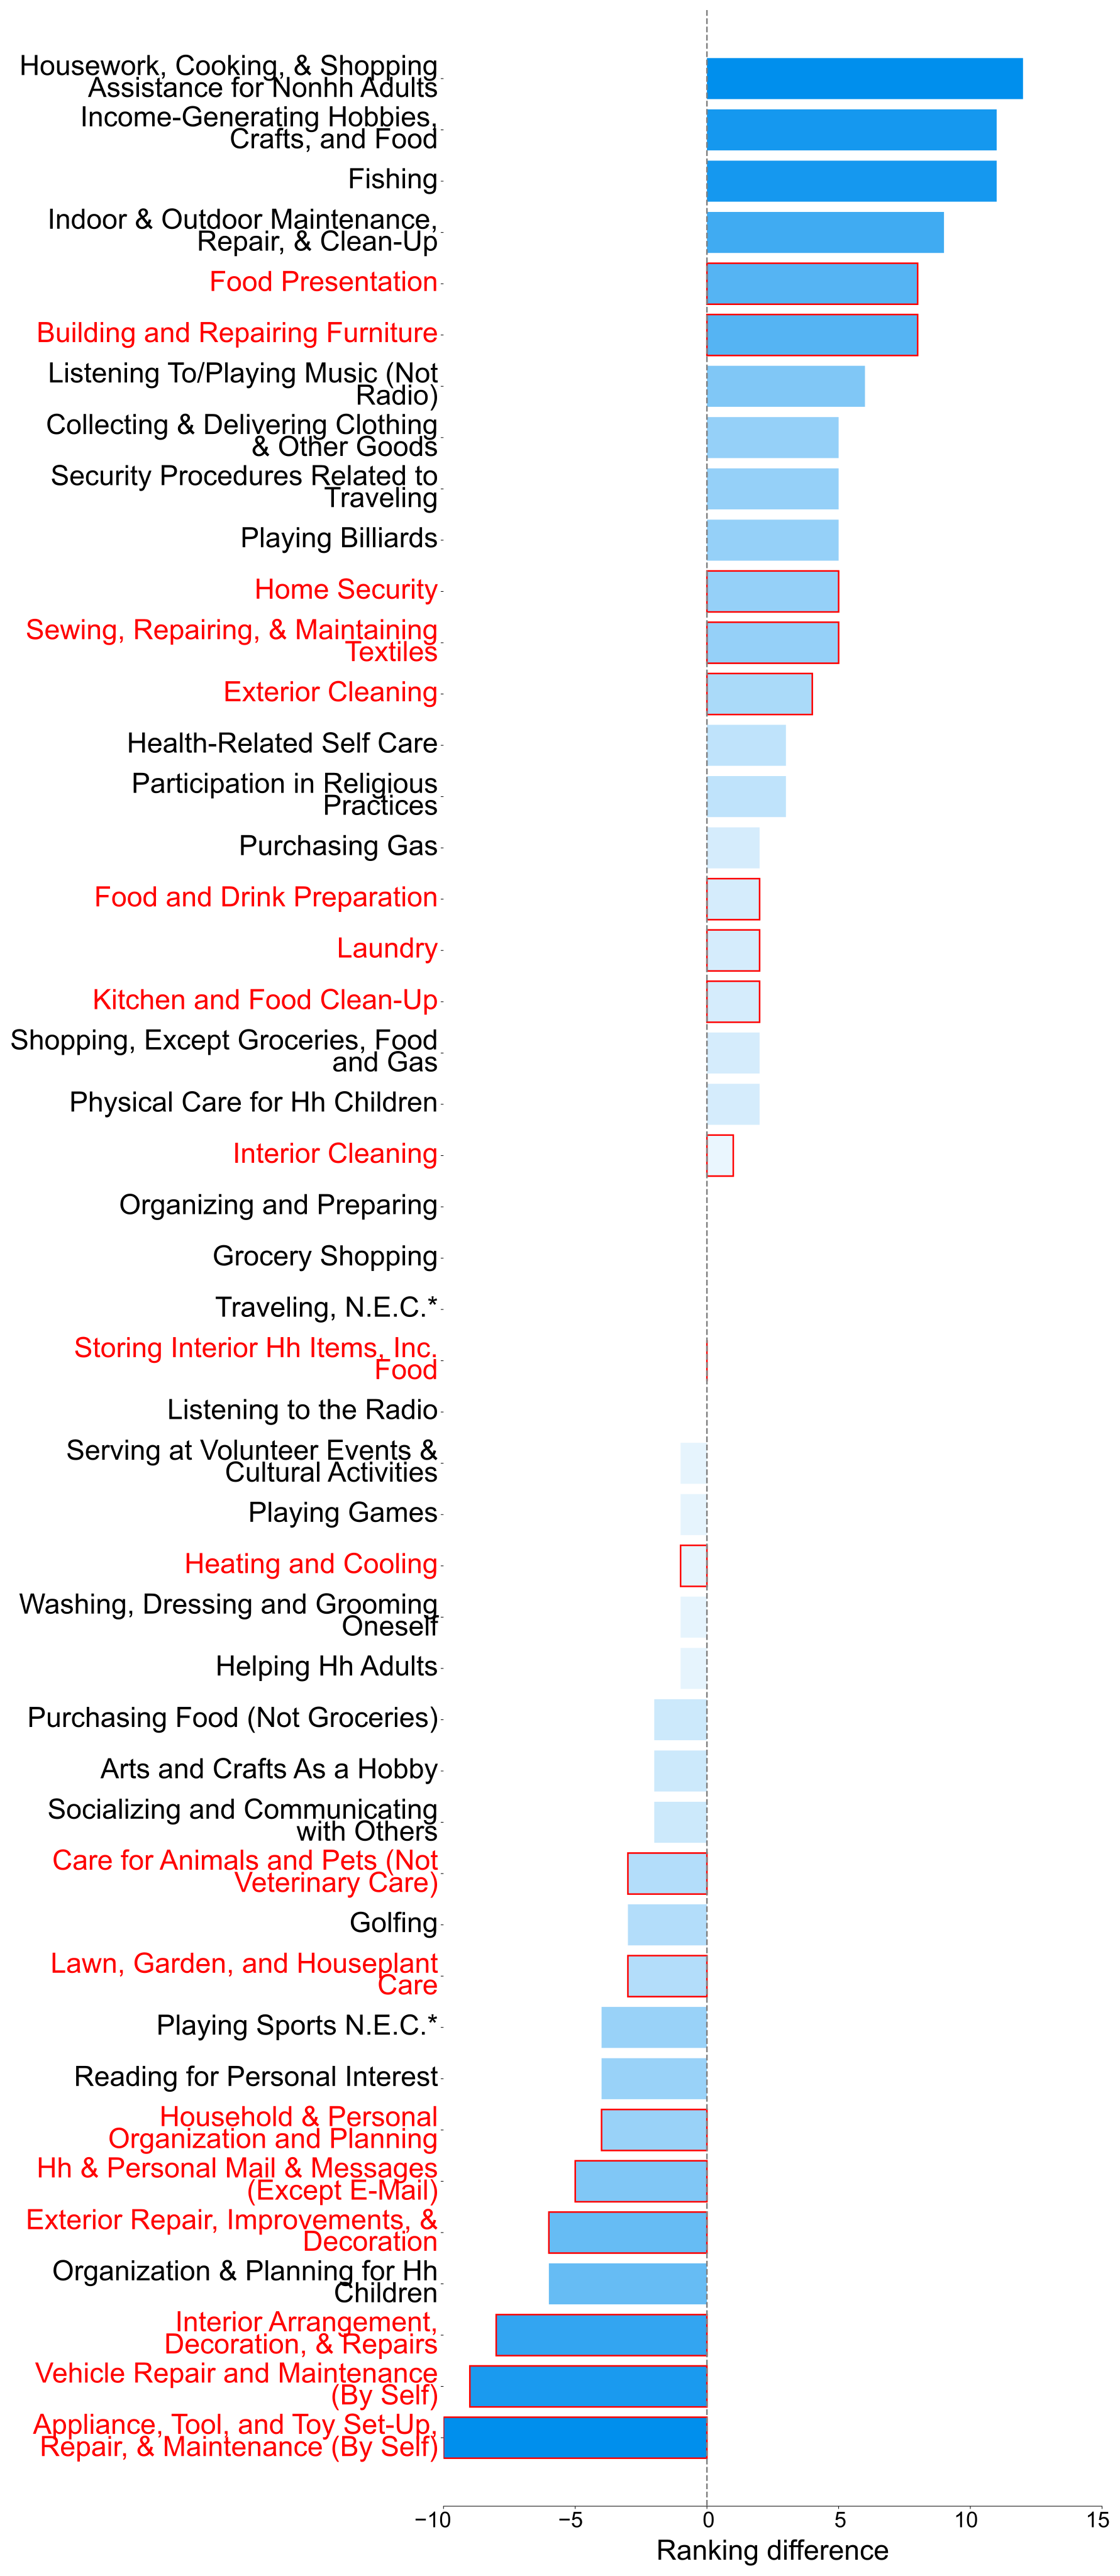
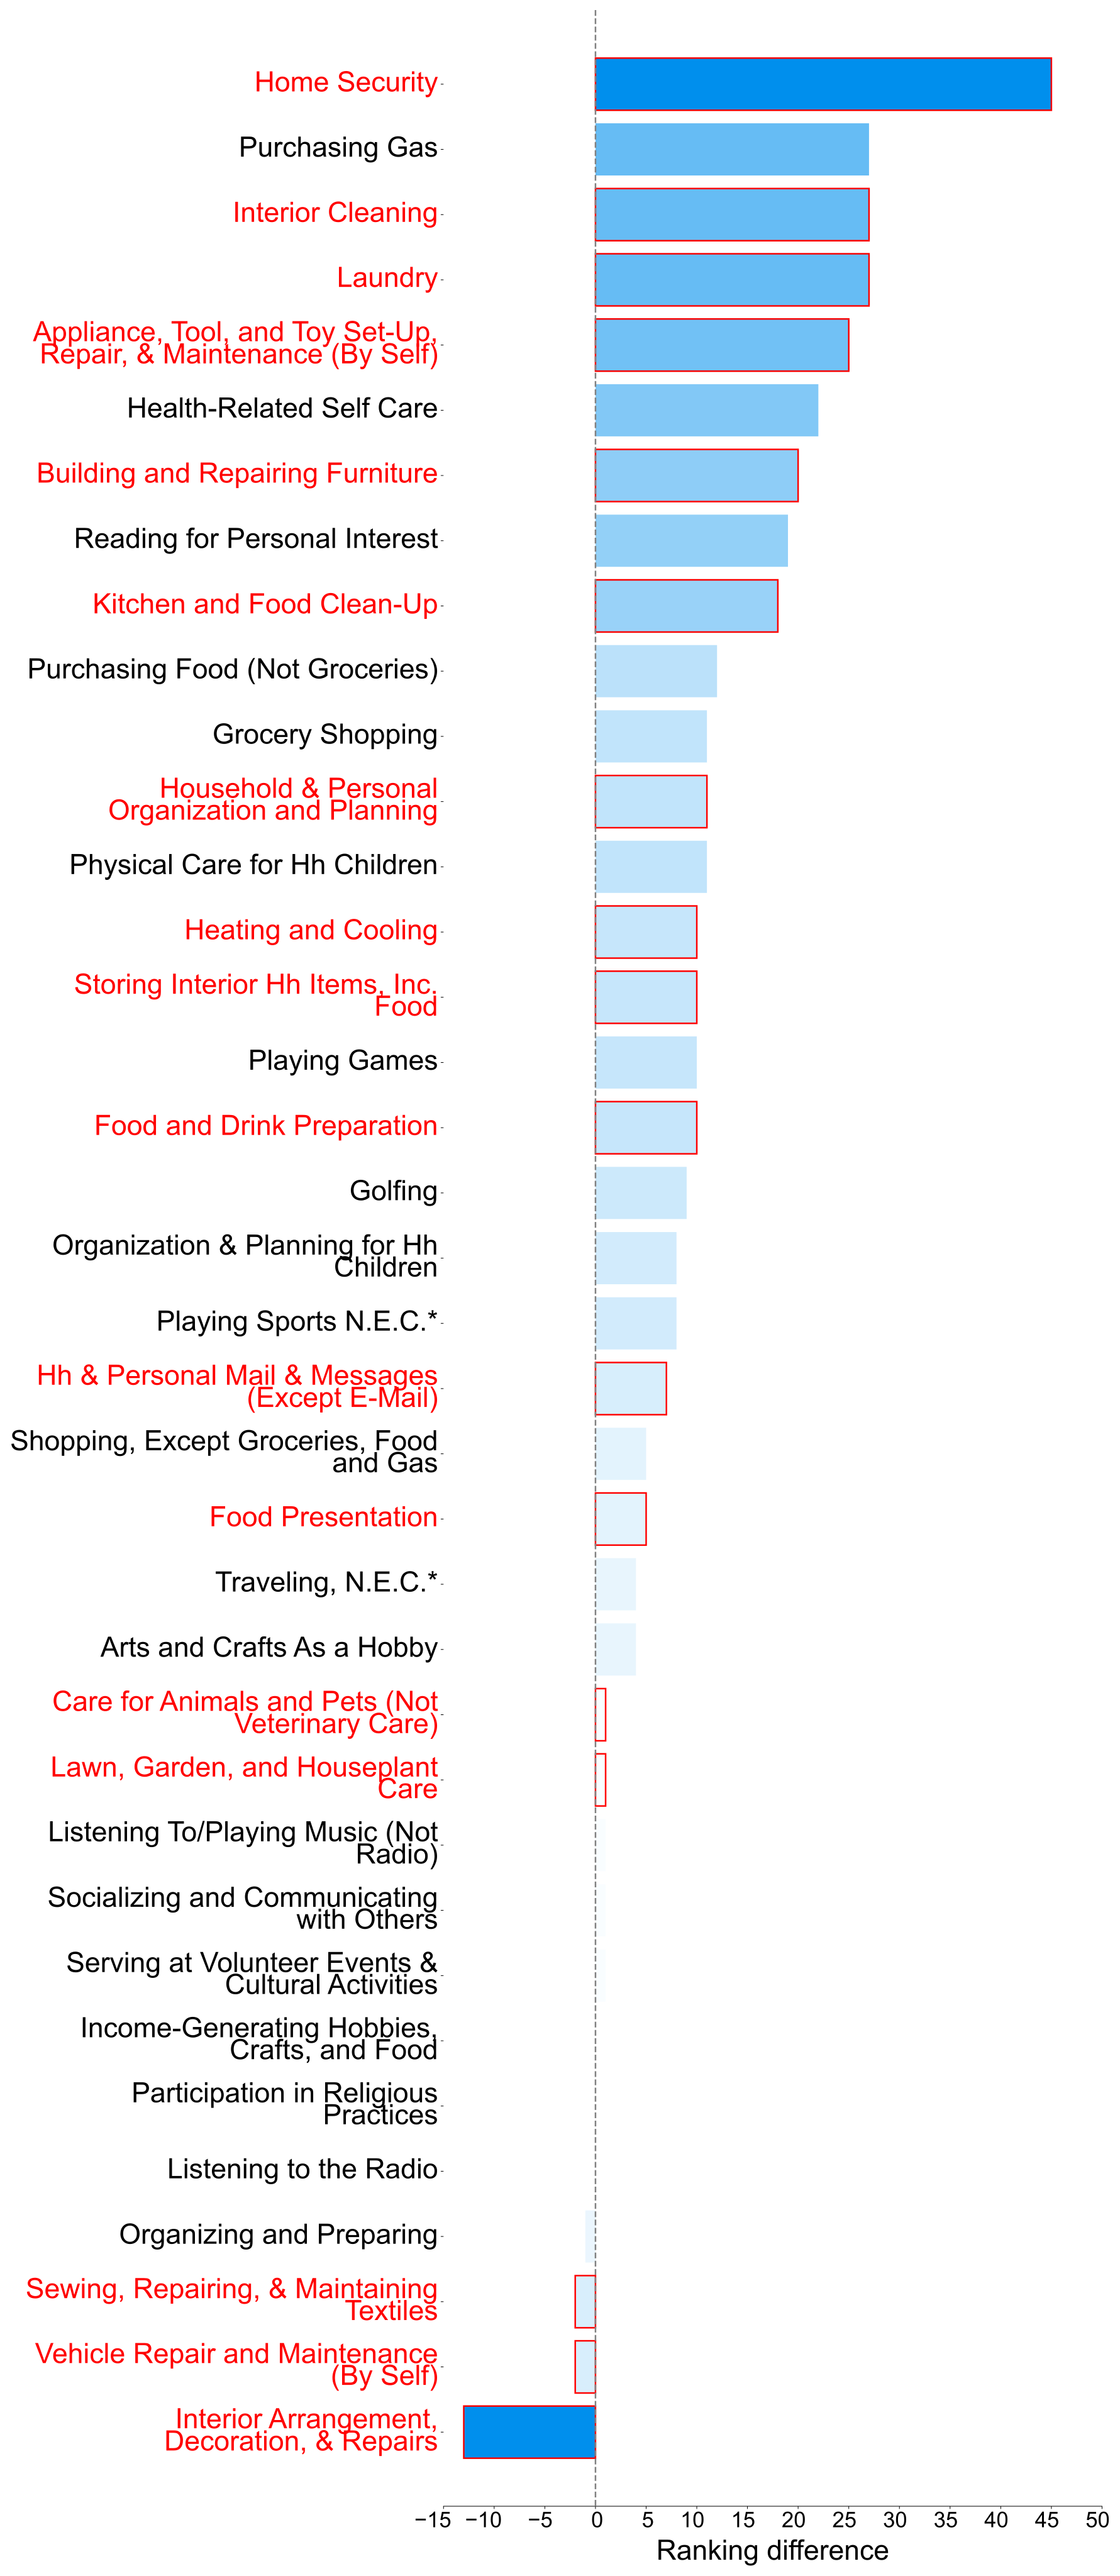
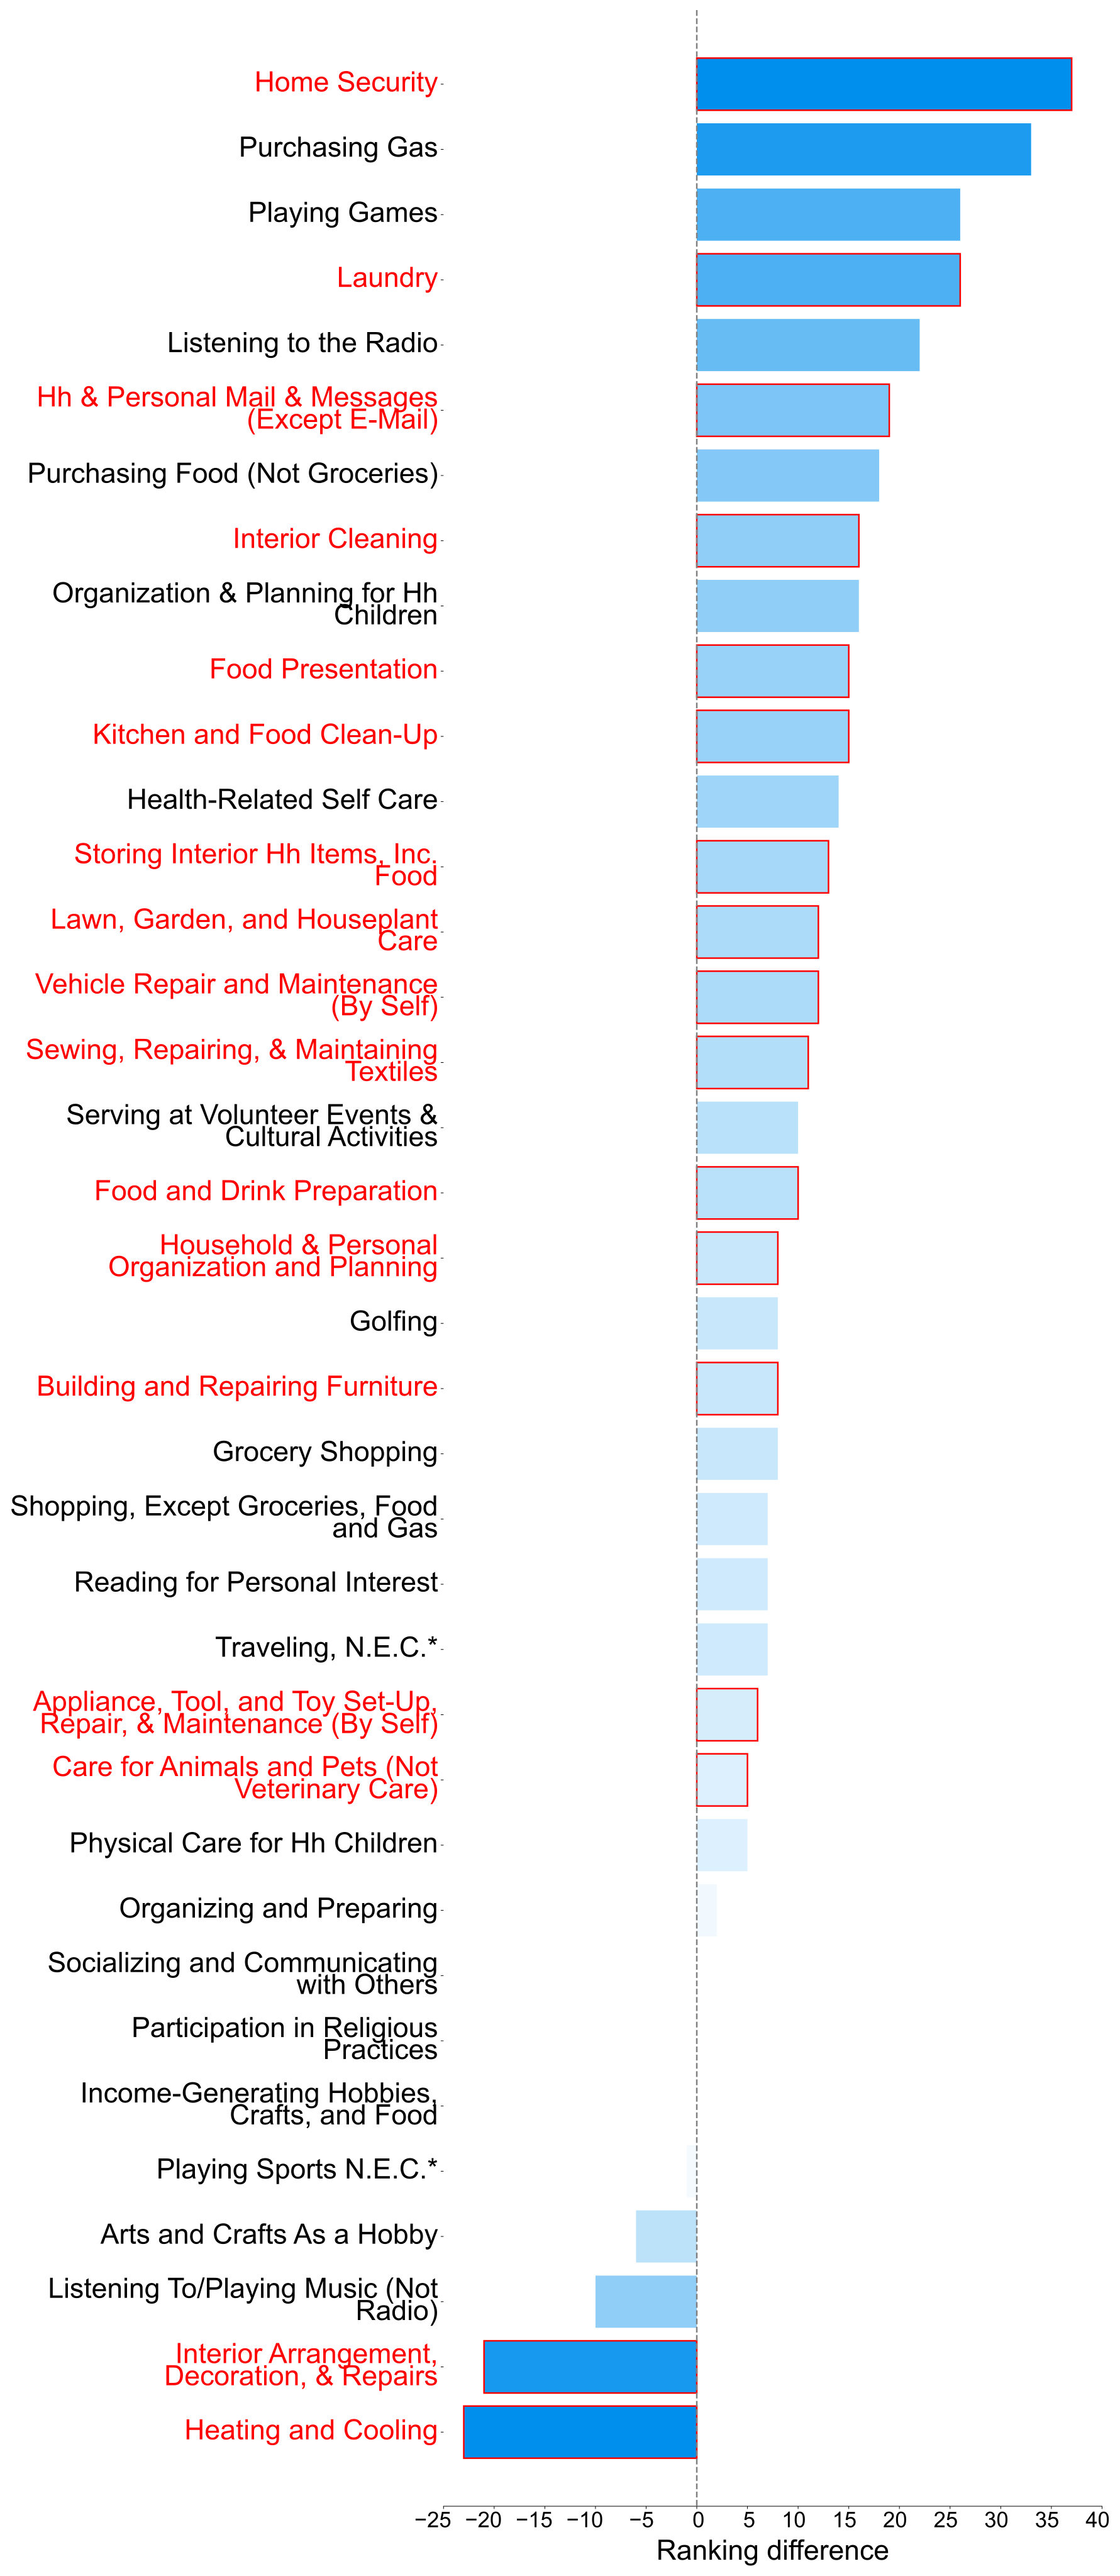
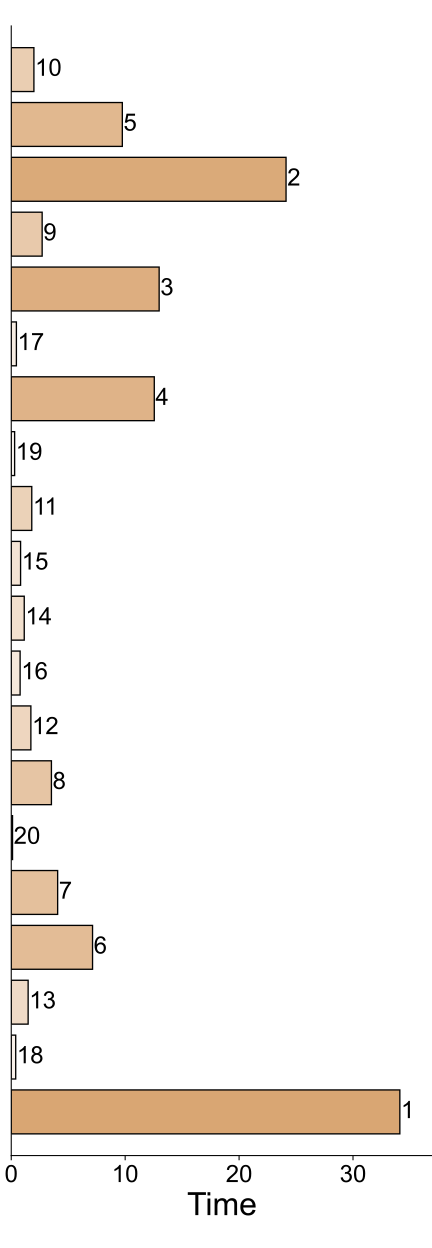
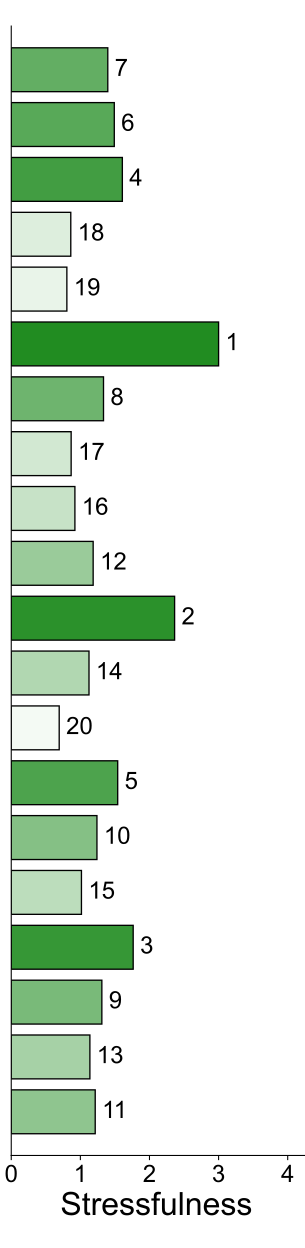
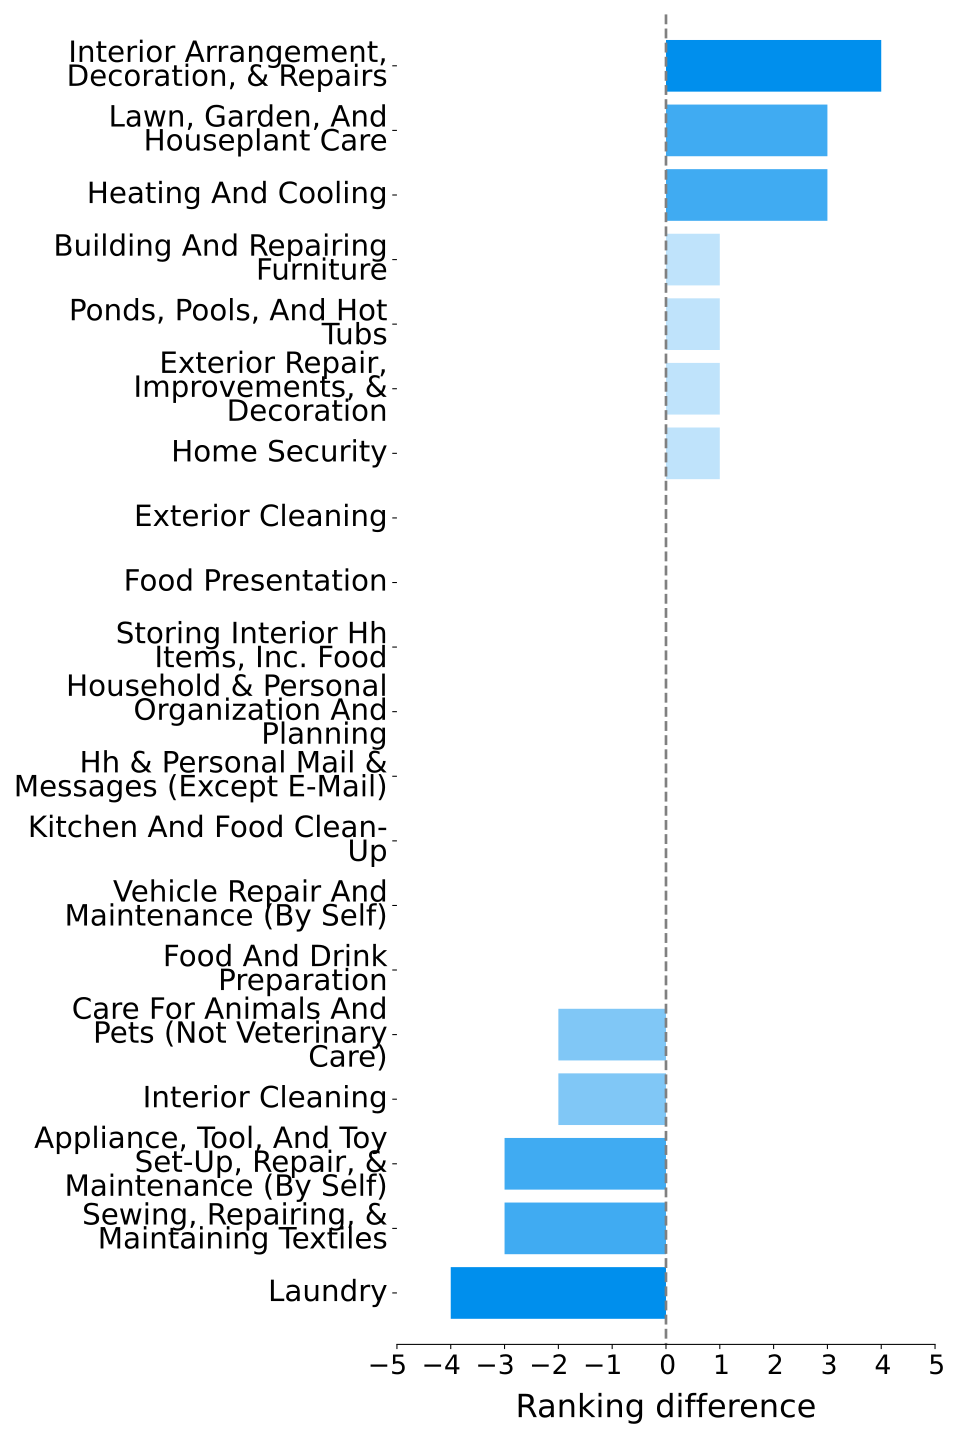
Population-average time and automation desire have Spearman correlation 0.03 with p=0.83, and no subgroup has a significant time correlation. This supports a weak observed association in these rankings, rather than proof that time never matters. Relative ranking shifts are negative for men versus the general sample (−0.43) and men versus women (−0.42). These are medium-sized coefficients under the paper’s stated convention, despite stronger wording in its discussion. Table p-values rounded to 0.00 are not literally zero.
| GP | WN | MN | HI | MI | LI | ||
|---|---|---|---|---|---|---|---|
| DA-T | () | () | () | () | () | () | |
| () | () | () | () | () | () | ||
| DA-H | () | () | () | () | () | () | |
| () | () | () | () | () | () | ||
| DA-M | () | () | () | () | () | () | |
| () | () | () | () | () | () | ||
| DA-P | () | () | () | () | () | () | |
| () | () | () | () | () | () | ||
| DA-B | () | () | () | () | () | () | |
| () | () | () | () | () | () | ||
| DA-S | () | () | () | () | () | () | |
| () | () | () | () | () | () | ||
| DA-Z | () | () | () | () | () | () | |
| () | () | () | () | () | () |
4.2 Well-Being factors as predictors for desire for robotic automation
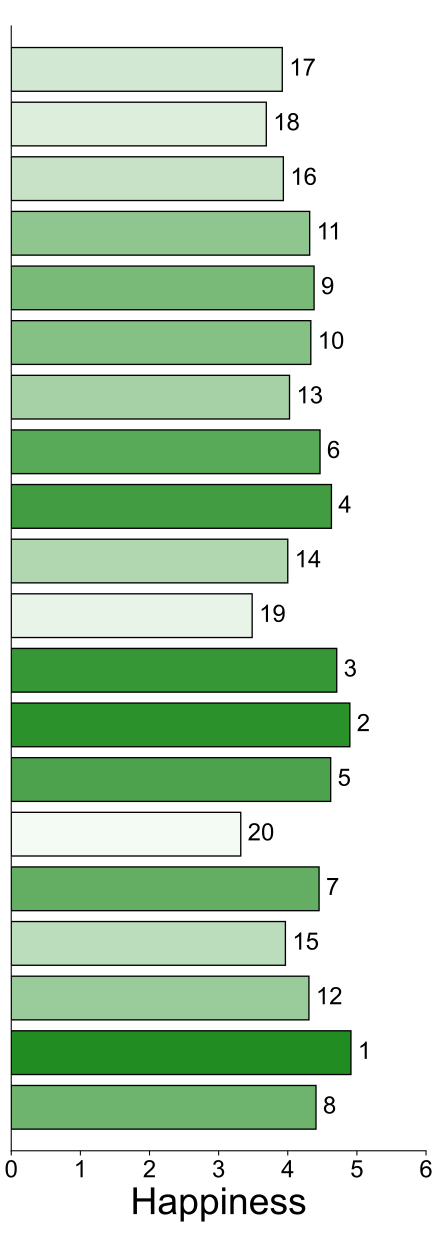
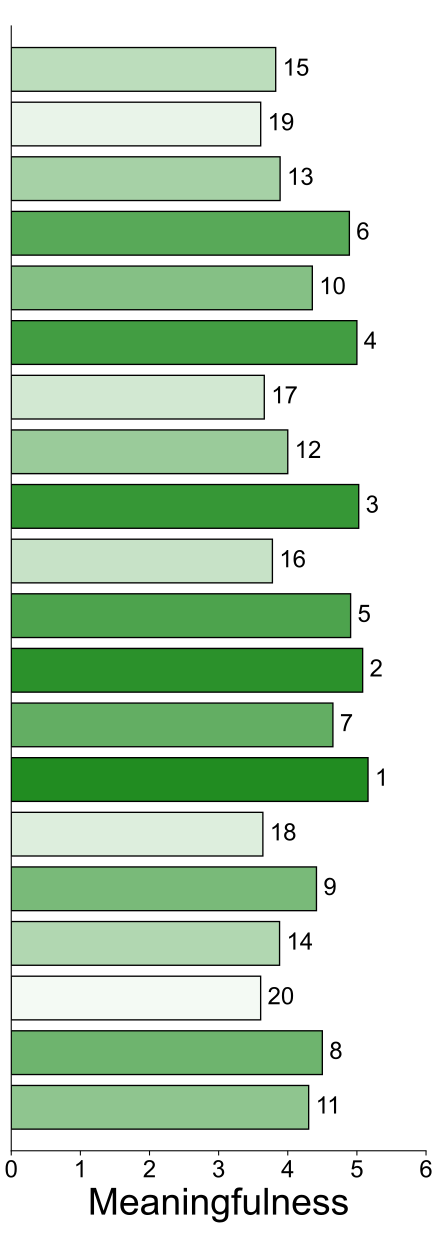
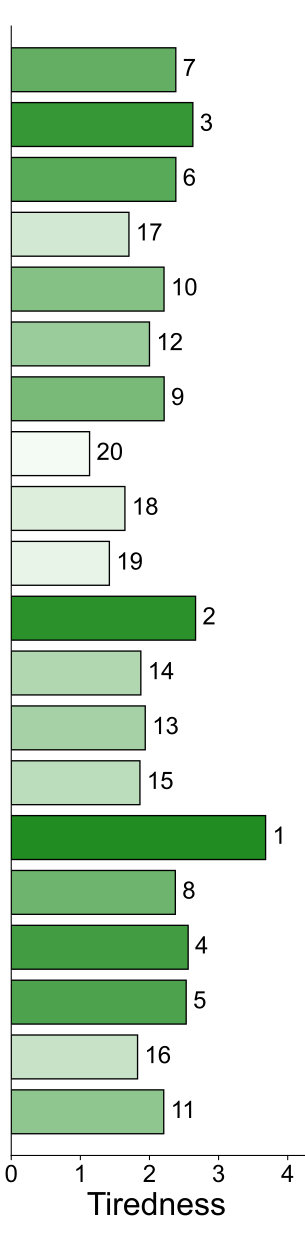
For the full sample, happiness has Spearman correlation −0.36 with automation desire (p=0.01), and pain has correlation 0.30 (p=0.04). Sadness, stress, tiredness, and meaningfulness do not meet the stated threshold for the full sample. Men show the happiness association (−0.36, p=0.01); women show a stress association (0.32, p=0.03). Women’s happiness result is weaker: Spearman p=0.07 and rounded Kendall p=0.05. Middle-income respondents show negative happiness (−0.29, p=0.04) and meaningfulness (−0.31, p=0.03) associations.
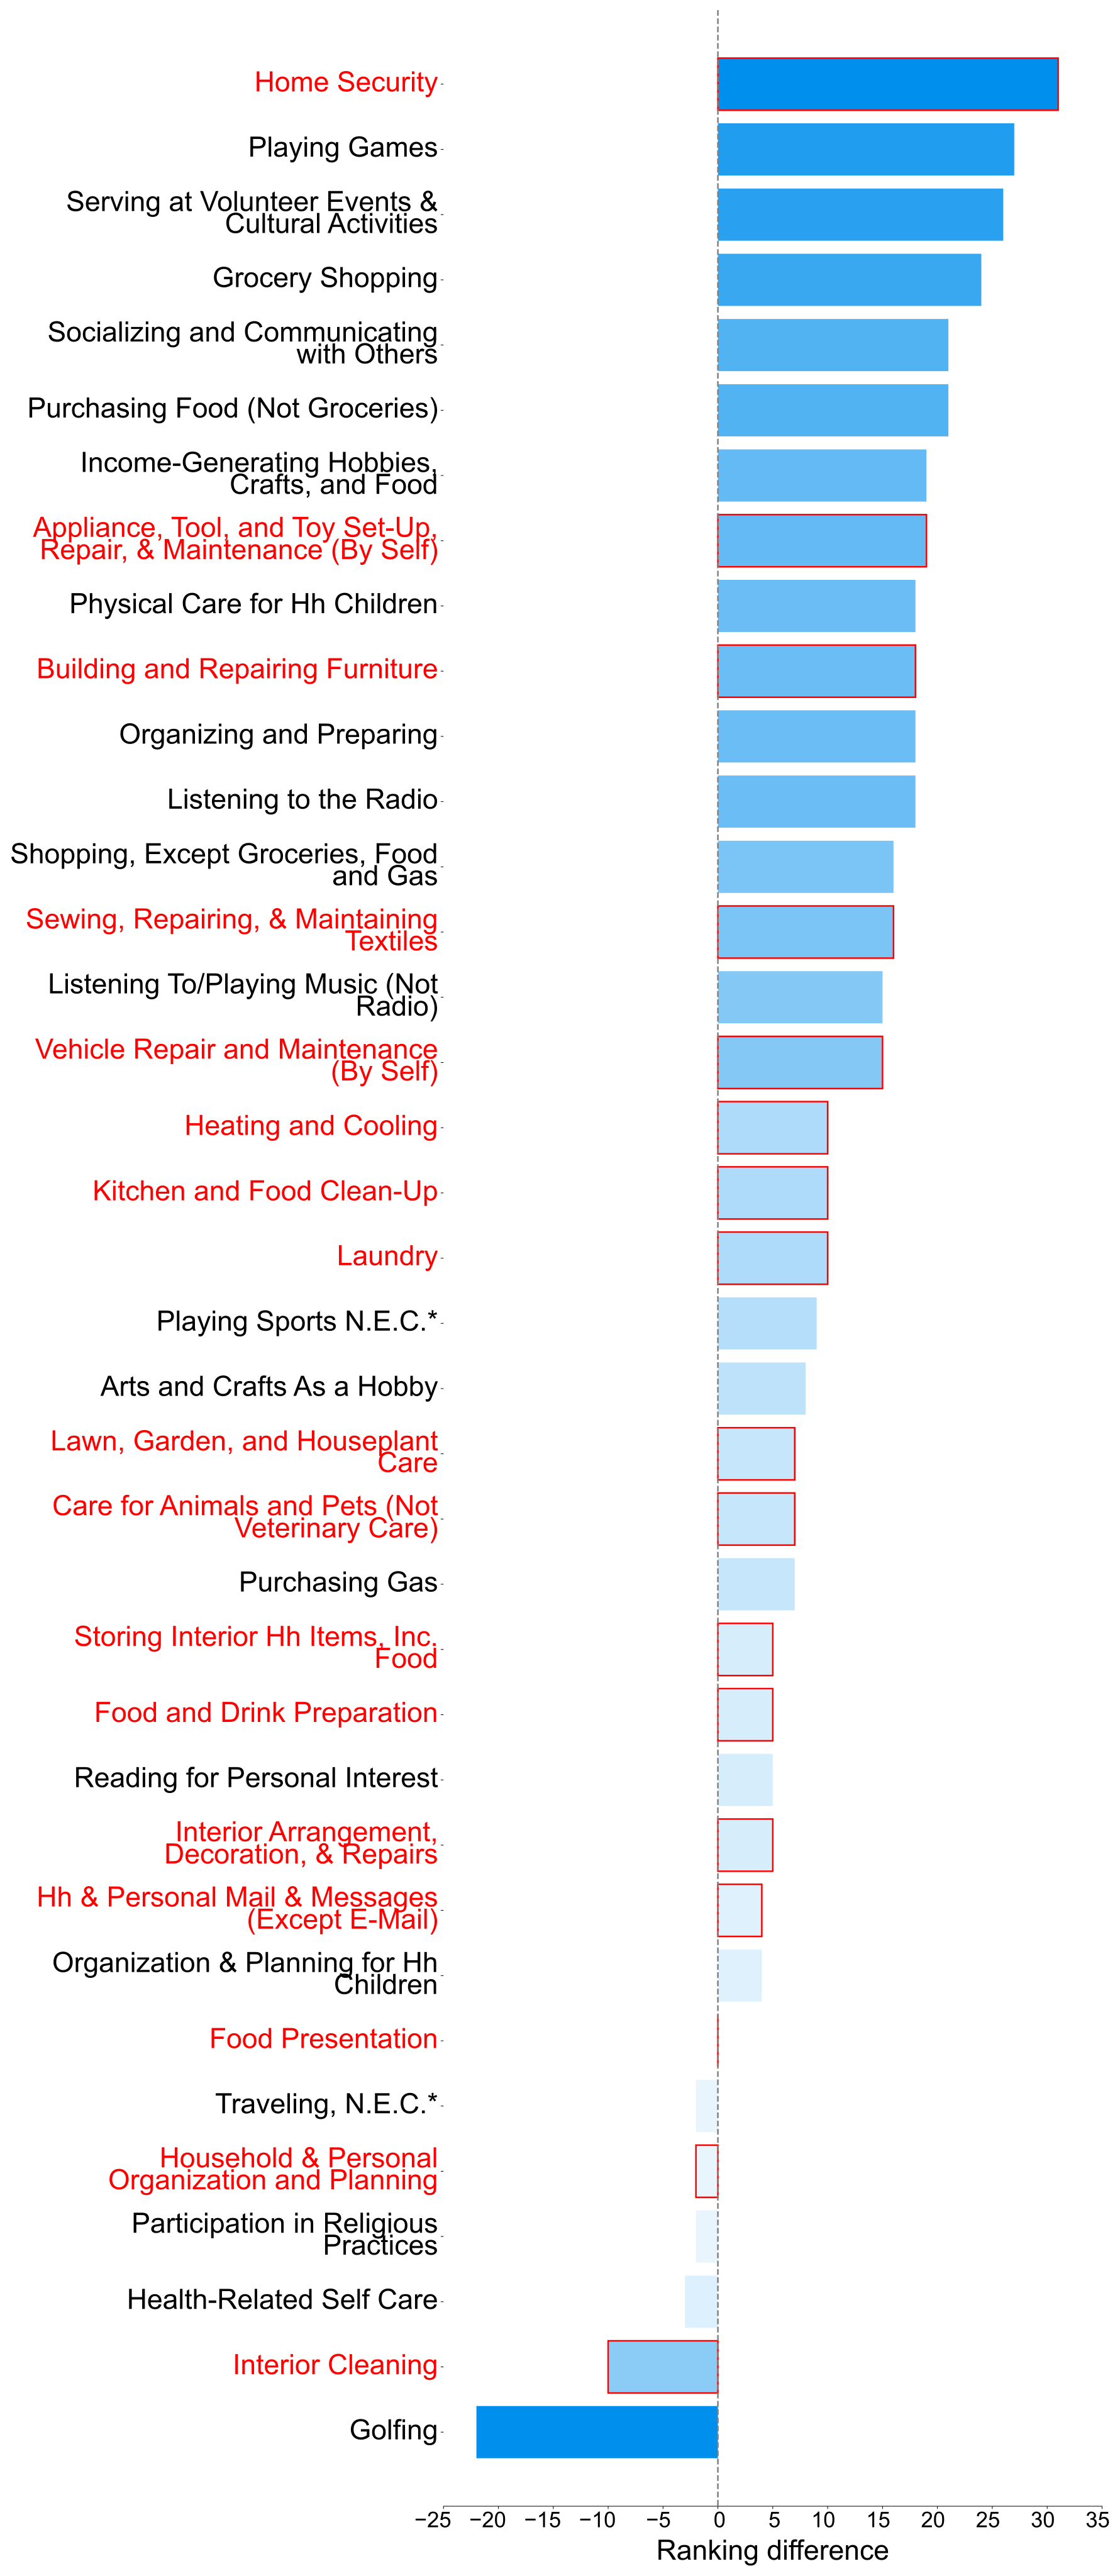
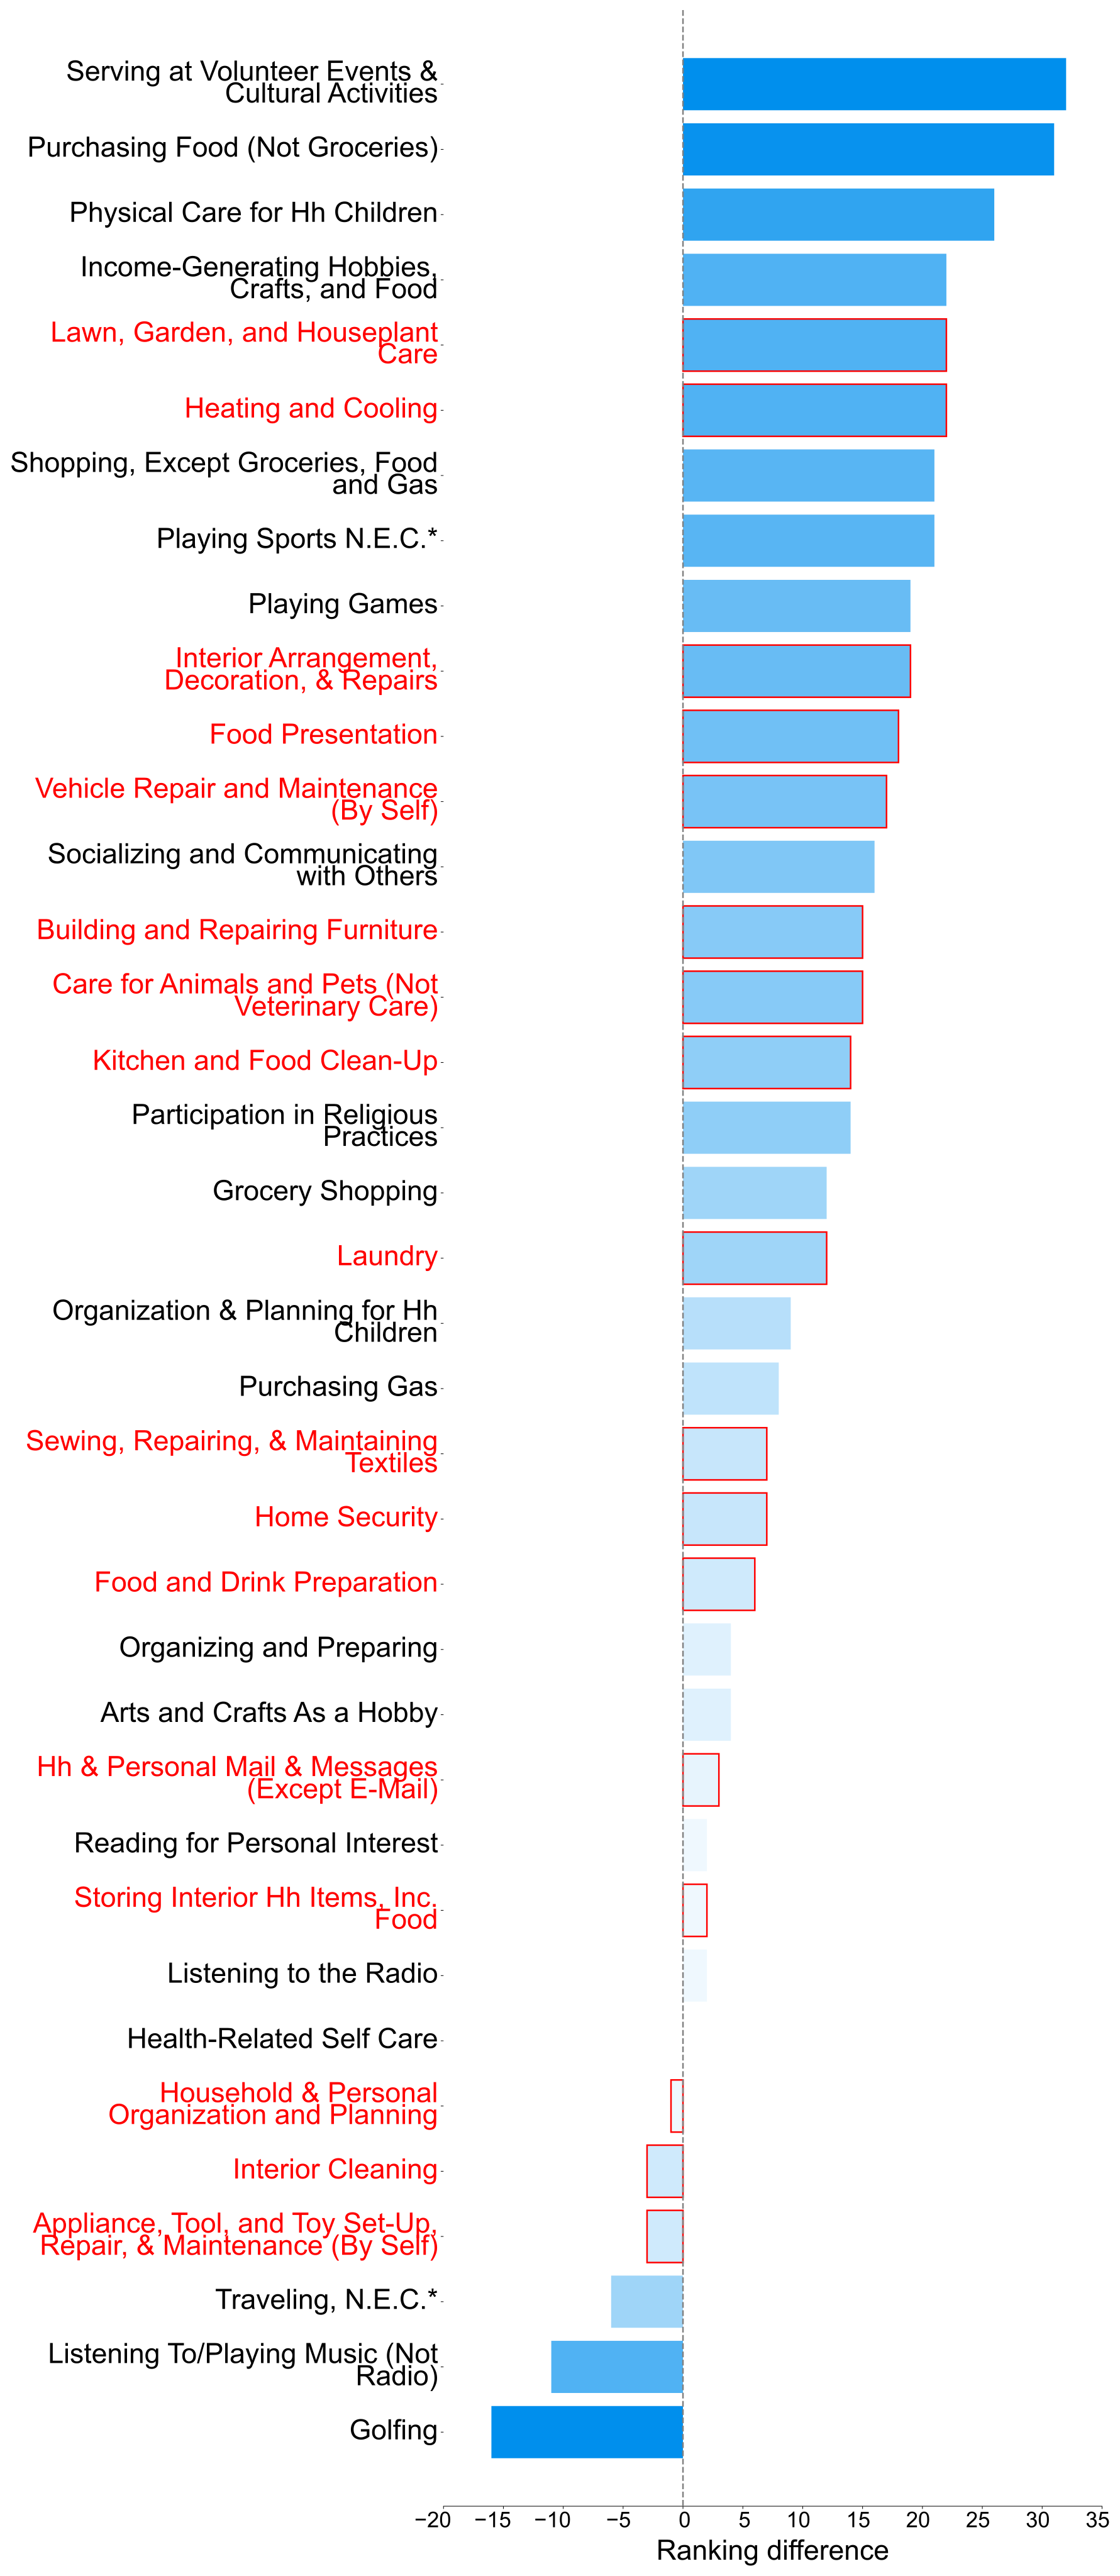
The relative-income claims are less decisive than the prose suggests. High-income versus general-sample happiness differences yield 0.32 with p=0.07, with Kendall p rounded to 0.05; low-income meaningfulness differences yield 0.32 with p rounded to 0.05 and Kendall p=0.06. A women-versus-general pain difference has Spearman p=0.04 but Kendall p=0.06. These mixed and borderline comparisons warrant caution, especially without multiplicity correction.
| WN-GP | MN-GP | MN-WN | HI-GP | MI-GP | LI-GP | ||
|---|---|---|---|---|---|---|---|
| DA-T | () | () | () | () | () | () | |
| () | () | () | () | () | () | ||
| DA-H | () | () | () | () | () | () | |
| () | () | () | () | () | () | ||
| DA-M | () | () | () | () | () | () | |
| () | () | () | () | () | () | ||
| DA-P | () | () | () | () | () | () | |
| () | () | () | () | () | () | ||
| DA-B | () | () | () | () | () | () | |
| () | () | () | () | () | () | ||
| DA-S | () | () | () | () | () | () | |
| () | () | () | () | () | () | ||
| DA-Z | () | () | () | () | () | () | |
| () | () | () | () | () | () |
5 Discussion
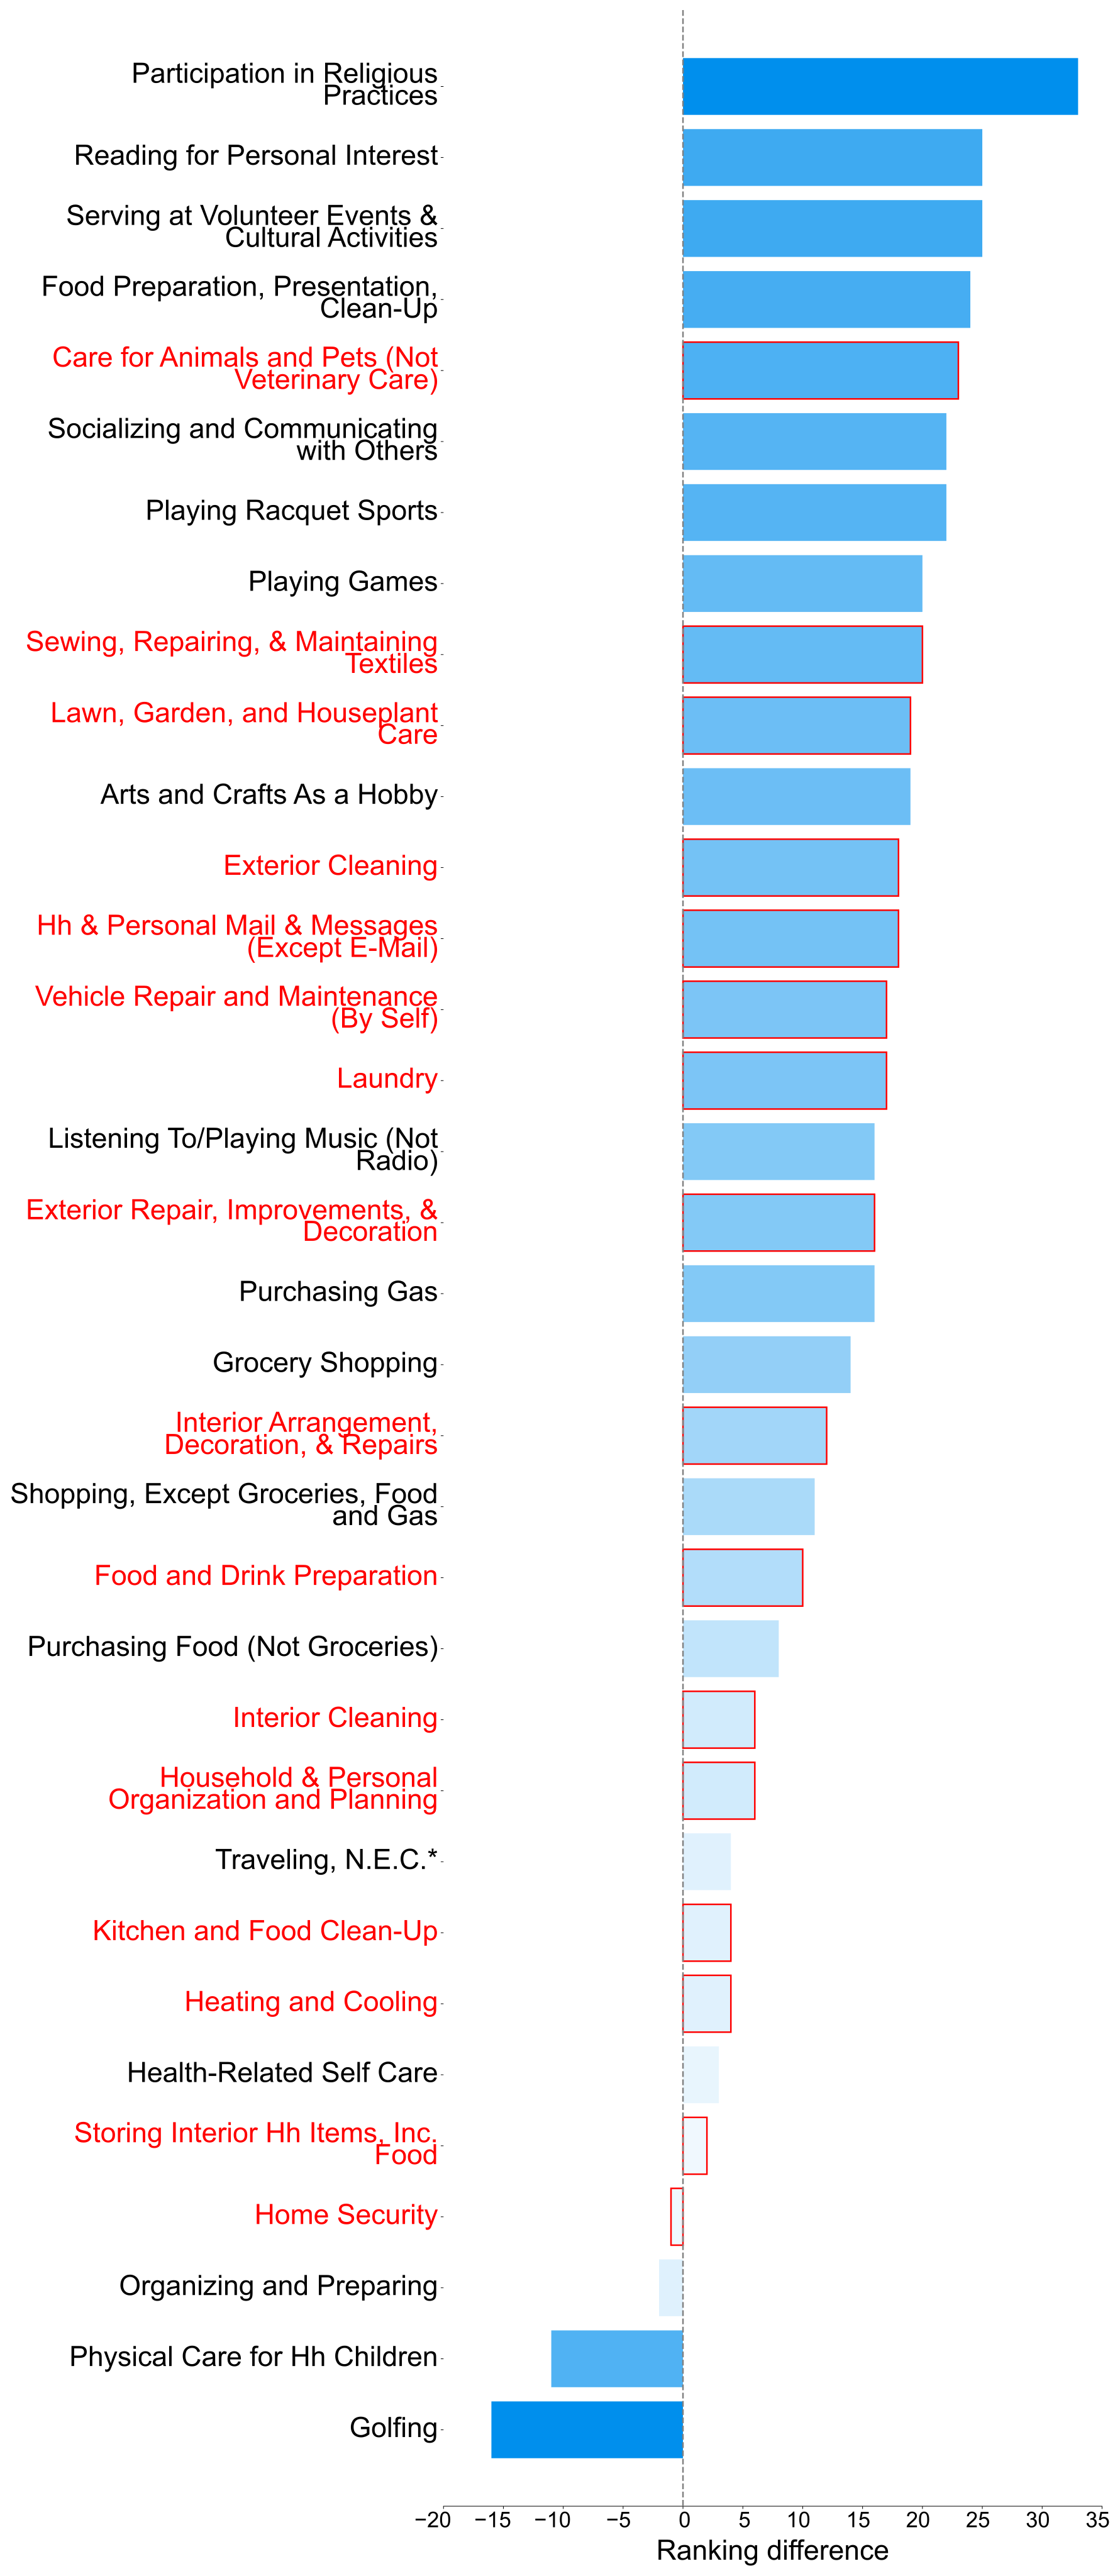
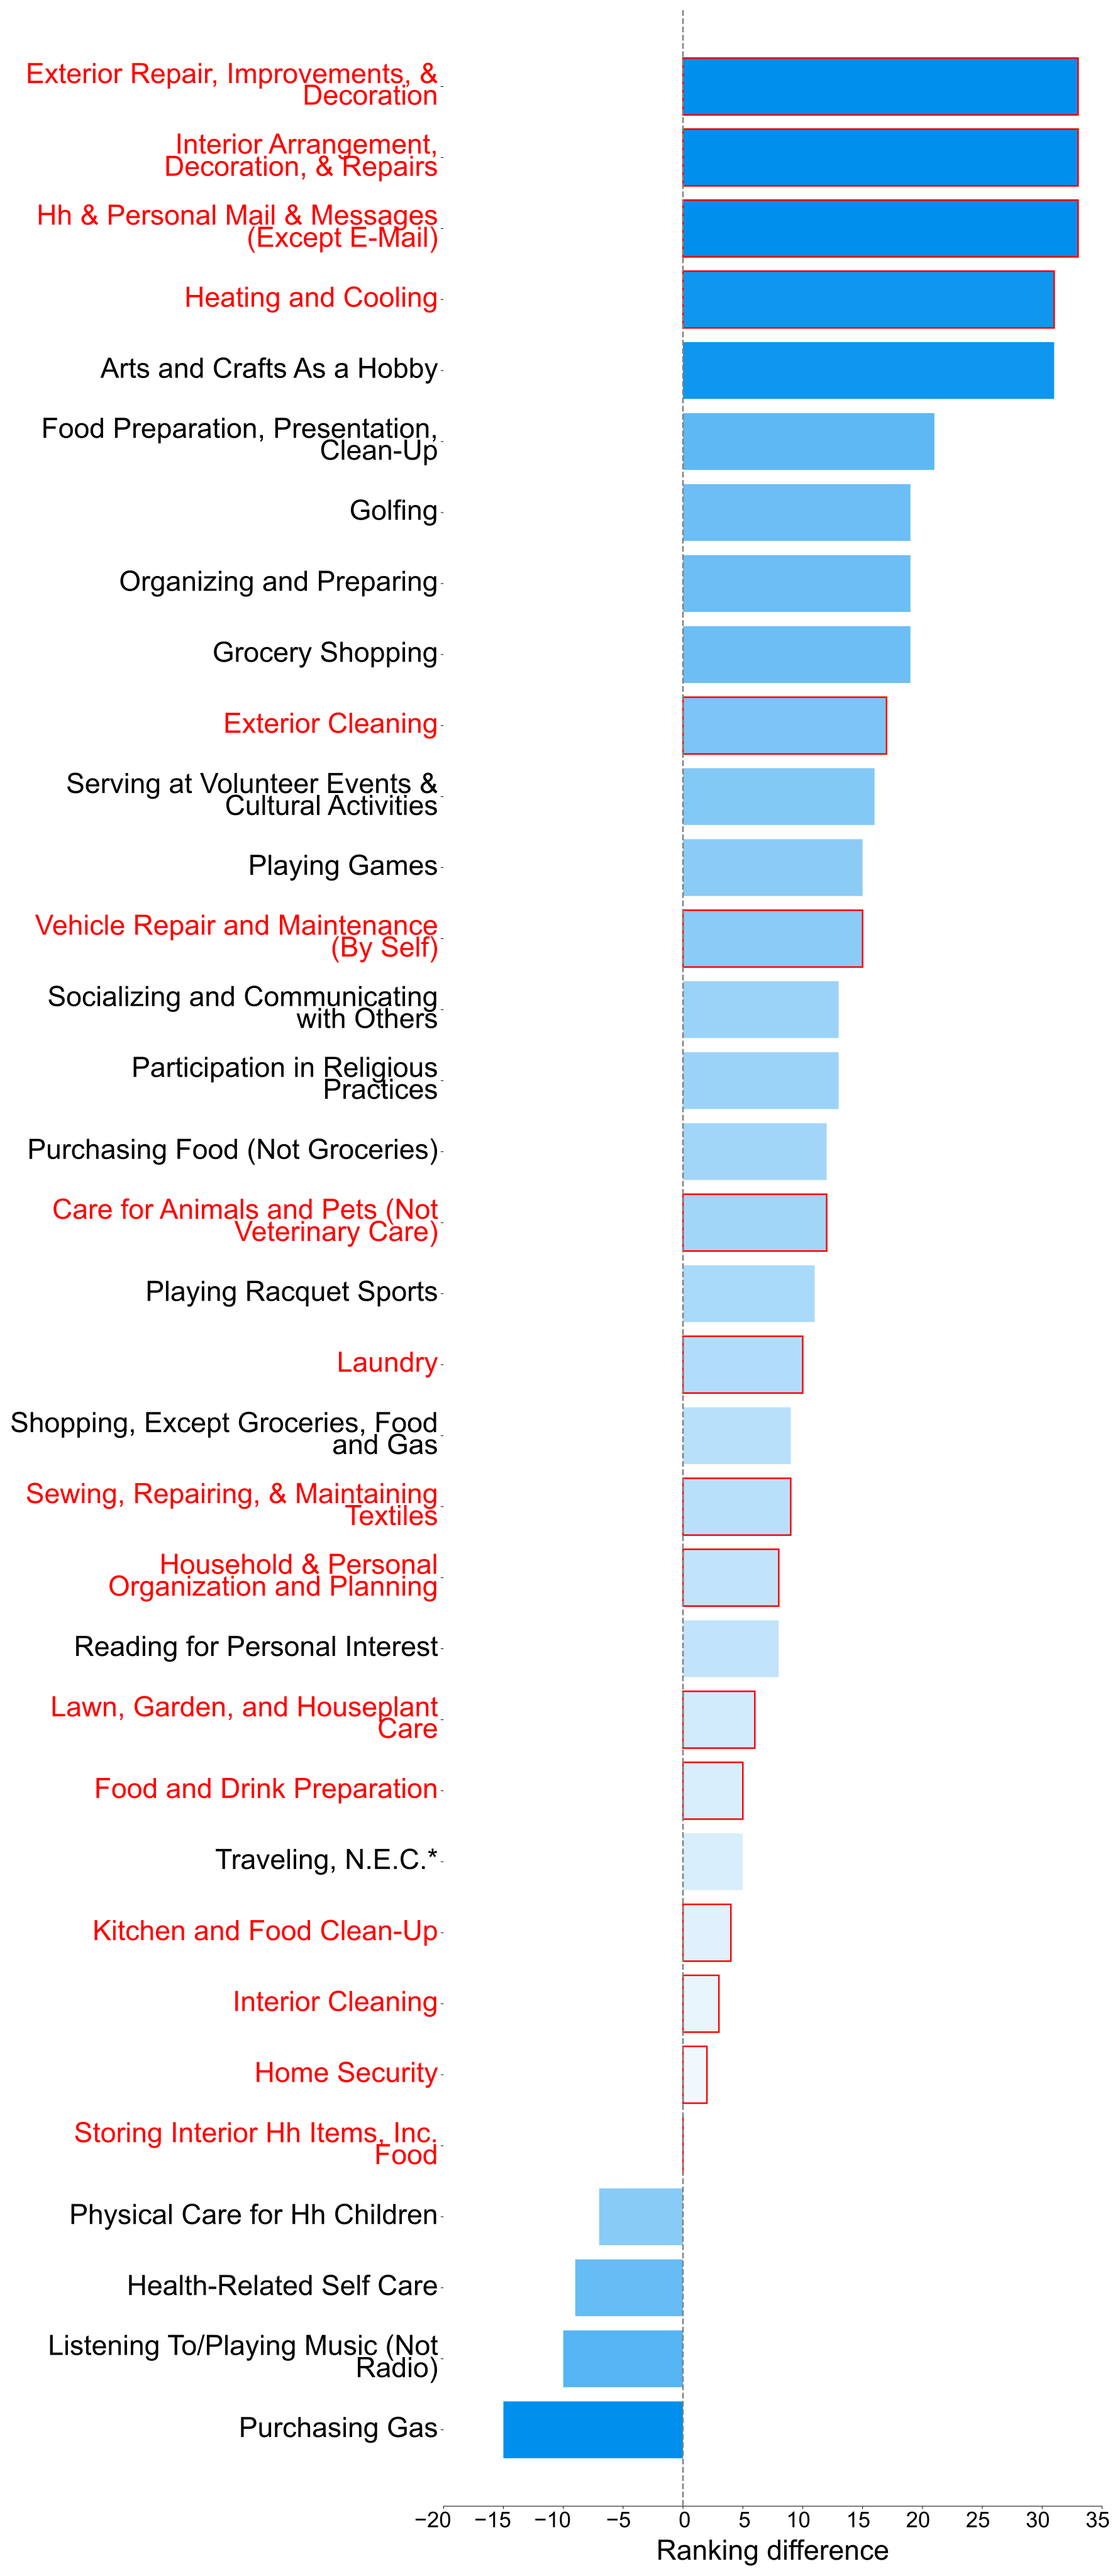
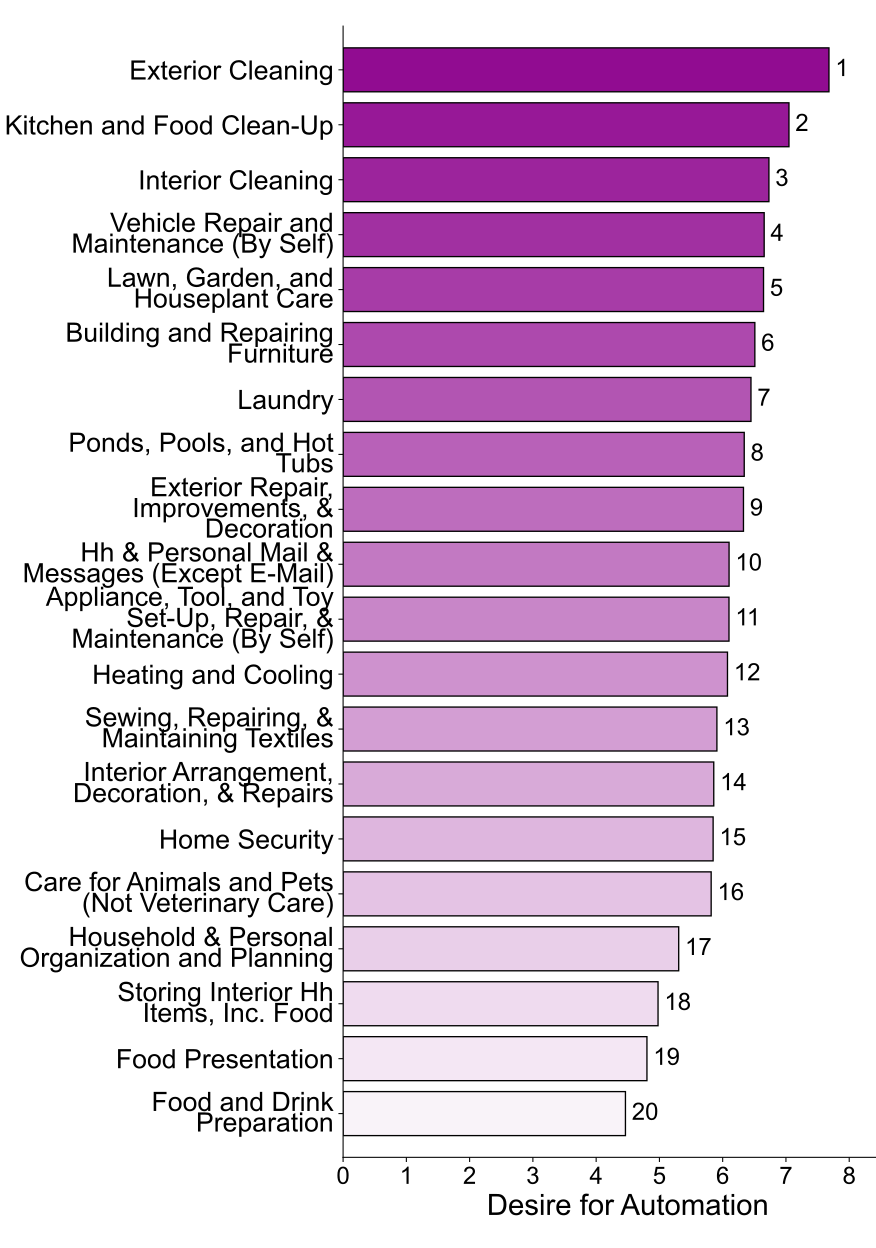
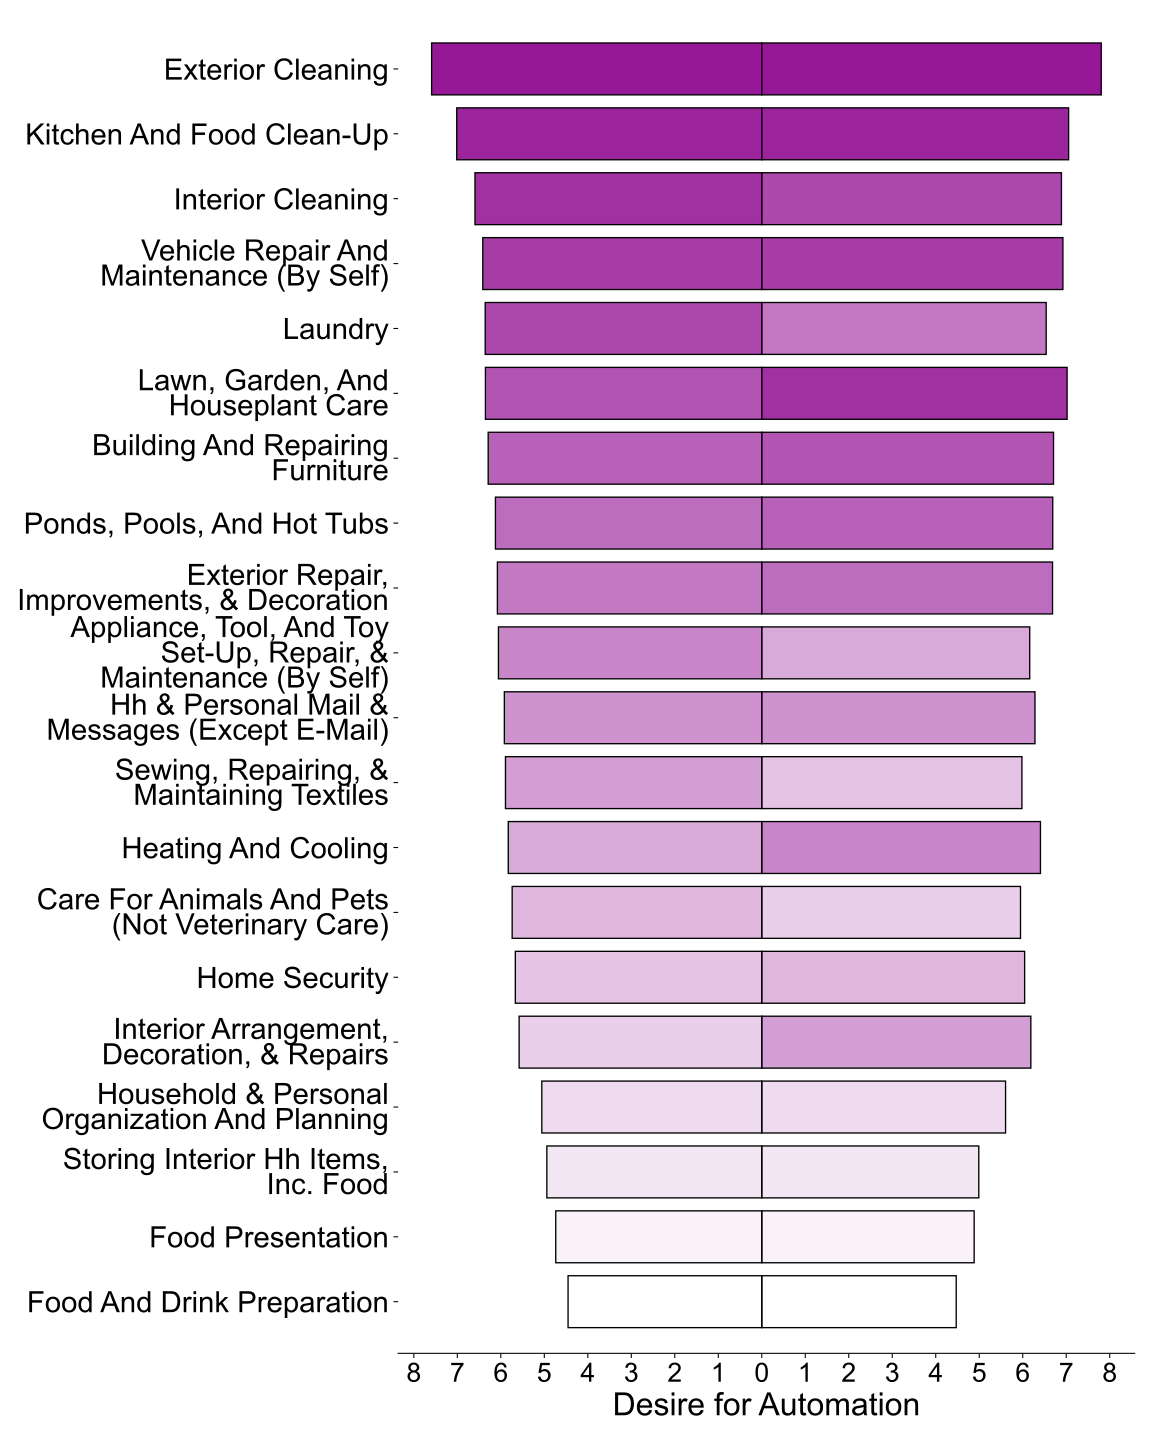
The household examples suggest that food preparation can be enjoyed while cleaning afterwards is less welcome, motivating robot-task choices beyond simply saving the most minutes. Differences in task responsibility may also help explain contrasting gender-category rankings. These interpretations remain hypotheses: neither the rank comparisons nor comparing one significant subgroup result with another nonsignificant result establishes a causal mechanism or a statistically tested difference between groups.
The discussion and appendix acknowledge heterogeneous samples, small high-income representation, limited racial/intersectional analysis, binary gender alignment, heteronormative household assumptions, and a United States context. A joint survey of the same people would be needed to directly relate their own task experience and automation preferences. Additional limits include category aggregation and numerous exploratory tests.
6 Conclusion
The study provides activity-level evidence that unpleasant experience, especially lower happiness and greater pain, may help identify desired automation targets. It finds little association with population-average time in these data. The released survey and analysis tool support follow-up investigation, but the findings do not establish individual-level causes, universal demographic preferences, or guaranteed robot adoption.
Acknowledgements
The project received partial funding from Good Systems at the University of Texas at Austin.
7 Appendix
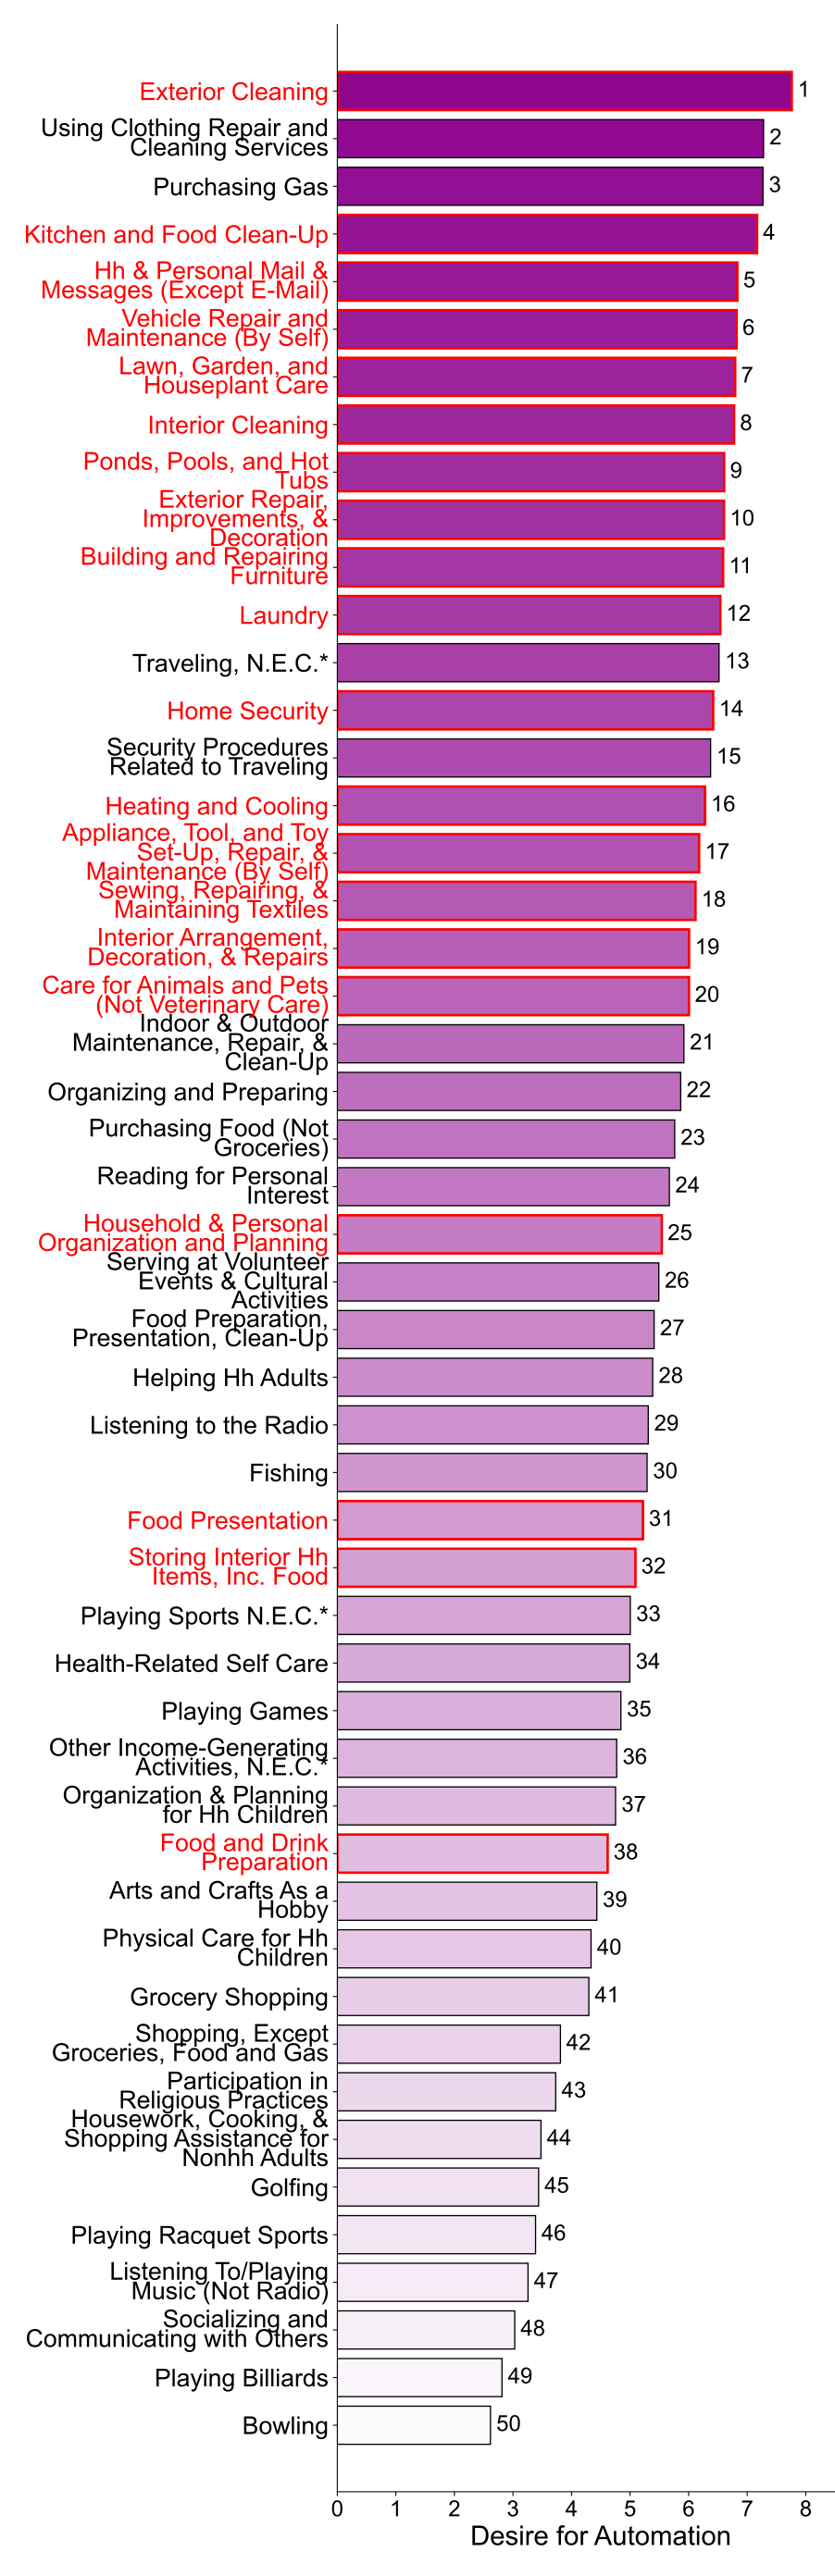
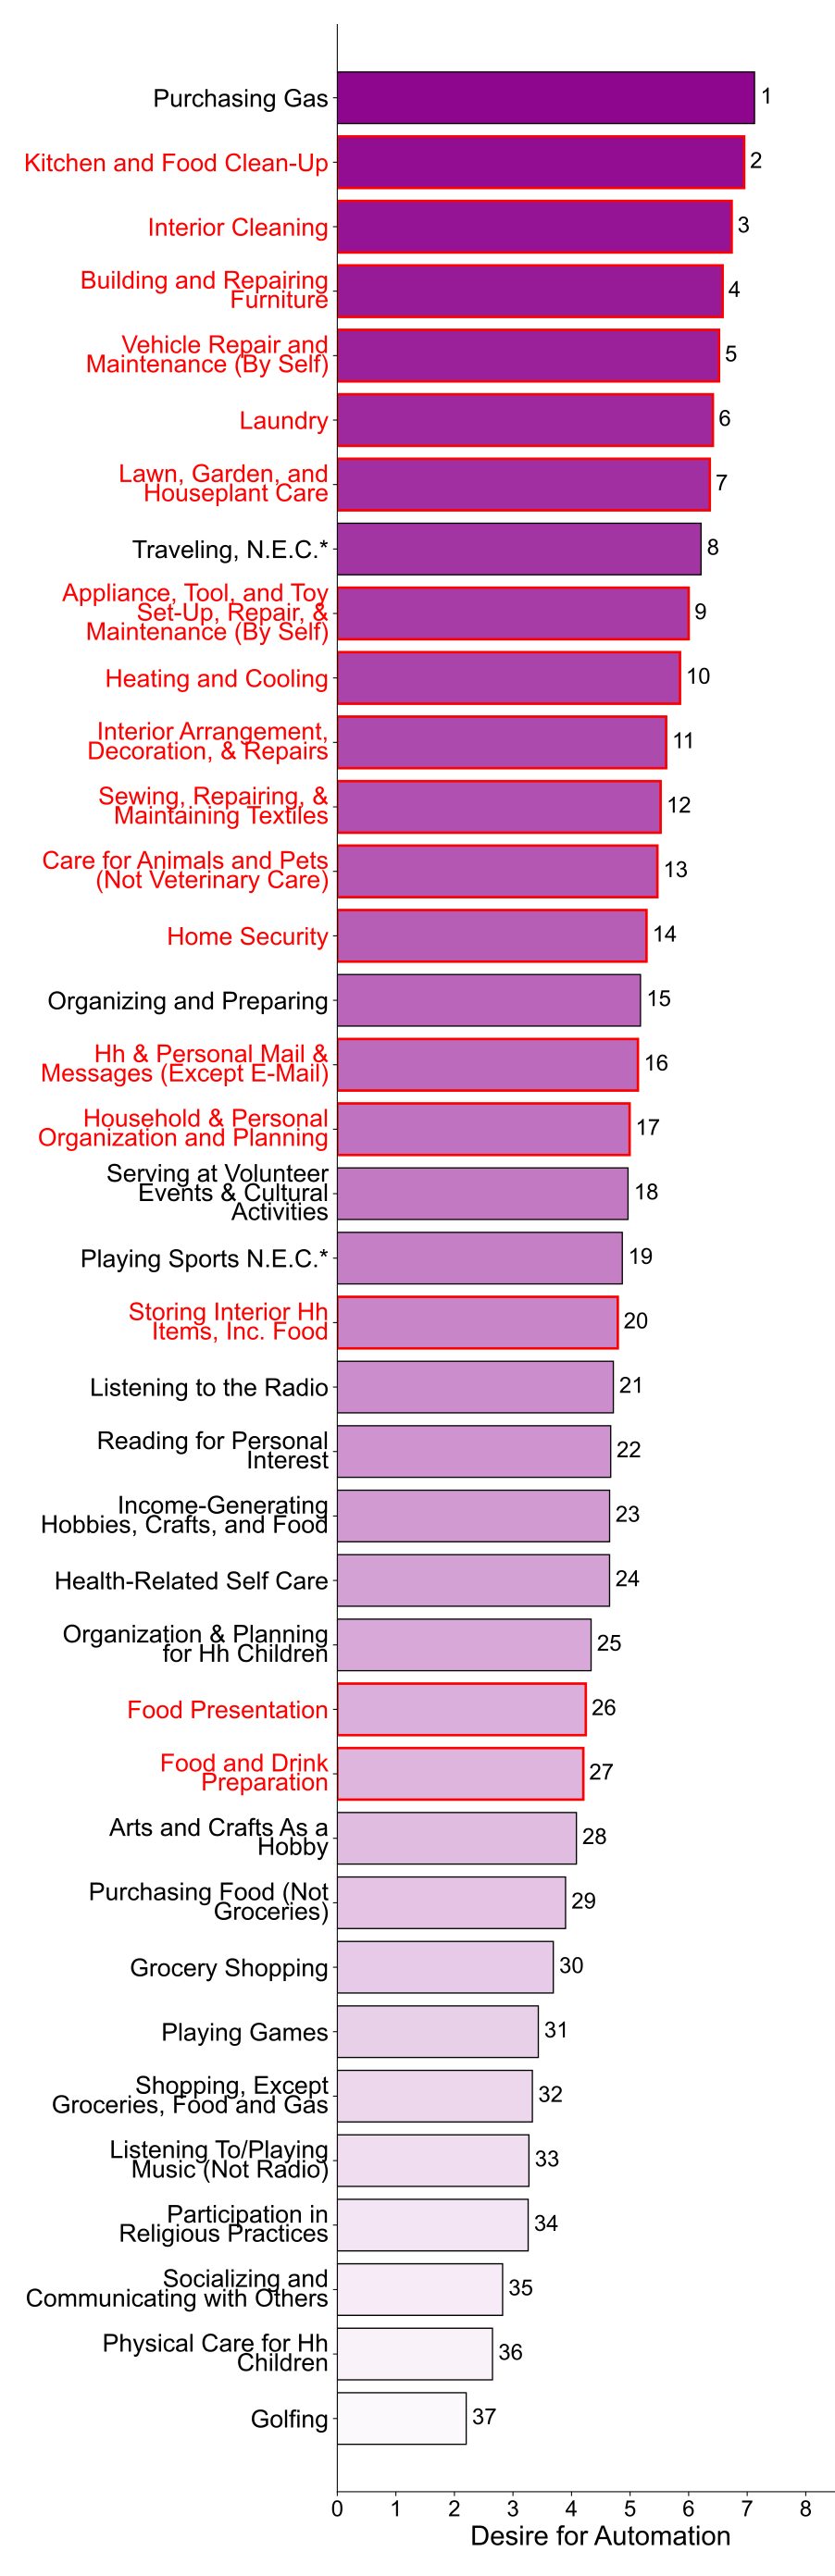
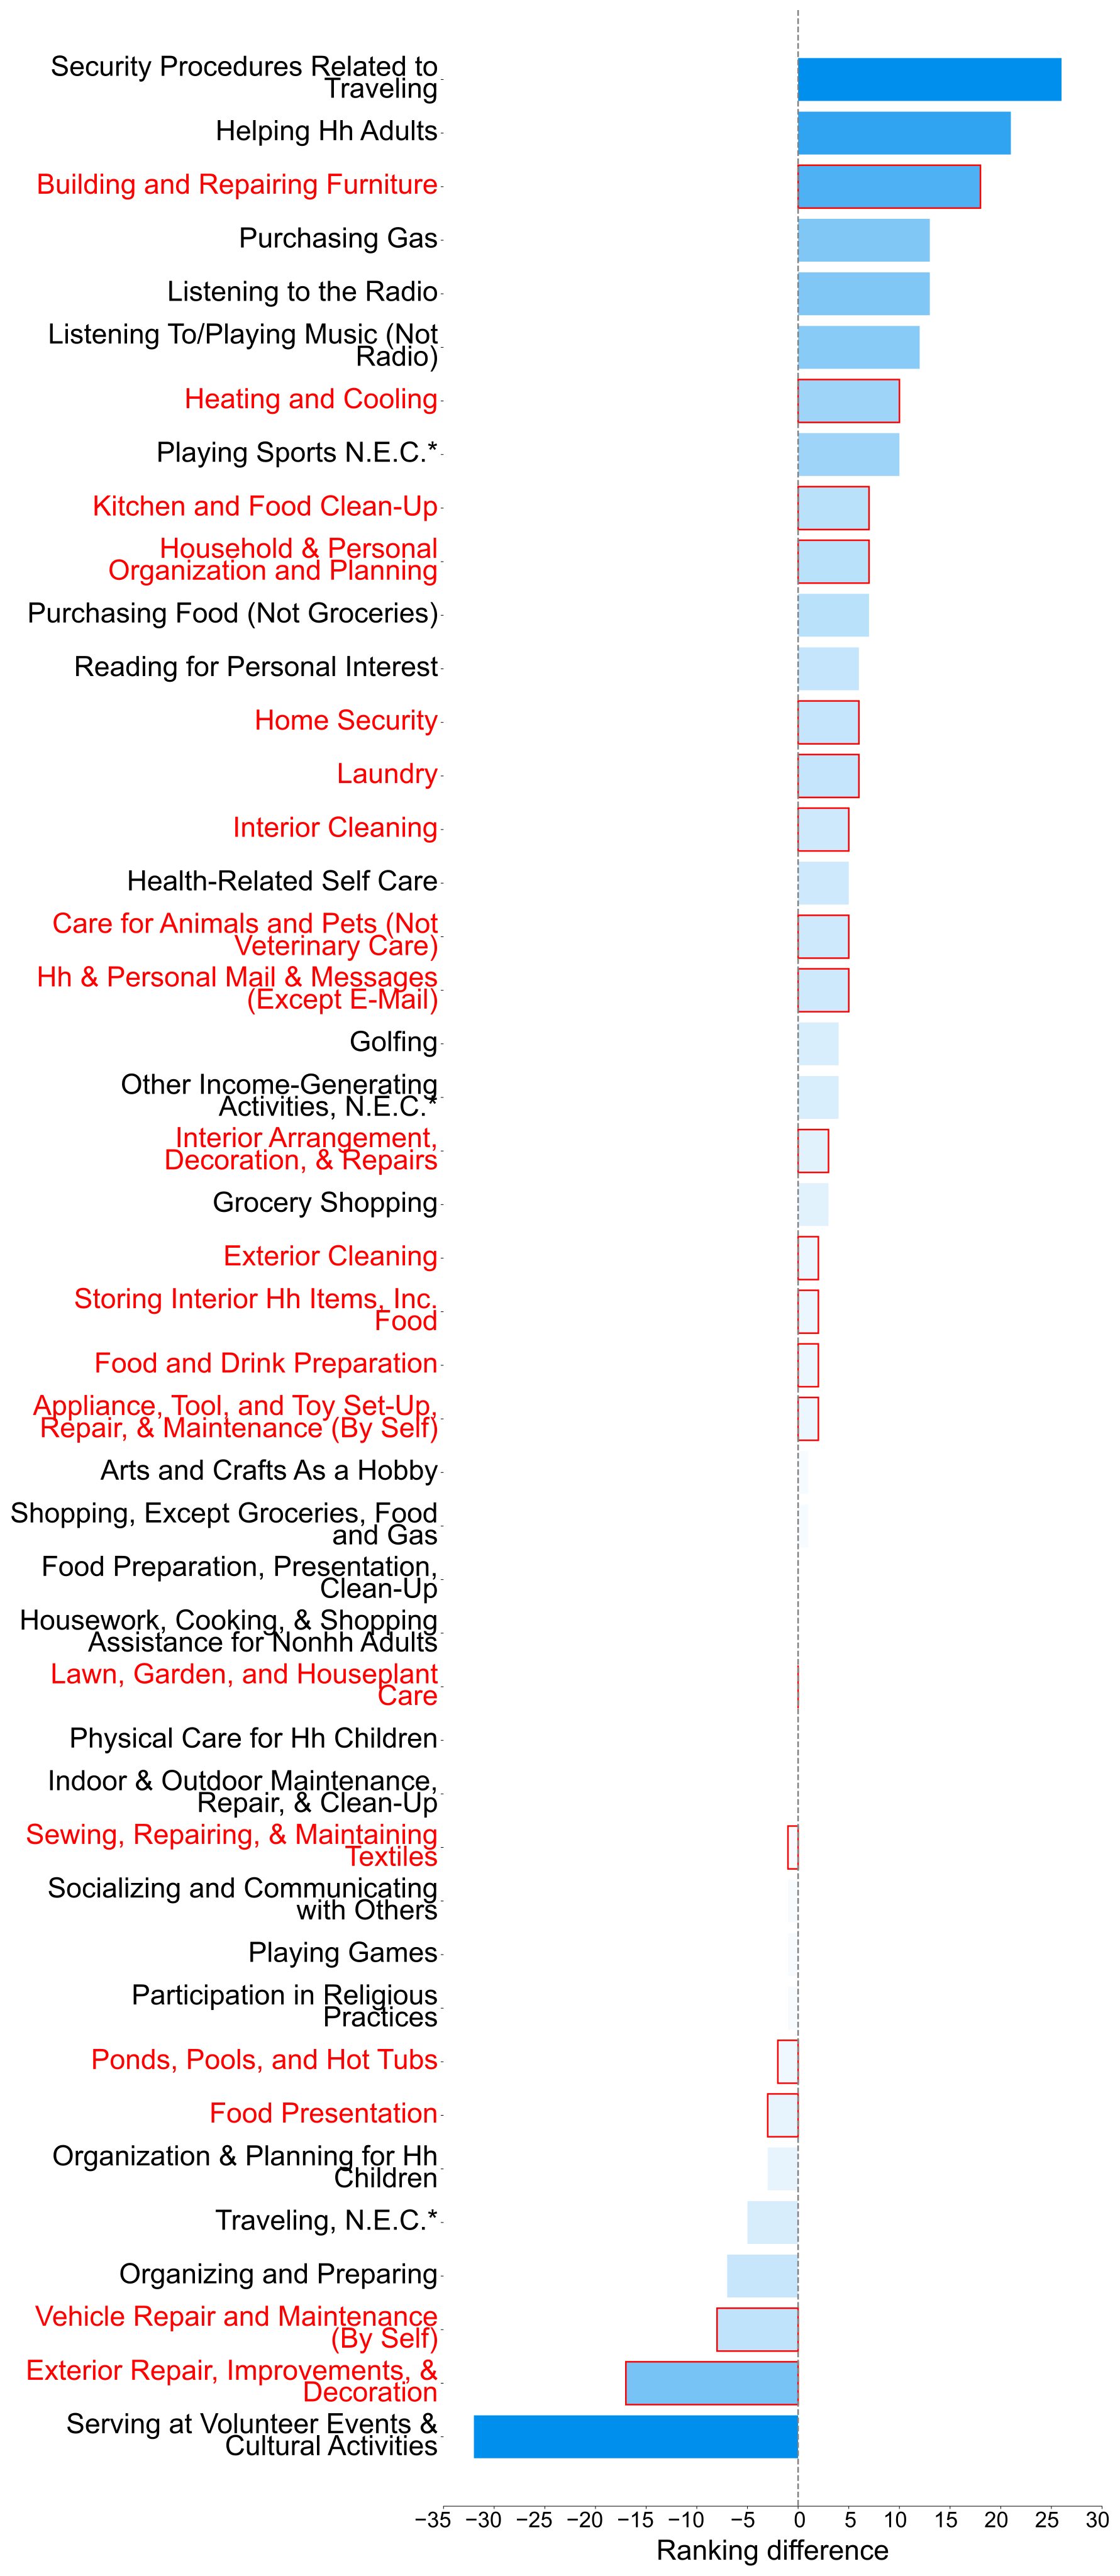
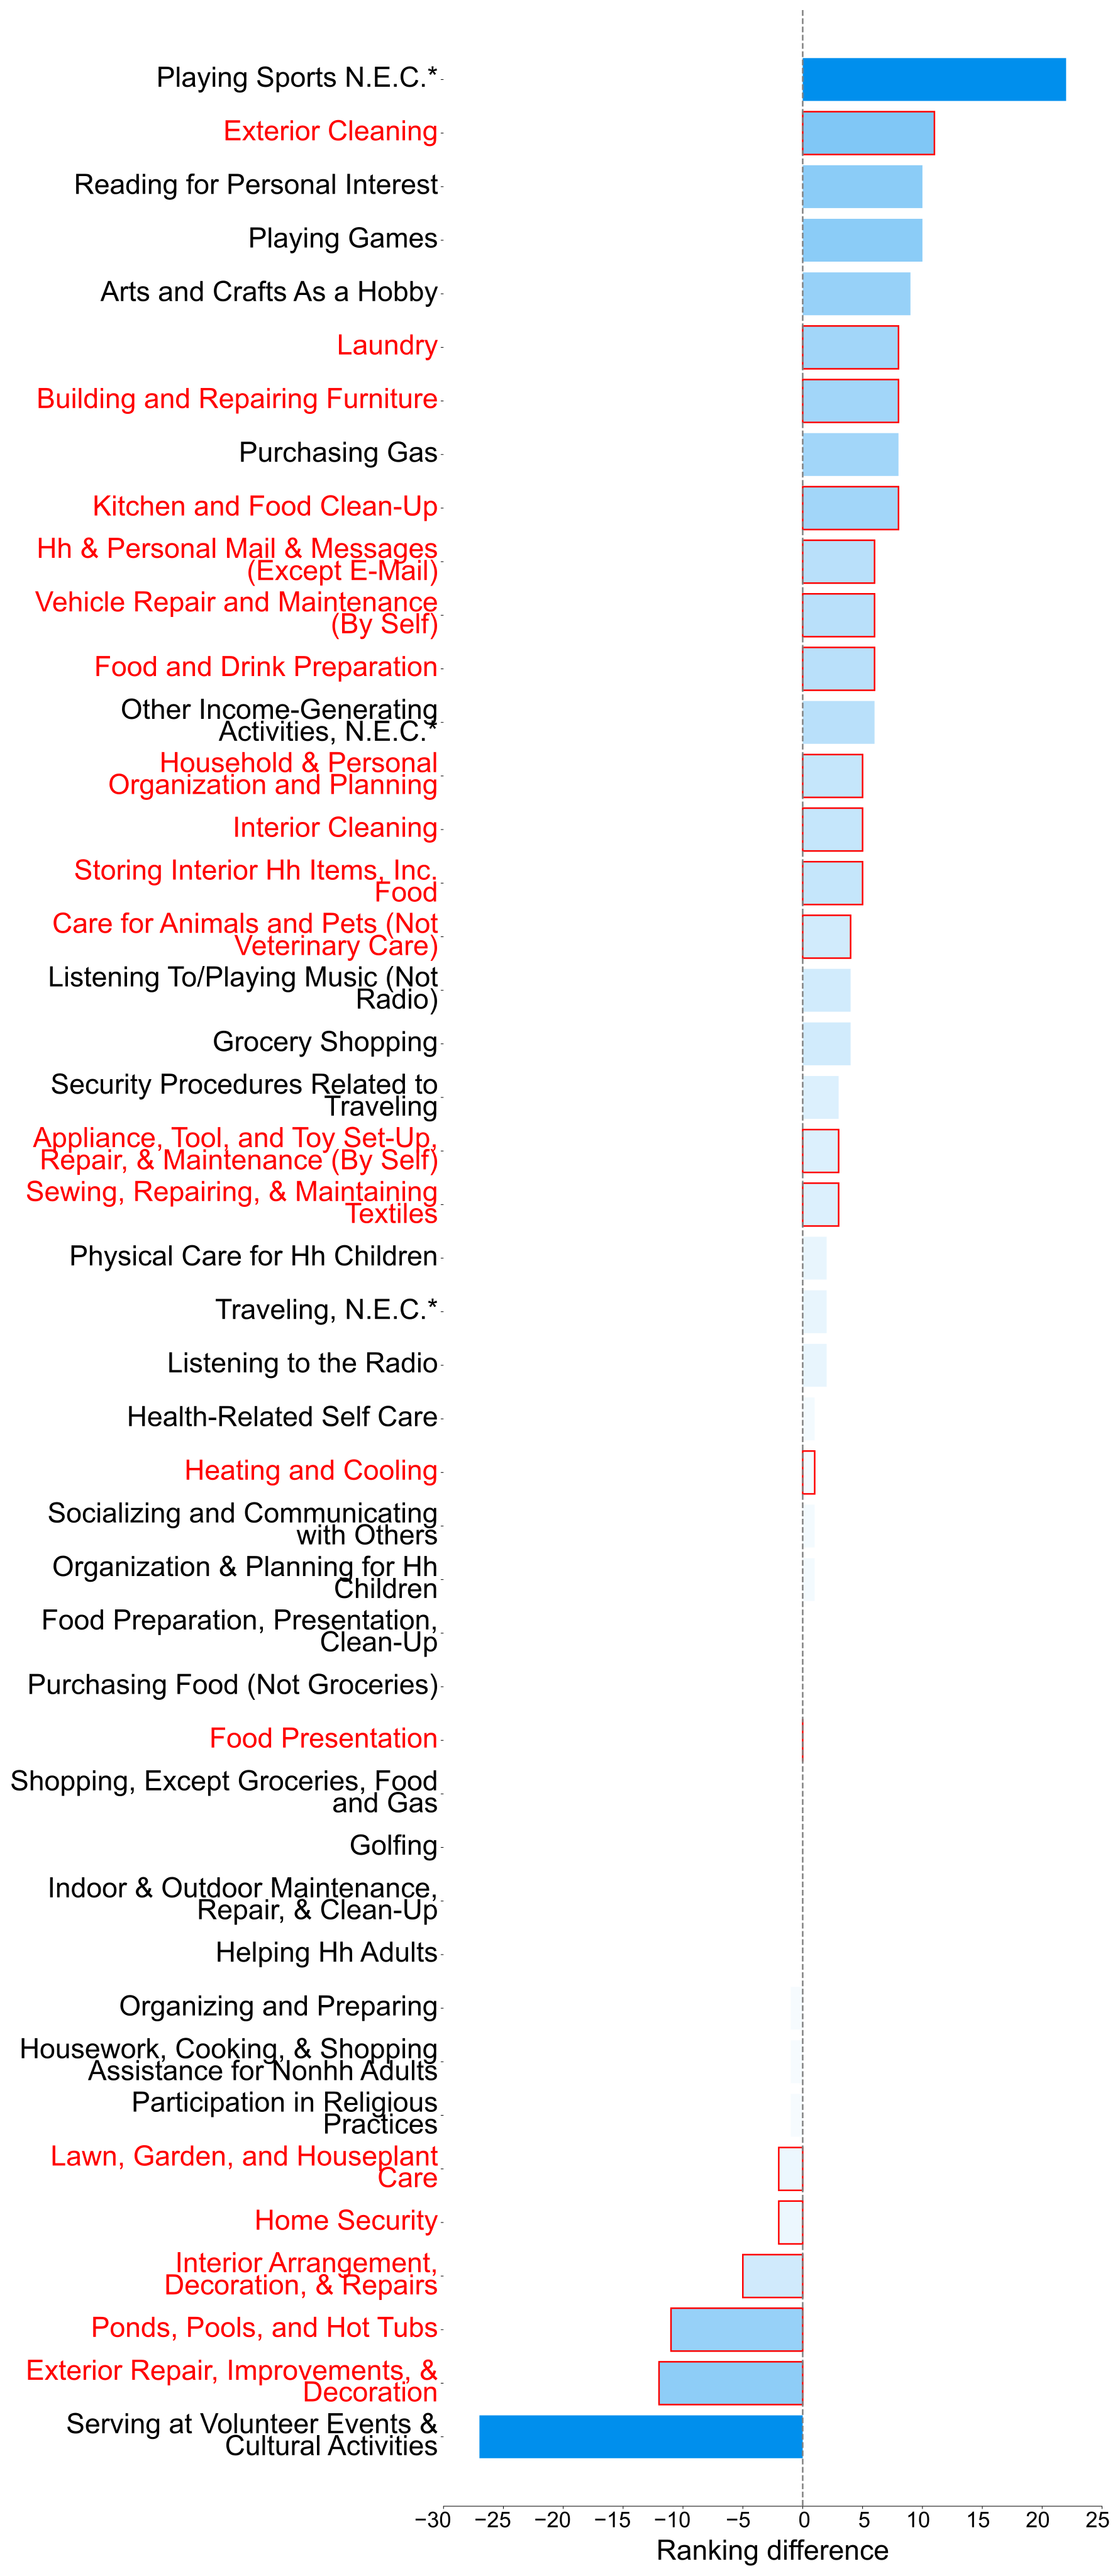
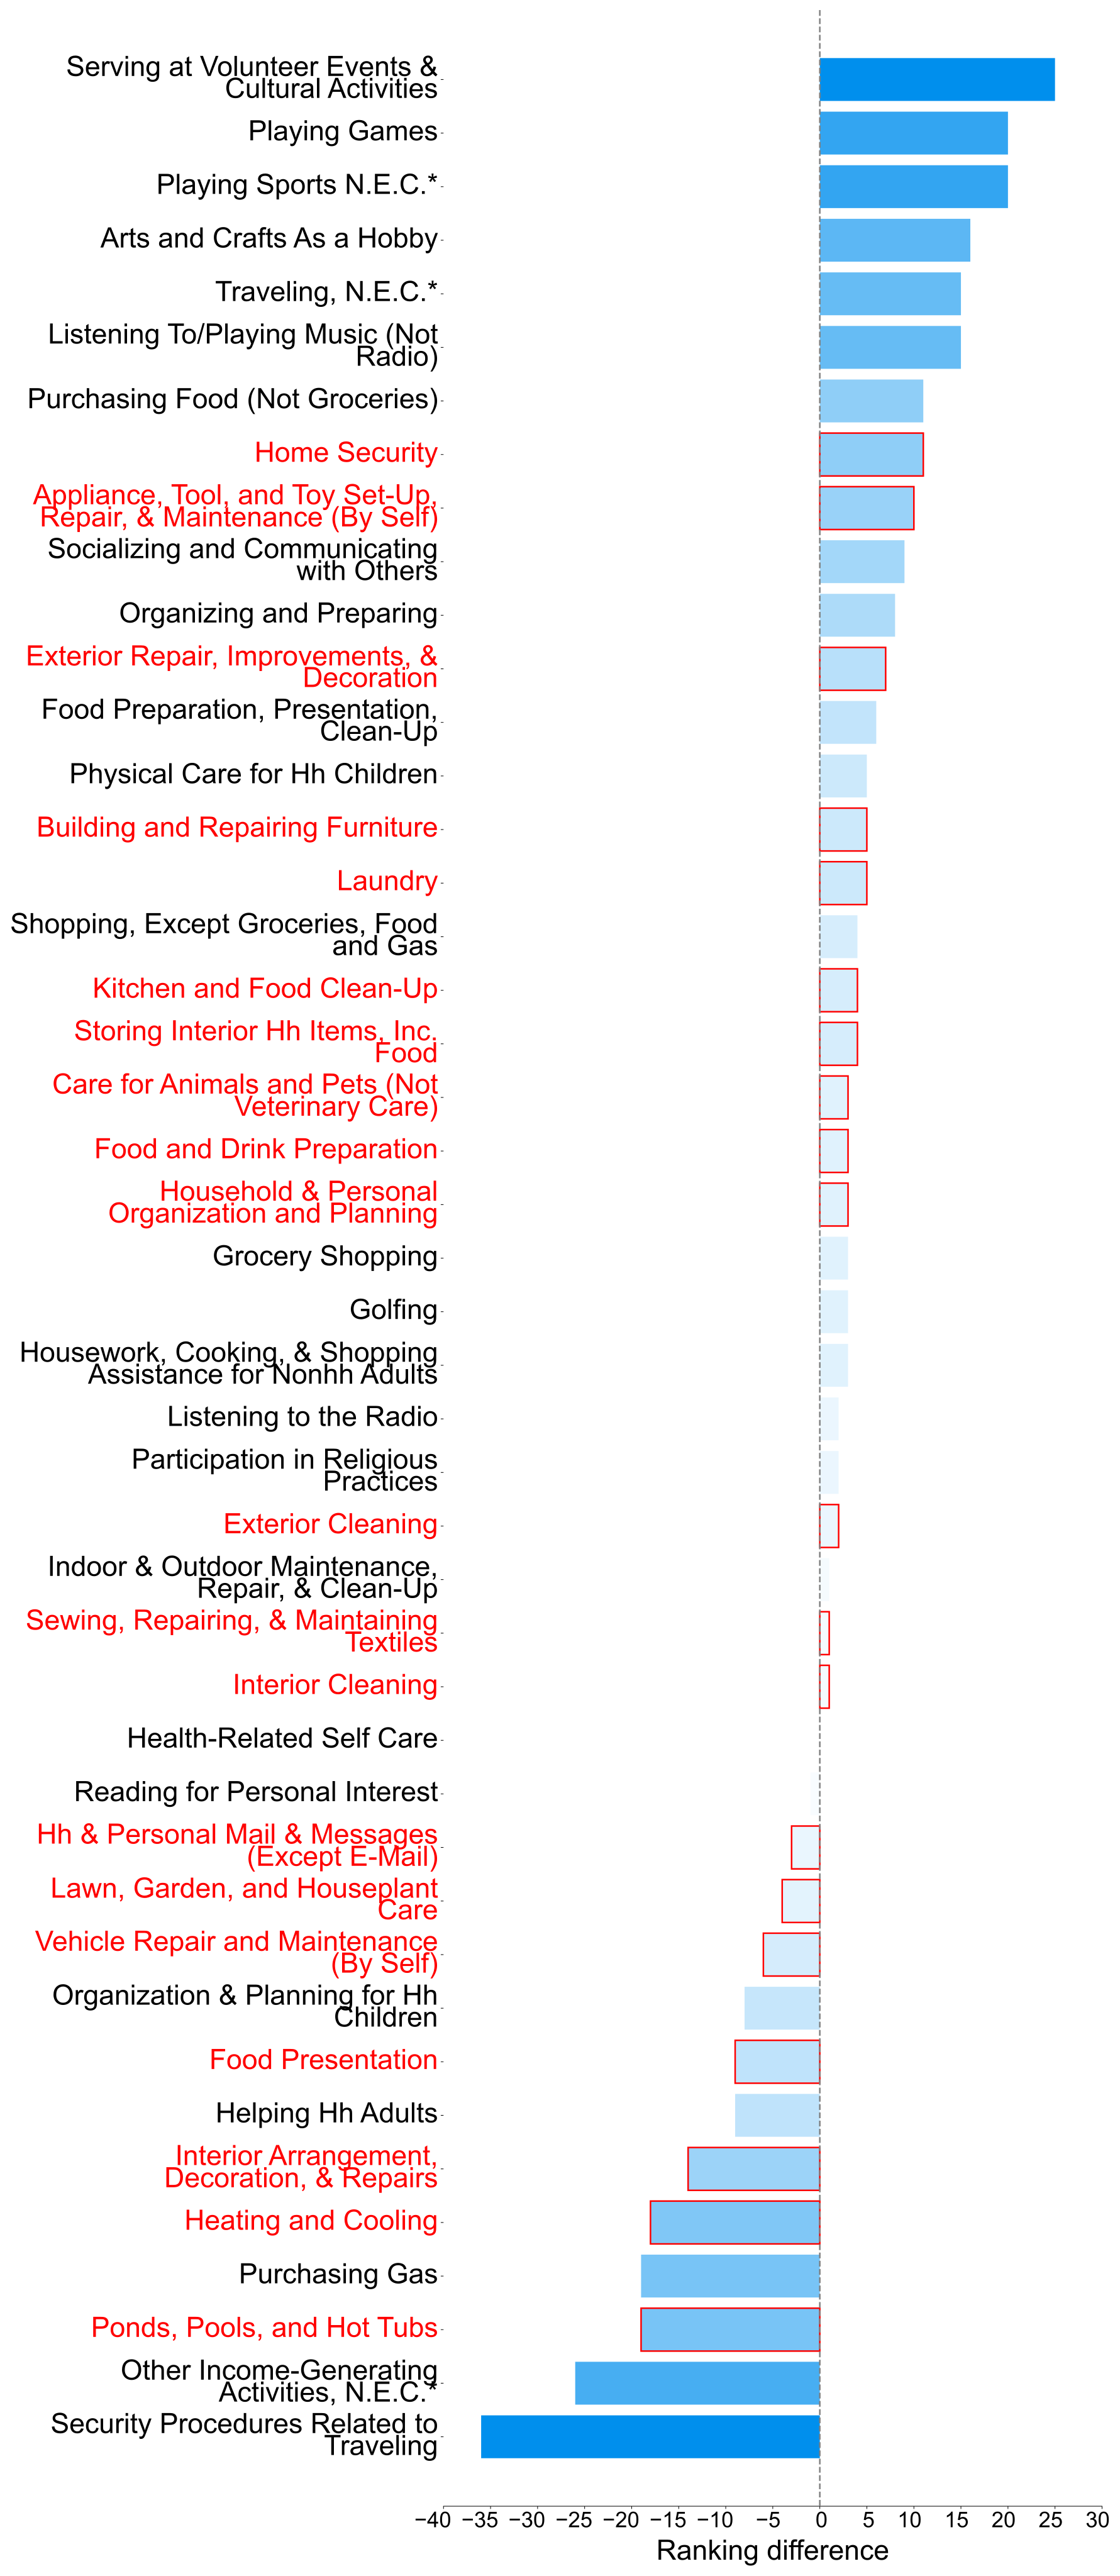
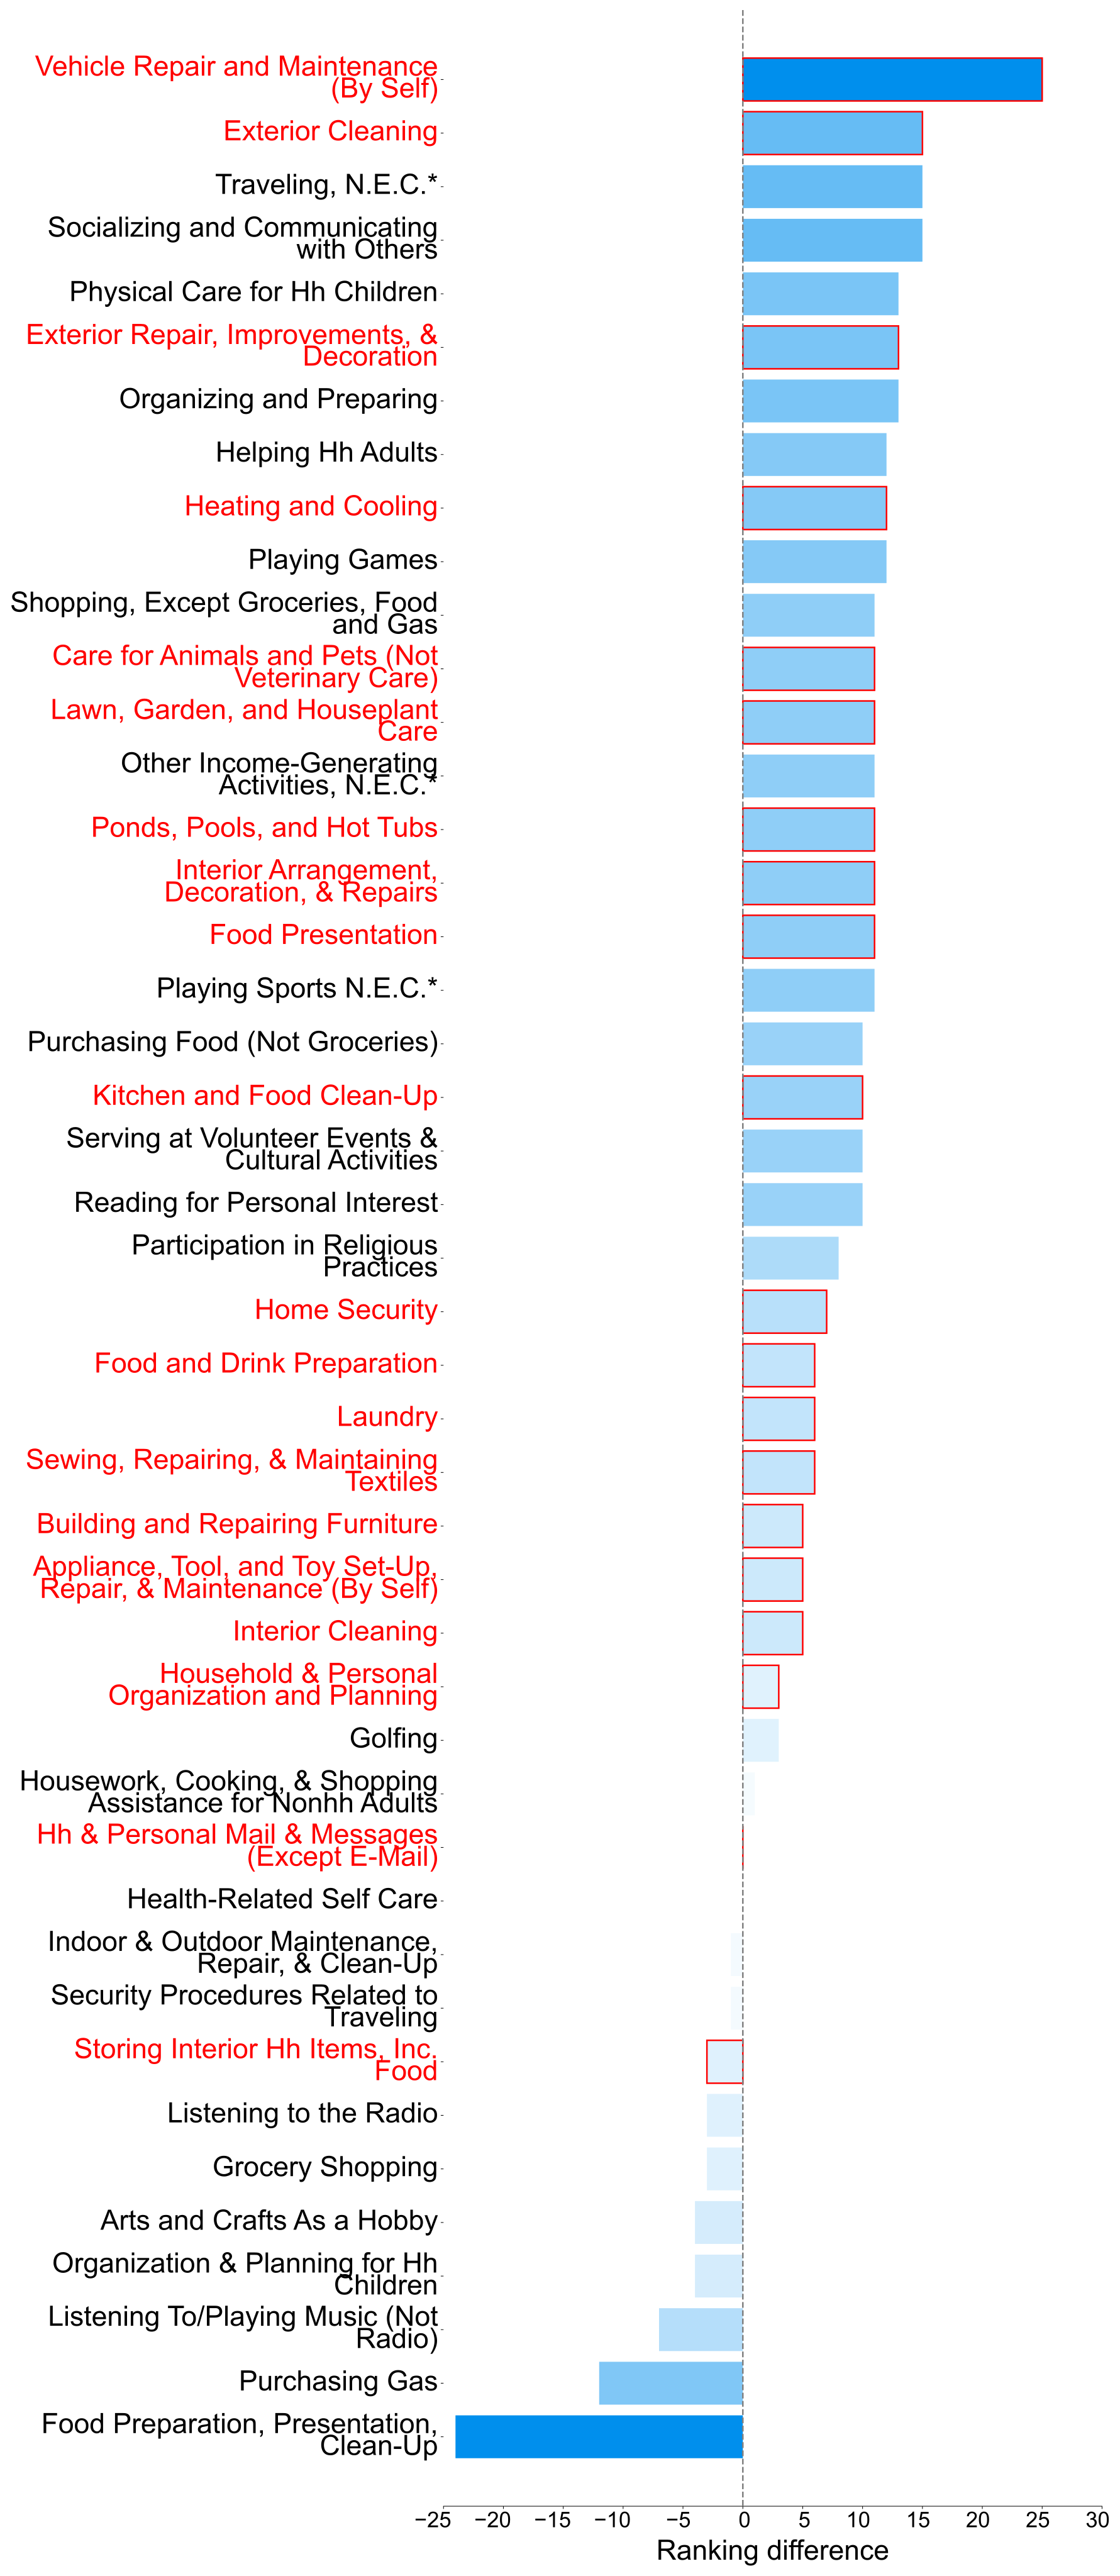
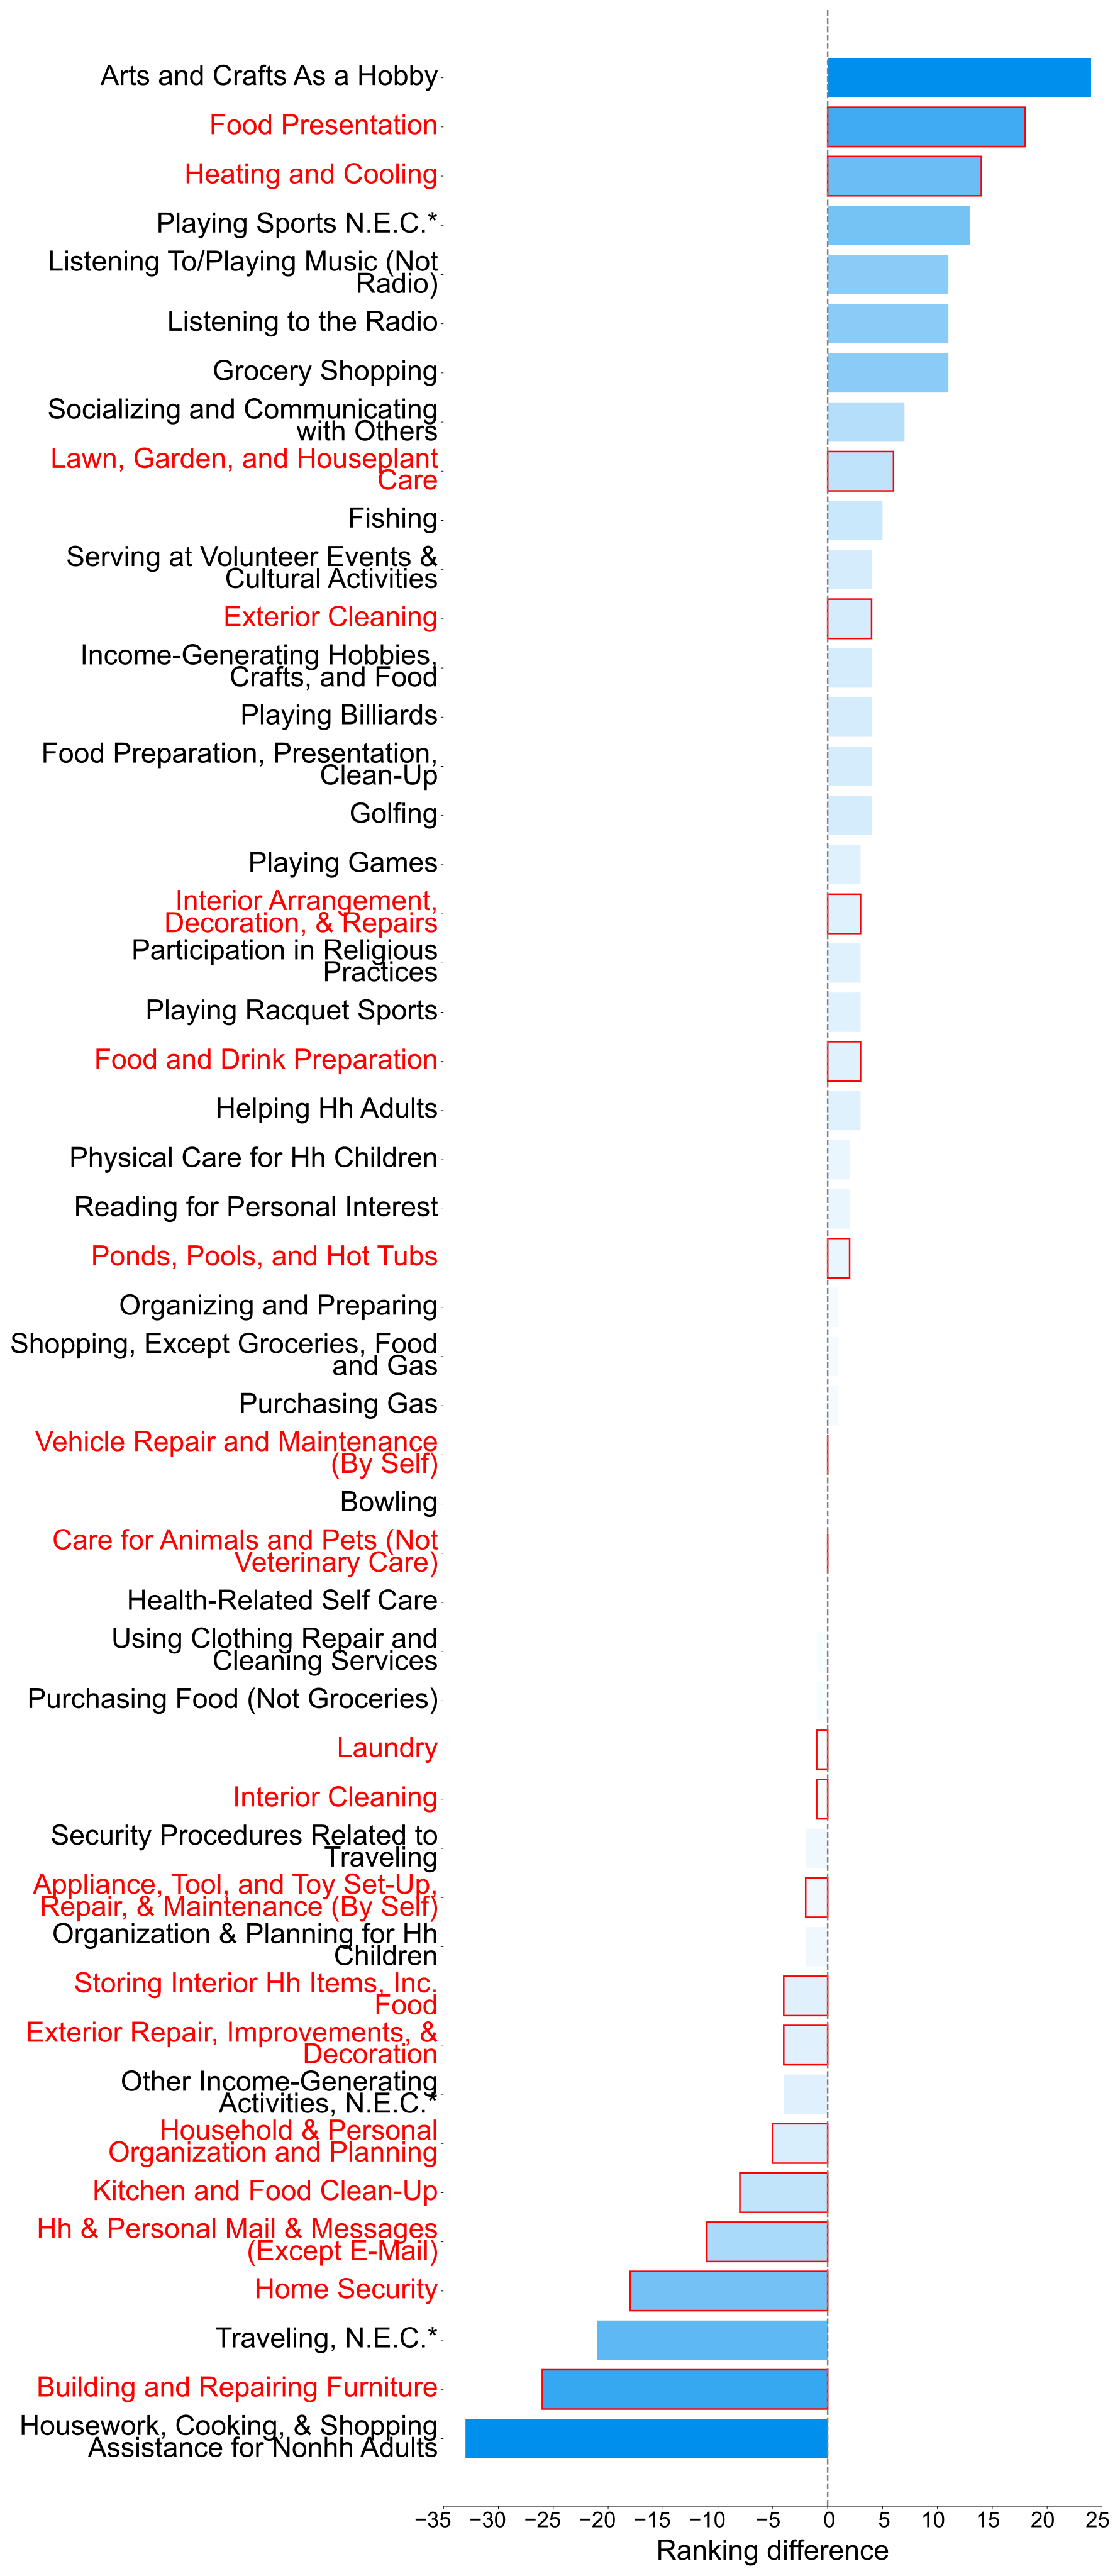
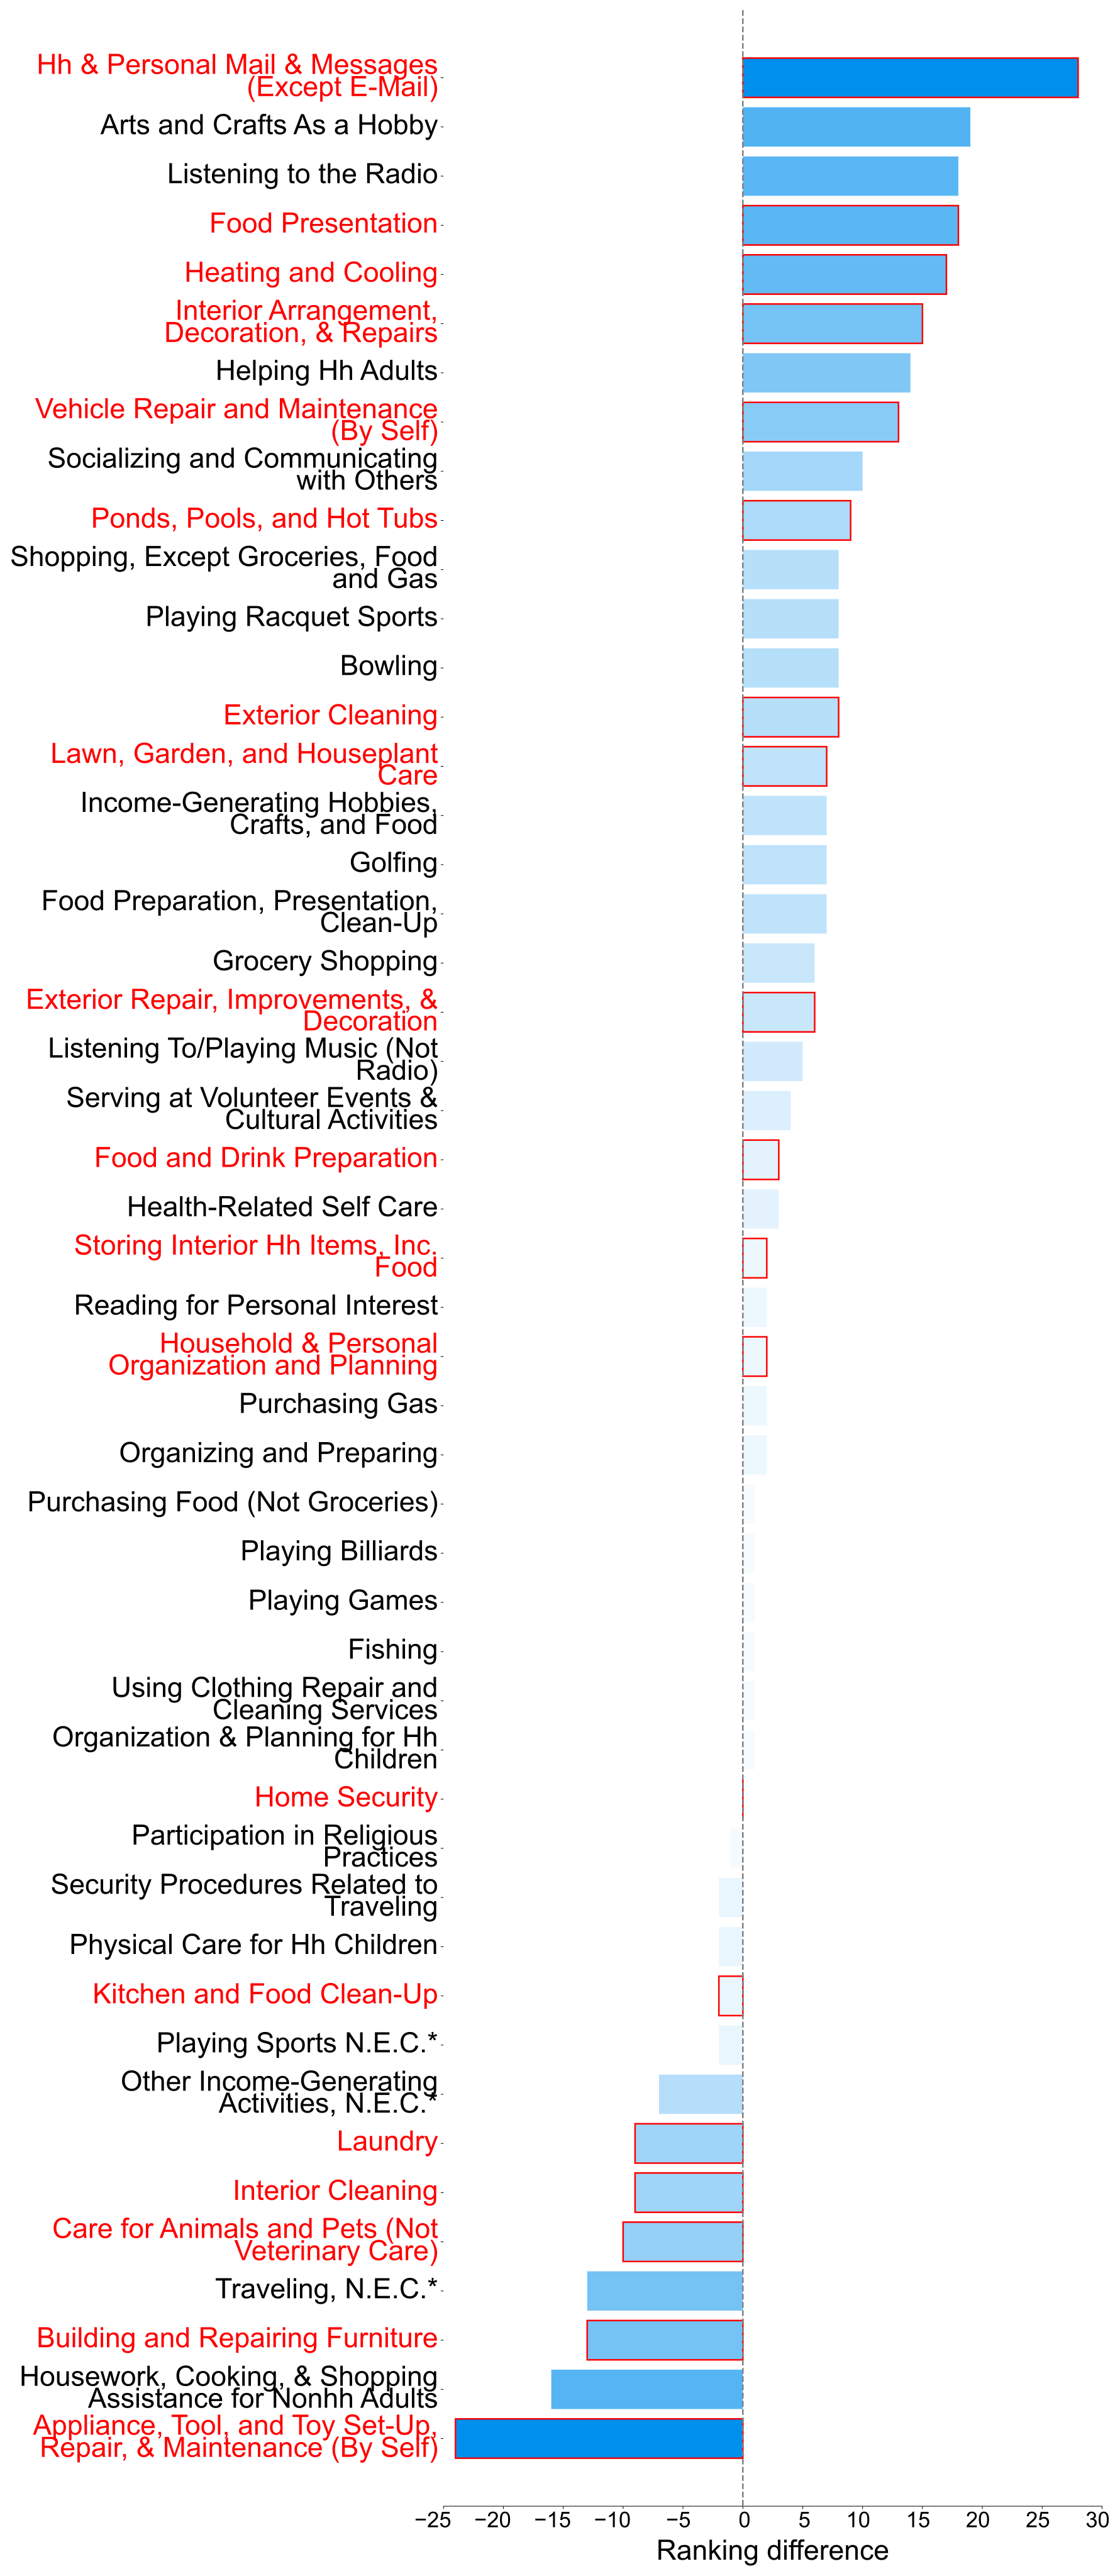
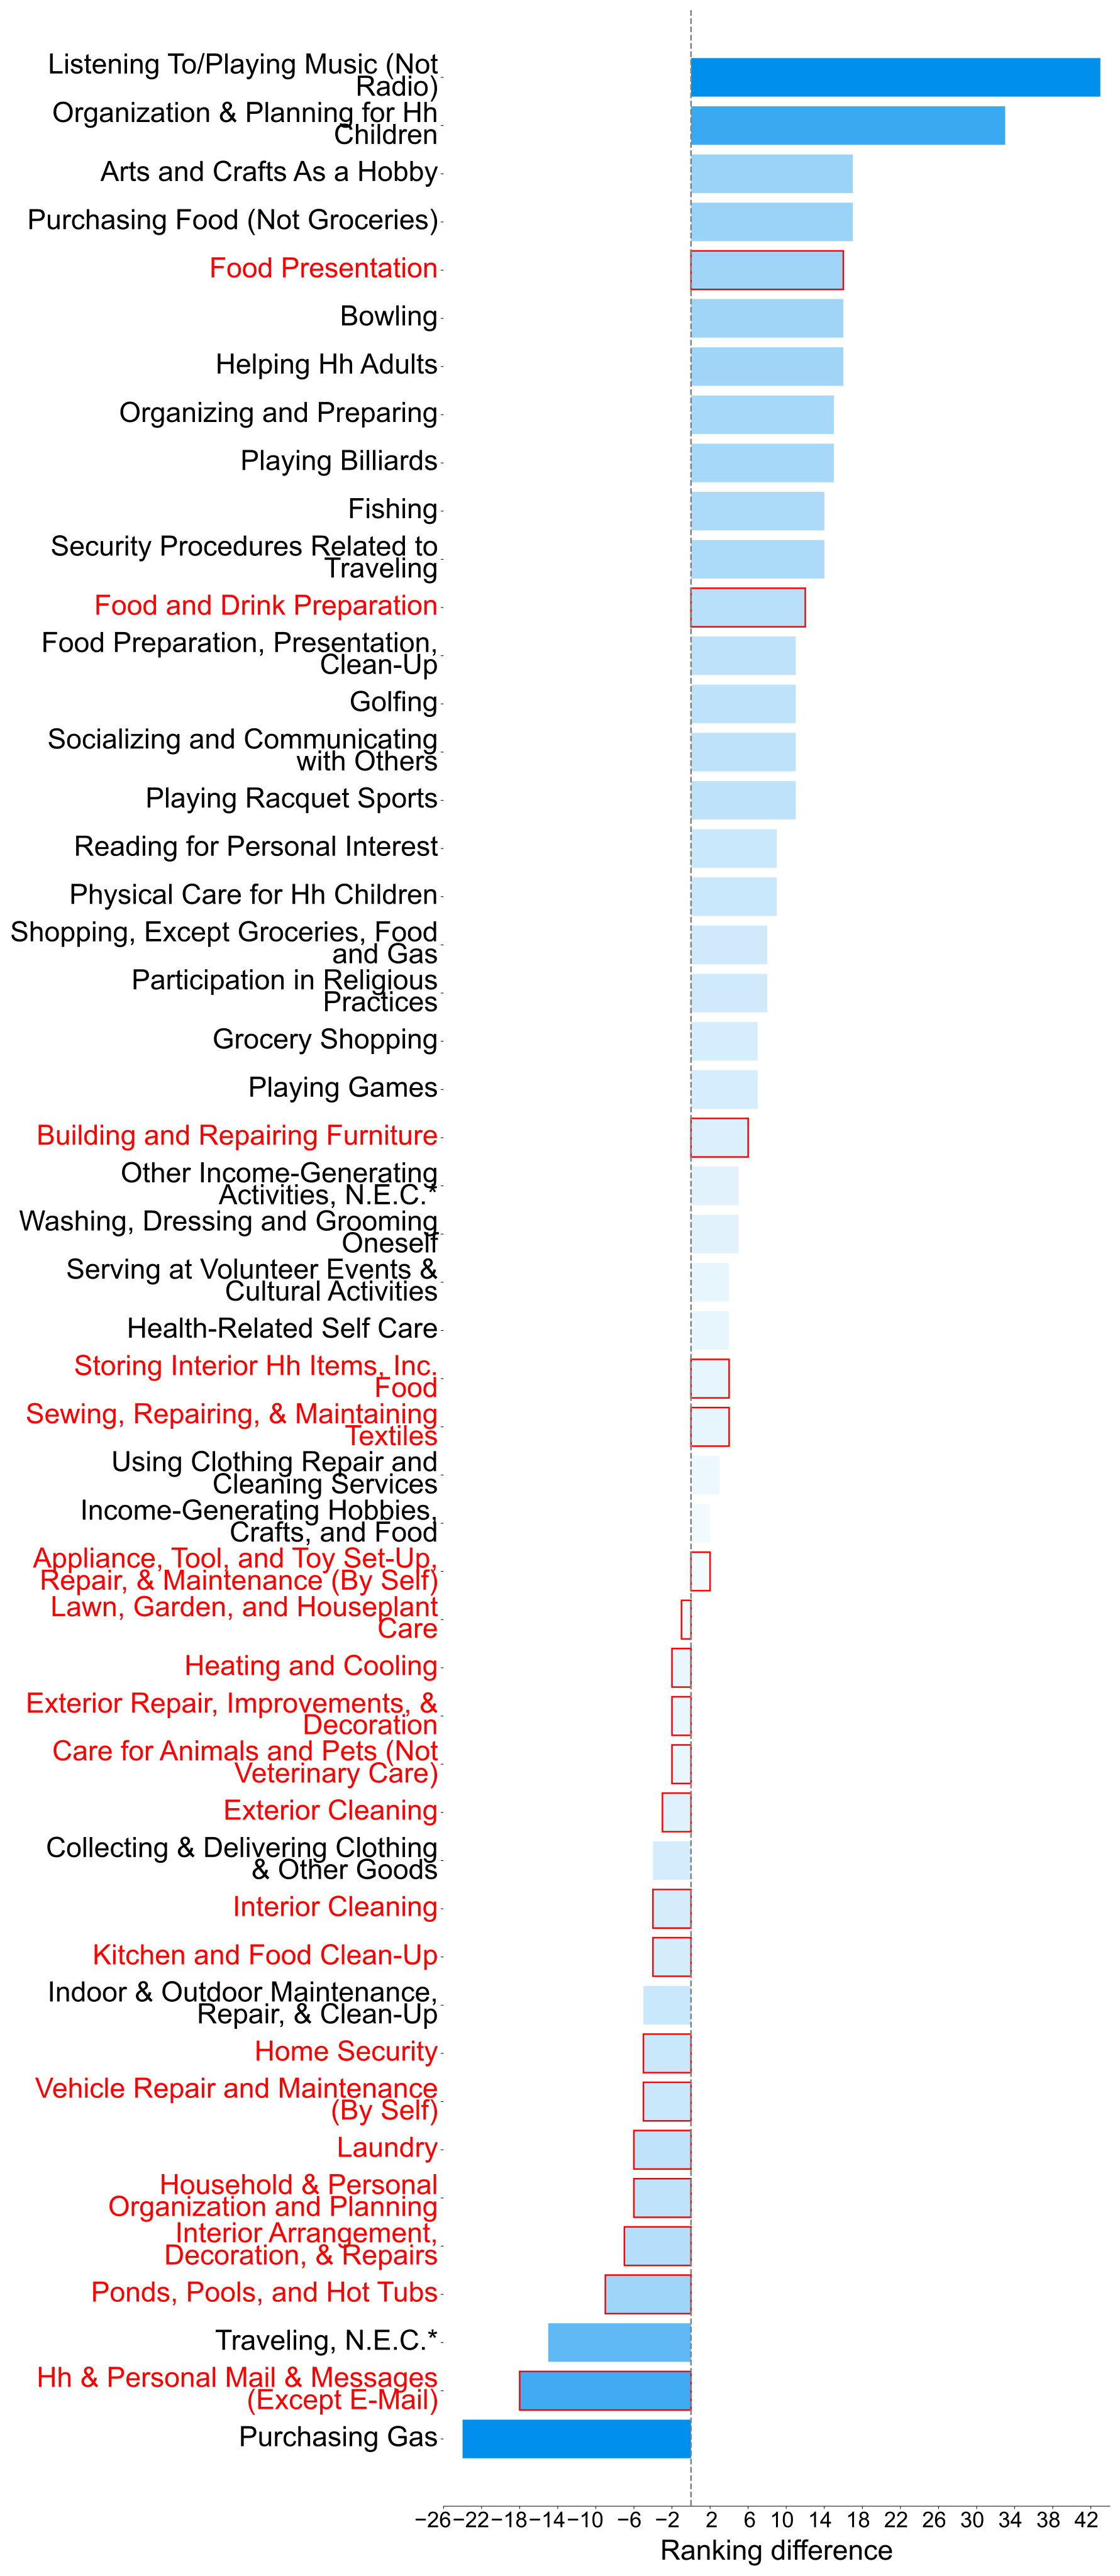
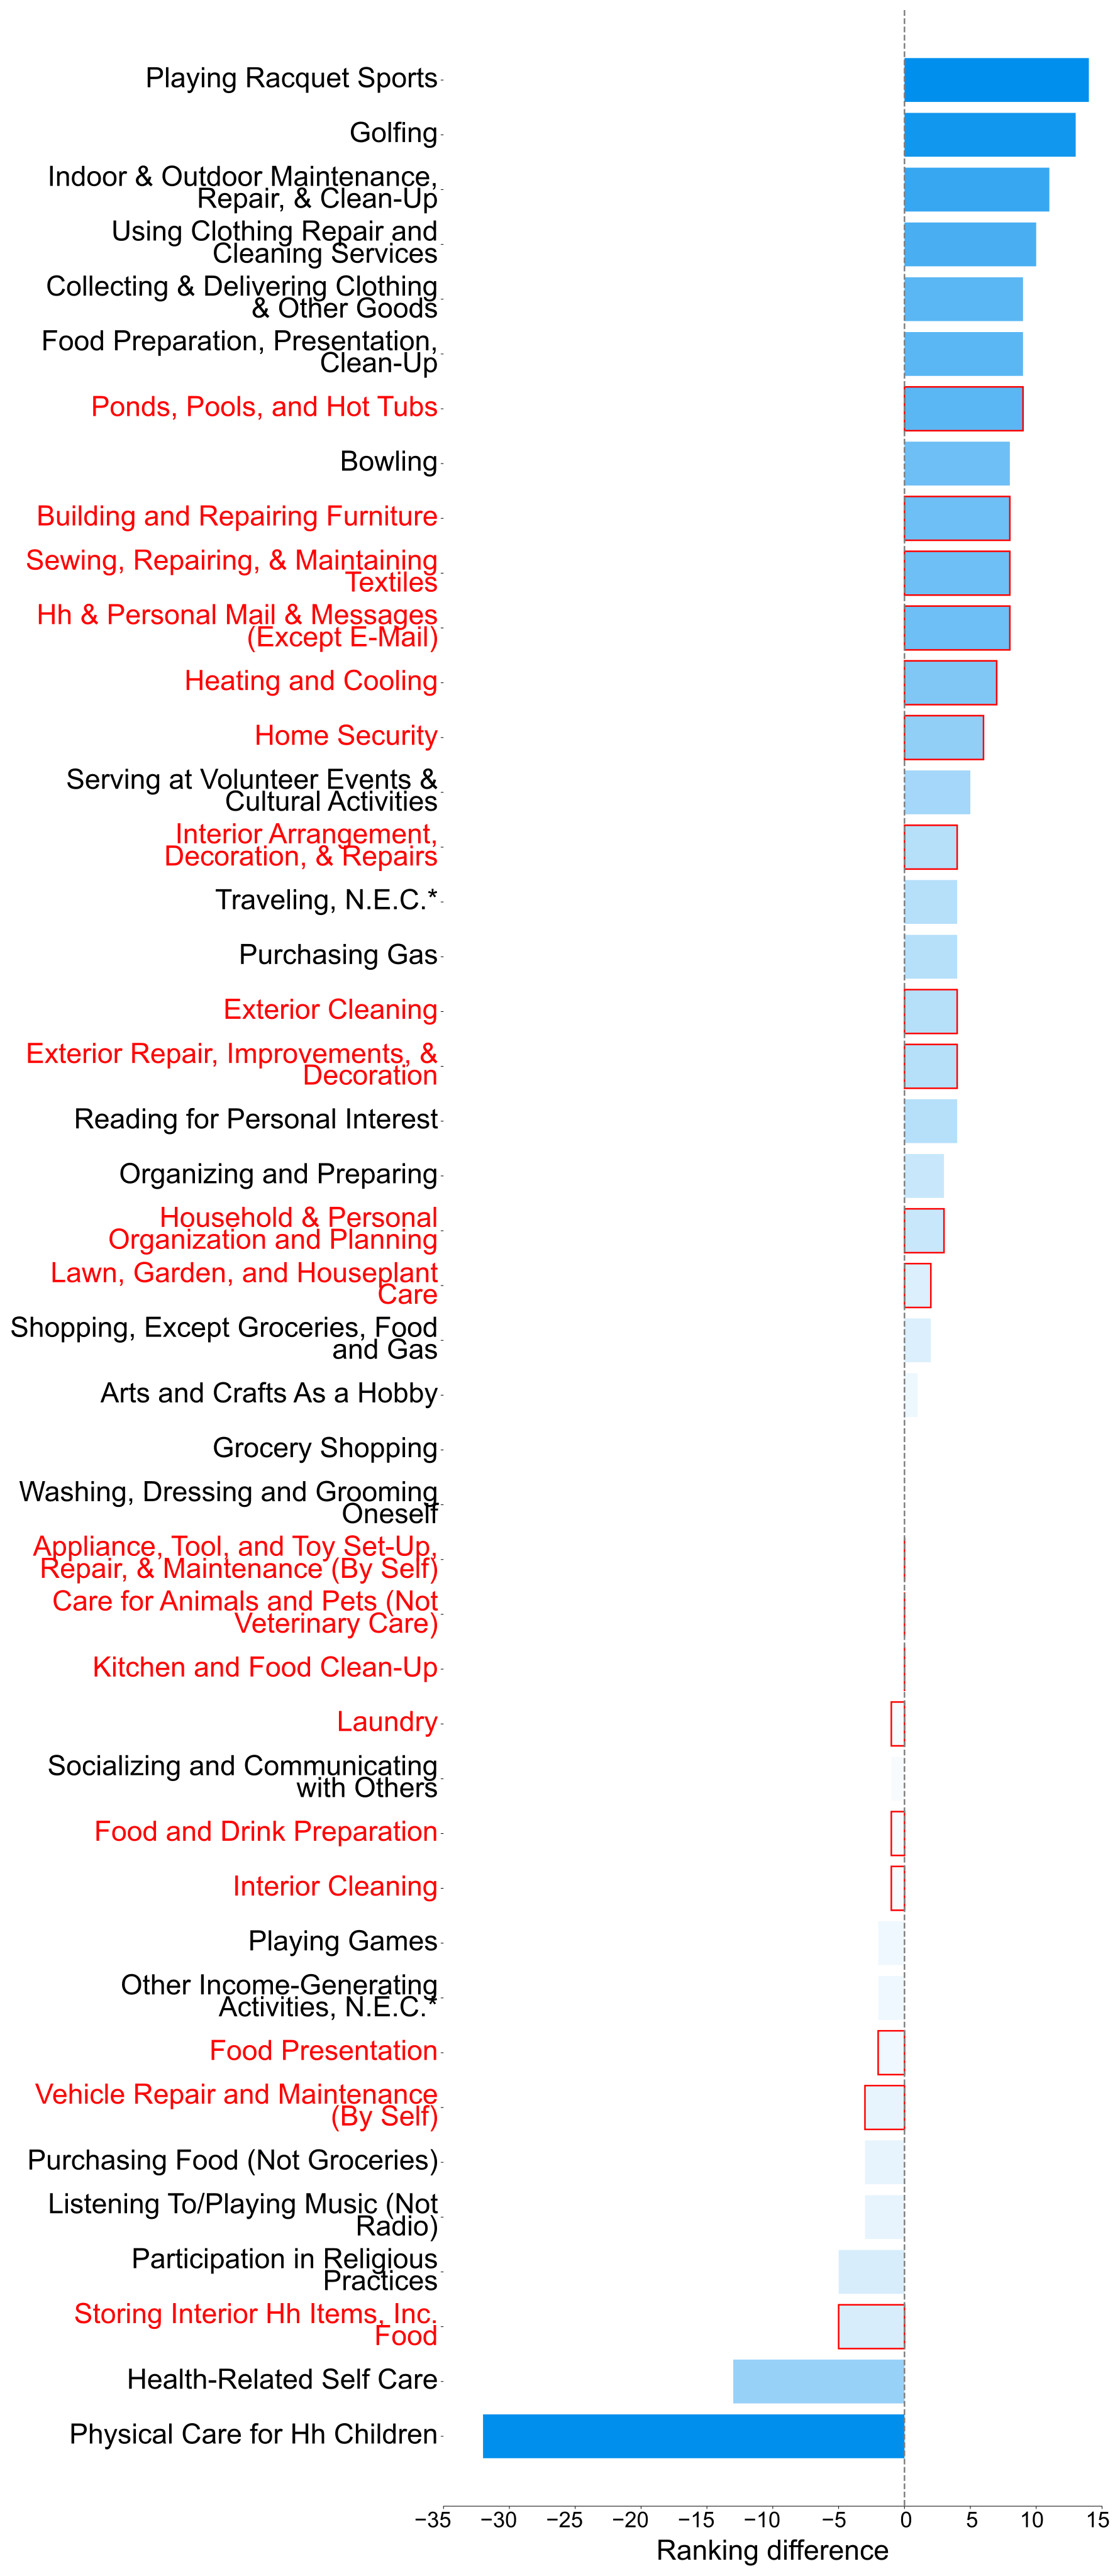
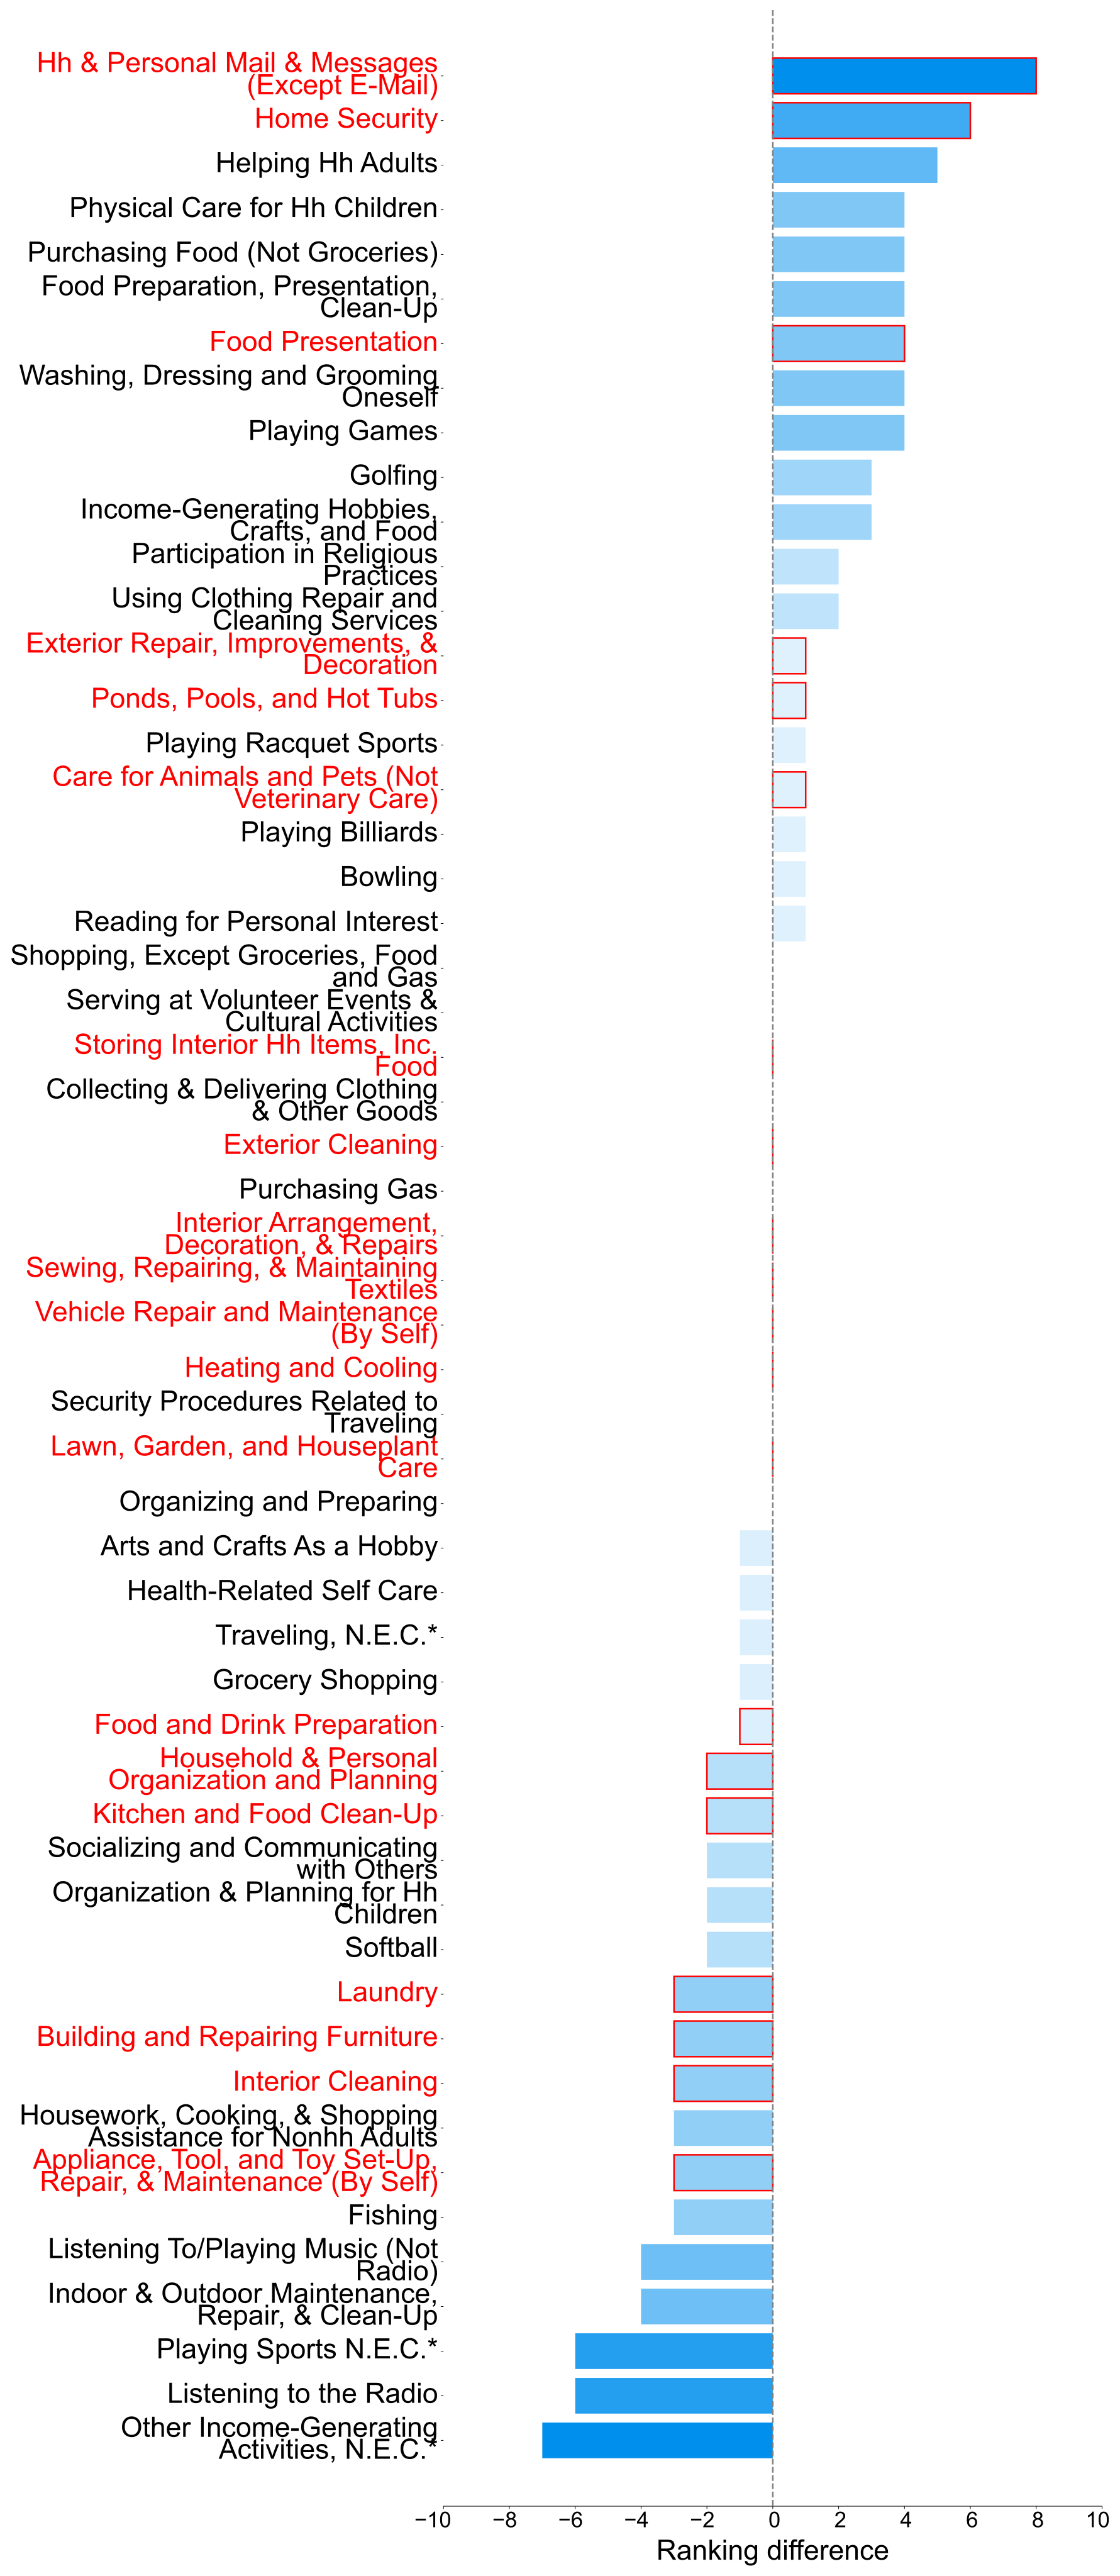
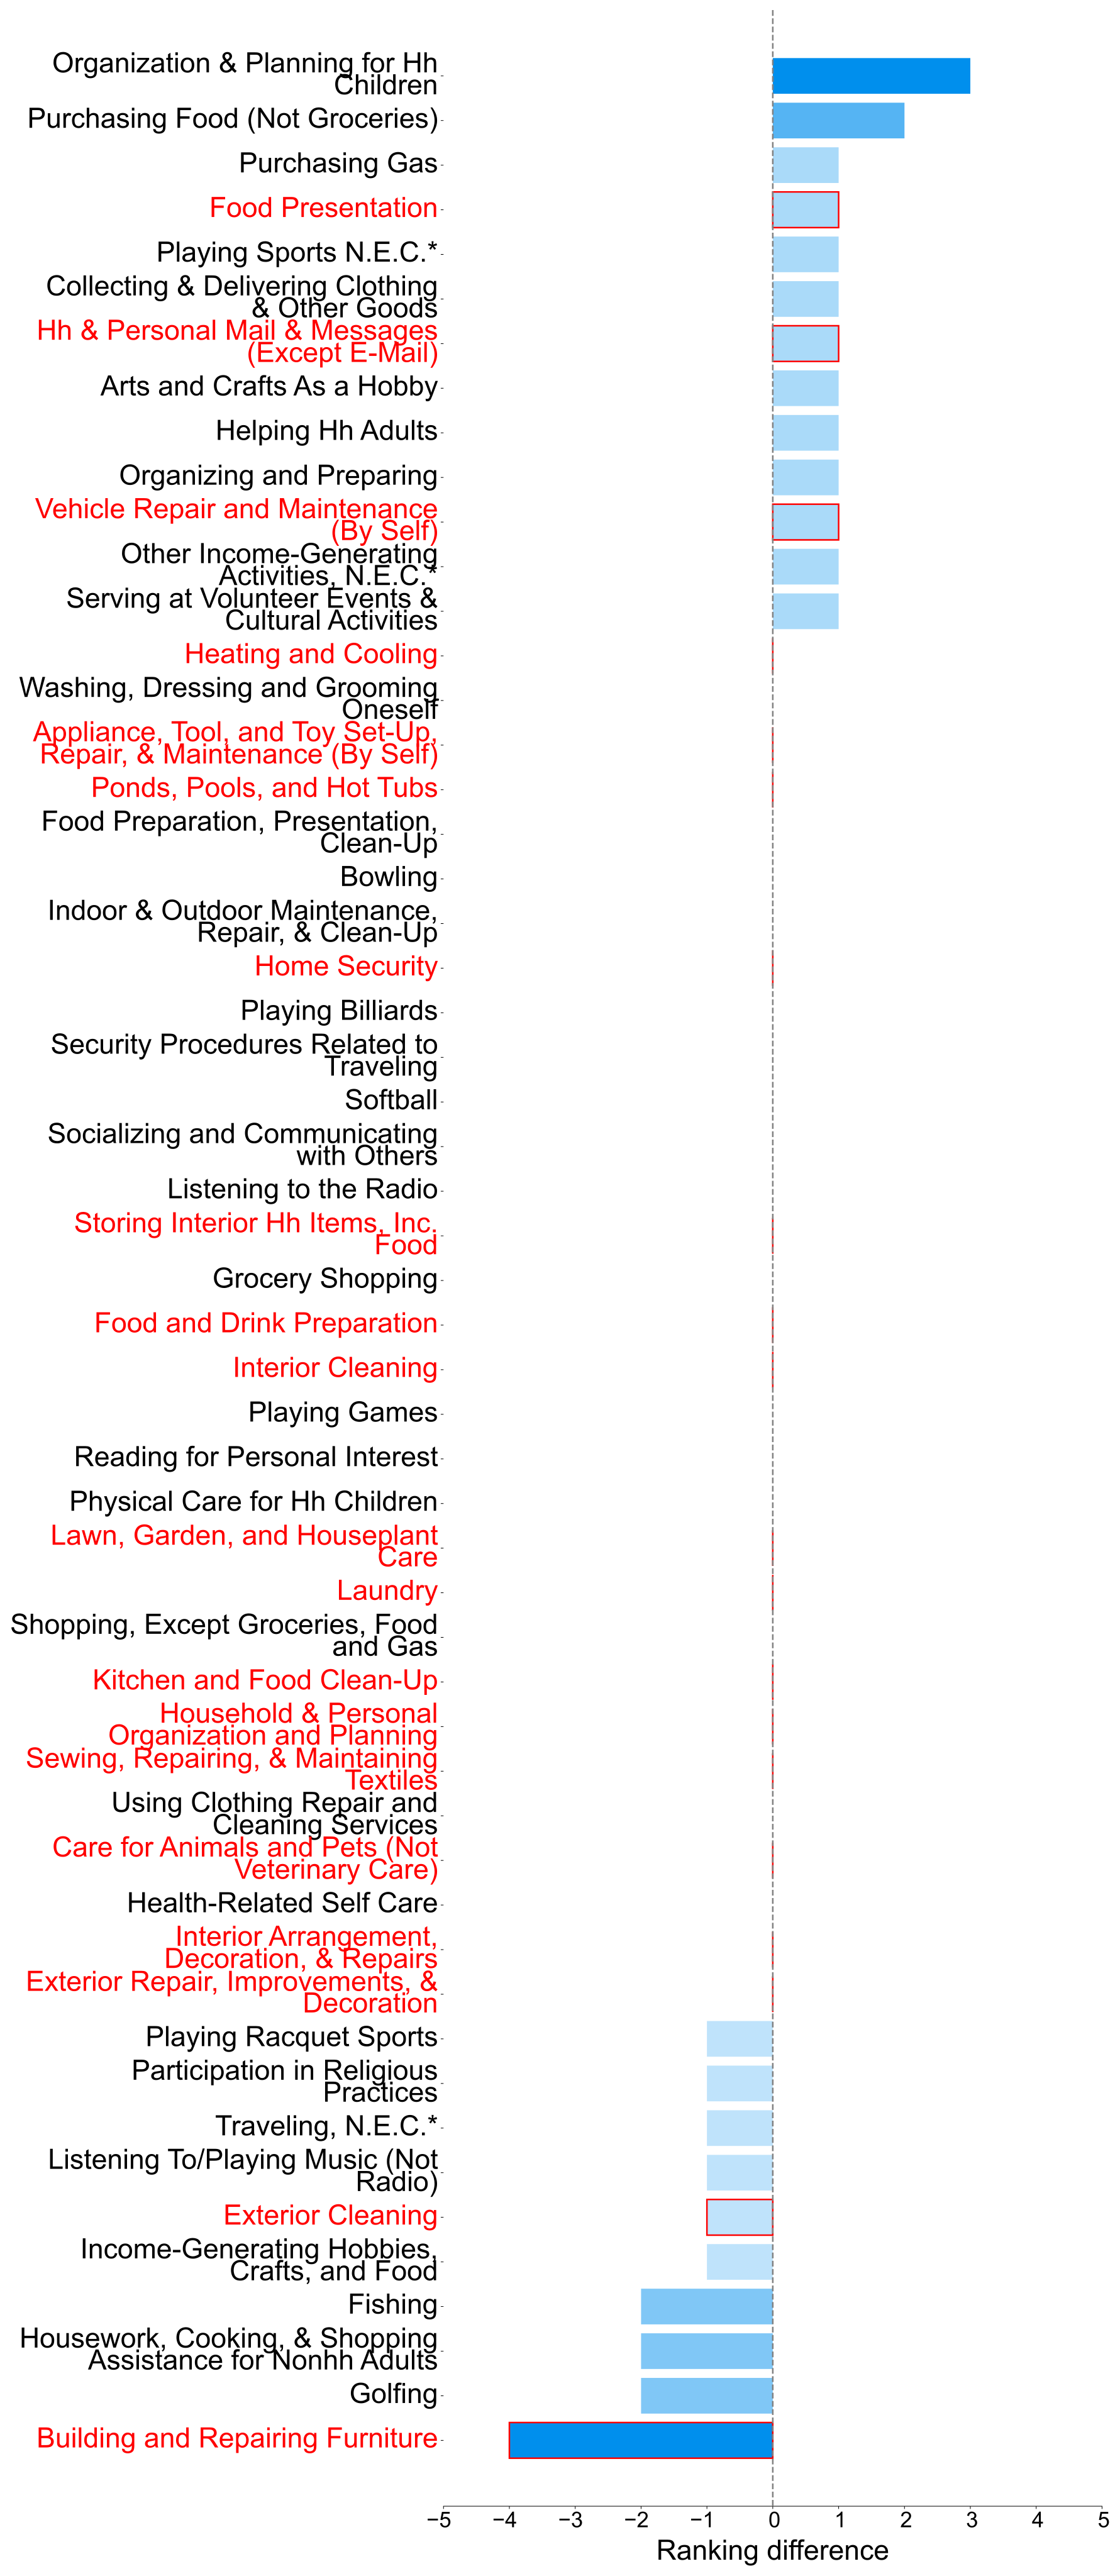
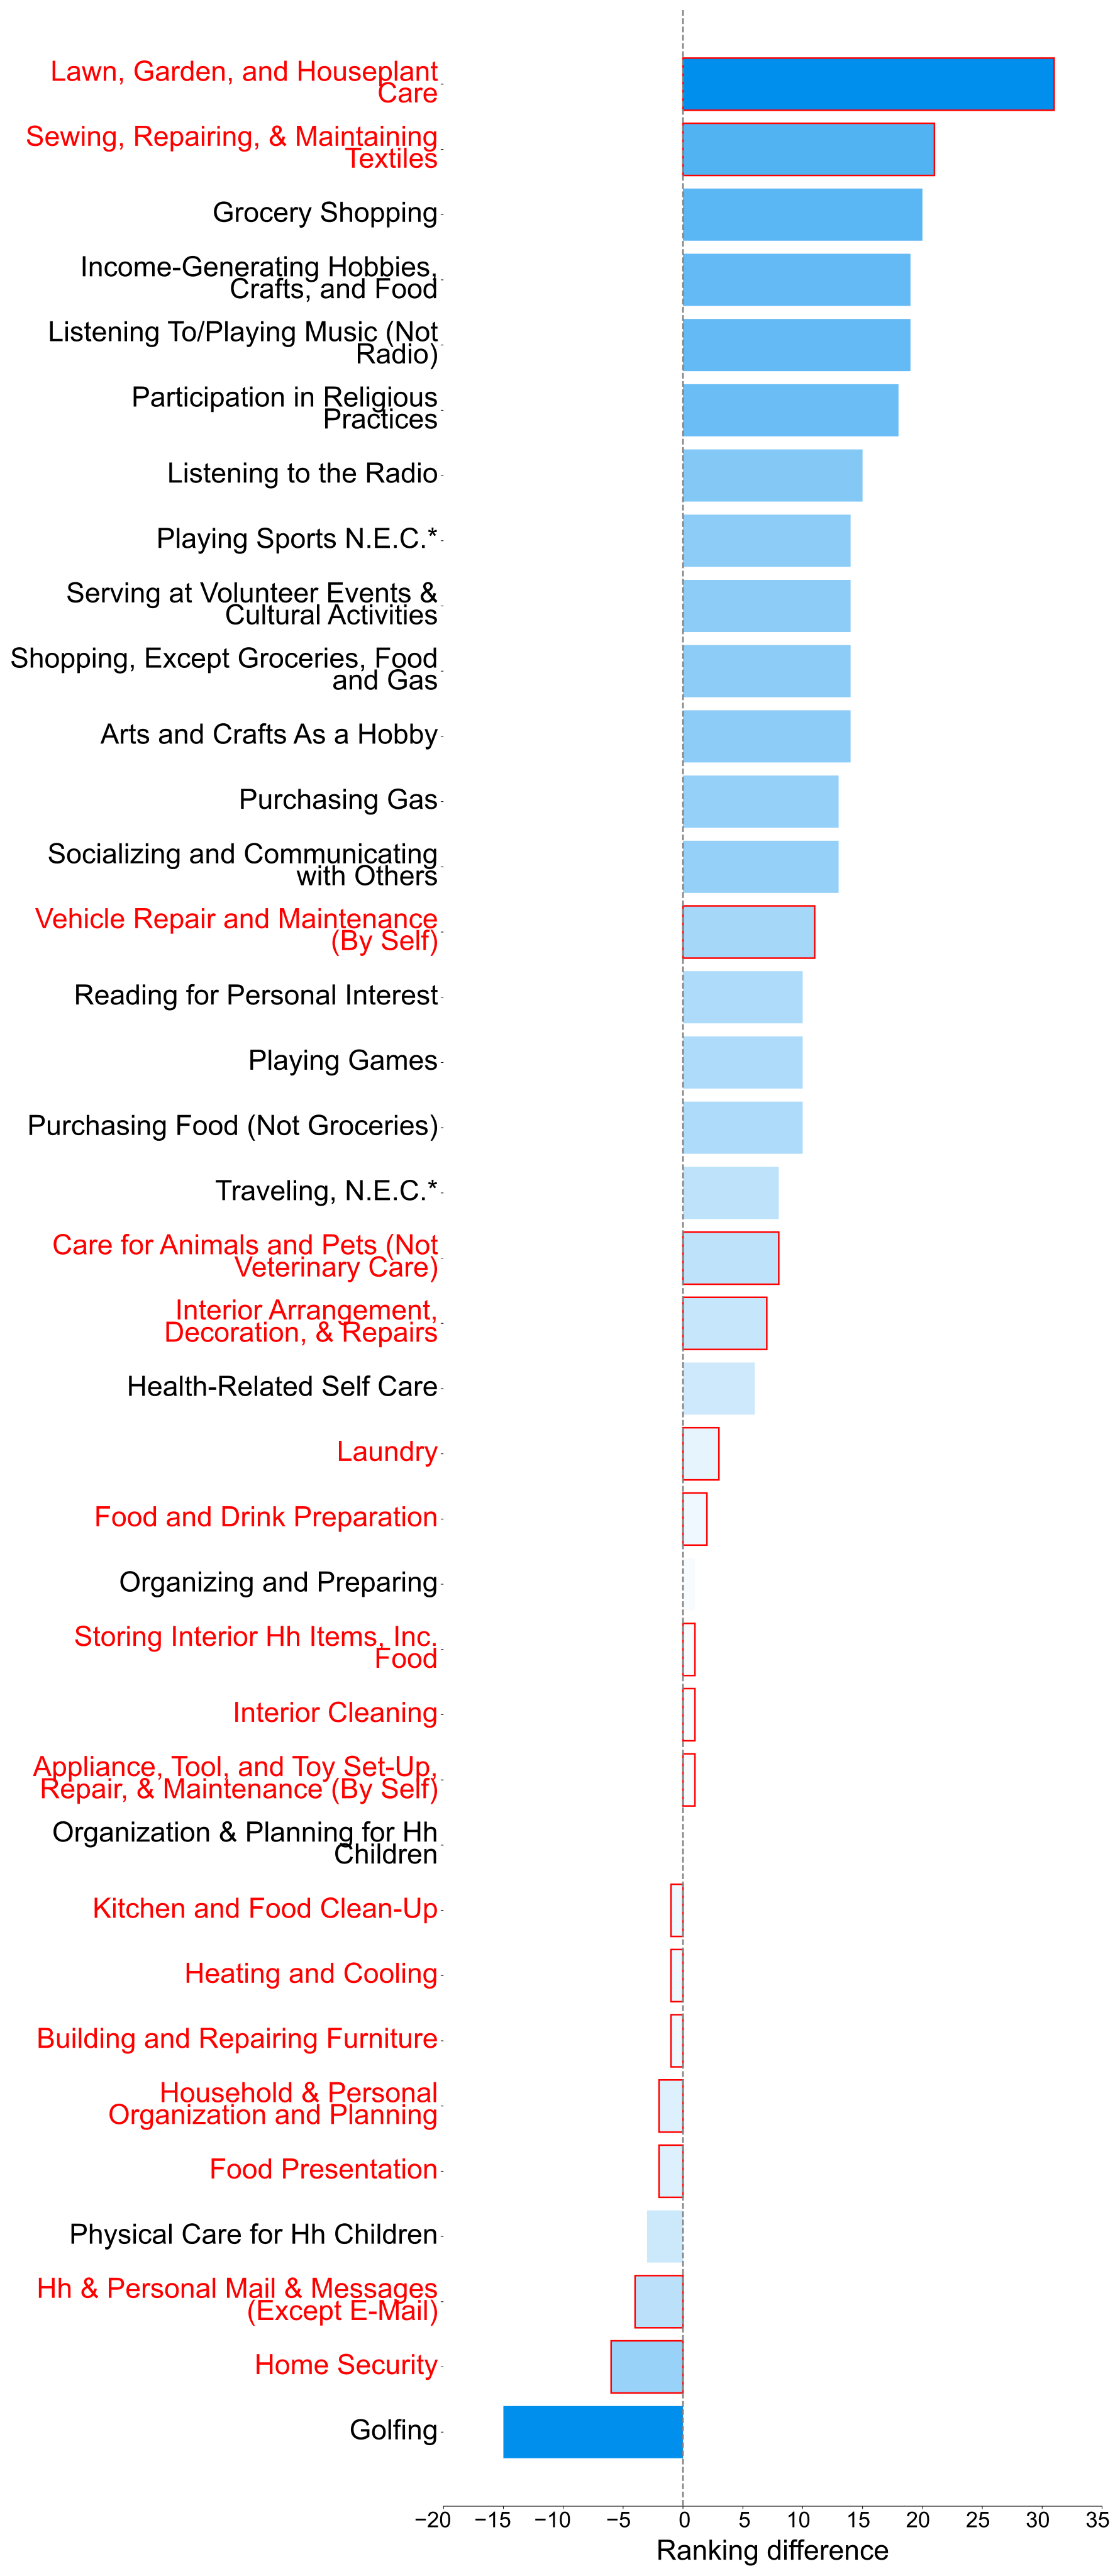
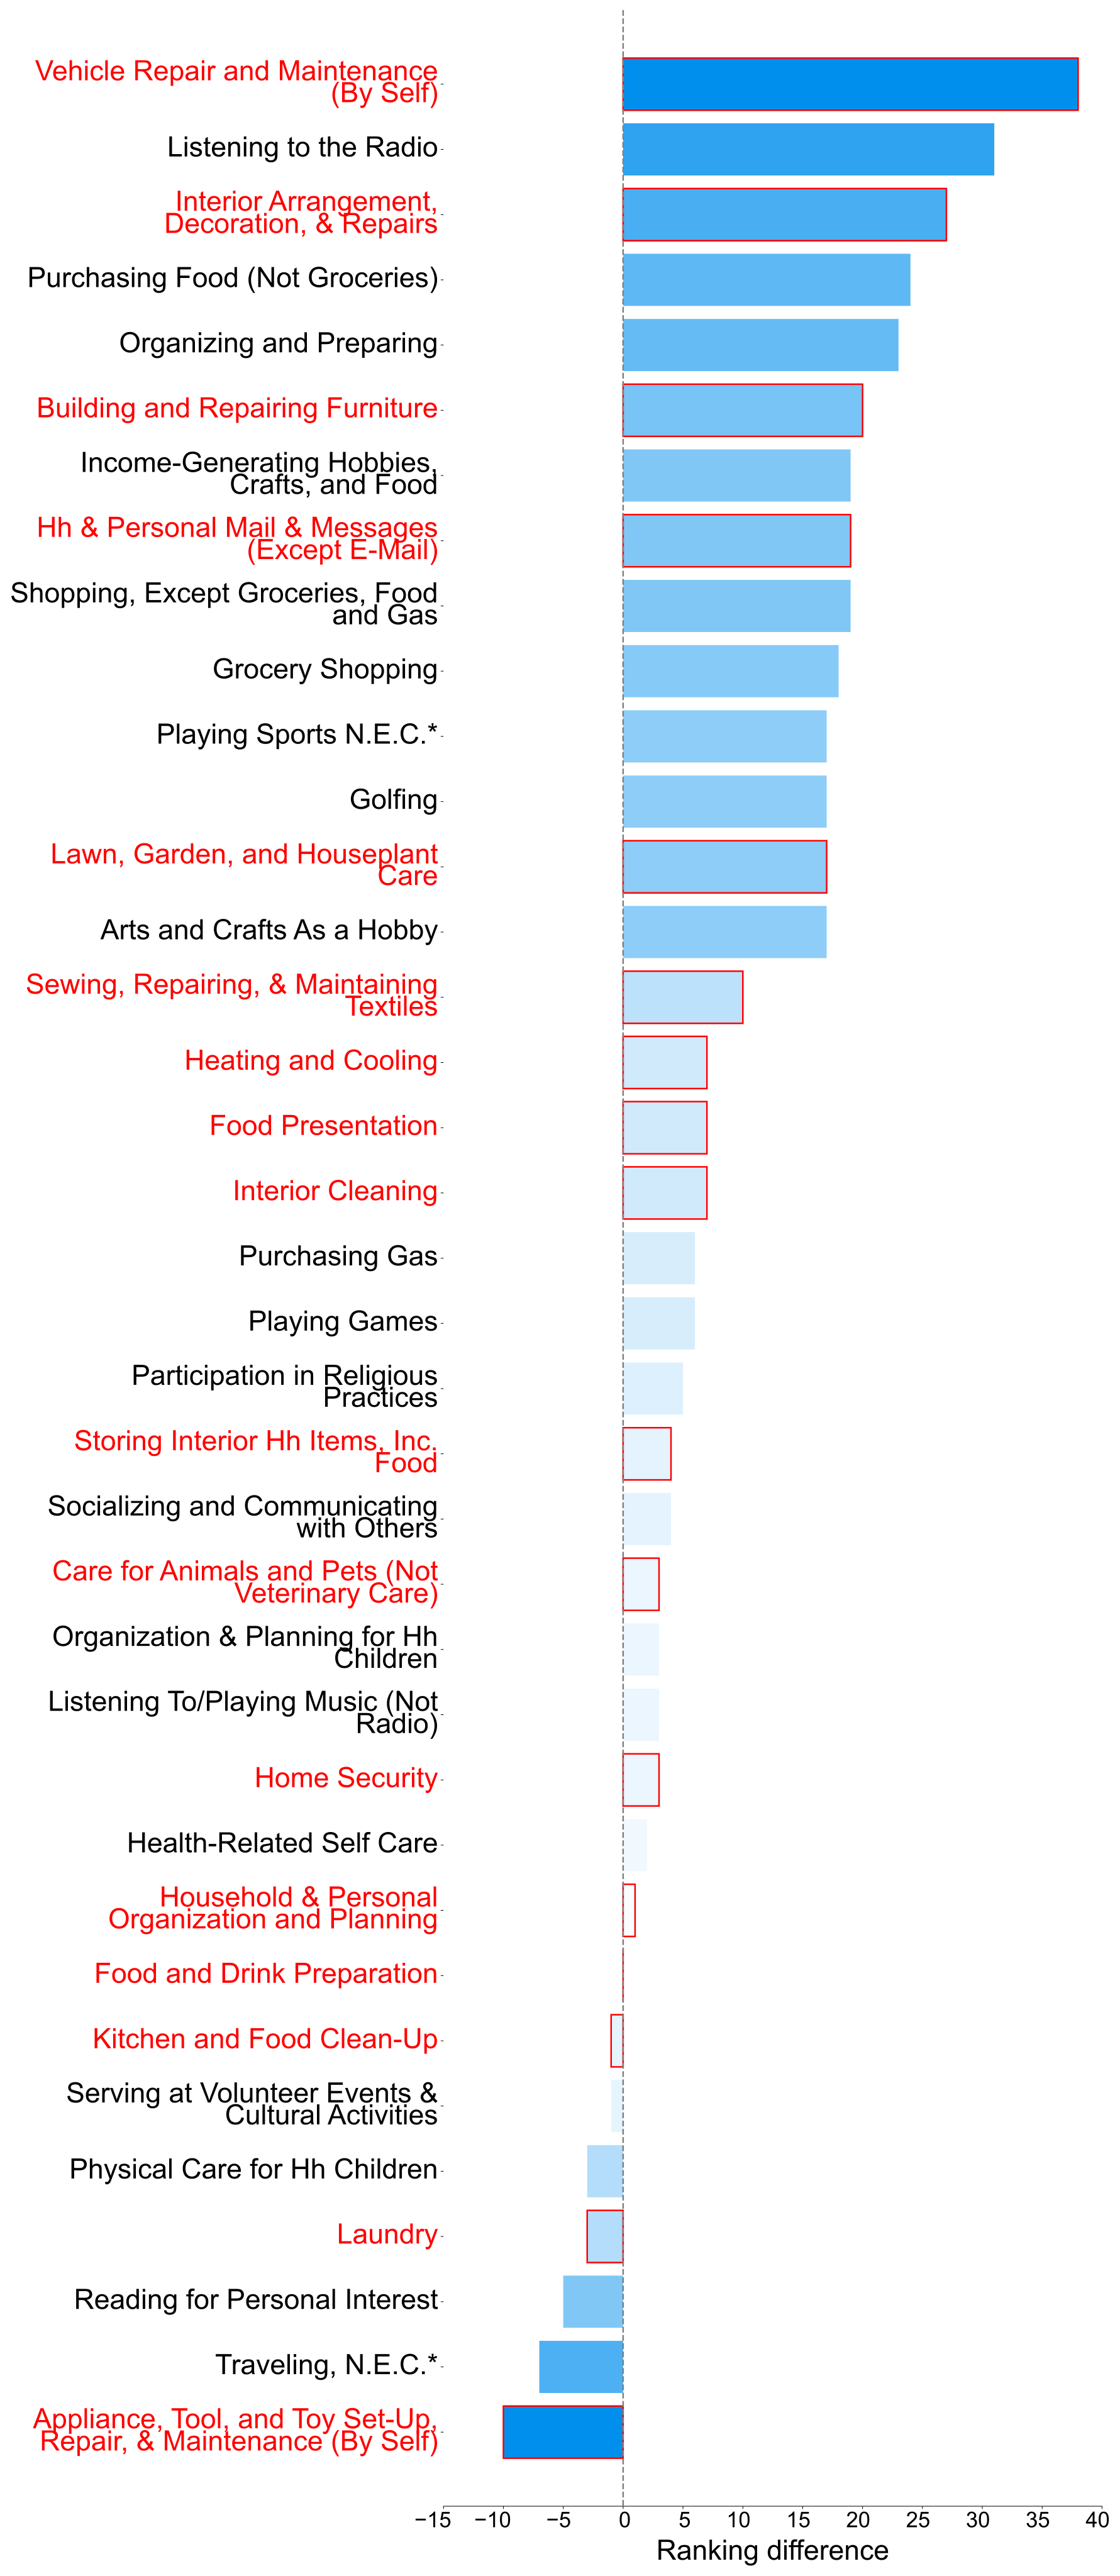
The appendix documents the released tool, sample composition, activity alignment, income/gender coding, ranking procedure, household subset, and further limitations. All broader activity and rank-difference plots are preserved.
7.1 Open Source B1K Dataset and Online Tool
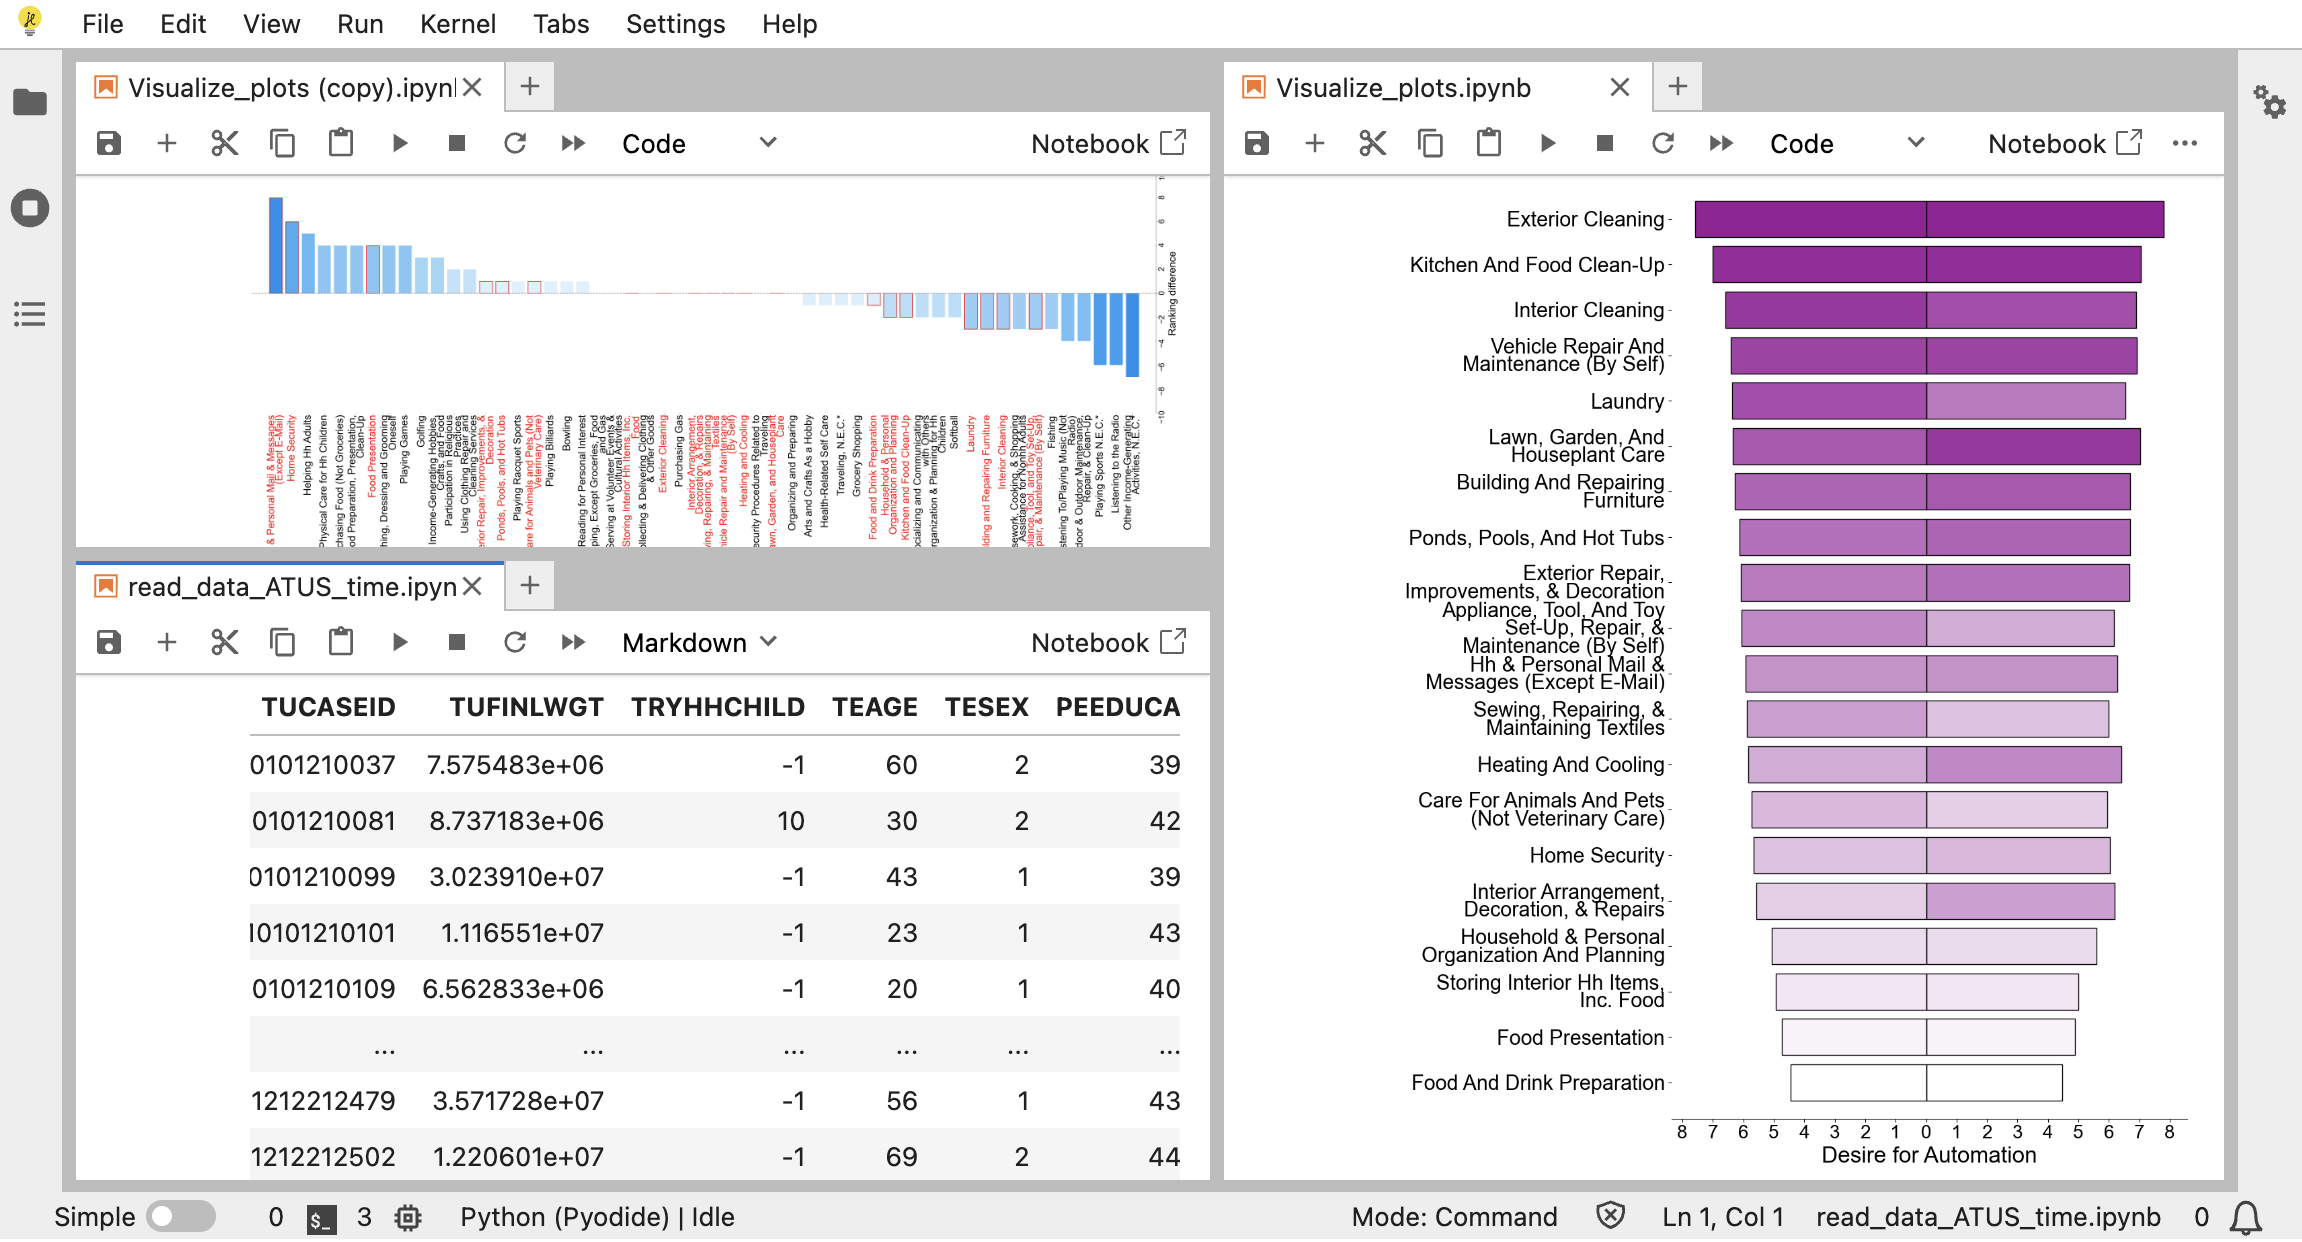
The release includes all BEHAVIOR-1K survey responses and a Python-based application for importing the datasets, inspecting demographics, ranking activities, and computing subgroup correlations. The paper’s screenshot shows the interface. The tool enables reproduction and additional exploration; this edition does not independently rerun the underlying survey analysis.
7.2 Demographics of the Datasets
BEHAVIOR-1K is predominantly White (75%), with only 5.74% reporting a disability and about 2% classified as high-income. The appendix reports 22,546 entries for the 2021 time-use data and substantially different income proportions from the robot-preference survey. Its sex/gender percentages also differ from figures stated earlier in the paper; the original numbers and graphics are retained rather than silently reconciled. These source inconsistencies reinforce the need to inspect the released data before reusing precise demographic estimates.
7.3 Dataset Alignment and Social Subgrouping
Manual coding maps detailed BEHAVIOR tasks to time-use activity definitions. Time-use sex and household-income fields determine subgroups; household identifiers and member records supply household size. The wellbeing data is linked to its time-use records through case identifiers. BEHAVIOR responses are grouped separately using reported gender, household size, and income brackets. This links categories across surveys, not BEHAVIOR participants to diary participants.
7.4 Creating Rankings of the Activities
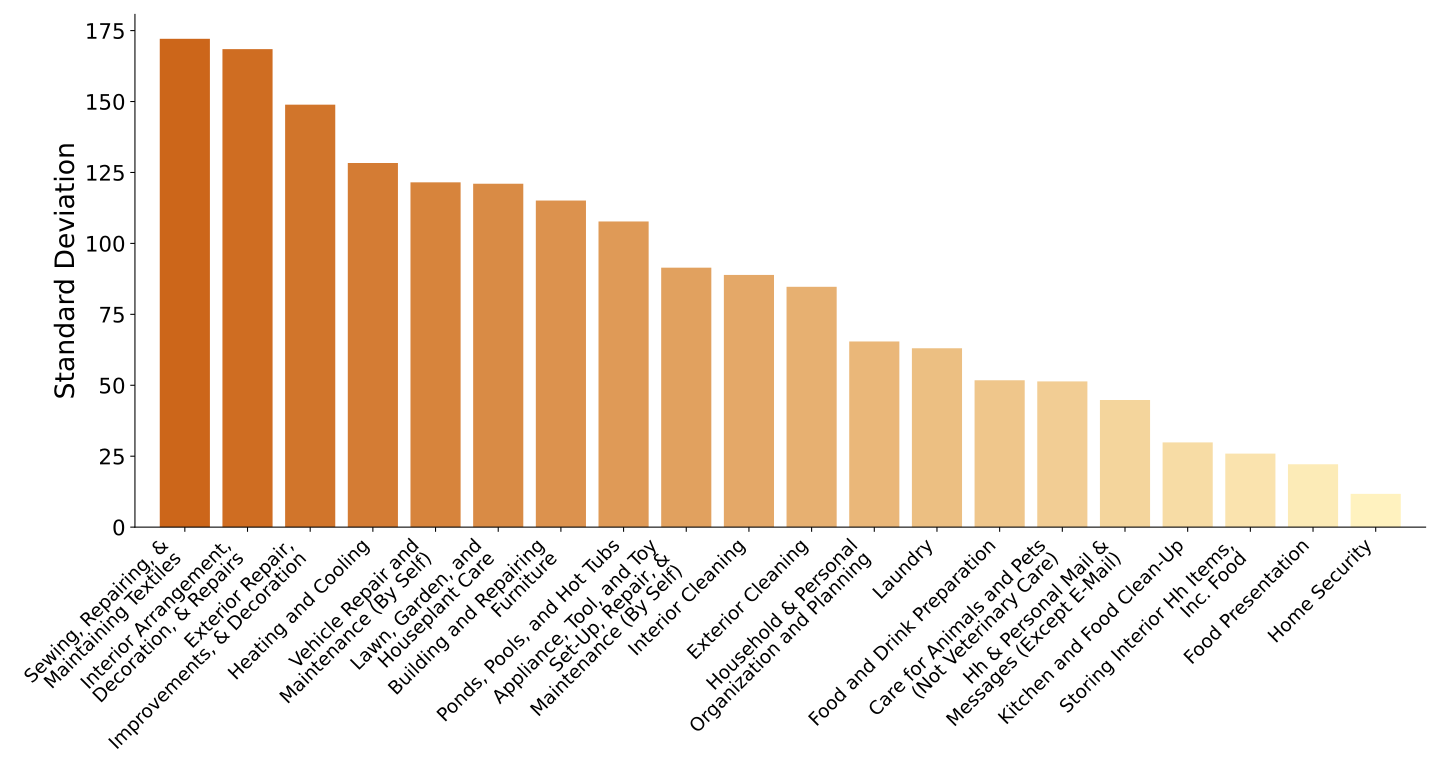
Activities rank by decreasing mean, with ties sharing a rank. Time includes nonparticipants as zero; activities absent from a subgroup can disappear from its ranked list, so lists vary in length. The appendix also plots time variability. Between-person variation can be substantial, and rankings of means cannot identify whether people with above-average burdens are the ones who request automation.
7.5 The Household Activities Subset
Main plots emphasize the time-use Household Activities category, including cleaning, laundry, cooking, yard work, pet care, and vehicle repair. This selection improves readability and focuses on plausible domestic robot uses. The text describes twenty household activities among thirty-four shared activities, yet also refers to a broader appendix set exceeding fifty. This counting inconsistency is left visible; all fourteen numbered figures, including every broader-ranking panel, are retained.
7.6 On the Gender Variable
The authors discuss inclusive survey measurement and the underrepresentation of nonbinary and other gender identities. They distinguish self-described gender from binary sex coding and note that omitted categories create data invisibility. The cited gender-equity guidelines [54] motivate more inclusive response options and analysis rather than treating the present two-category comparison as exhaustive.
7.7 Additional Limitations and Directions for Future Research
The assumptions about domestic labor do not adequately represent diverse family structures, including same-gender couples. The three datasets also come from different samples, and the appendix notes different collection years. Future work should collect automation desire, time use, and wellbeing from the same individuals and conduct targeted tests of the exploratory trends.