At a glance
StateTransformer-2 is a raster-based driving planner with a vision encoder and a decoder-only mixture-of-experts backbone. Larger variants improve the reported NuPlan closed-loop scores, and a separate proprietary-data study finds decreasing trajectory-prediction loss with increasing data and model scale. The evidence comes from log-based evaluation and simulation; it does not demonstrate safe real-world operation or that expert routing directly discovers distinct driving rewards.
I INTRODUCTION
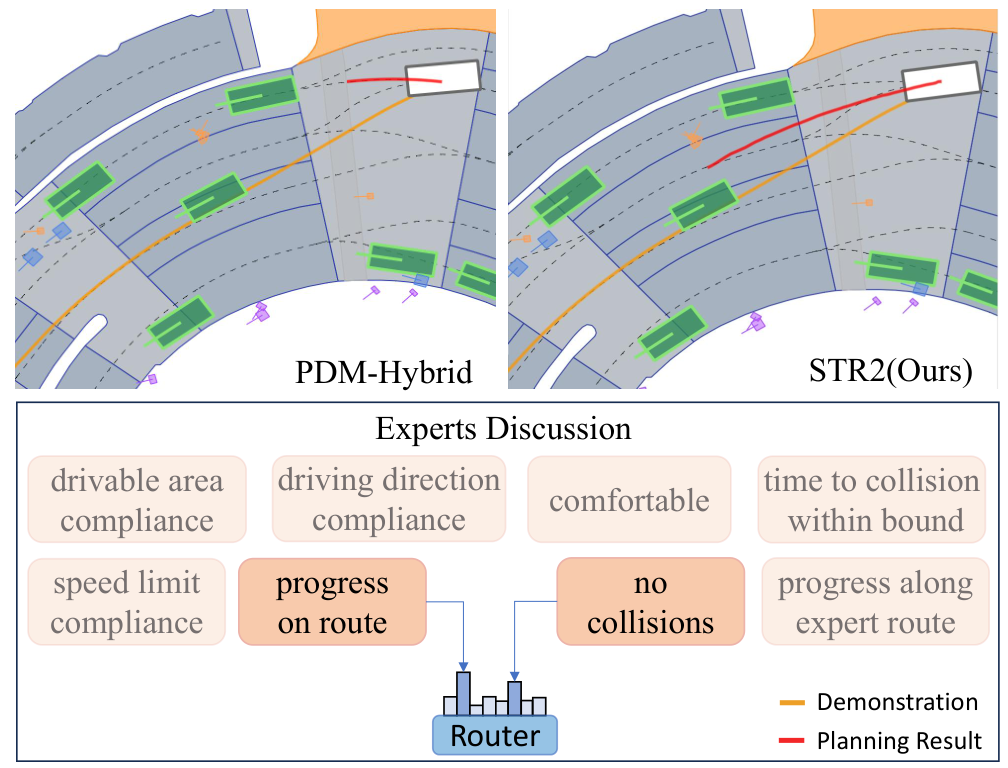
The paper studies whether simpler, scalable sequence models can generalize beyond common driving situations. It expands evaluation to larger NuPlan subsets, reactive-agent simulation, and synthetic InterPlan scenarios. STR2 predicts trajectories autoregressively, optionally using a discrete proposal token to reduce averaging across incompatible motion modes. The claims about balancing rewards are an interpretation of model behavior; training uses demonstrations rather than an explicitly identified reward model.
II Related Work
The comparison spans rule-based planning, imitation learning, and other learning-based planners. Simulation quality, dataset choice, and evaluation protocol can influence their relative performance; no approach has a general optimality or safety guarantee from these experiments.
II-A Imitation Learning based Planners
Imitation planners learn trajectories from demonstrations but can drift into unfamiliar states in closed-loop use. Prior systems add structured planning, augmentation, learned costs, or search. STR2 emphasizes model and data scaling, while still using trajectory sampling and scoring at deployment for the reported closed-loop setup.
II-B Scaling Laws
Scaling studies in sequence modeling motivate testing prediction loss against dataset and model size. Such trends are empirical relationships over the measured range, not guarantees that increased scale improves every driving metric.
II-C Simulation and Testings
NuPlan provides recorded urban driving and simulation-based evaluation. Open-loop trajectory similarity can diverge from closed-loop performance because of controller error and other agents’ responses. Reactive simulations remain simplified, so the paper uses several subsets and metrics rather than treating one score as a complete measure of generalization.
III Scaling for Generality with MoE
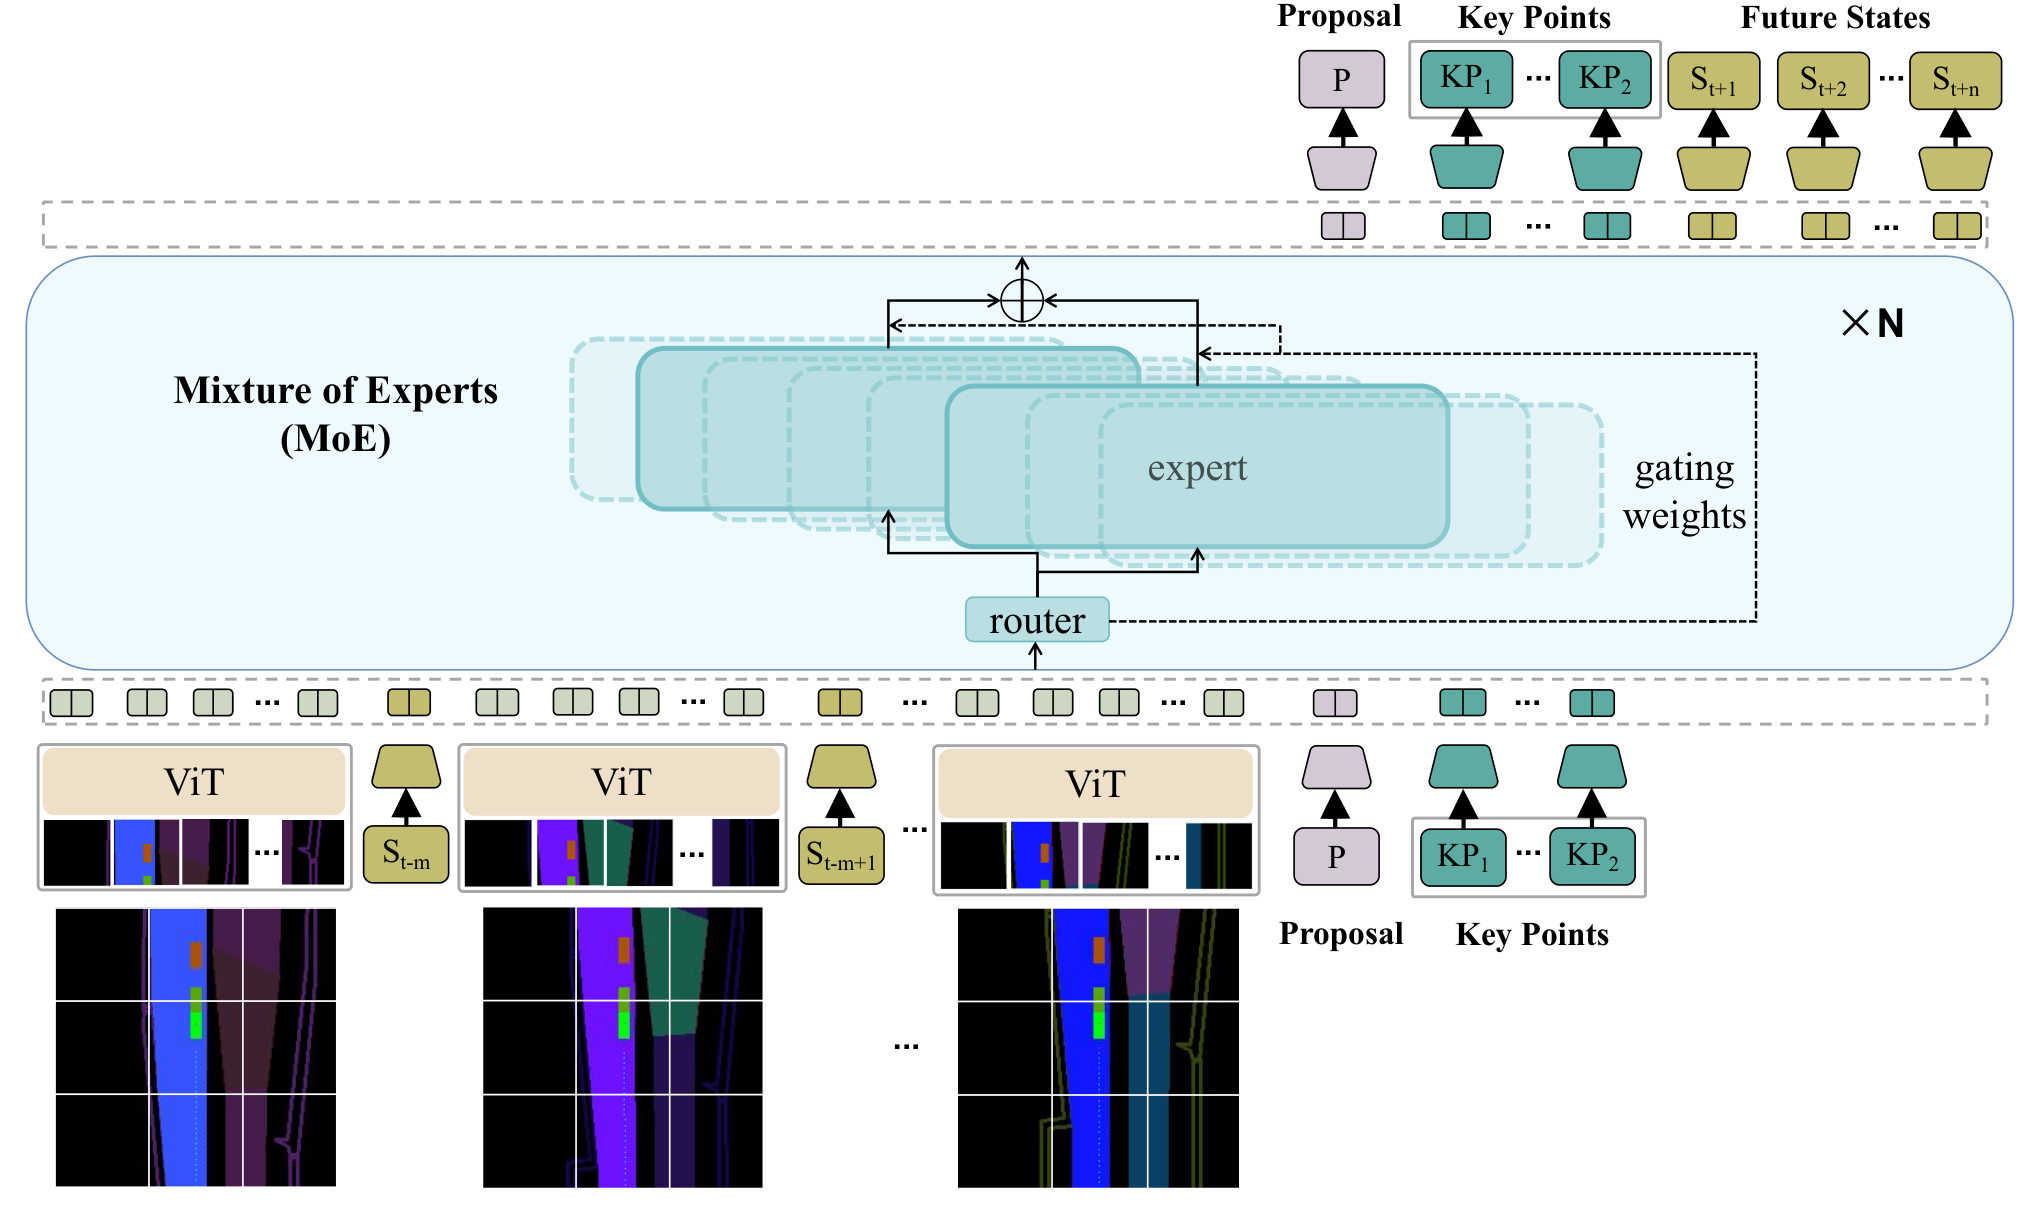
The planner uses two seconds of context to predict an eight-second ego trajectory, represented as a sequence of context, optional proposal, key points, and future states.
III-A Training and Testing Datasets
Training removes scenario-type filters and uses more than seven million NuPlan scenarios. The reported larger evaluation sets contain 4,790 validation and 4,639 test scenarios. The accompanying description of sampling 100 scenarios for each of 14 types does not fully explain those totals. Val14, TestHard, reactive simulation, and InterPlan provide additional comparisons with different sources of difficulty.
| Val14 Set | TestHard Set | Val4k Set | Test4k Set | InterPlan | |||||
| Methods | NR | R | NR | R | NR | R | NR | R | Score |
| Expert (log replay) | 94 | 80 | 85.96 | 68.80 | 93.08 | 76.91 | 93.12 | 75.01 | 14.76 |
| IDM [28] | 75.59 | 77.32 | 56.16 | 62.26 | 72.52 | 76.03 | 72.45 | 74.10 | - |
| GameFormer [29] | 82.95 | 83.88 | 66.59 | 68.83 | - | - | - | - | - |
| PDM-Hybrid [6] | 92.84 | 92.12 | 65.07 | 75.18 | 90.31 | 90.62 | 90.65 | 90.13 | 41.61 |
| PlanTF [7] | 84.72 | 76.25 | 72.59 | 60.62 | 80.52 | 70.84 | 80.90 | 70.62 | 30.53 |
| DTPP [8] | 71.66 | 66.09 | 60.11 | 63.66 | 68.43 | 65.24 | 71.98 | 70.20 | 30.32 |
| STR-16m [26] | 45.06 | 49.69 | 27.59 | 36.13 | 42.27 | 45.16 | 39.66 | 39.62 | - |
| STR2-CPKS-100m (Ours) | 92.79 | 92.18 | 74.25 | 78.40 | 90.45 | 91.14 | 90.66 | 90.25 | 42.13 |
| STR2-CKS-800m (Ours) | 92.32 | 92.12 | 74.21 | 78.58 | 90.64 | 91.15 | 90.35 | 90.37 | 44.77 |
| STR2-CPKS-800m (Ours) | 93.91 | 92.51 | 77.54 | 82.02 | 91.41 | 91.53 | 92.14 | 91.38 | 46.03 |
| Methods | Score | Col. | Drivable | Direction | Making Prog. | TTC | Speed Limit | Prog. on Route | Comfort |
| Expert (log replay) | 68.80 | 77.02 | 95.96 | 98.16 | 100.00 | 69.85 | 94.12 | 98.48 | 99.26 |
| GameFormer[29] | 68.83 | - | - | - | - | - | - | - | - |
| PlanTF [7] | 60.62 | 90.07 | 94.85 | 97.98 | 80.51 | 85.66 | 97.97 | 65.22 | 92.28 |
| PDM-Hybrid [6] | 75.18 | 95.22 | 95.58 | 99.08 | 93.38 | 84.19 | 99.53 | 75.47 | 83.45 |
| Hoplan [30] | 75.06 | 89.33 | 94.85 | 96.13 | 97.05 | 80.51 | 95.28 | 85.02 | 98.52 |
| GUMP hybrid [21] | 77.77 | 94.36 | 98.98 | 98.95 | 94.41 | 87.46 | 97.51 | 77.08 | 79.84 |
| STR2-CPKS-100m (Ours) | 78.40 | 96.51 | 96.32 | 98.90 | 94.49 | 85.29 | 99.70 | 77.91 | 83.46 |
| STR2-CKS-800m (Ours) | 78.58 | 96.32 | 96.69 | 98.90 | 94.49 | 84.56 | 99.70 | 79.29 | 86.02 |
| STR2-CPKS-800m (Ours) | 82.02 | 97.98 | 96.69 | 99.08 | 94.12 | 87.87 | 99.27 | 78.86 | 95.59 |
III-B Data Preprocess and Rasterization
Data preprocessing reduces precision to float32, merges pedestrian crowds into shapes, and removes unused road-user attributes. Fully stationary ten-second segments are filtered. Maps and agents are rasterized into 34 occupancy channels at two spatial scales, each 224 by 224, to represent both local detail and longer-range motion.
III-C StateTransformer-2
A 12-layer vision transformer encodes raster context; a causal transformer routes tokens through two of eight feed-forward experts per layer. Proposal-equipped variants classify among 512 clustered, dynamically feasible trajectories before generating continuous outputs. For closed-loop evaluation, the system combines predicted paths, lateral offsets, and target-speed choices into 21 candidates, rolls them through the controller, and scores the resulting trajectories. Thus the final planner includes structured search and scoring in addition to the learned model.
| Val4k Set | Test4k Set | Val14 Set | |||||||
| Methods | OLS | 8sADE | 8sFDE | OLS | 8sADE | 8sFDE | OLS | 8sADE | 8sFDE |
| PlanCNN [32] | - | - | - | - | - | - | 64 | 2.468 | 5.936 |
| PDM-Hybrid [6] | 84.06 | 2.435 | 5.202 | 82.01 | 2.618 | 5.546 | 84 | 2.382 | 5.068 |
| PlanTF [7] | 88.59 | 1.774 | 3.892 | 87.30 | 1.855 | 4.042 | 89.18 | 1.697 | 3.714 |
| DTPP [8] | 65.15 | 4.196 | 9.231 | 64.18 | 4.117 | 9.181 | 67.33 | 4.088 | 8.846 |
| STR-124m [26] | 81.88 | 1.939 | 4.968 | 82.68 | 2.003 | 4.972 | 88.0 | 1.777 | 4.515 |
| STR2-CKS-800m (Ours) | 90.07 | 1.473 | 4.124 | 89.12 | 1.537 | 4.269 | 89.2 | 1.496 | 4.210 |
III-D Training and Testing Settings
The encoder and backbone train from scratch for 20 epochs. The reported 800-million-parameter run uses eight 96-GB H20 accelerators; the 100-million run uses eight RTX 3090 GPUs. Batched simulation inference speeds evaluation, with each larger test set taking about five hours. The learning-rate schedule restarts each epoch and training uses bfloat16.
III-E Scaling on the LiAuto Dataset
The separate LiAuto study uses proprietary urban-driving logs with navigation maps and tracked road users. After filtering route mismatches, ten-second windows provide over one billion training samples. Windows are not equivalent to independent driving events, and the paper does not provide open access to this dataset. Mention of a large vehicle fleet describes the data and deployment context, not a reported controlled deployment trial of STR2.
| STR | Val14-OLS | Val14-8sADE | Val14-8sFDE | MR |
| STR2-100m | 88.56 | 1.55 | 4.47 | 3.05% |
| STR2-800m | 89.02 | 1.48 | 4.20 | 2.87% |
| STR2-1b | 89.74 | 1.46 | 4.13 | 2.15% |
IV Results
The results distinguish open-loop trajectory accuracy, closed-loop simulator scores, and proprietary-data scaling. Improvements in one category should not be assumed to establish gains in the others.
IV-A Open-Loop Performance
The reported 800-million STR2 model improves eight-second average displacement error over the listed baselines, but PlanTF has lower final displacement error on all three tabled subsets. The separate scaling table shows Val14 average error decreasing from 1.55 to 1.48 to 1.46 as model size rises from 100 million to 800 million to one billion parameters. These are prediction results, not direct real-world safety measures.
IV-B Closed-Loop Performance
The strongest proposal-equipped 800-million model leads the reported aggregate closed-loop comparisons, reaching 82.02 on reactive TestHard and 46.03 on InterPlan. Individual component metrics do not all improve uniformly. Reactive-agent behavior is rule-based and limited; score drops in some baselines suggest sensitivity but do not isolate causality confusion as the only explanation. GameFormer lacks a released checkpoint for the authors’ re-evaluation, so its available numbers are not uniformly reproduced across the new sets.
IV-C Scaling to Billions on LiAuto Dataset
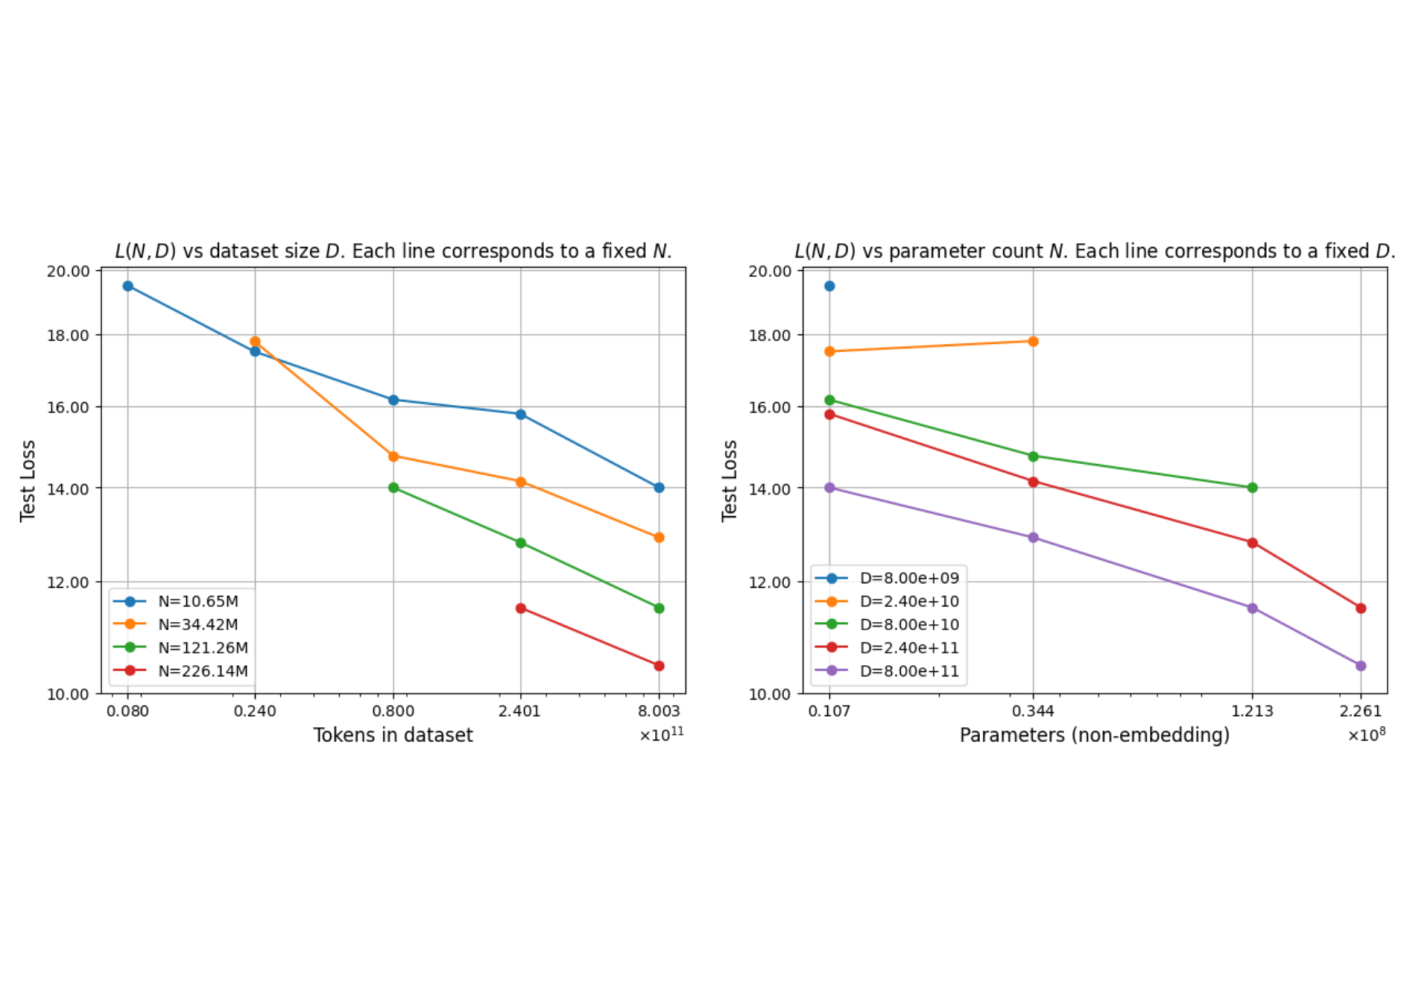
On the LiAuto data, measured prediction loss declines approximately as a power law across the tested data and model scales. This analysis reaches one billion samples and roughly 300 million model parameters, distinct from the larger NuPlan model sweep. It evaluates trajectory L2 loss rather than a matched sweep of closed-loop driving outcomes; extrapolation beyond the fitted range remains untested.
V CONCLUSIONS
Scaling a mixture-of-experts sequence planner improves several reported benchmarks, but limitations remain in simulator interaction fidelity, proprietary-data reproducibility, and inference latency on edge hardware. Larger-data and larger-model studies, stronger interactive simulators, and faster deployment are proposed future work. The results do not establish that model scale alone resolves autonomous-driving generalization.
ACKNOWLEDGMENT
The authors acknowledge contributions to simulator acceleration, baseline evaluation, training, sampling, and simulation analysis.