Overview
At a glance
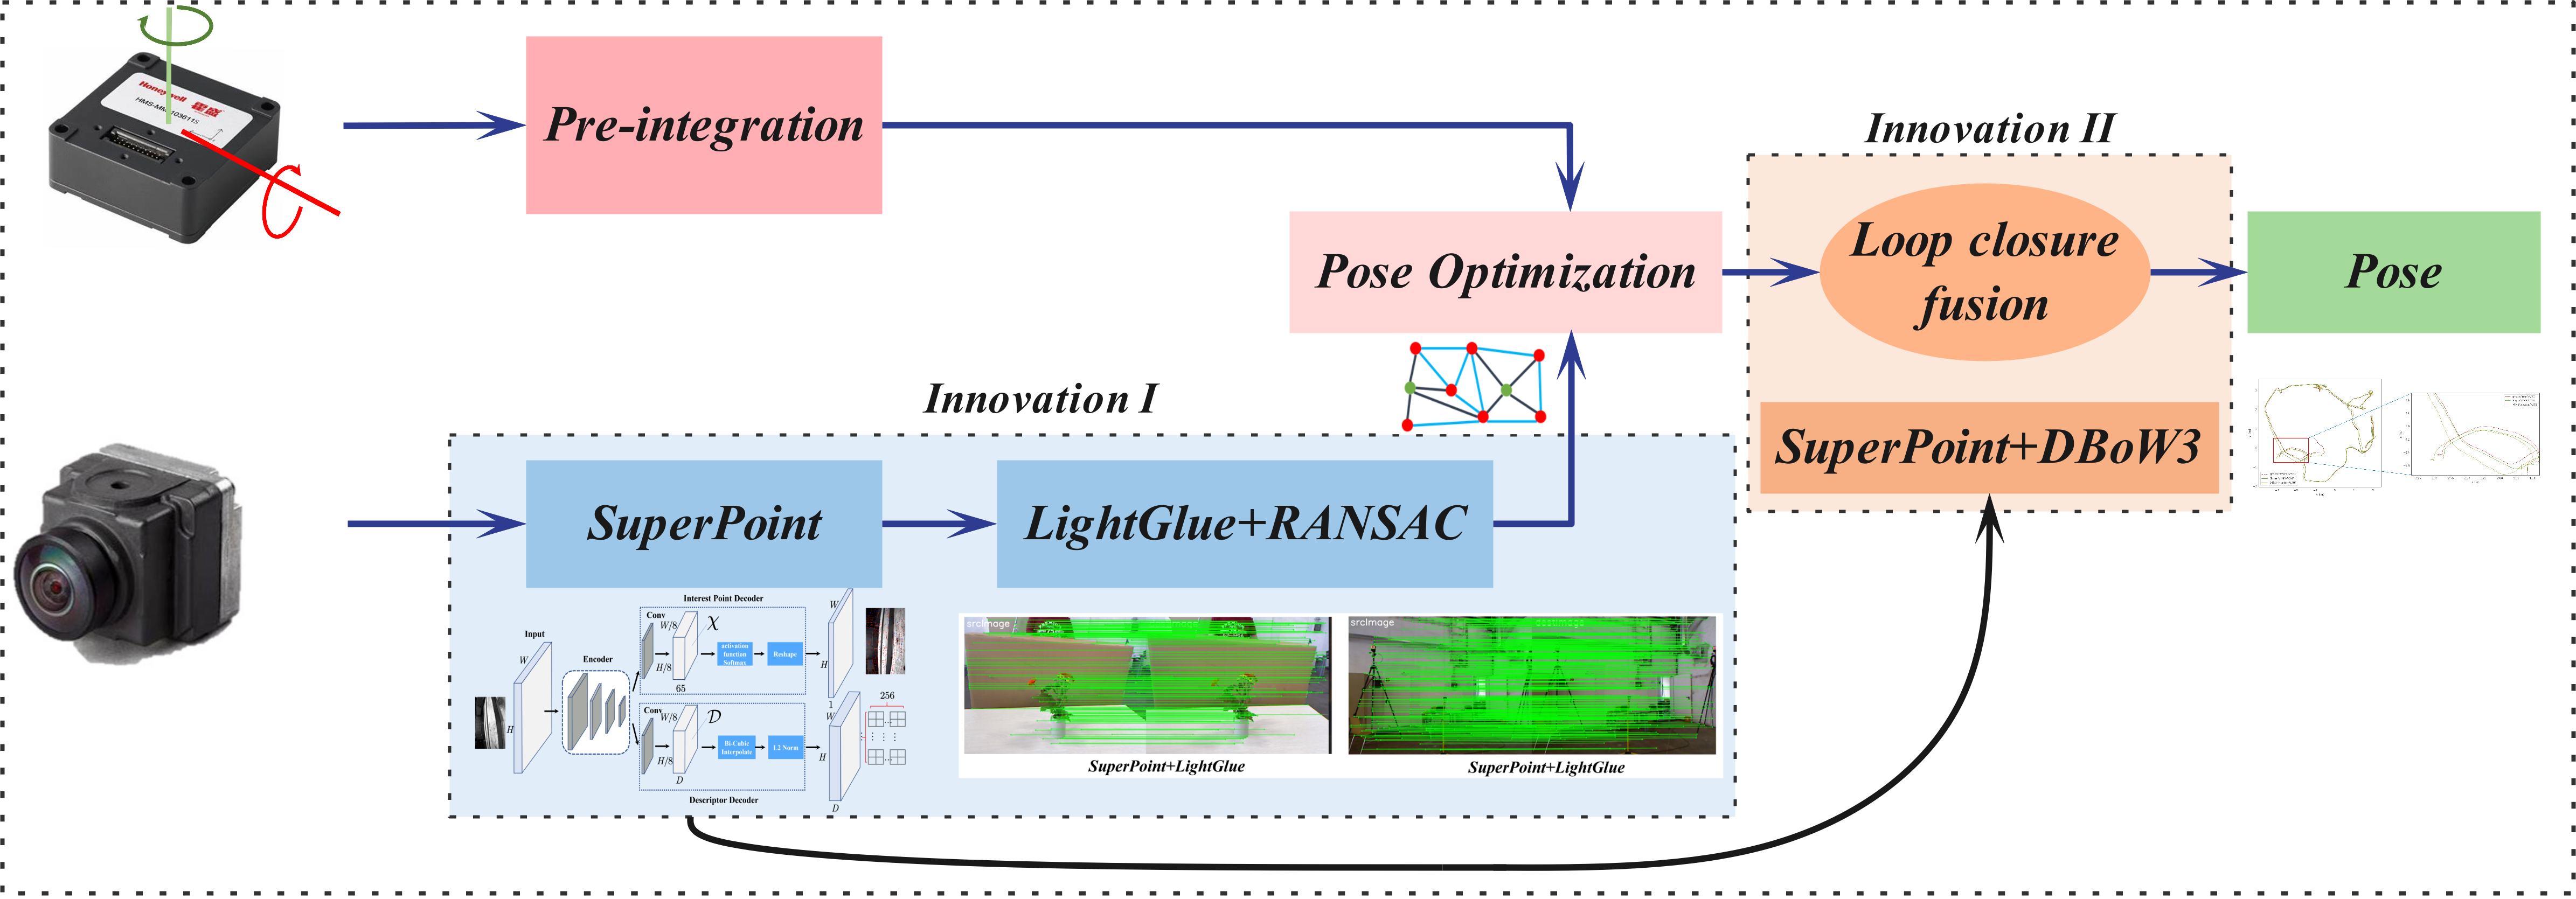
SuperVINS replaces VINS-Fusion’s visual front end with SuperPoint features and LightGlue matching, filters correspondences with RANSAC, and uses a learned-feature vocabulary for loop closure. On eleven EuRoC sequences, it improves selected difficult cases and tracks one sequence where the baseline fails, but does not improve accuracy consistently. The authors report near-real-time feature processing on an RTX 2060. Code is available.
1 Introduction
Visual-inertial SLAM combines camera observations and inertial measurements to estimate motion and map a scene. Low light, rapid motion, and blur can make conventional features unreliable. SuperVINS retains a geometric estimator while replacing feature extraction, matching, and loop-retrieval descriptors with learned alternatives. [1], [2], [6], [9], [10], [11], [12].
2 Related Work
The related work separates state estimation, visual correspondence, and learned SLAM components.
2.1 Traditional visual-inertial SLAM
Filtering methods such as MSCKF and OpenVINS and optimization systems such as VINS-Mono, VINS-Fusion, and ORB-SLAM3 provide established visual-inertial estimators. Adding other sensors or changing the state representation can help, but all still depend on usable visual information. [12], [9], [3], [4], [1], [2], [5], [6], [8].
2.2 Feature Extraction and Matching Method Based on Deep Learning
SuperPoint produces keypoints and fixed-length descriptors; LightGlue associates them across images. The authors choose this combination for a balance of matching quality, descriptor compatibility with loop retrieval, and computation. Alternatives include DISK, LoFTR, SuperGlue, XFeat, OmniGlue, and Efficient LoFTR; the paper does not provide a controlled end-to-end comparison of every alternative. [13], [22], [7], [14], [16], [17], [18], [15].
2.3 Visual-inertial SLAM based on deep learning
Prior hybrid systems replace individual modules, while end-to-end models predict motion more directly. SuperVINS applies learned features in both tracking and loop detection while keeping VINS-Fusion’s state-estimation structure. [20], [21], [24], [23].
3 System Overview
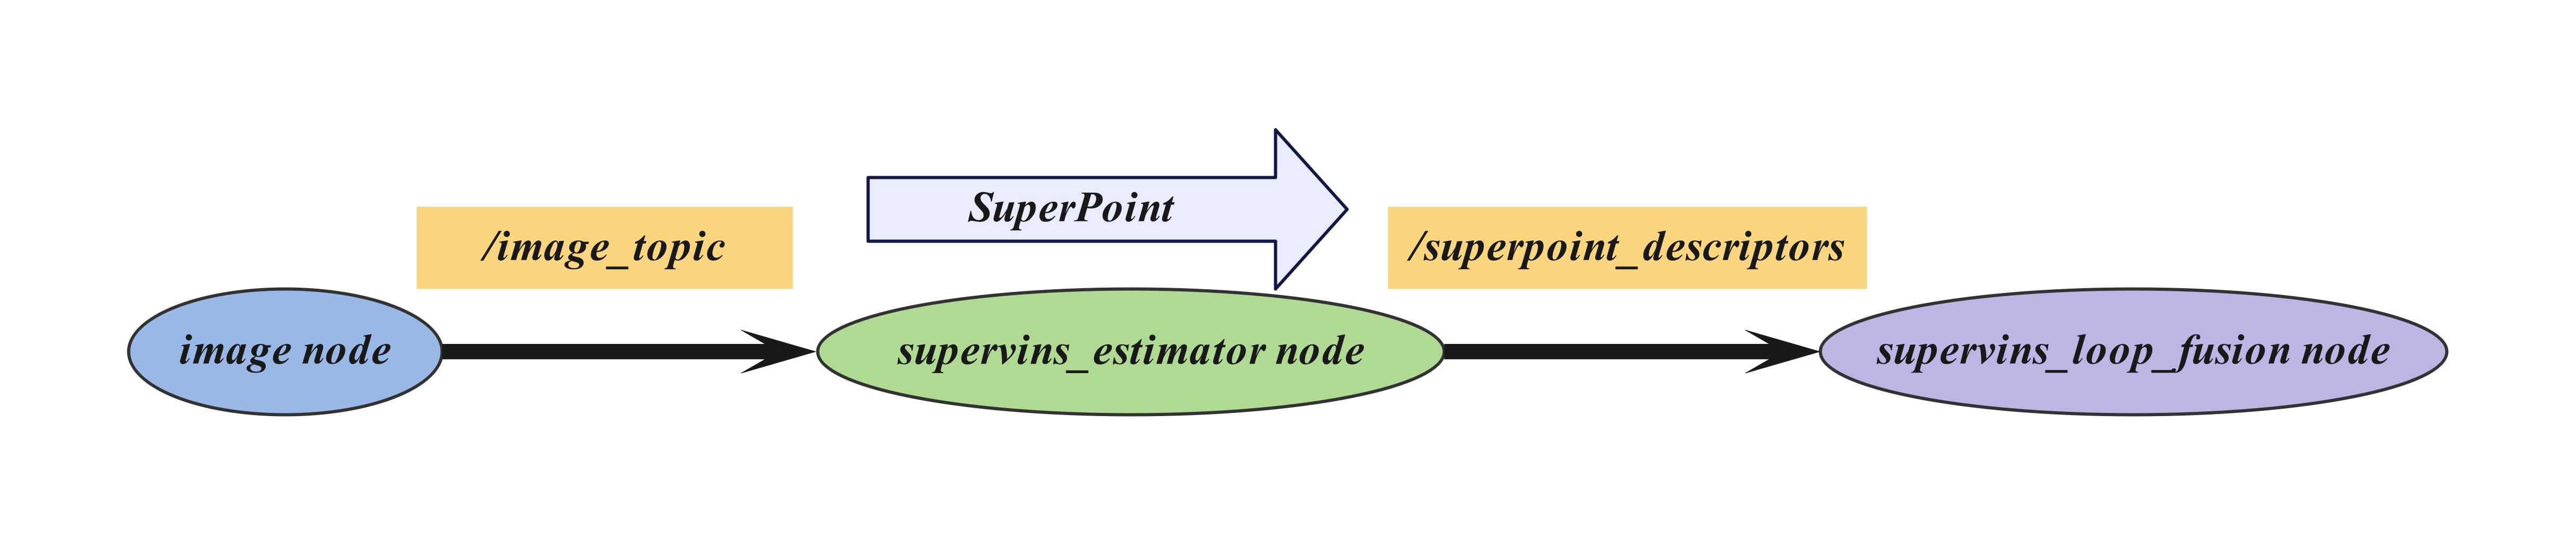
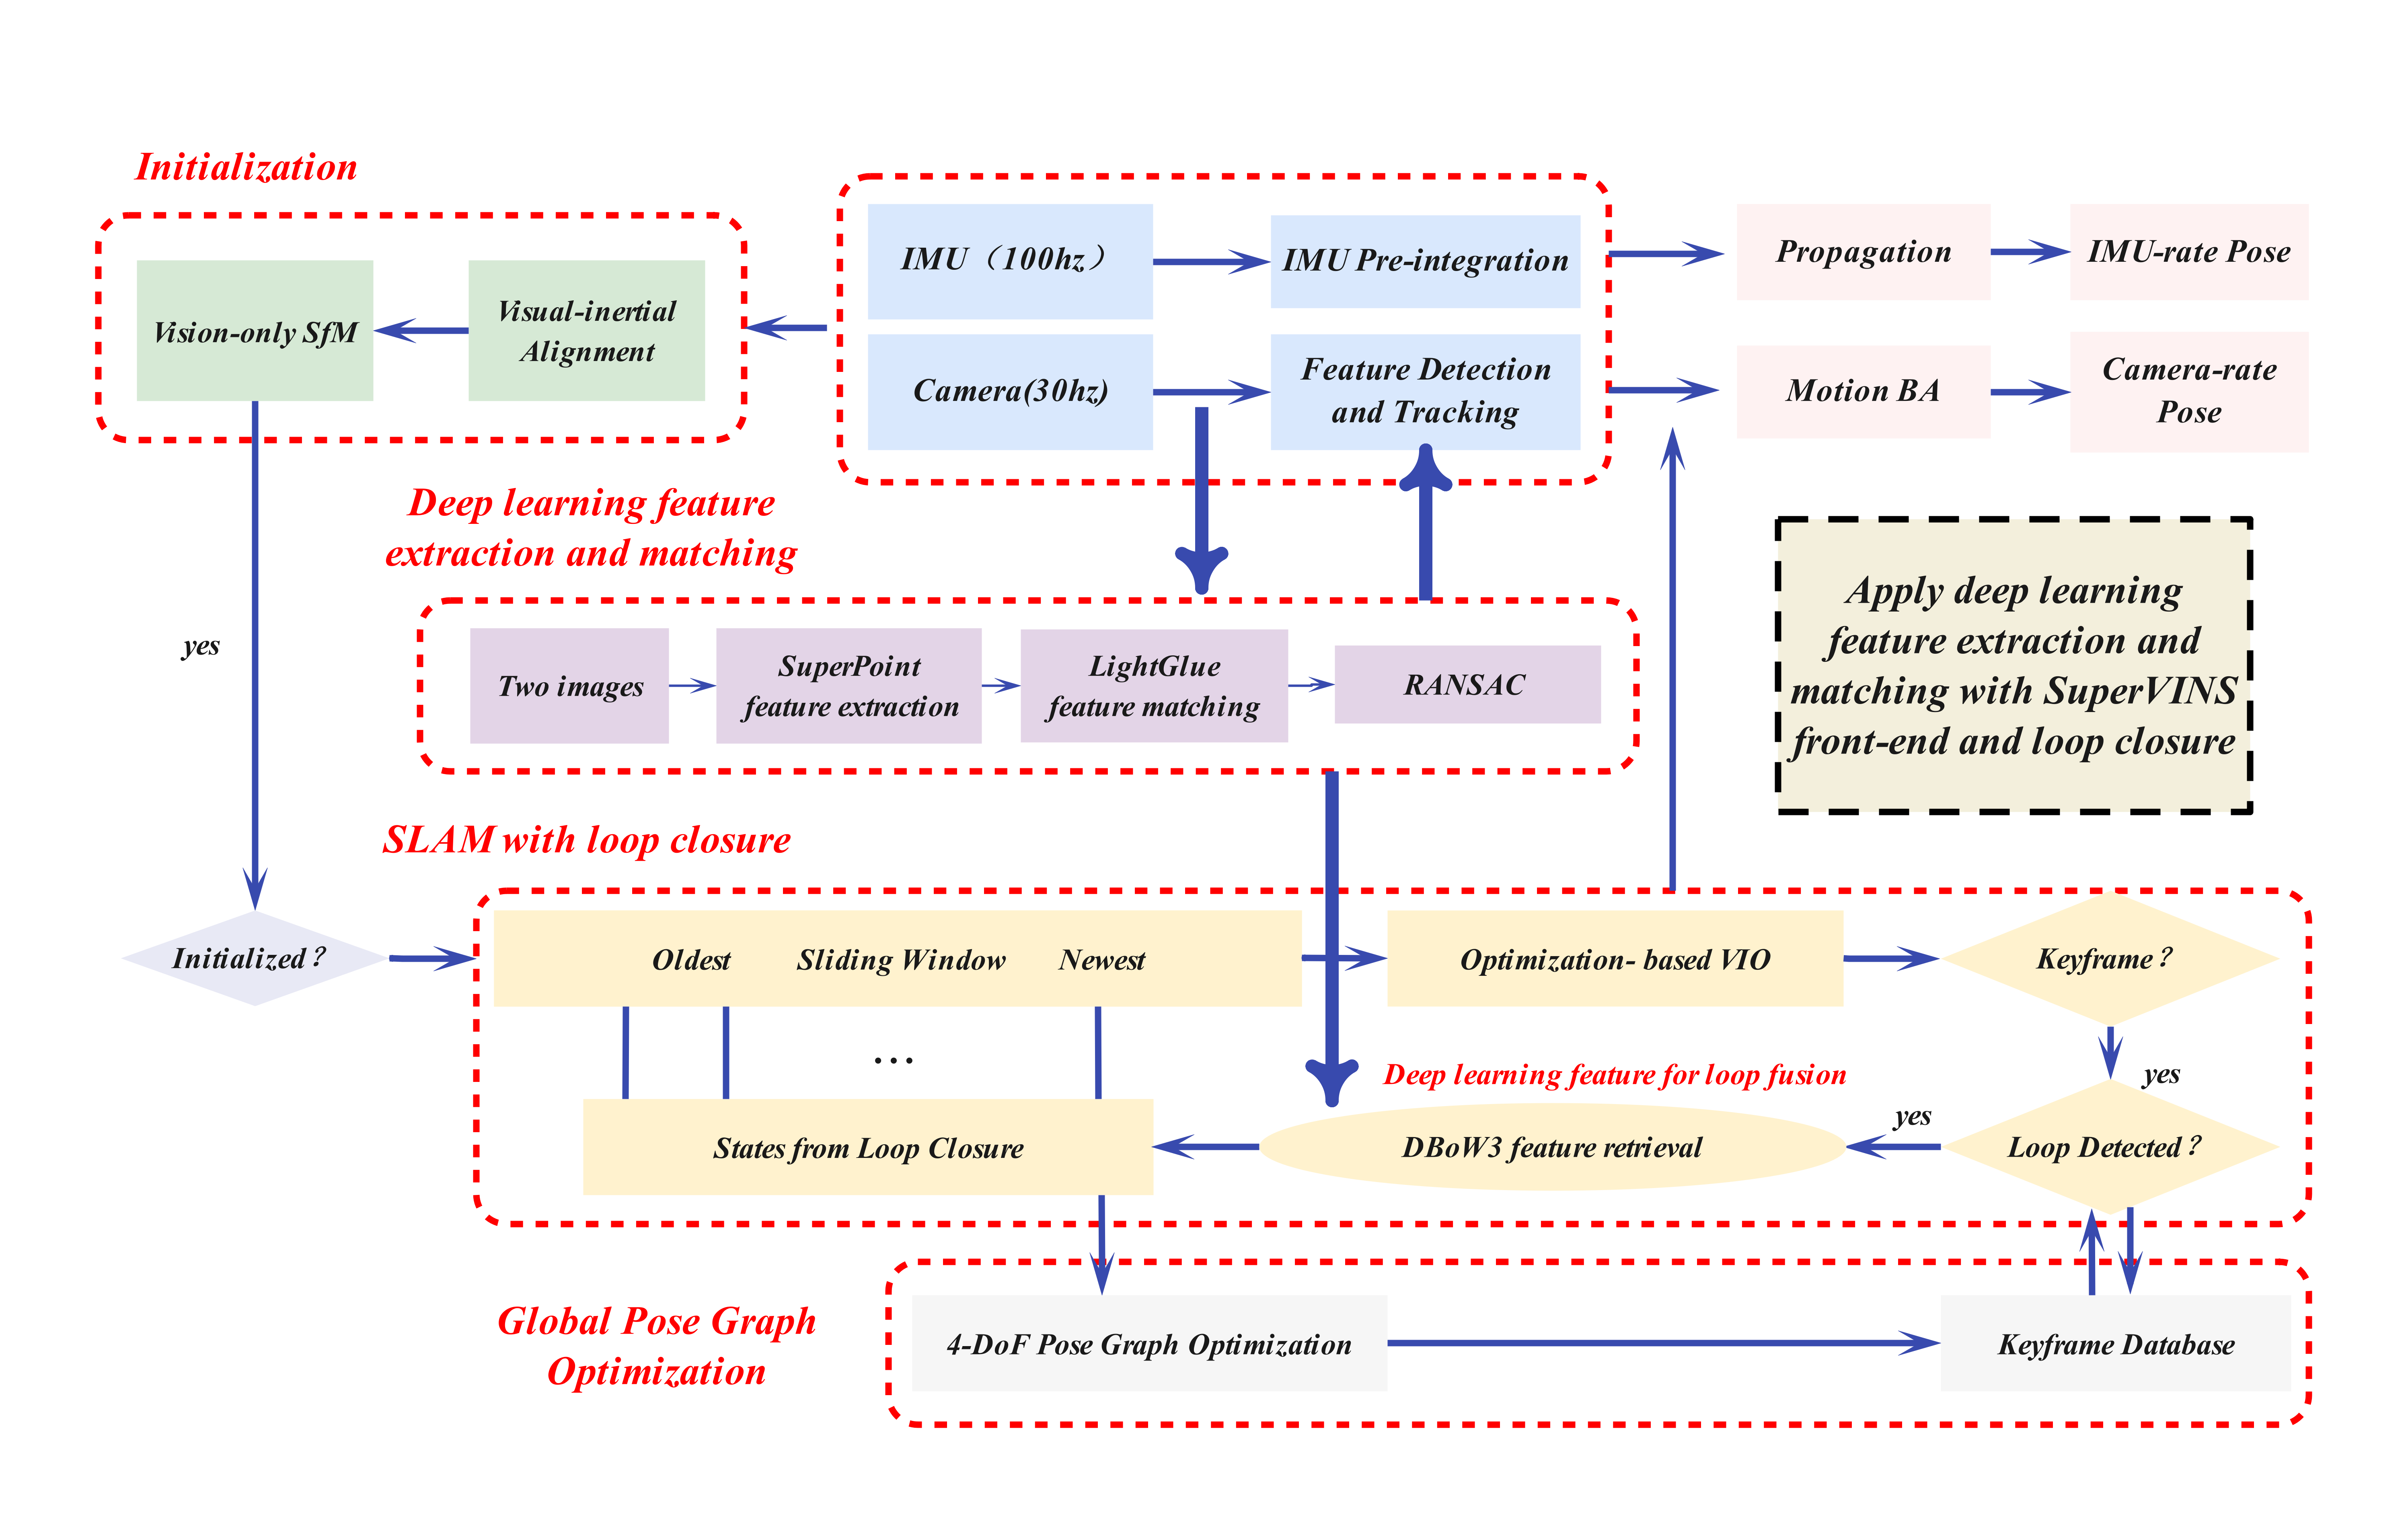
A monocular camera and IMU supply the observations. ROS nodes transfer learned descriptors to front-end tracking and loop detection. After feature matching and rejection, the system performs inertial preintegration, keyframe selection, sliding-window pose optimization, and pose-graph correction using DBoW3 retrieval.
4 Method
The method combines learned correspondences, spatial feature selection with geometric rejection, and a dataset-specific visual vocabulary.
4.1 SuperPoint Feature Extraction and LightGlue Feature Matching
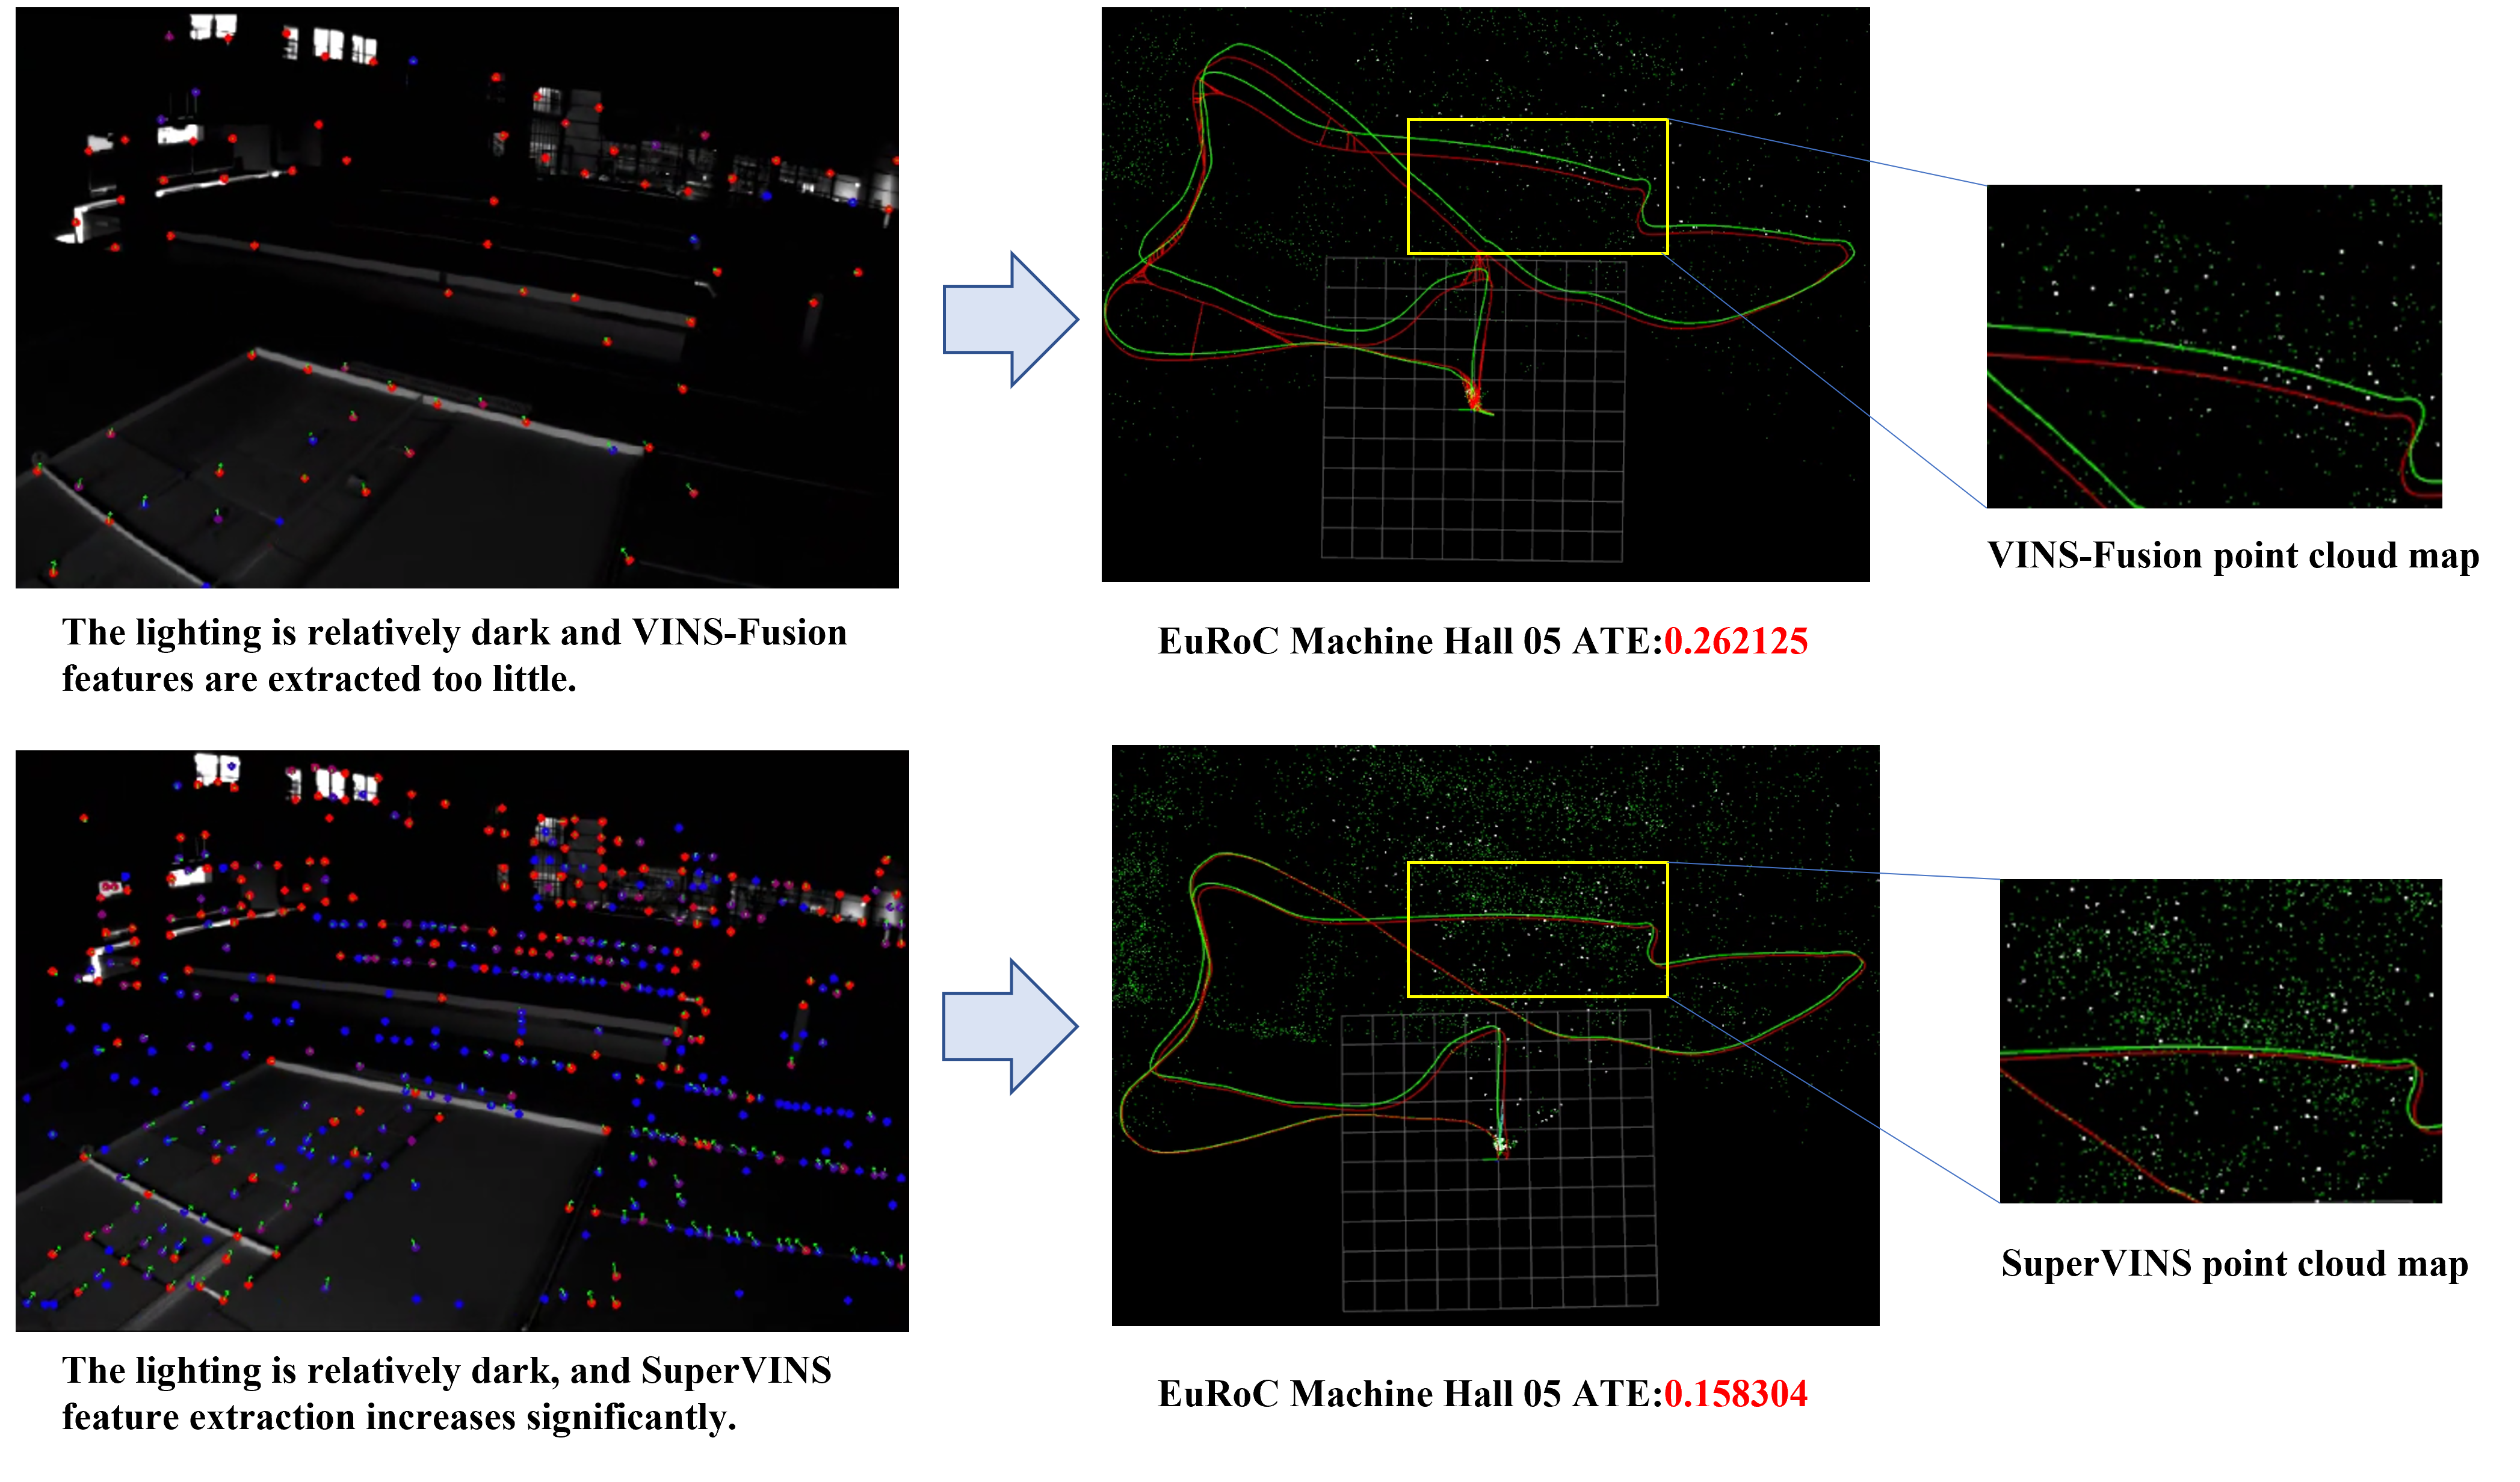
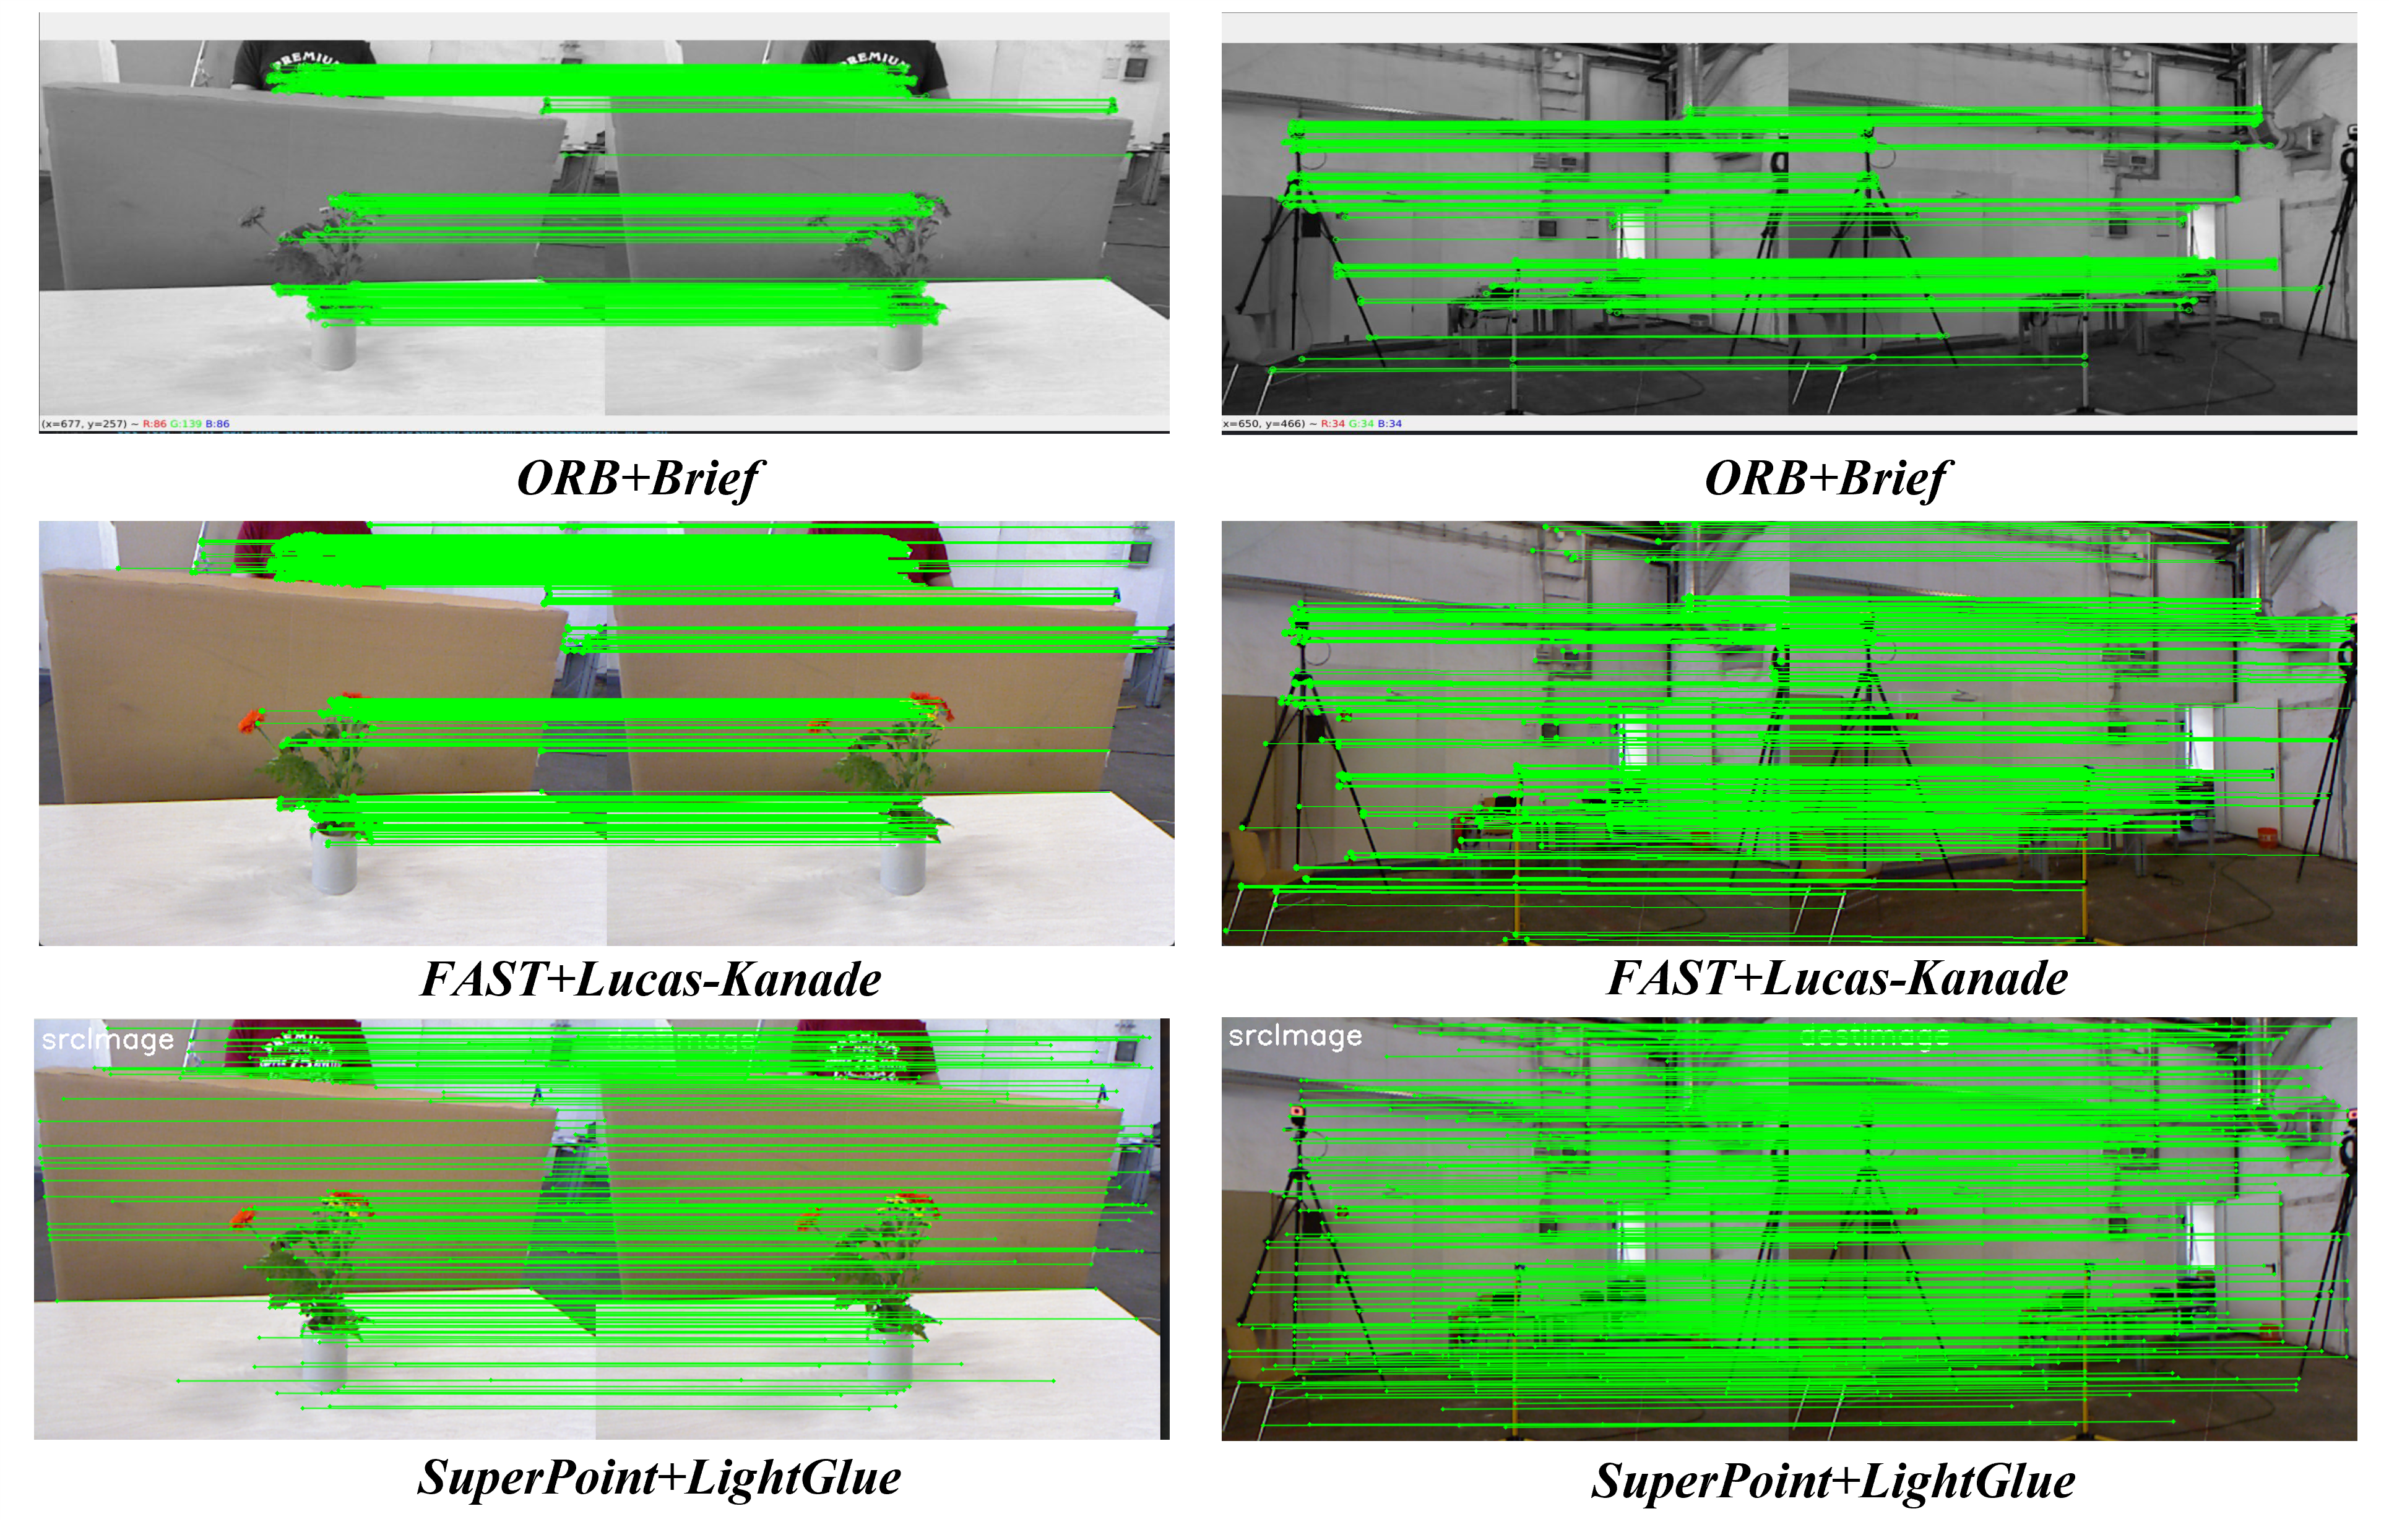
SuperPoint supplies 256-dimensional descriptors. LightGlue matches successive frames and adapts computation to matching difficulty. These descriptors also form the loop-closure vocabulary. The qualitative examples show more correspondences in difficult lighting, but descriptor dimensionality alone does not establish retrieval quality. [13], [22].
4.2 Matching Enhancement Strategy
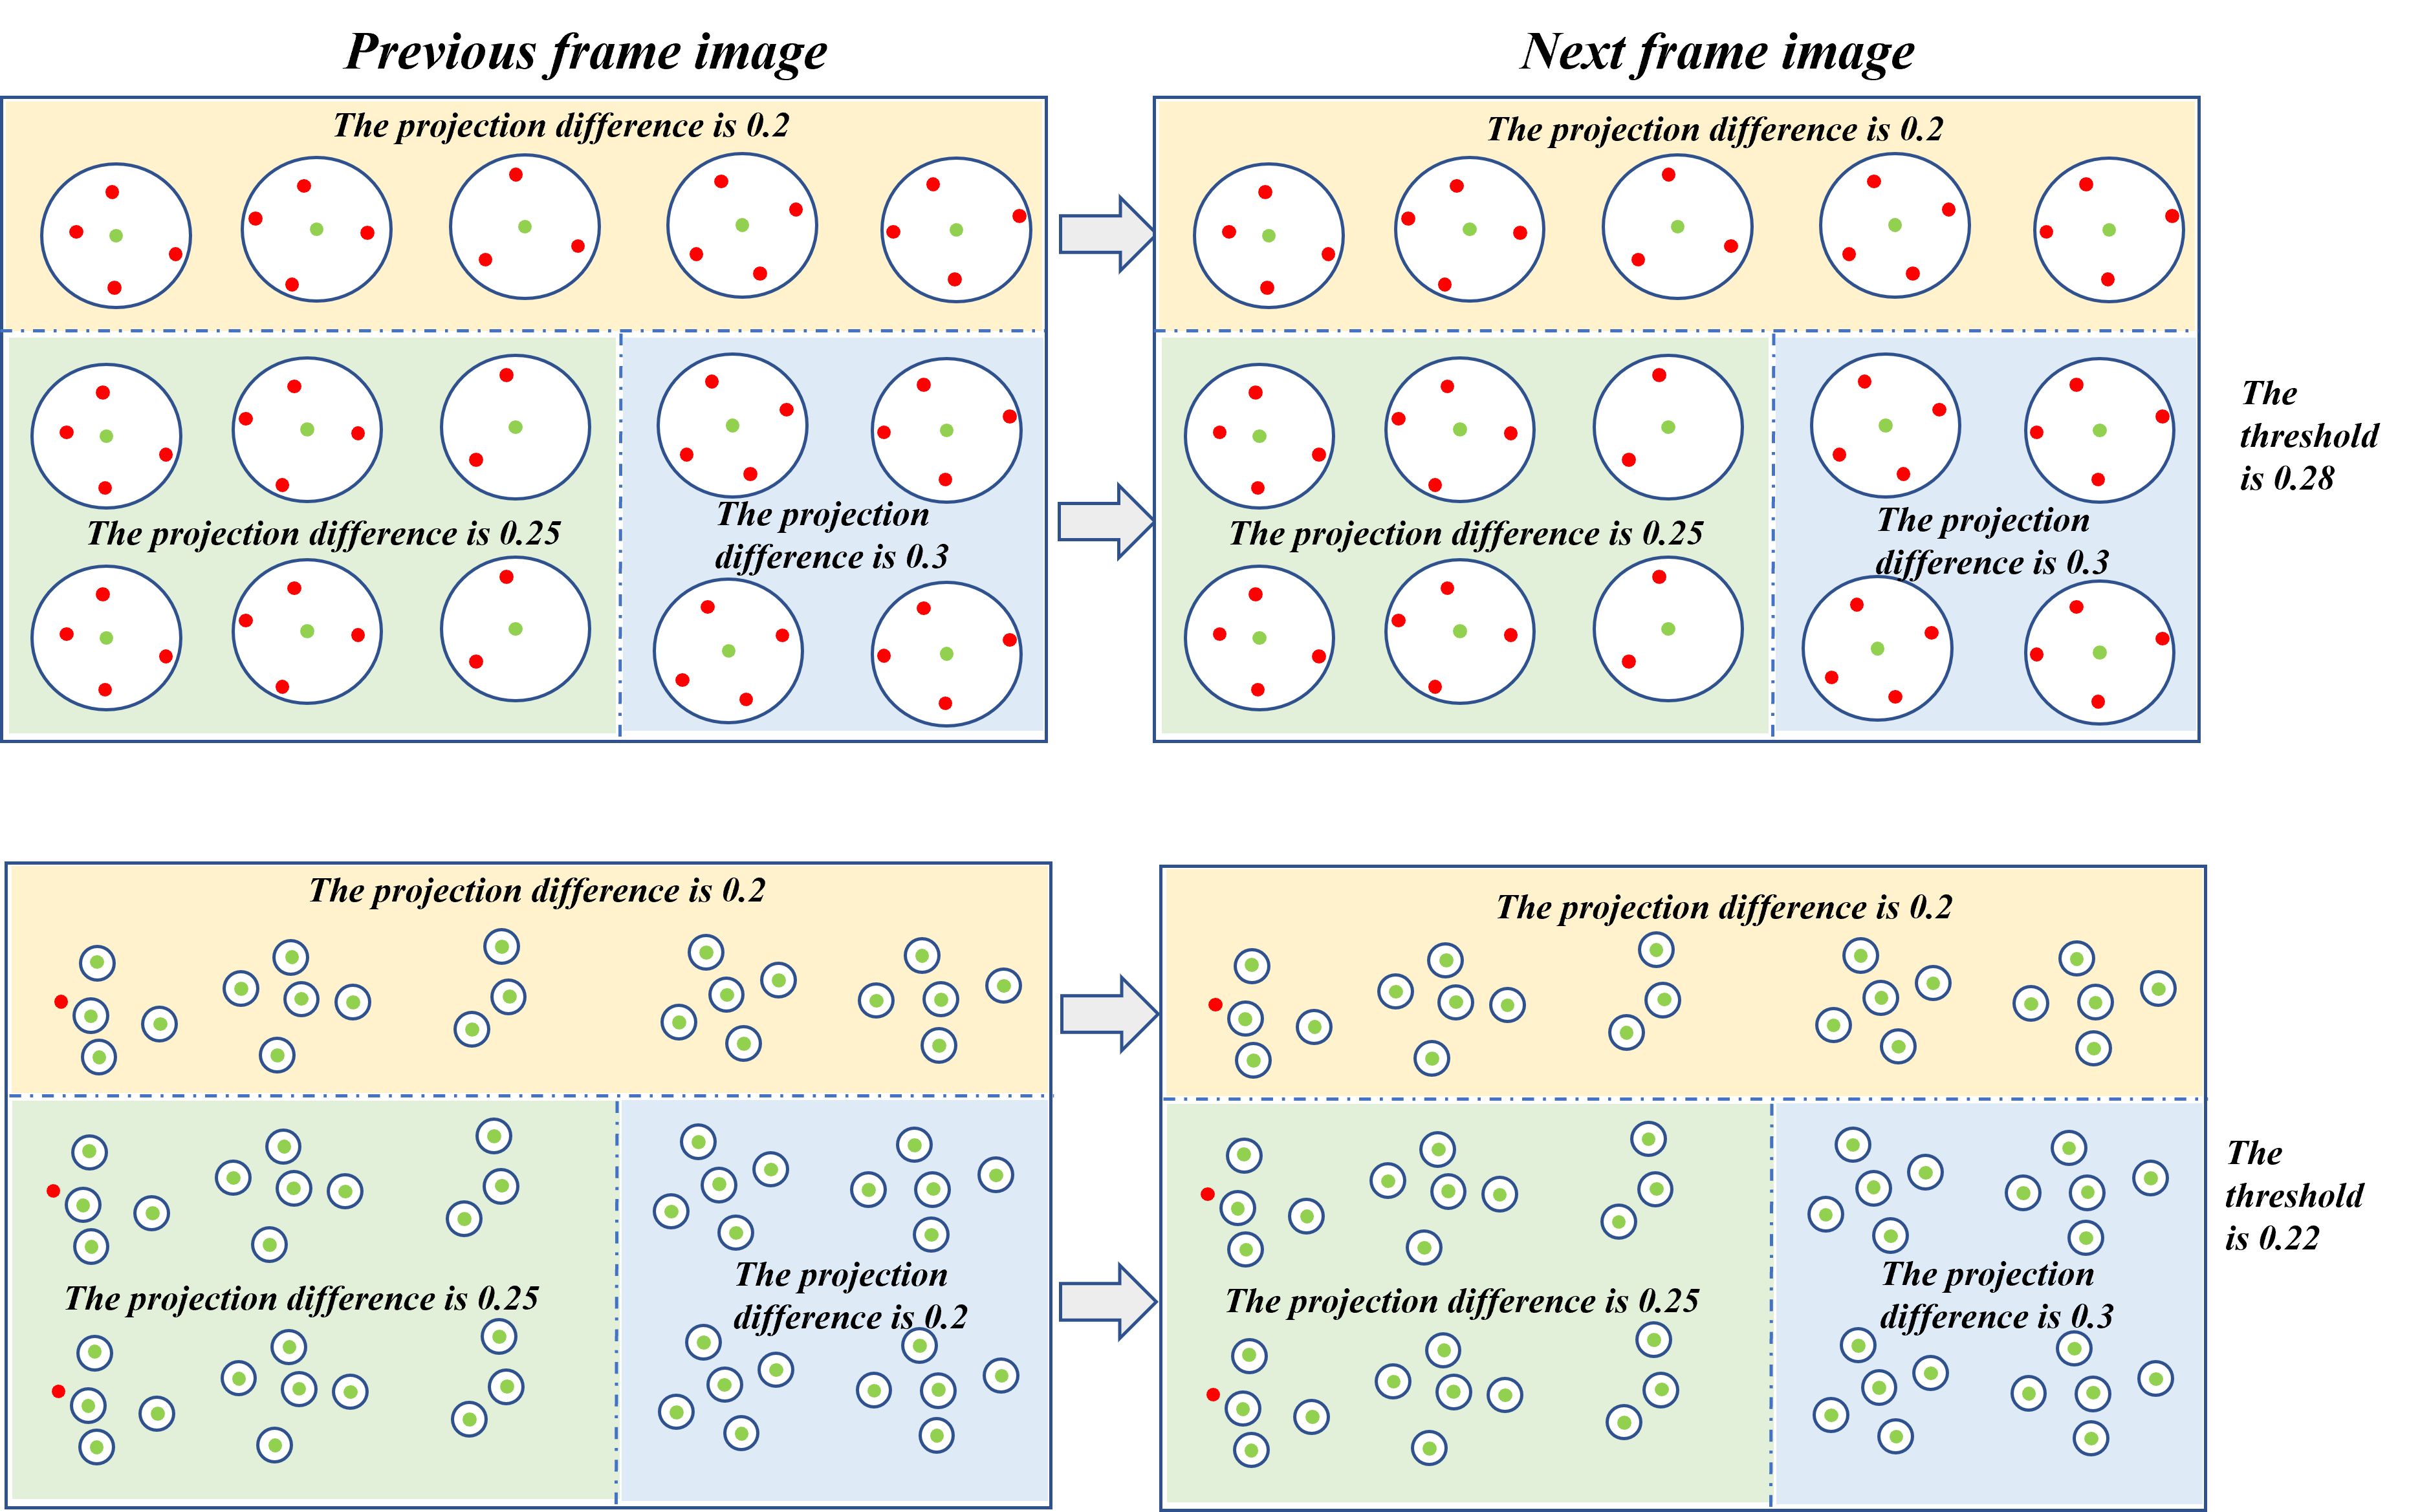
Reducing the exclusion-mask radius admits a denser set of candidate features. A stricter RANSAC inlier threshold then rejects matches with larger reprojection error. Four point pairs estimate a homography; repeated sampling seeks a sufficiently large, consistent correspondence set. Mask radius and threshold must be tuned together, and a homography is a restricted scene-motion model.
The original equations are retained below. Equation 3 contains coefficients inconsistent with Equation 2, and the inequality in Equation 4 conflicts with the stated minimum-spacing intent. These are presentation inconsistencies in the source, not corrected derivations.
Equations 1–5
| (1) |
| (2) | ||||
| (3) |
| (4) |
| (5) |
4.3 Loop Closure Detection with Deep Learning
A hierarchical bag of visual words supports retrieval of previously visited places. The system trains a vocabulary from SuperPoint descriptors and uses DBoW3 to encode and compare frames, followed by pose-graph optimization for detected loops. Vocabulary training can be tailored to the deployment environment.
5 Experiments
Experiments use EuRoC with monocular images and inertial data on Ubuntu 18.04, ROS Melodic, and an RTX 2060, with CUDA, cuDNN, and ONNX Runtime for inference. The retrieval vocabulary is trained on a mixture containing EuRoC, TUM, and KITTI; this is not a demonstration of wholly unseen-dataset vocabulary transfer.
5.1 Accuracy Testing of SuperVINS
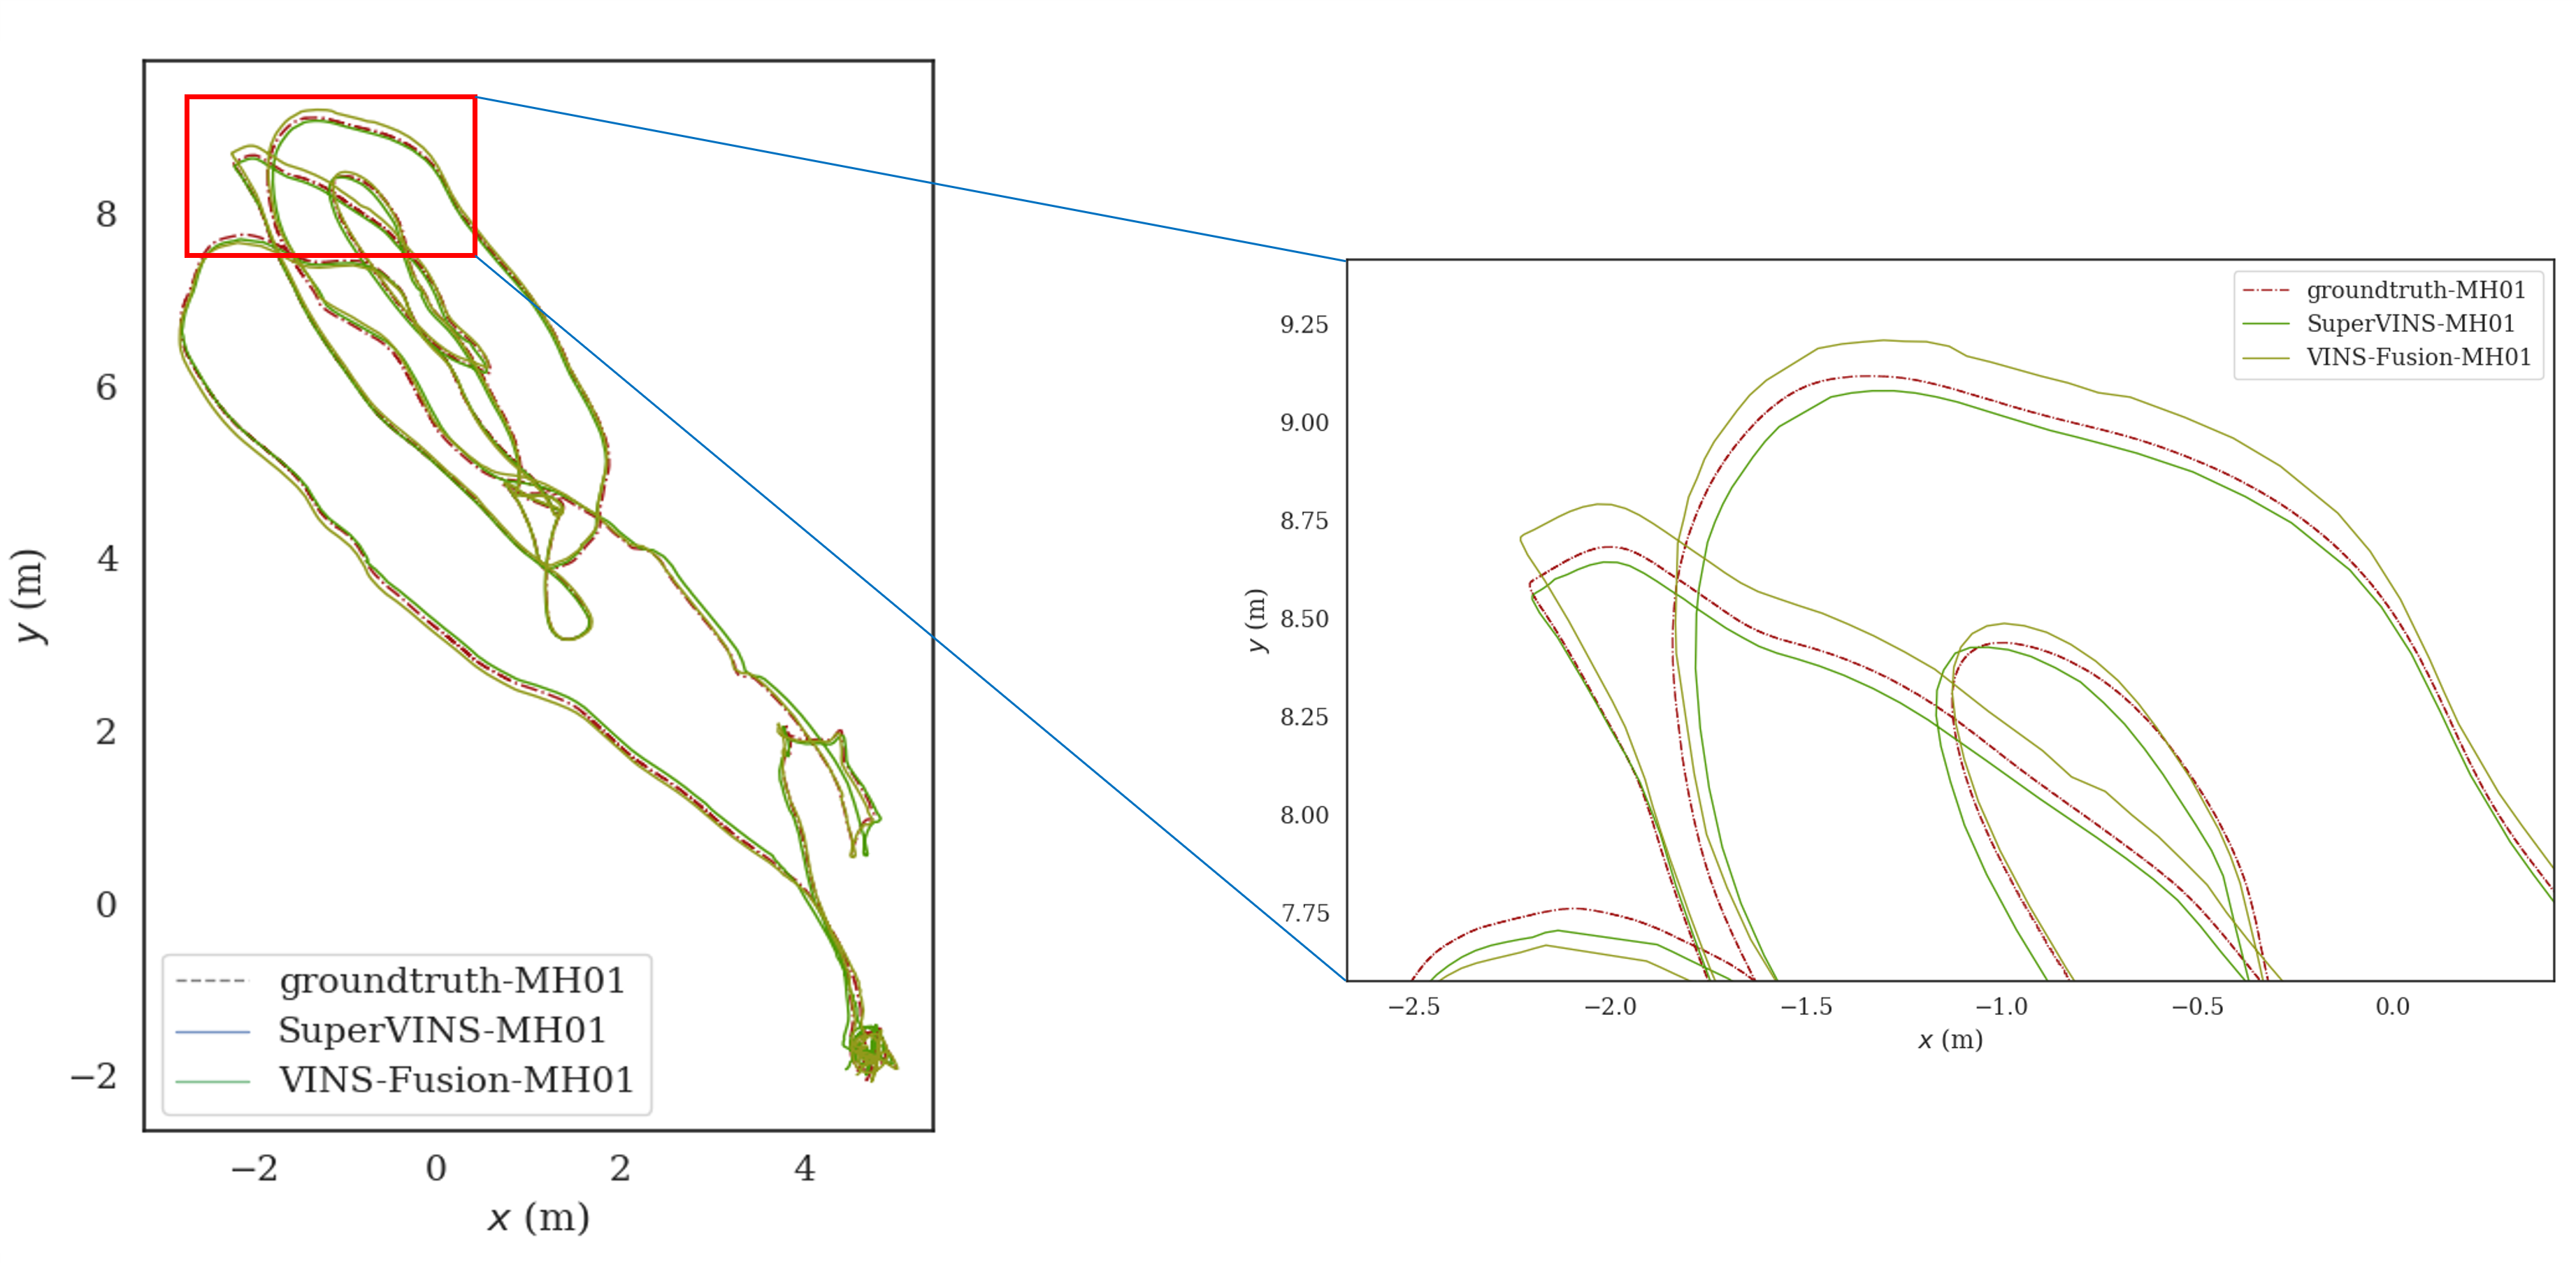
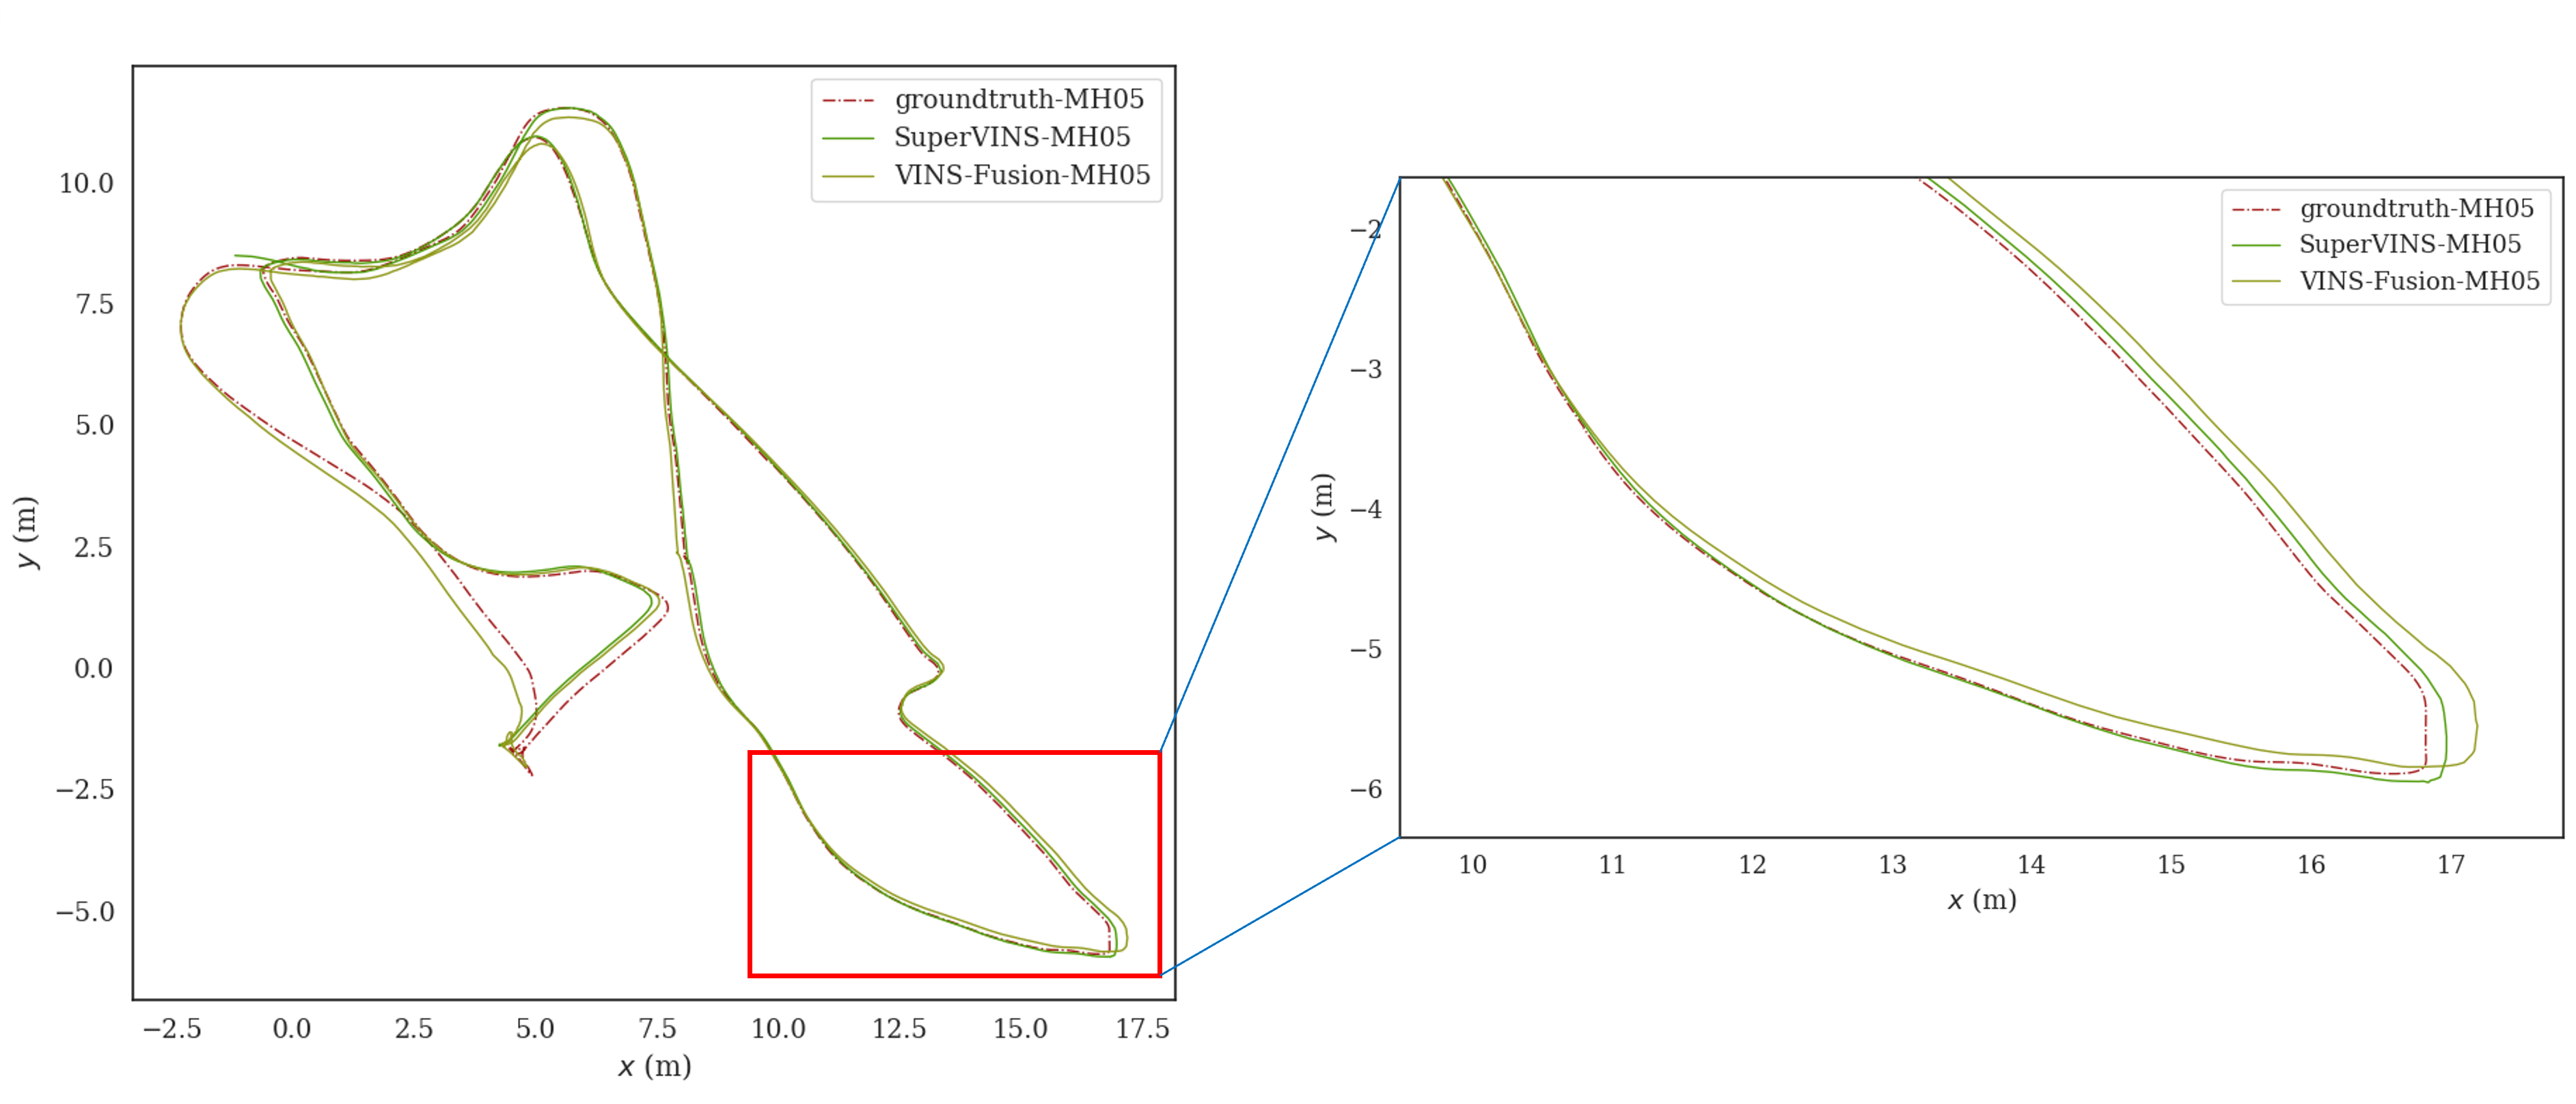
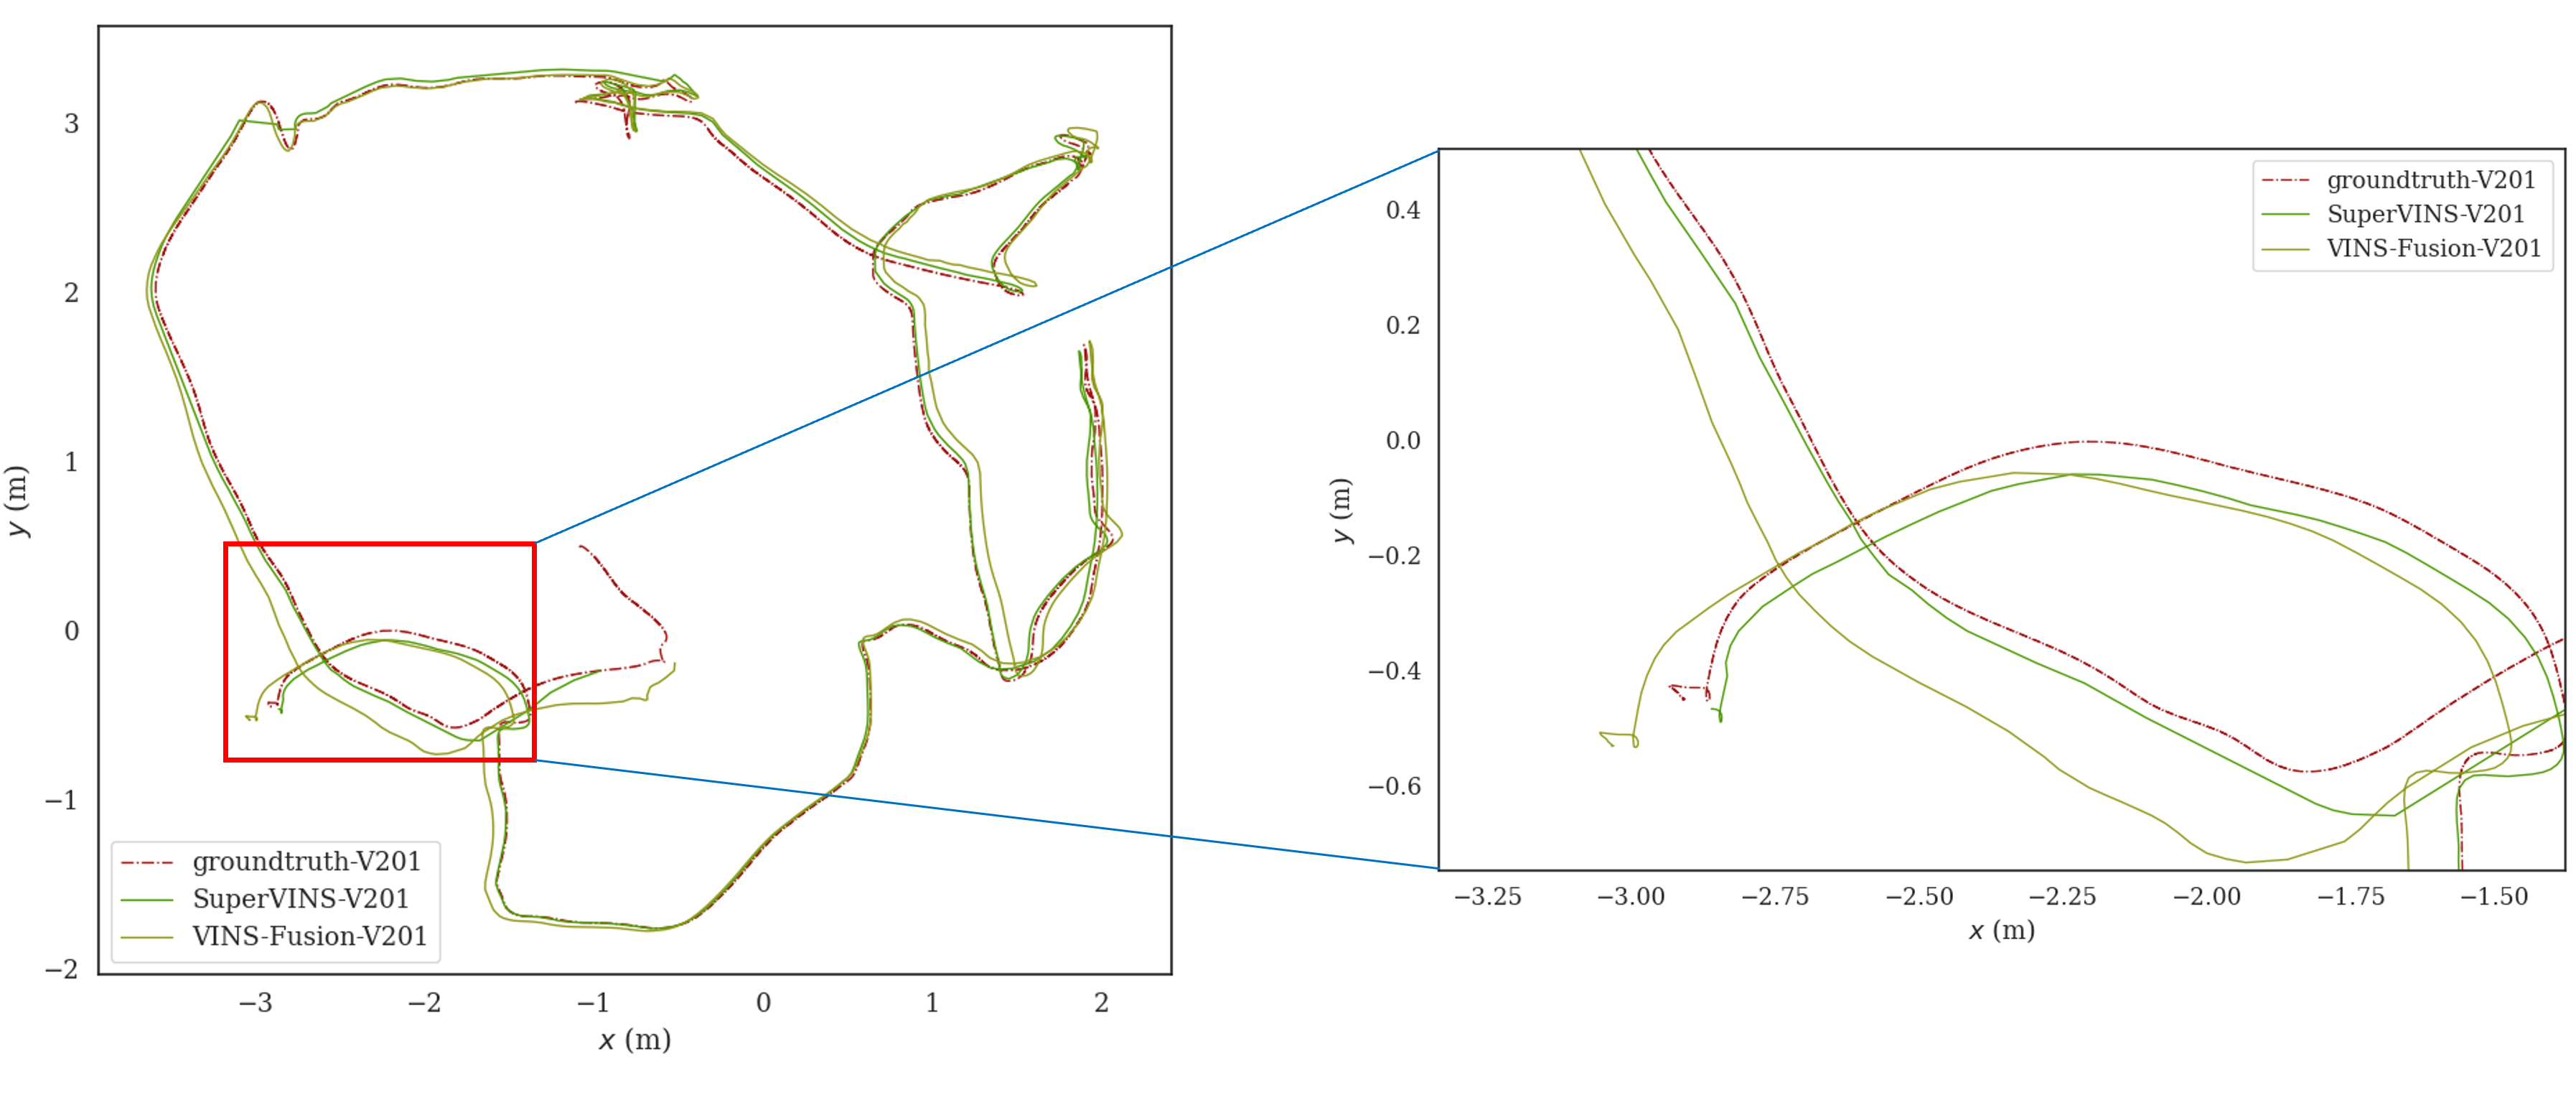
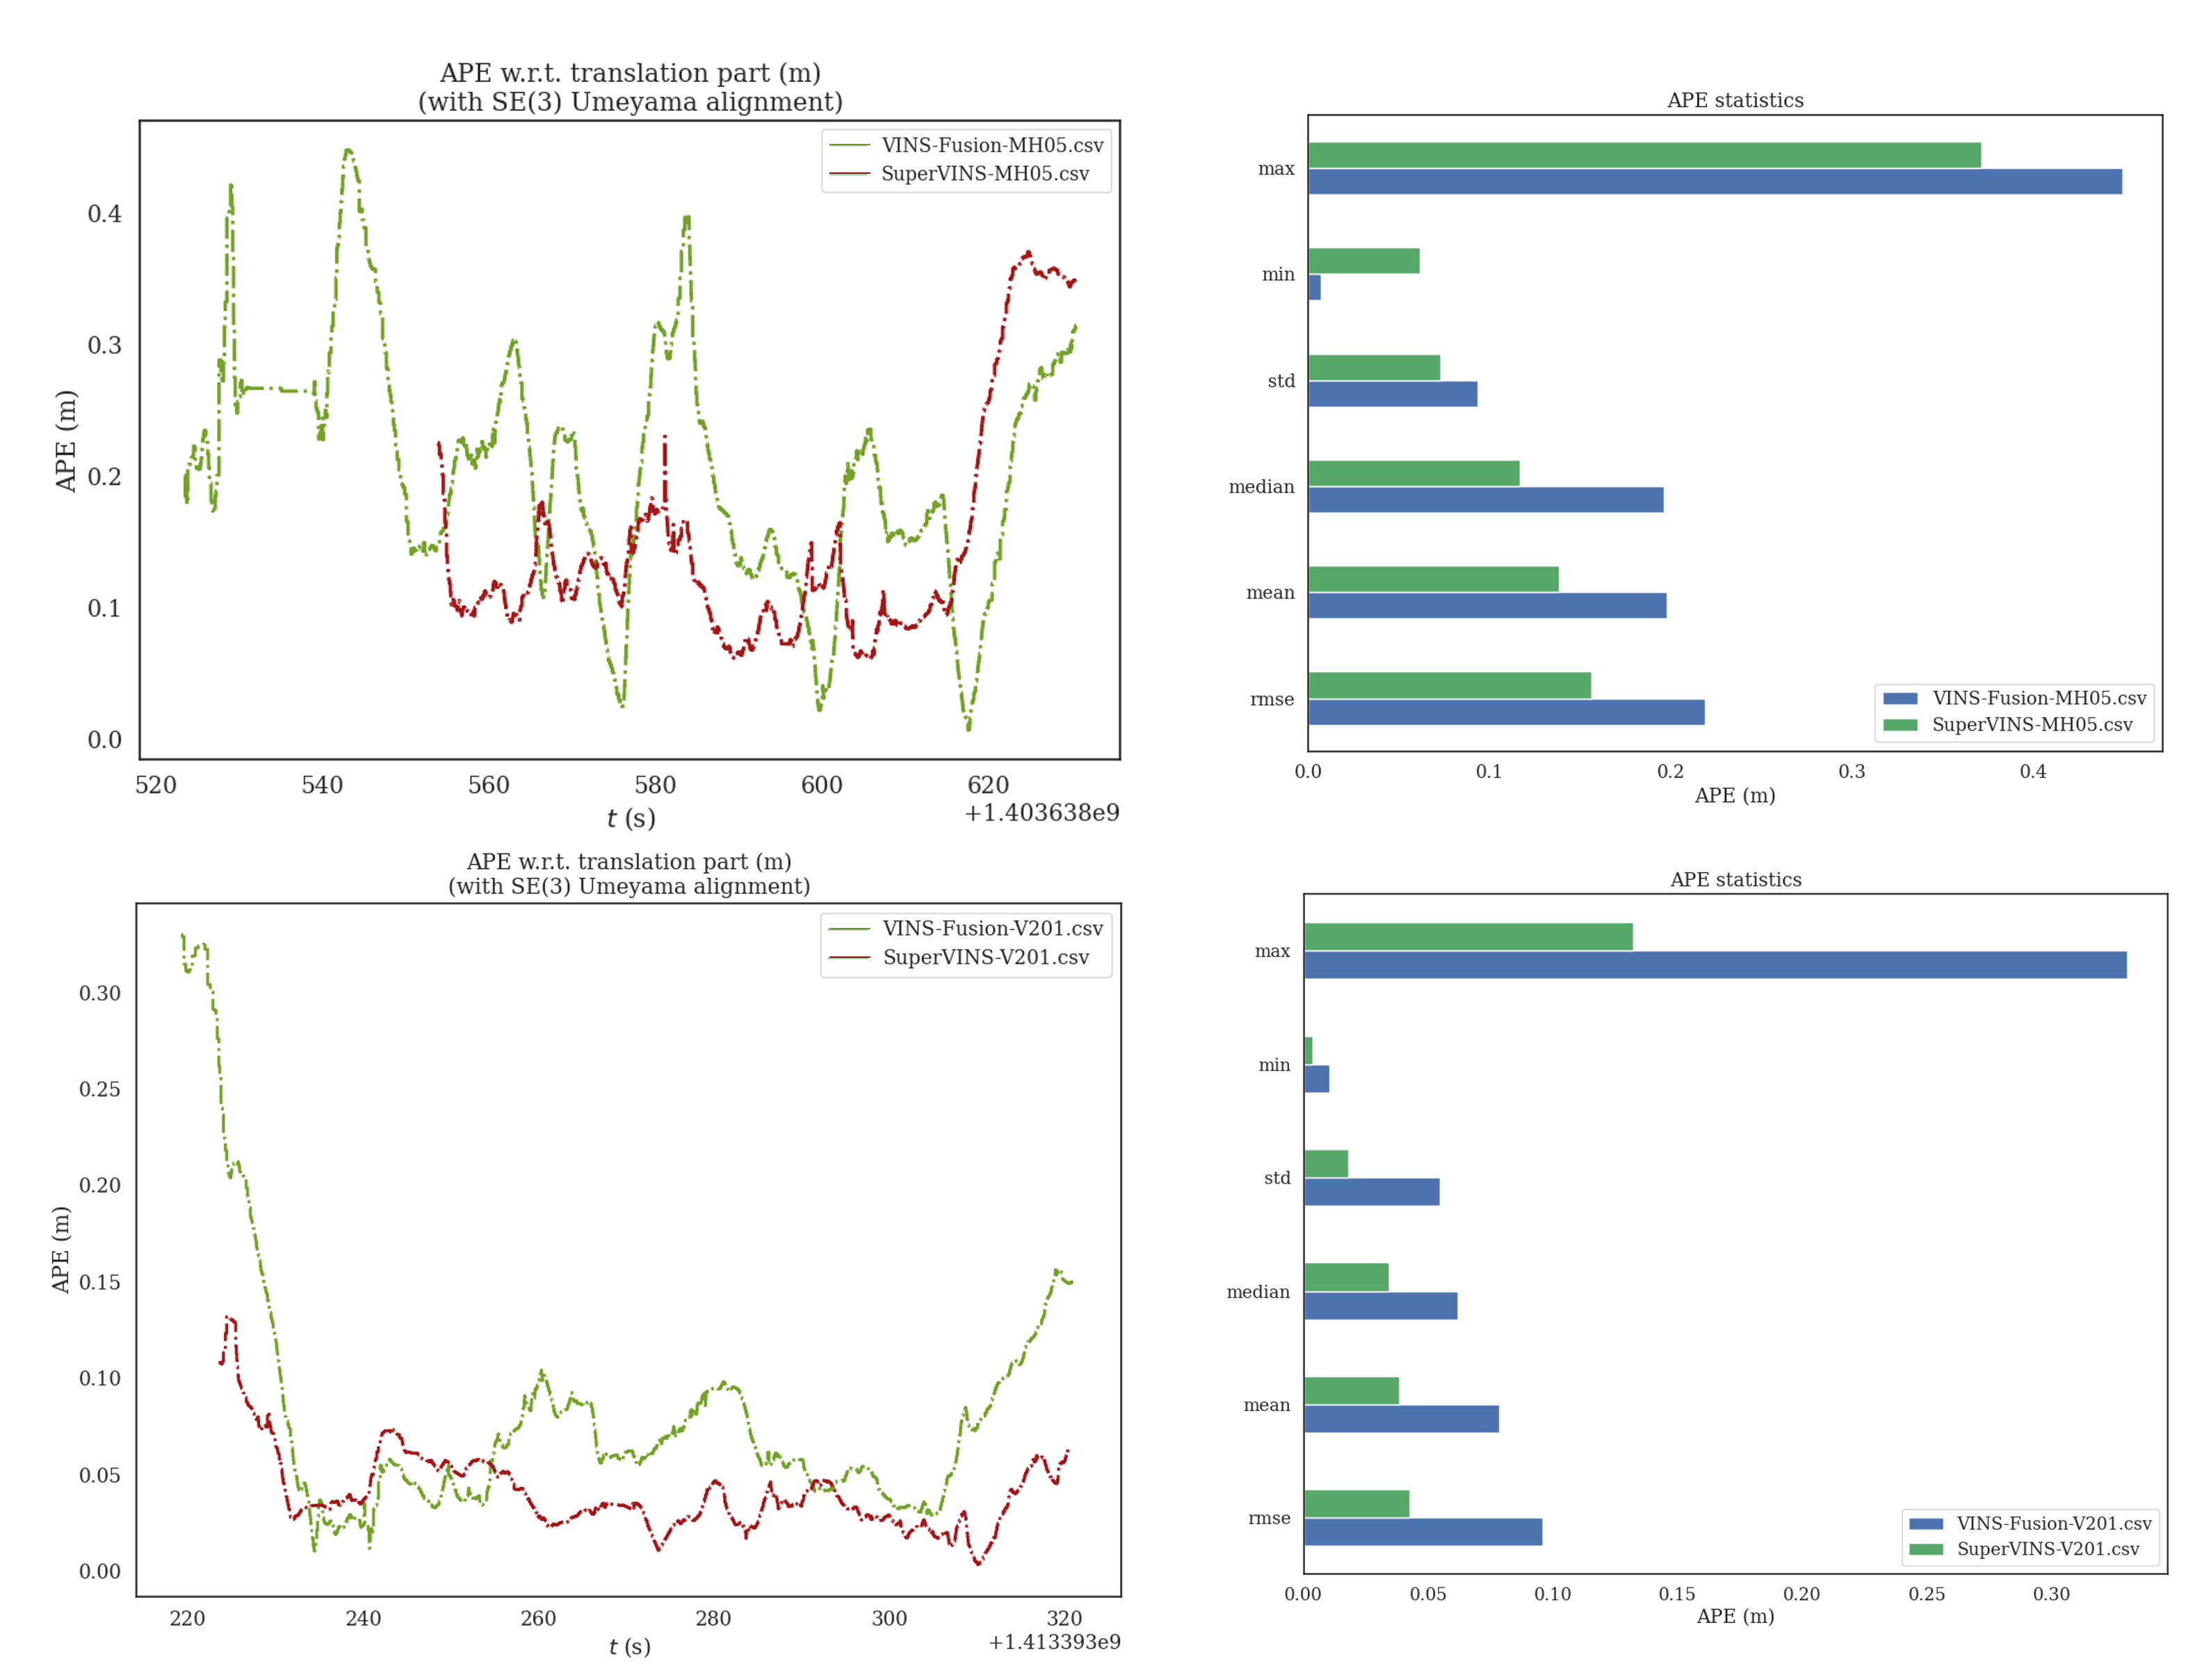
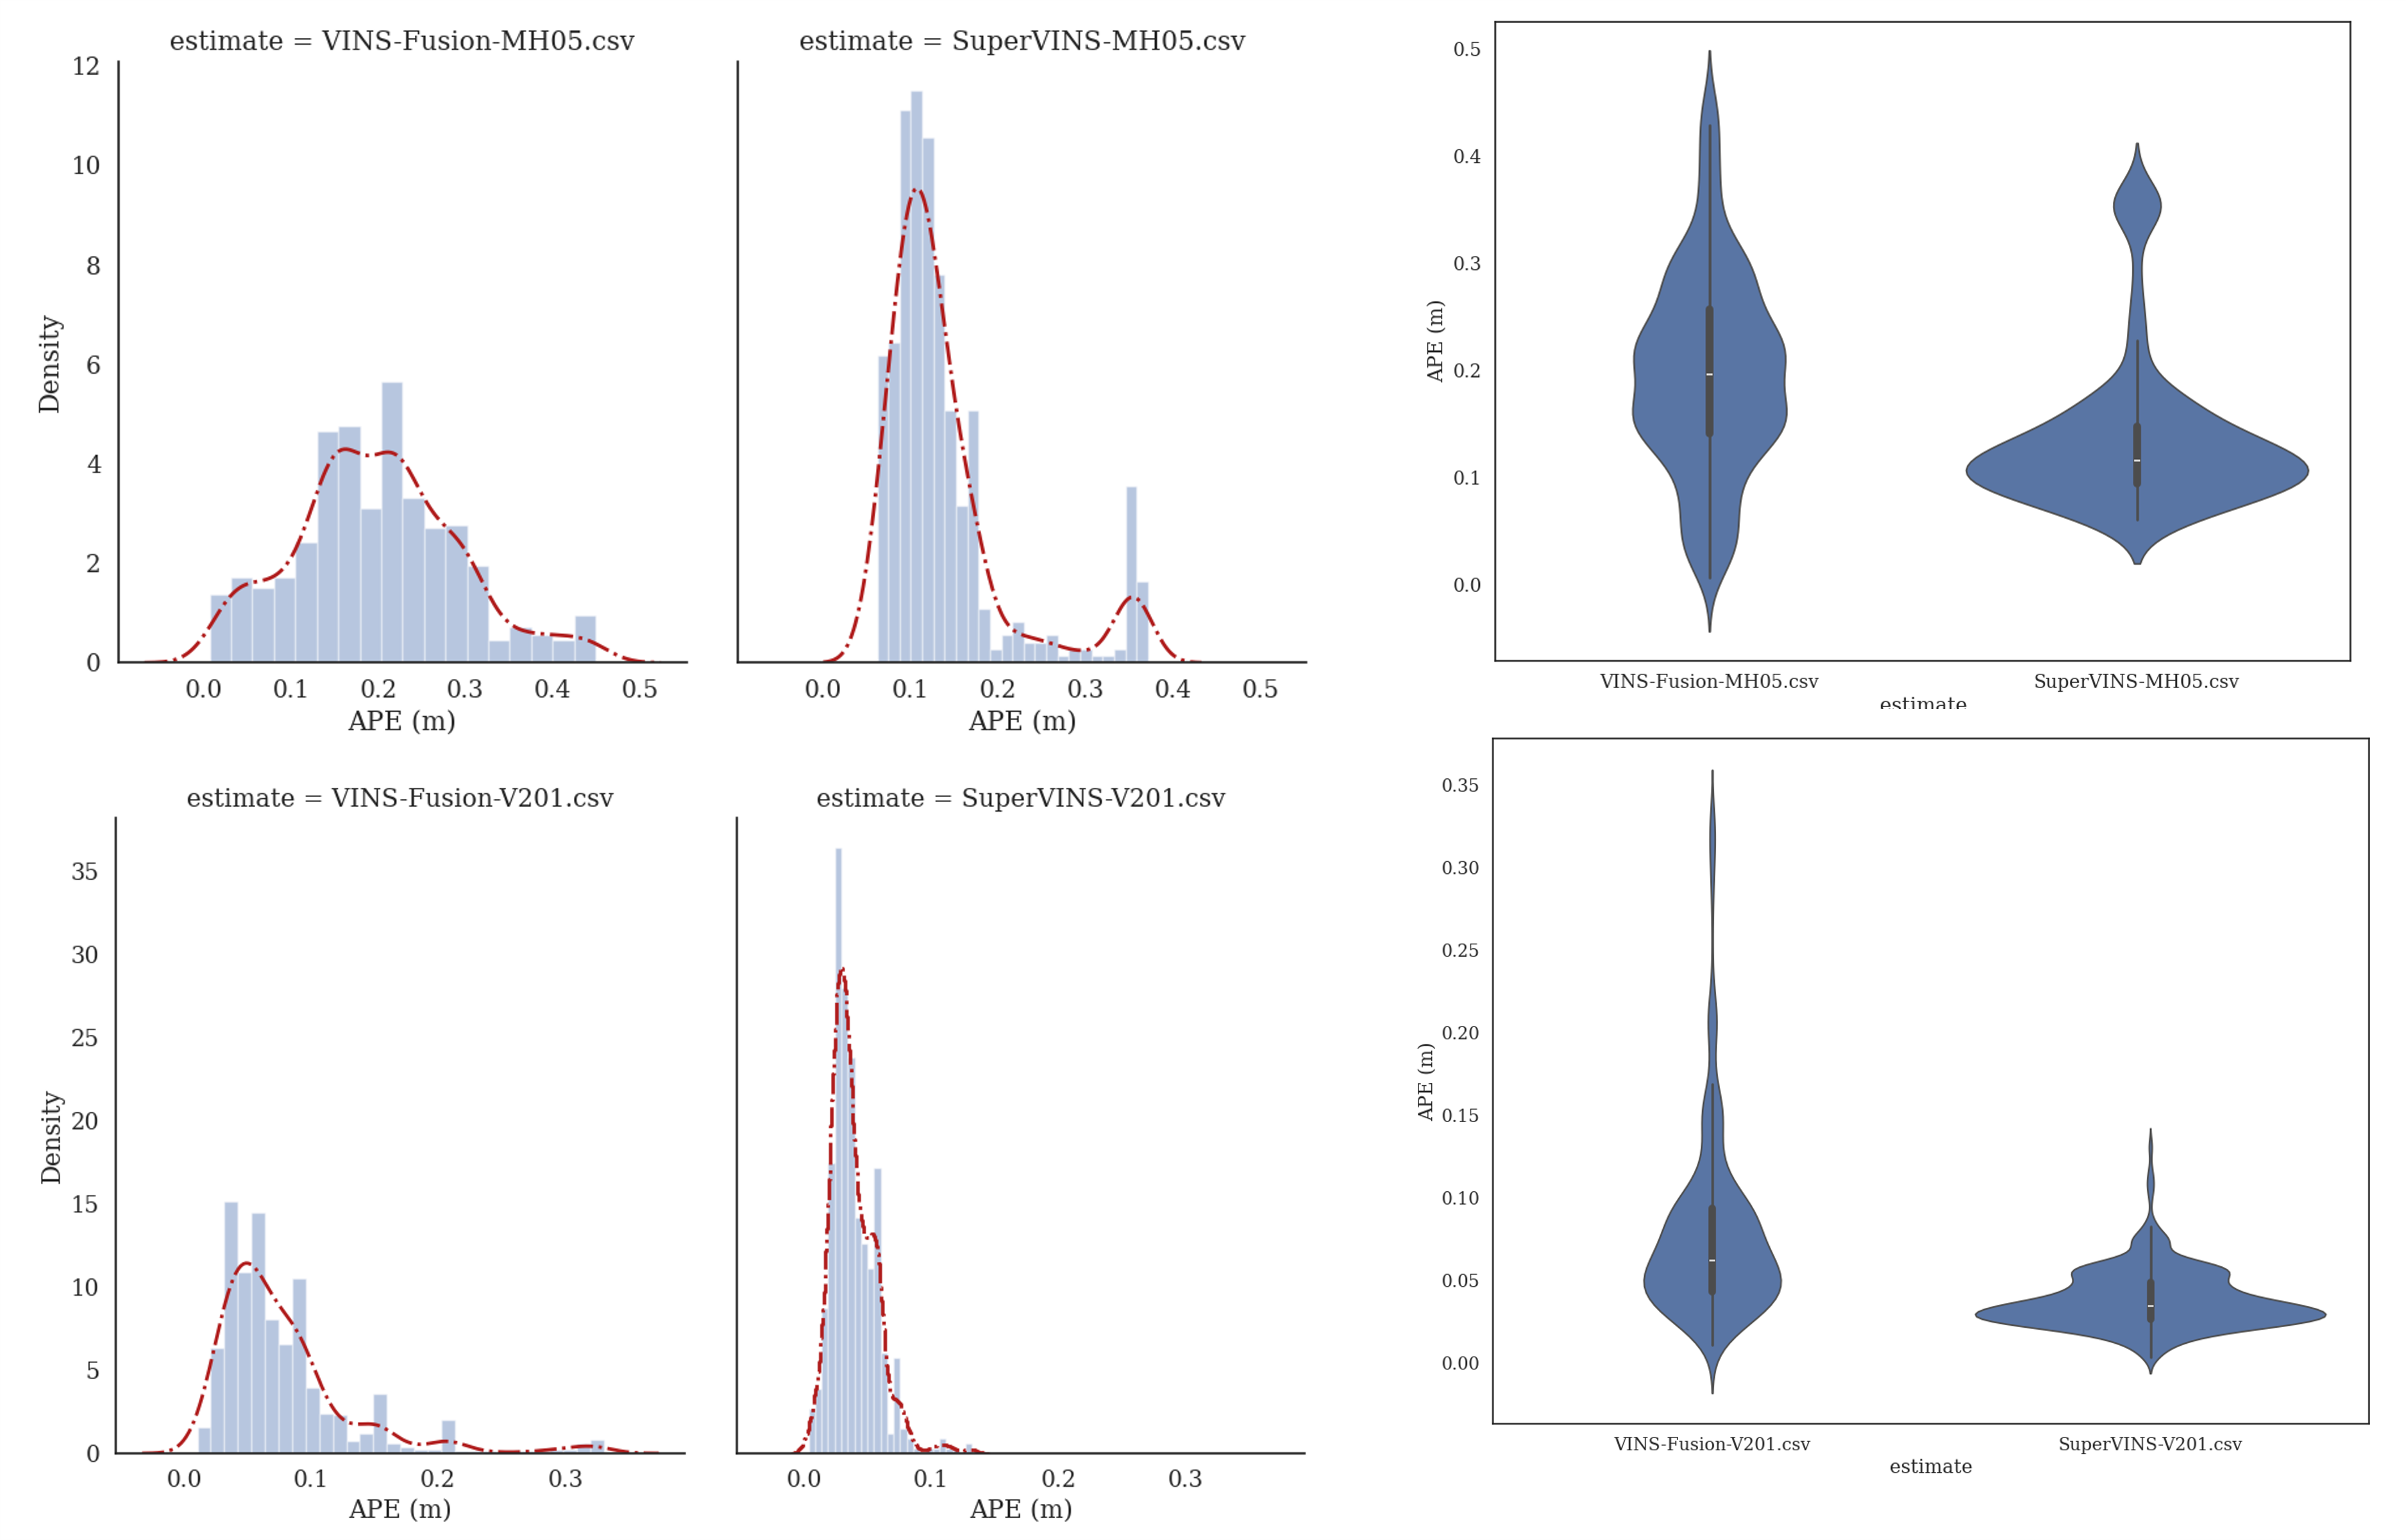
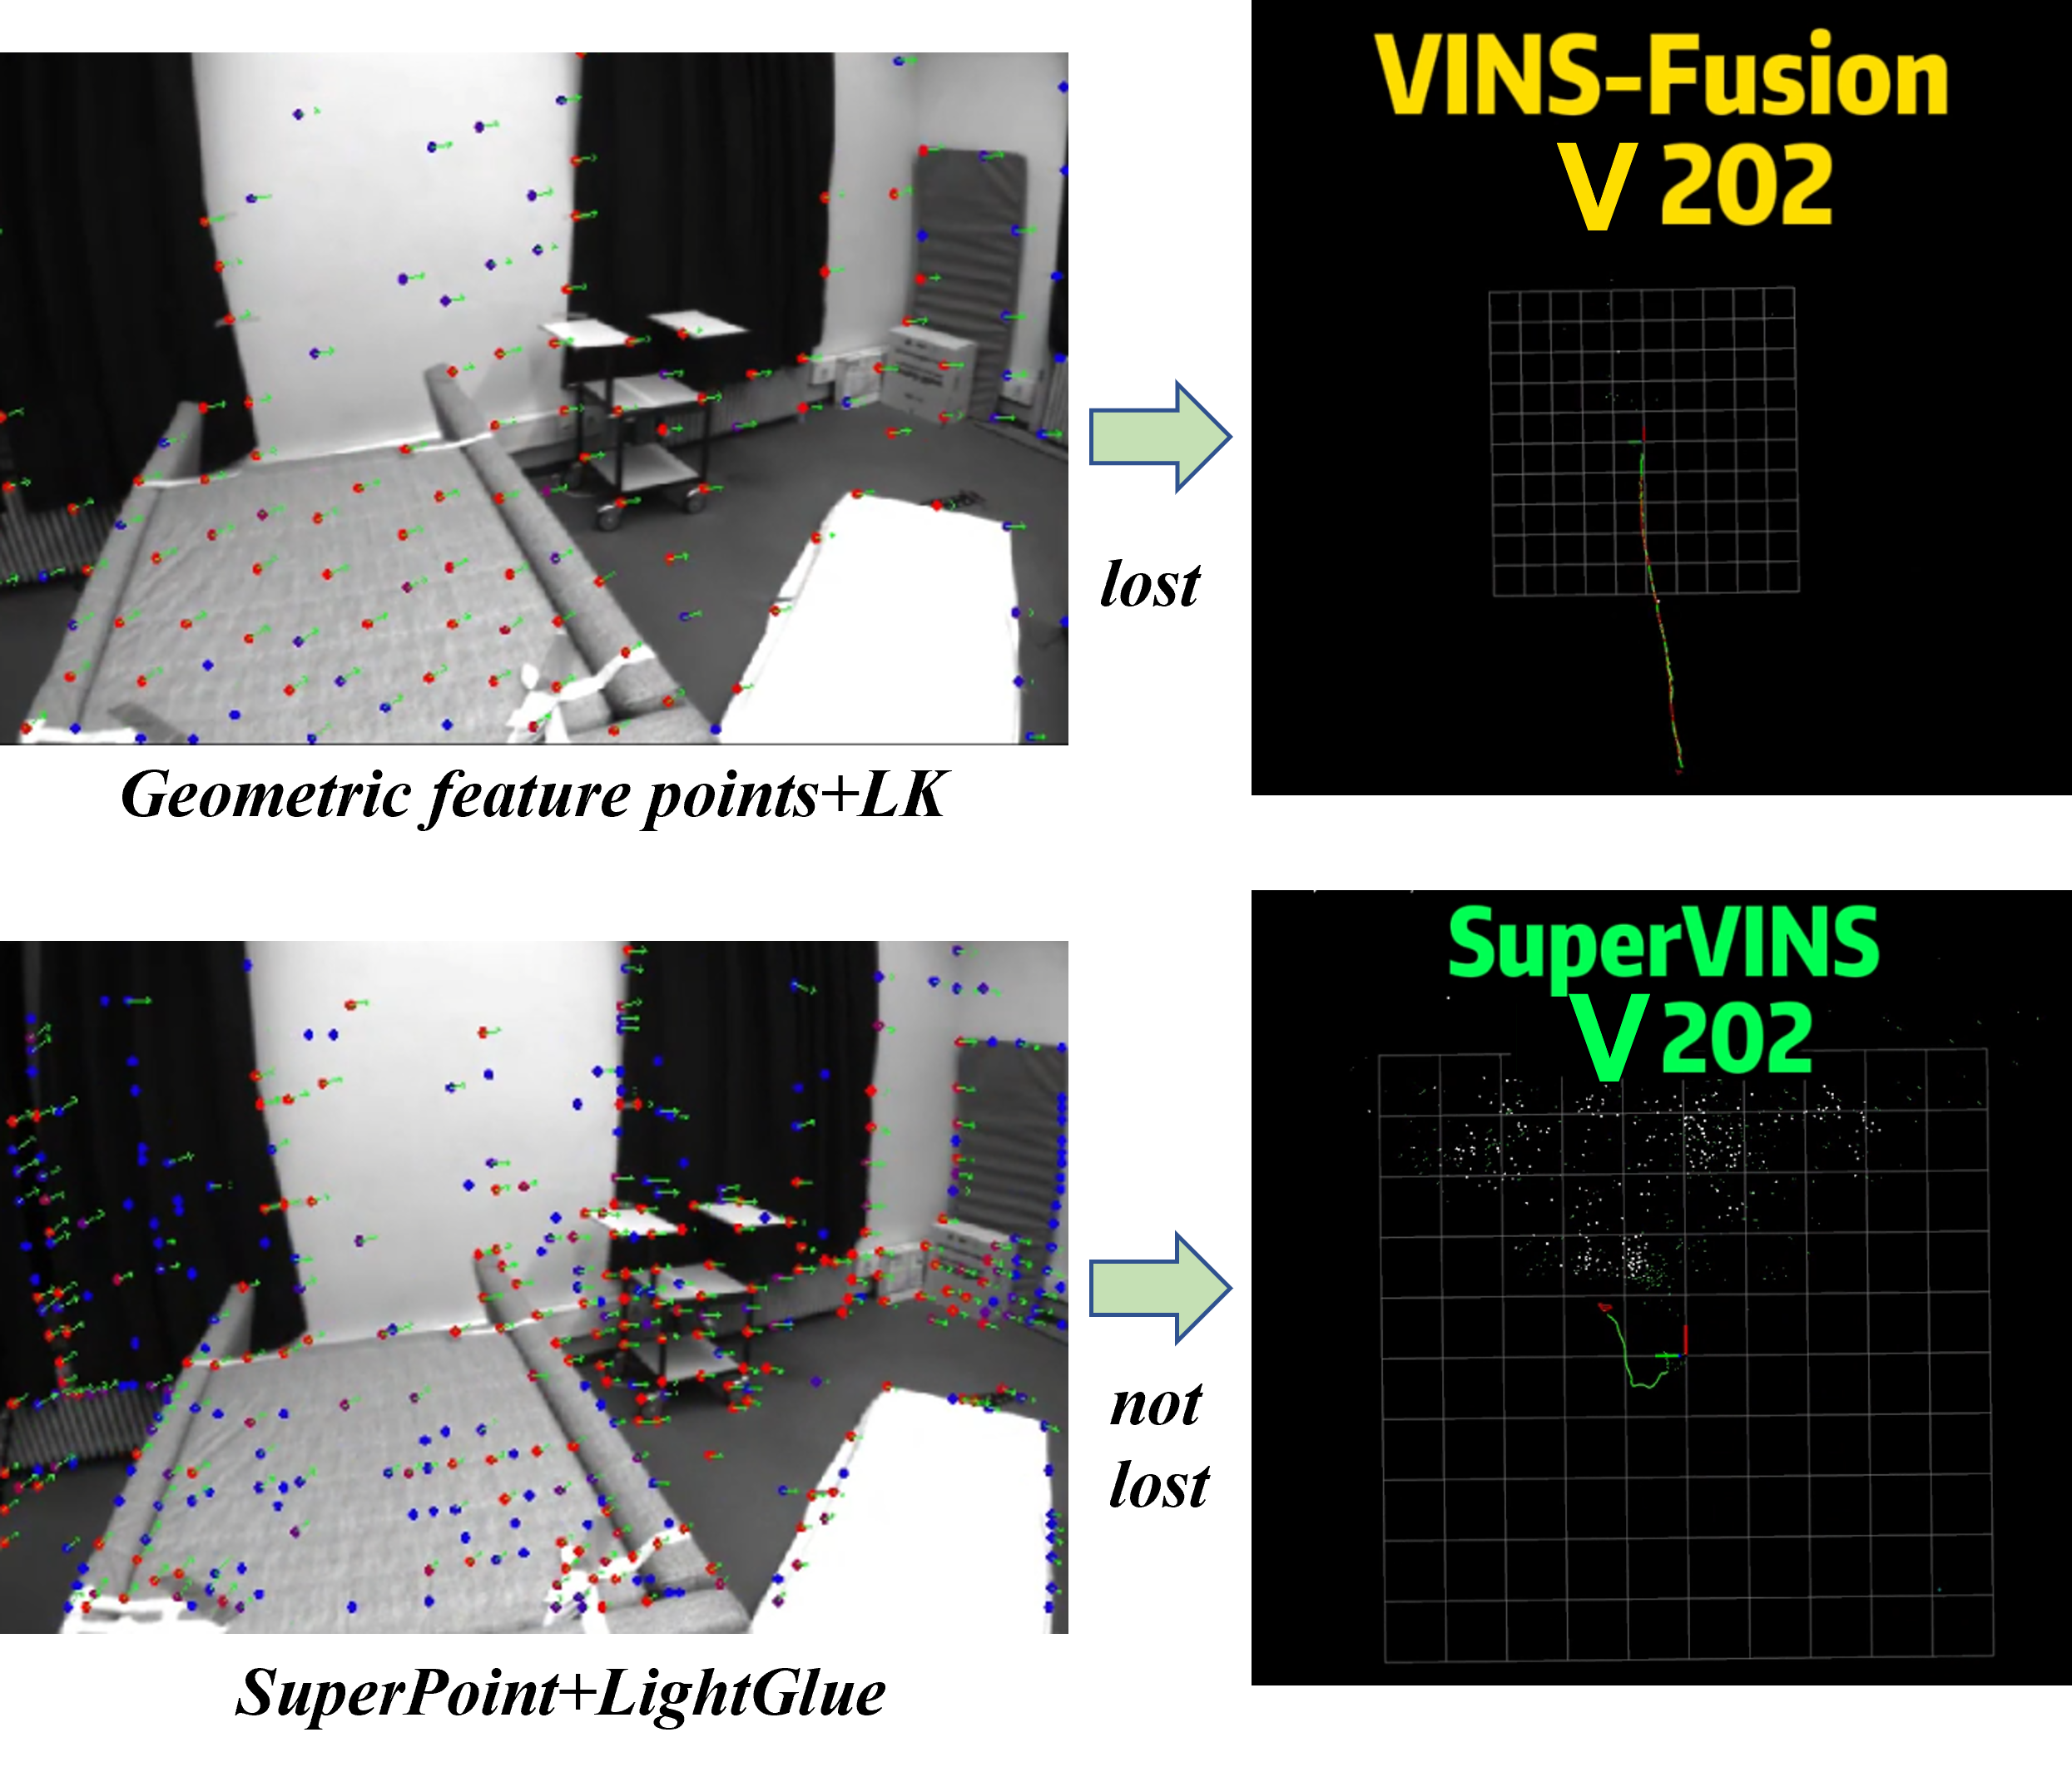
Against VINS-Fusion with loop closure, SuperVINS reduces ATE on five of the ten sequences where both return trajectories. It also completes V202, where VINS-Fusion fails; the tables encode that failure as zero, which must not be interpreted as perfect accuracy. On MH05, ATE falls from 0.262125 to 0.158304 m; on V203, from 0.192608 to 0.168746 m, corresponding to the reported 39.6% and 12.3% reductions.
Results are mixed: MH02 and MH03 errors roughly double, and relative translation or rotation error sometimes worsens even when ATE improves. The claim of advantages on six sequences includes successful tracking of V202 and does not mean SuperVINS beats every comparator in Table 2. No repeated-run uncertainty or isolated component ablation is reported.
| VINS-Fusion | SuperVINS | |||||
| dataset | ATE | RPEr | RPEt | ATE | RPEr | RPEt |
| MH01 | 0.091079 | 0.001536 | 0.006640 | 0.086656 | 0.002031 | 0.006729 |
| MH02 | 0.045720 | 0.001264 | 0.005192 | 0.096954 | 0.002177 | 0.004465 |
| MH03 | 0.091861 | 0.005200 | 0.009599 | 0.180578 | 0.001697 | 0.00818 |
| MH04 | 0.130696 | 0.002976 | 0.009822 | 0.170761 | 0.00199 | 0.009613 |
| MH05 | 0.262125 | 0.003364 | 0.013499 | 0.158304 | 0.003786 | 0.009489 |
| V101 | 0.153585 | 0.004278 | 0.007410 | 0.201021 | 0.002061 | 0.007983 |
| V102 | 0.219169 | 0.004236 | 0.008229 | 0.11599 | 0.002722 | 0.020395 |
| V103 | 0.169991 | 0.004300 | 0.007352 | 0.22141 | 0.021587 | 0.030906 |
| V201 | 0.123334 | 0.002993 | 0.004906 | 0.061106 | 0.004127 | 0.004992 |
| V202 | 0.000000 | 0.000000 | 0.000000 | 0.100303 | 0.00594 | 0.0085 |
| V203 | 0.192608 | 0.008283 | 0.013867 | 0.168746 | 0.017337 | 0.028083 |
| dataset | OKVIS | VINS-Mono-Noloop | VINS-Mono-loop | VINS-Fusion-Noloop | VINS-Fusion-loop | SuperVINS |
| MH01 | 0.3300 | 0.1556 | 0.0868 | 0.1377 | 0.0911 | 0.0867 |
| MH02 | 0.3700 | 0.1780 | 0.1083 | 0.1002 | 0.0457 | 0.0970 |
| MH03 | 0.2500 | 0.1950 | 0.0658 | 0.1203 | 0.0919 | 0.1806 |
| MH04 | 0.2700 | 0.3470 | 0.2047 | 0.2836 | 0.1307 | 0.1708 |
| MH05 | 0.3900 | 0.3020 | 0.1421 | 0.1587 | 0.2621 | 0.1583 |
| V101 | 0.0940 | 0.0889 | 0.0484 | 0.1569 | 0.1536 | 0.2010 |
| V102 | 0.1400 | 0.1105 | 0.0631 | 0.1222 | 0.2192 | 0.1160 |
| V103 | 0.2100 | 0.1875 | 0.2012 | 0.1287 | 0.1700 | 0.2214 |
| V201 | 0.0900 | 0.0863 | 0.0672 | 0.1207 | 0.1233 | 0.0611 |
| V202 | 0.1700 | 0.1580 | 0.1588 | 0.0000 | 0.0000 | 0.1003 |
| V203 | 0.2300 | 0.2775 | 0.2475 | 0.2881 | 0.1926 | 0.1687 |
5.2 Real-time and Robustness Testing of SuperVINS
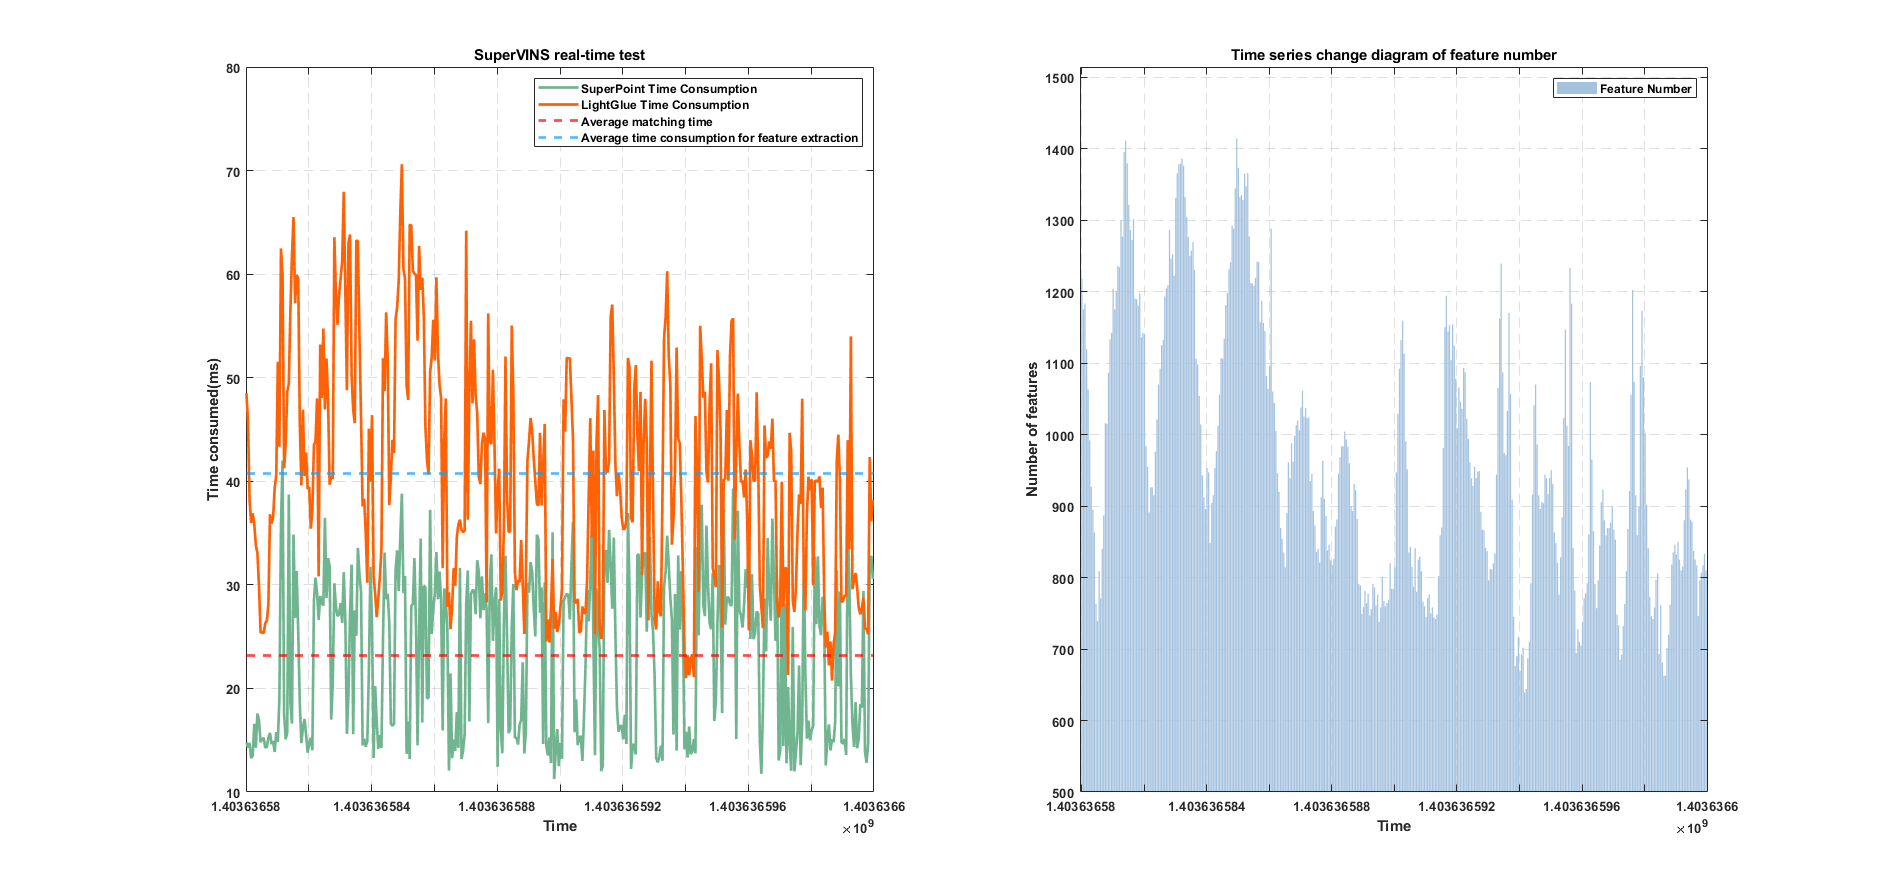
Over approximately twenty seconds of MH01, feature extraction runs at 43 frames/s and matching at 24.5 frames/s, with about 965 features per frame. These are module-level measurements on the reported GPU, not a complete latency distribution. A qualitative V202 example shows continued SuperVINS tracking after VINS-Fusion loses localization.
6 Conclusion
Learned correspondences can improve a conventional visual-inertial estimator under some difficult imaging conditions, but performance depends on scene, tuning, and compute. The authors identify environment-adaptive thresholds and lighter point–line features as future work. The presented evidence comes from one benchmark collection.