At a glance
The paper fits separate feature-based costs for interacting pedestrians using multi-agent maximum-entropy inverse reinforcement learning. A dynamic-game solver generates trajectories, and a heuristic covariance adjustment makes the approximate policy computation usable when the adopted motion model causes numerical problems. Evaluation compares trajectory errors on public datasets and Speedway, a small campus-intersection dataset assembled into three-agent combinations. Results favor the method on Speedway among the tested baselines, but do not demonstrate safe closed-loop robot navigation or identify pedestrians’ true psychological rewards.
I Introduction
Dense crowds require predicting how people react to one another, not only extrapolating each person independently. The proposed approach allows different people to weight goal progress, separation, and control effort differently. It extends single-agent maximum-entropy IRL [26] through an approximate dynamic-game policy.
The contribution is a practical regularization heuristic for policy computation under simplified unknown dynamics. Its behavioral interpretation and accuracy tradeoff remain incompletely characterized; the experiments establish prediction errors under the chosen representation and datasets rather than a general tractability theorem for arbitrary crowds.
II Related Work
The related work separates explicit reward inference from direct trajectory forecasting, intent-aware multi-agent policies, and opponent modeling. These approaches differ in representation and assumptions; using an explicit reward function does not by itself make an inferred intent uniquely identifiable.
II-A Inverse Reinforcement Learning
Inverse reinforcement learning seeks costs that explain demonstrations, but many costs can explain the same behavior. Maximum-entropy formulations select stochastic behavior consistent with feature constraints. The paper builds on multi-agent maximum-entropy game models [36] and their policy computations.
The source describes maximum entropy as guaranteeing unique reward recovery. That is stronger than what this evaluation establishes: selecting a maximum-entropy trajectory distribution does not independently verify a unique human reward function. The edition treats learned costs as model-dependent explanations.
II-B Trajectory Prediction
Neural forecasting methods use social context, goal hypotheses, trajectory samples, and attention to predict future motion. They provide the principal empirical baselines. Their implicit representation of intent differs from explicit learned feature weights, but prediction accuracy must still be judged under comparable data and evaluation protocols.
II-C Intent-aware Multi-agent Reinforcement Learning
Intent-aware reinforcement learning and theory-of-mind models estimate other agents’ objectives or hidden states to improve decisions. This work focuses on feature-based reward inference from trajectories rather than learned communication or richer social-context representations.
II-D Opponent Modeling
Opponent modeling estimates or embeds other policies and may account for how one agent changes another’s behavior. Repeated interaction with a fixed group is a common simplifying assumption. The proposed pedestrian model instead estimates costs for the agents in the observed interaction, while still relying on specified dynamics and cost features.
III Background and Problem Formulation
A finite-horizon general-sum game contains continuous agent states and controls, transition models, separate running costs, and decentralized stochastic policies. Demonstrations provide trajectories for every agent in an interaction. Costs depend on the joint state and control, with features such as distance to goal, interpersonal distance, and control effort. The evaluation therefore assumes tracked trajectories and a chosen feature representation rather than inferring all relevant social variables from raw perception.
III-A Background: MaxEnt IRL
Maximum-entropy IRL adjusts cost parameters until trajectories generated by the current policy match demonstration feature statistics, while maintaining stochastic policies. The original probability expression is retained; it uses a positive exponent while the surrounding text calls the optimized quantity a cost, leaving a reward/cost sign-convention inconsistency. No sign has been silently changed in the reproduced mathematics.
Equations 1
| (1) |
III-B Problem Formulation
The multi-agent objective matches each agent’s expected features to that agent’s demonstrations using its own parameters. Because policies respond to the other agents’ costs, these fitting problems are coupled. Terminal cost is omitted in the displayed formulation for notation.
Equation 2
| (2) |
IV Multi-agent MaxEnt IRL for Unstructued Pedestrian Crowds
Block coordinate descent updates one agent’s parameters at a time from feature discrepancies. After each update, a dynamic-game solver rolls out trajectories under the current joint cost model. In the linear-quadratic case, stochastic game policies can be computed through backward Riccati recursions.
For pedestrian data, the implementation adopts constant-velocity dynamics and a local quadratic approximation to state costs, with quadratic action dependence. Gaussian policy parameters depend on an inverse transformation of cost curvature. These approximations make numerical conditioning important and motivate the adjustment described below. The formulation does not establish global convergence for arbitrary nonlinear, unknown crowd dynamics.
Equations 3–15
| (3) |
| (4) |
| (14) |
| (15) |
Intractability of Equation ( 14 )
The paper attributes policy-computation difficulty to weak cost curvature under nearly linear pedestrian motion and the approximate dynamics. Small eigenvalues can make inversion unstable. Its prose also equates near-zero eigenvalues with a non-positive-semidefinite Hessian; small nonnegative eigenvalues alone do not imply indefiniteness. The practical issue is obtaining a usable inverse and a valid covariance, with the exact failure mode dependent on the approximation.
Tractability-Rationality Trade-off Trick
The heuristic adds a diagonal-dependent correction to the policy covariance. The source claims this restores positive semidefiniteness while reducing behavioral uncertainty, but does not specify a complete admissible class of correction functions or a bound on the resulting equilibrium change.
The stated uncertainty reduction is not automatic from the displayed additive formula: a positive diagonal addition increases the corresponding variances. The edition therefore describes the operation as heuristic covariance regularization, preserves the source equation, and does not promote its rationality interpretation to a proven property. Choosing the correction and quantifying its effect on behavior remain explicit open questions.
Equation 16
| (16) |
| Method | ETH | Hotel | Univ | Zara1 | Zara2 | Speedway | Average |
| Social-GAN [14] | - | ||||||
| SoPhie [15] | - | ||||||
| CGNS [68] | - | ||||||
| S-BiGAT* [16] | - | ||||||
| MATF [69] | - | ||||||
| Next* [70] | - | ||||||
| SR-LSTM [71] | - | ||||||
| STGAT [72] | - | ||||||
| GOAL-GAN* [73] | - | ||||||
| SGCN [74] | - | ||||||
| MANTRA [75] | - | ||||||
| Transformer [17] | - | ||||||
| SMEMO [18] | - | ||||||
| Introvert [76] | - | ||||||
| PCCSNet [19] | - | ||||||
| MaxEnt IRL [26] | / | / | / | / | / | ||
| PECNet [77] | |||||||
| SceneTransformer [20] | / | / | / | / | / | ||
| AgentFormer [21] | |||||||
| HST [22] | / | / | / | / | / | ||
| LB-EBM [78] | |||||||
| Trajectron++ [23] | |||||||
| Expert-Goals [24] | |||||||
| MAIRL | / | / | / | / | / | / |
V Evaluation
The experiments compare generated trajectories with recorded trajectories using displacement errors and an error-distribution plot. Public benchmarks test additional settings, while Speedway focuses on selected three-person crossings. No robot execution, collision-rate study, latency benchmark, or controlled ablation establishing the covariance correction’s causal accuracy effect is reported.
V-A Data Pre-processing
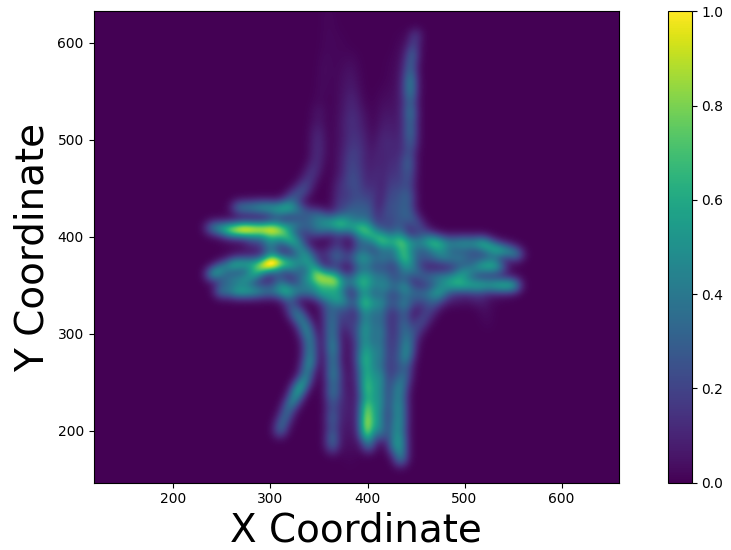
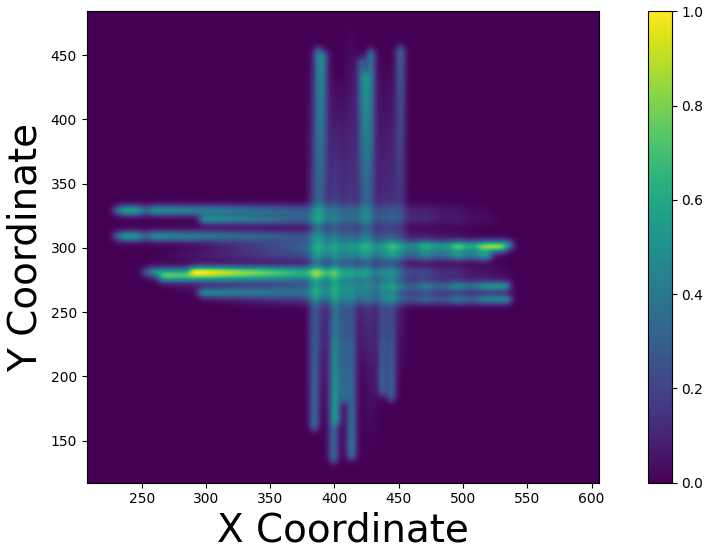
A fixed campus-intersection LiDAR supplies detections and persistent tracks. Preprocessing removes stationary and field-edge agents, clips the spatial range, and retains twenty pedestrian trajectories: five in each of four cardinal directions. Four three-direction categories each contain 125 combinations, producing 500 combined interaction trajectories.
Thus 500 combinations do not represent 500 independently recorded encounters. The reported train/test split does not state whether the underlying twenty pedestrian tracks are disjoint across splits. Features use goal distance, distance to other agents, and control effort. Figure 2 gives trajectory-entropy visualizations, which are descriptive comparisons rather than a controlled measure of crowd difficulty.
V-B Baselines and Evaluation Metric
Open-source baselines compatible with Speedway’s input format are retrained using a 60/40 split, batch size 64, learning rate 0.0003, dropout 0.2, AdamW, and mean-squared error. Training takes minutes on an RTX 2080 according to the paper. Average and final displacement errors compare generated and demonstration positions; the supplied protocol does not fully detail observation/prediction horizons or sample-selection conventions for every public-benchmark comparison.
V-C Results and Discussion
On Speedway, MAIRL reports 0.26 m average and 0.60 m final displacement error, compared with single-agent MaxEnt IRL’s 0.40/0.80 m. These correspond to 35% and 25% reductions, respectively; the abstract’s greater-than-twofold claim is not supported by those displayed Speedway values. The best other tested average error is 0.29 m, and all listed tested alternatives have final error at least 0.68 m.
On the five ETH/UCY scenes, performance varies by scene and metric. The table includes methods without Speedway results and an average column whose included datasets differ between rows, so a single overall ranking is not directly comparable across every entry. Among the retrained comparison group, Expert-Goals and Trajectron++ [23] have lower reported average-column displacement error; MAIRL has lower final-displacement error in that column.
JRDB end-to-end forecasting error is 2.640 m, behind HST at 2.506 and Social-Pose at 2.558, but better than single-agent IRL at 4.249. SCAND reports a pair of values, 0.23/0.67 m versus single-agent IRL’s 0.42/0.85, despite the table caption calling both datasets’ metric EFE. The pair is preserved without inventing a single-score interpretation.
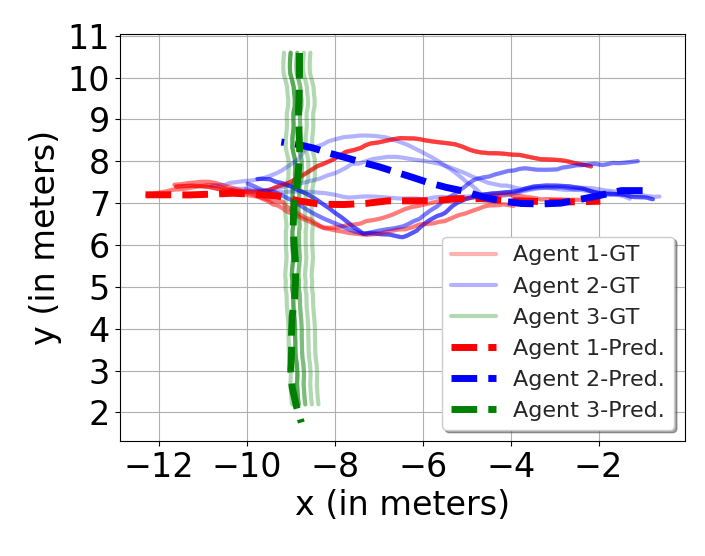
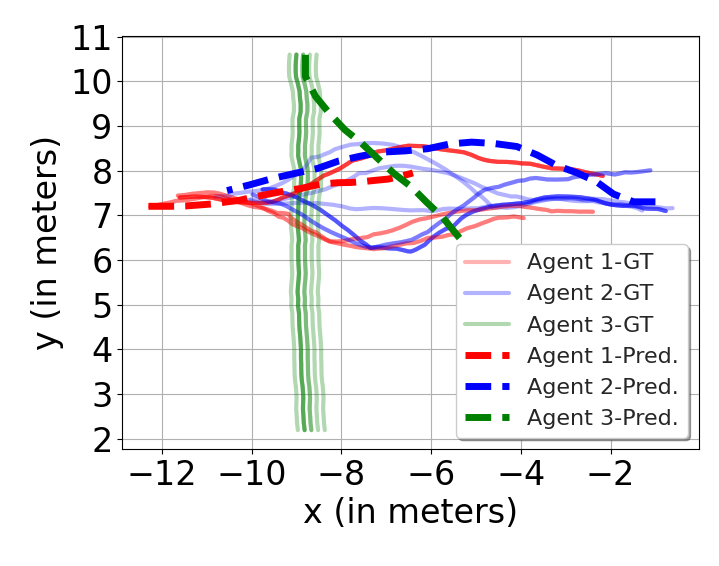
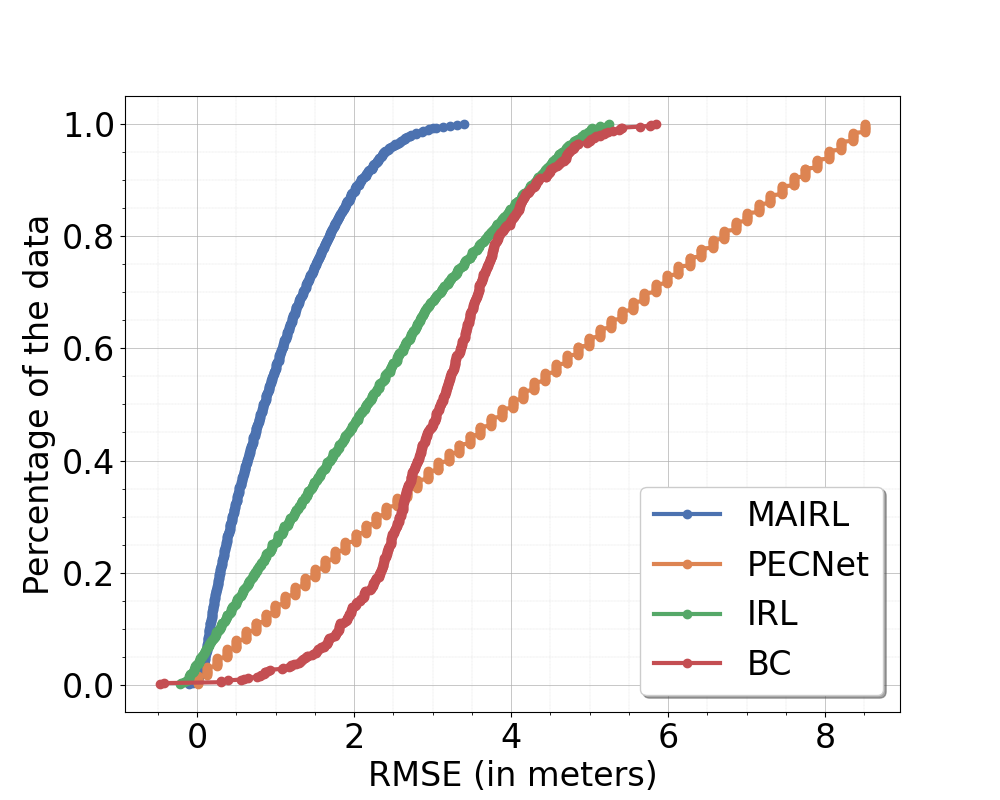
The three-agent crossing example shows qualitatively closer trajectories than single-agent IRL. Figure 4 is labeled cumulative RMSE and plots the proportion below an error threshold; the text discusses it as ADE. The plot is retained with its original axis and caption. No uncertainty intervals accompany the reported benchmark differences.
VI Conclusion and Open Questions
Separate agent costs and regularized game-policy computation improve the reported trajectory fit in the selected dense-crowd comparison. Important unresolved questions include specifying the covariance correction, bounding its behavioral effect, retaining the desired stochasticity without numerical failure, and incorporating broader social and environmental context. The small combinatorial dataset, incomplete split details, and absence of closed-loop navigation evaluation limit claims about deployment.