Scaling Laws and Interpretability of Learning from Repeated Data
Danny Hernandez · Tom Brown · Tom Conerly · Nova DasSarma · Dawn Drain · Sheer El-Showk · Nelson Elhage · Zac Hatfield-Dodds · Tom Henighan · Tristan Hume · Scott Johnston · Ben Mann · Chris Olah · Catherine Olsson · Dario Amodei · Nicholas Joseph · Jared Kaplan · Sam McCandlish · Anthropic
Repeating a small subset of a language-model training corpus can substantially damage performance. The worst repetition frequency depends on model size: too little repetition does not induce memorization, while a tiny heavily repeated subset may be cheap to memorize. Between these extremes, test loss peaks and copying mechanisms deteriorate. The study connects these scaling trends to weaker induction heads, while treating competition between memorization and generalization as a hypothesis rather than a complete causal account.
1 Introduction
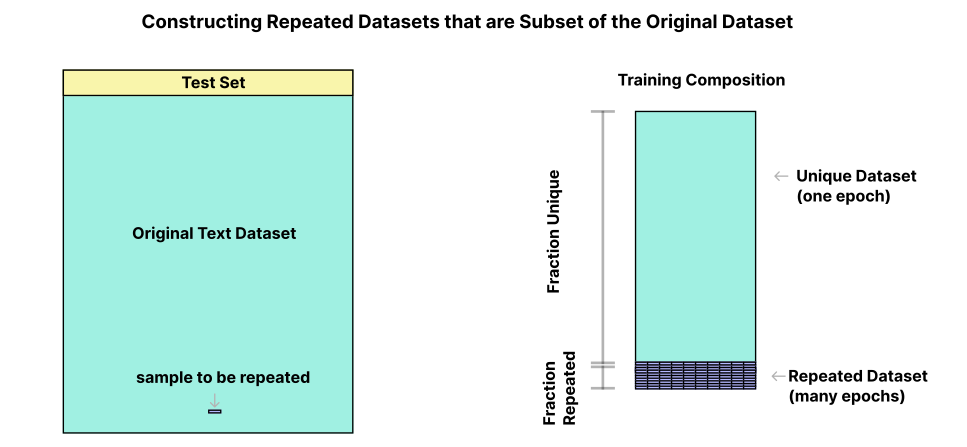
The experiments vary model size, the size of a repeated subset, and its share of training tokens. In a representative setup, 90% of tokens are unique and 10% repeatedly sample a small random subset. Held-out data exclude the repeated subset. Alongside aggregate loss, the authors inspect induction heads: attention circuits that continue patterns by copying earlier sequences [26].
Figure 1: Experimental Setup. From a large original text dataset (left), we draw 90% of our desired training dataset in a non-repeated fashion, and 10% as repeats of a tiny portion of the original dataset (right). We hold constant that 10% of total training tokens will come from repeats, but we vary the repeated fraction in our runs. In other words, the sample to be repeated might be very small, like 0.01% of the total training tokens repeated 1000x, or relatively large, like 1% of the total training tokens repeated 10x. A small, held-back portion of the original dataset (yellow in left figure), not including any repeated data, is used as a test set and is the test loss reported in all subsequent figures.
1.1 Summary of Results
All main models train for 100 billion tokens. At unfavorable repetition frequencies, an 800-million-parameter model approaches the test loss of a roughly 340-million-parameter control. Copying and prefix matching can degrade much more than general language-model loss. Similar double-descent patterns appear with Python training and tiny attention-only models; language pretraining with excessive repetition can also impair subsequent Python fine-tuning.
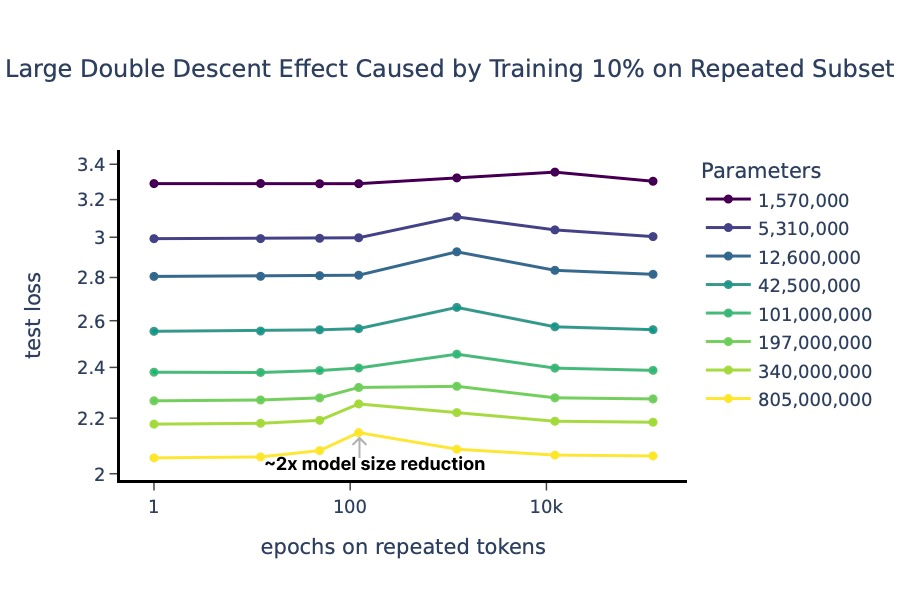
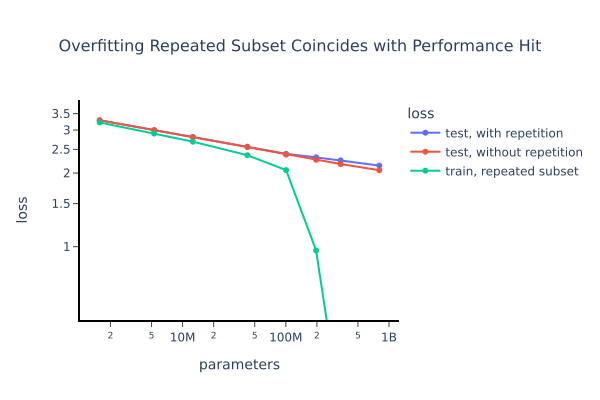
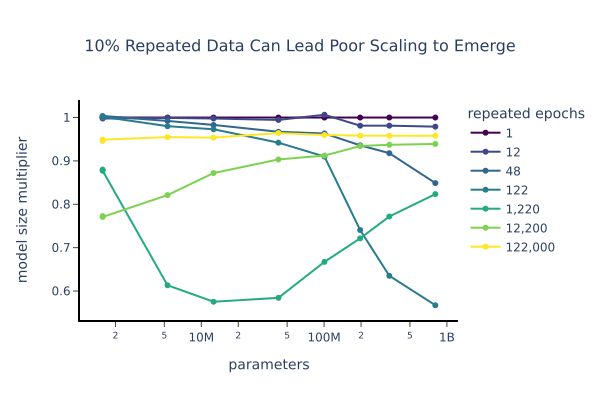
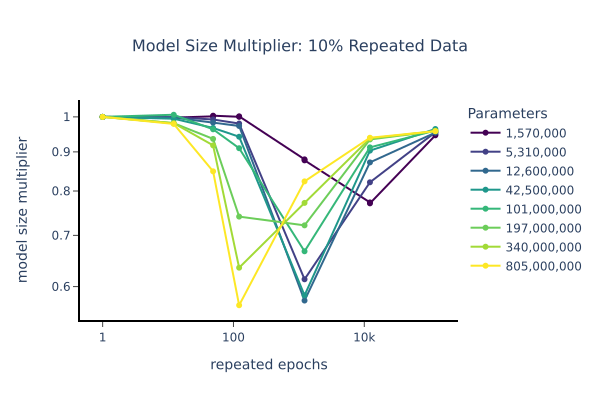
Figure 2: Models of different sizes show a degradation in performance at a specific range of repeats that shrinks with model size (left panel). At its peak the degradation sometimes reaches the equivalent of a 2x decrease in model size. The right panel shows that divergence (blue line) from a healthy, straight scaling law (red) lines up with when the models start to dramatically overfit the repeated subset (green curve). The blue line on the right corresponds to a vertical slice of models in the left diagram trained on the repeated subset for 120 epochs. All these models were trained on 90% unique data and 10% repeated tokens.
2 Results
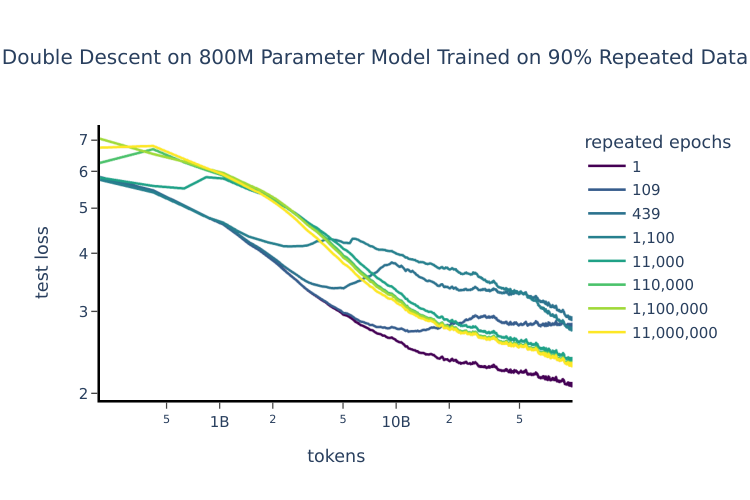
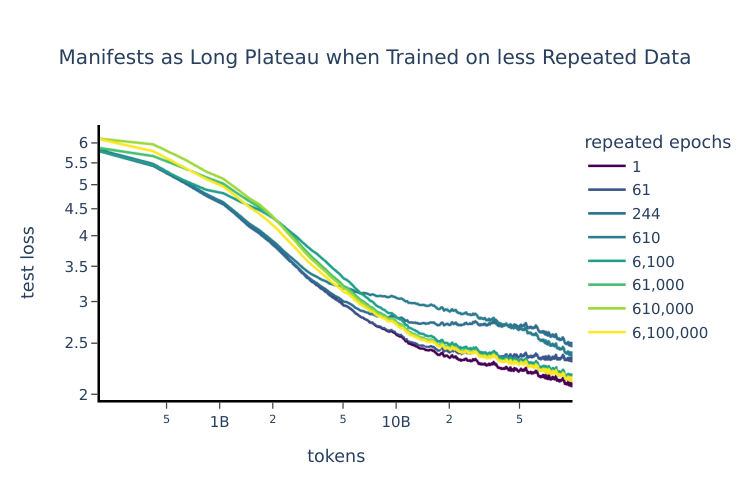
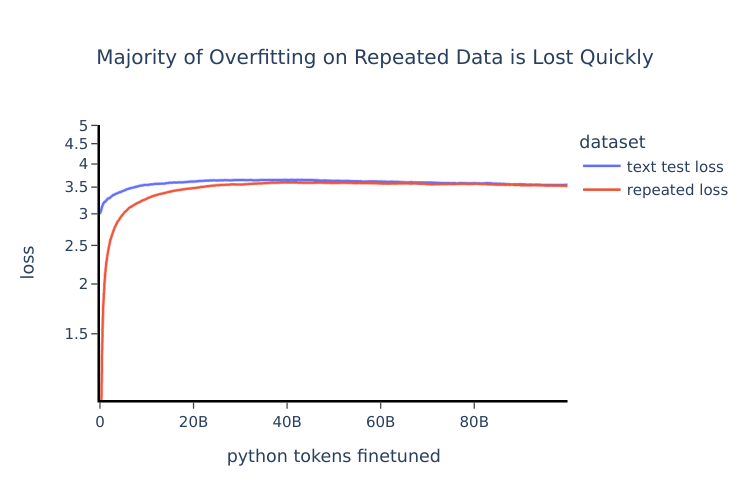
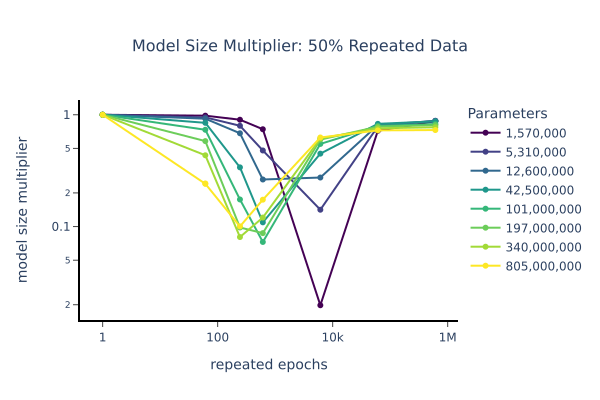
With 10% repeated tokens, the largest loss increase for the 800-million-parameter model occurs near 100 repetitions of a subset equal to 0.1% of the token budget. The repeated-subset training loss approaches zero near this peak. With 90% repeated tokens, held-out loss can fall, rise, and fall again during training; at 50%, a long plateau often replaces the rise. Increasing model size shifts the harmful repetition range, producing departures from otherwise smooth power-law scaling.
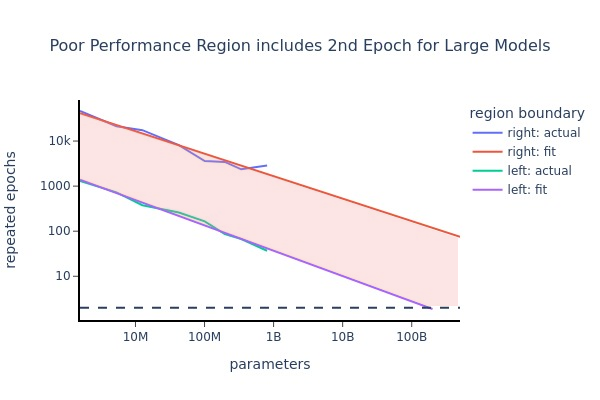
The authors fit the boundaries of this range after expressing loss as the size of an equivalent unique-data model. Extrapolating the fit suggests that even two passes over a subset could matter at very large scales, but this extrapolation holds the training budget at 100 billion tokens. It is not a measured result for optimally trained frontier models.
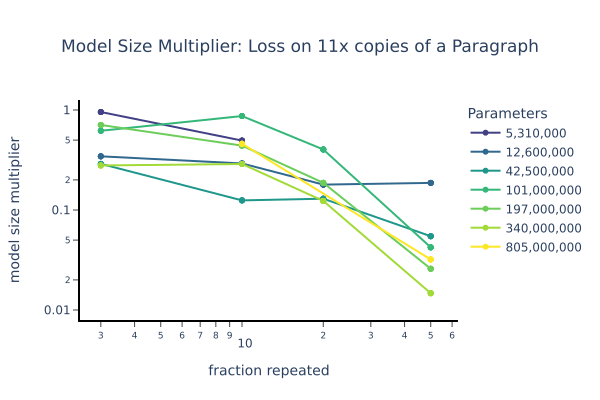
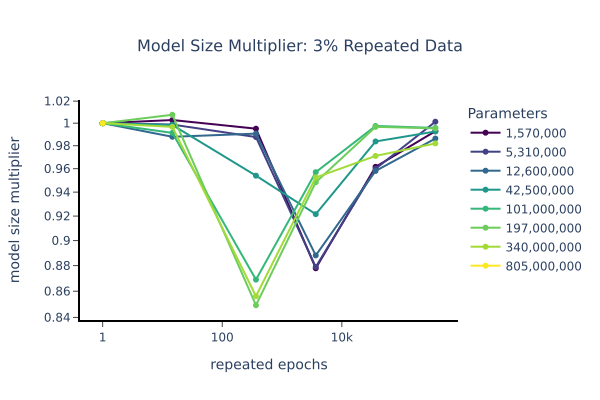
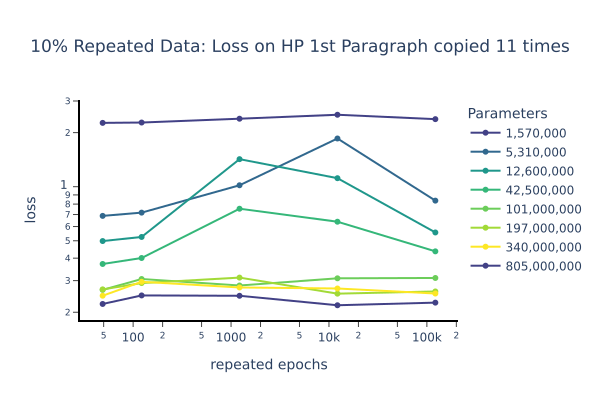
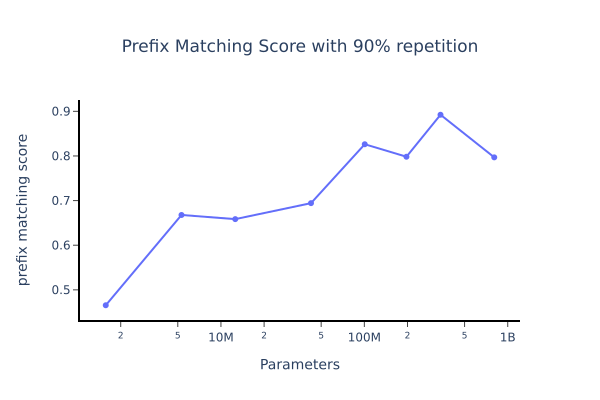
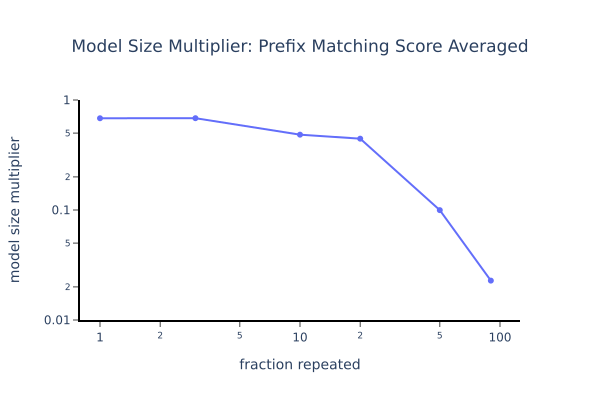
Copying is especially vulnerable. On repeated copies of a paragraph, 3% repeated training tokens can cause roughly a threefold reduction in effective model size for copying, despite a much smaller change in general test loss. At the double-descent peak, some small models gain almost nothing from seeing further copies. Prefix-matching scores also decline disproportionately in some settings, although this relationship does not hold uniformly across repetition fractions.
Token-level comparisons in one- and two-layer attention-only models expose failures to copy proper names and related word forms. The controls sometimes assign hundreds of times greater odds to the correct continuation. Direct logit attribution does not clearly resolve whether weaker induction-head activity or interference from other heads is responsible.
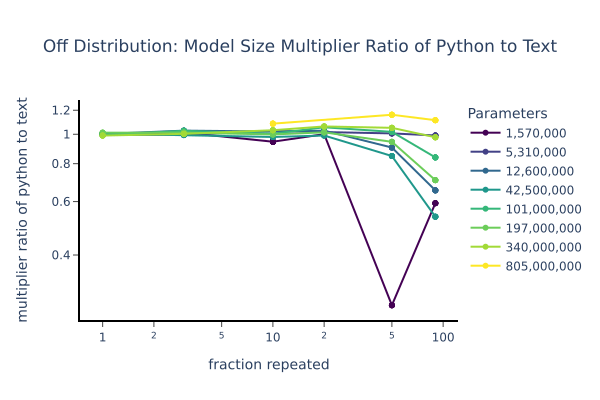
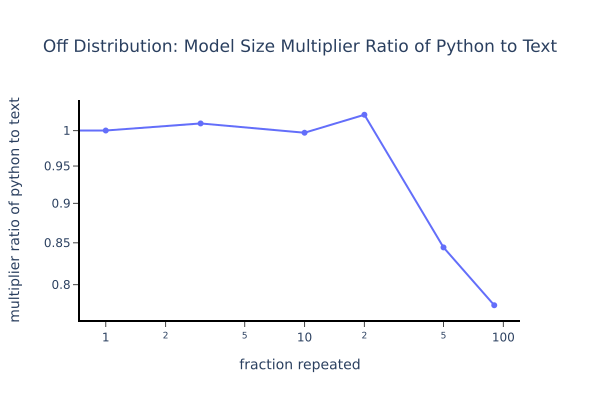
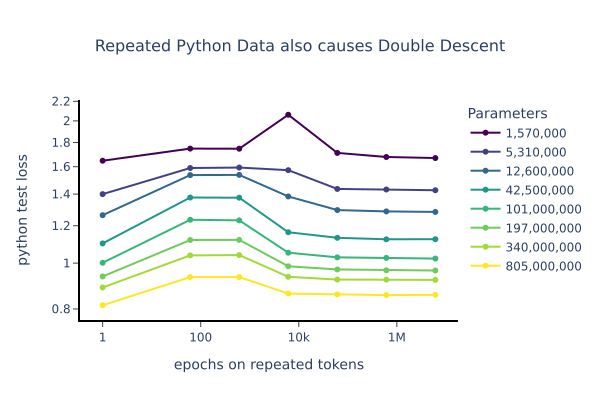
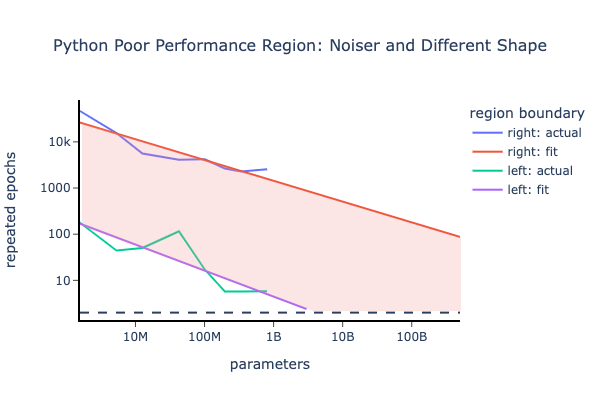
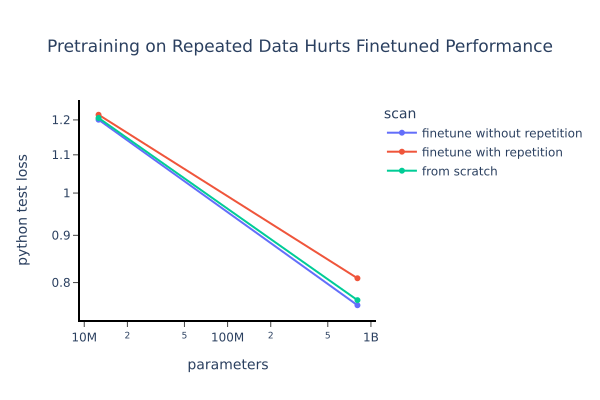
Out-of-distribution Python loss degrades most disproportionately when repeated tokens comprise 50–90% of training. Models trained directly on Python show a similar but noisier harmful region; their base dataset already receives about 2.2 passes, complicating comparison with language training. Fine-tuning on Python recovers much of the damage from repetitive language pretraining, but can still underperform training from scratch or fine-tuning a unique-data control. The fine-tuned model also forgets the repeated material, removing a possible compensating benefit.
Figure 3: Learning curves for test loss on 800M models with 90% repeated data (left) and 50% repeated data (right), each with varying numbers of repeats/sizes of the repeated fraction. The graph on the left shows characteristic double descent curves. Repeated epochs corresponds to the number of epochs on the repeated tokens, the rest of the data is seen only once. For several models, test loss drops as normal during the beginning of training, but then starts to rise during the middle of training before dropping again. In the graph on the right with only 50% repeated data, we see that the double descent bumps have turned into long plateaus for highly affected models.
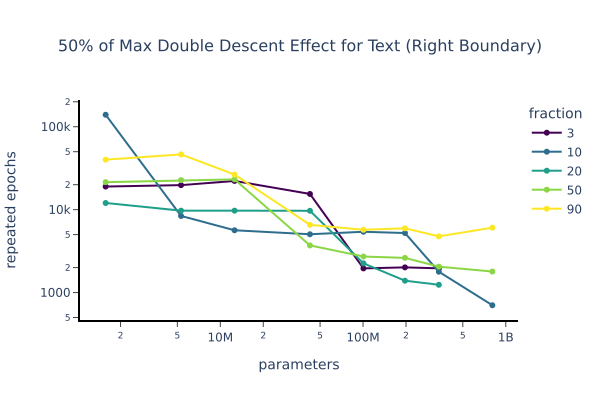
Figure 4: On the left we plot the same results as in Figure 2, re-parameterized in terms of the effective model size multiplier implied by the test loss (performance equal to a model with x times as many parameters). For a given number of repetitions, degradation occurs only for a specific range of model sizes. For example, for the blue curve (122 repeated epochs), we see almost no performance deviation from a power law scaling law (line on log-log graph) until the model is scaled up to 100M parameters, after which we see a divergence. We see the same divergence around 400M parameters for 12,200 repeated epochs. The right graph shows a large, predictable region over which the degradation occurs, and suggests that large models like GPT-3, Gopher, and PALM [Brown et al., 2020, Rae et al., 2021, Bi et al., 2020] need to be careful about overfitting their high quality distributions like Wikipedia and books – although note that this holds constant the number of total training tokens. The blue and green curves correspond to the right and left sides of the double descent region where we observe 50% of the maximum effect. They are an aggregation of that curve for the scans where we trained on 3%, 10%, 20%, 50%, and 90% repeated data. The details of both fits are in Appendix A. A large number of runs needed to be aggregated to produce a clean fit for region of reduced performance.Equation
right boundary
5.1e7
-.50
left boundary
4.2e6
-.56
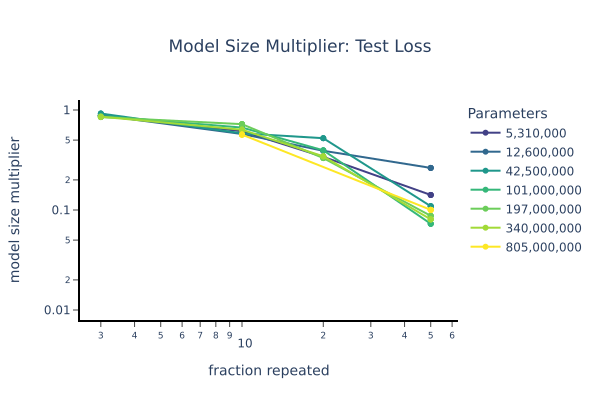
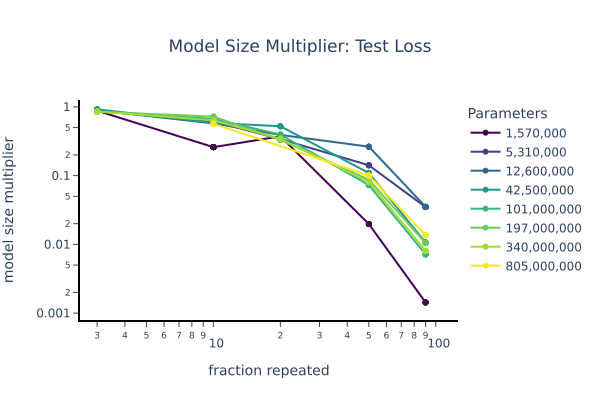
Figure 5: We constructed a simple measure of the model’s copying ability, consisting of the loss on the first paragraph of Harry Potter repeated 11 times. We measured the double descent peak performance for a given model size and fraction of repeated data and compared that to a fit of these evaluations on the control model (trained on unique text) scan to generate an effective model size. We observe that 3% repeated data at the pessimal number of repeated epochs caused a 3x reduction in effective model size on this task for a for several model sizes, whereas it only caused at most a 1.15x reduction in effective model size on test loss. We see much larger effects on the copying evaluation than on overall performance for repeated data fractions between 3% and 20%. The model size multiplier for copying is based on interpolation and the model size multiplier for test loss is based on a power law fit (see Appendix C for more details).
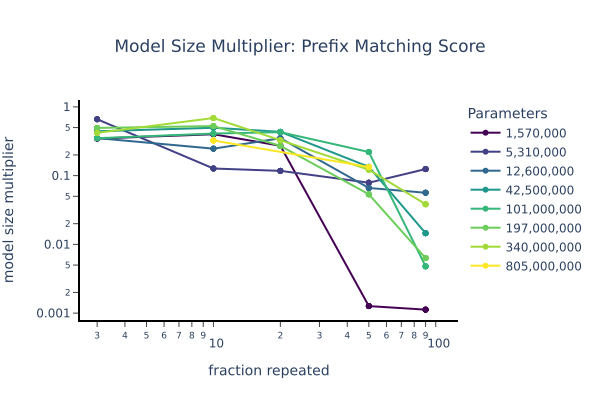
Figure 6: Comparison of degradation of prefix matching score with repeated data, compared to general degradation of the test loss. We measured the double descent peak performance for a given model size and fraction of repeated data and compared that to a fit of the prefix matching score on the control model scan to generate an effective model size. We observe that 3% repeated data causes on average 21 a 1.47 model size multiplier on prefix matching score while causing less than a 1.15x model size reduction in effective model size on test loss. Again we see much larger effects on the prefix matching score than on overall performance for repeated data fractions between 3% and 20%. The model size multiplier for prefix matching is based on a linear fit (see Appendix C for more details of fit). The test loss shown on the right is the same graph as in Figure 5, but with differently scaled axes for ease of comparison.
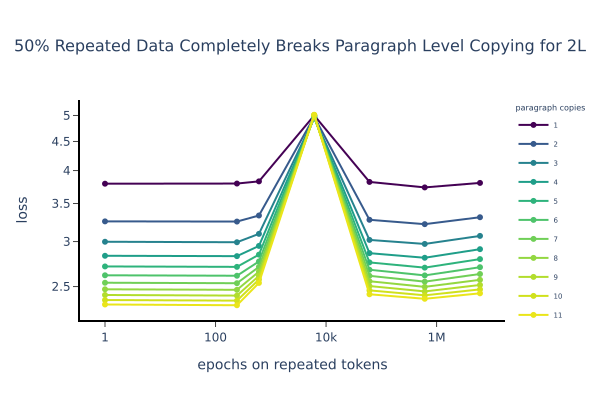
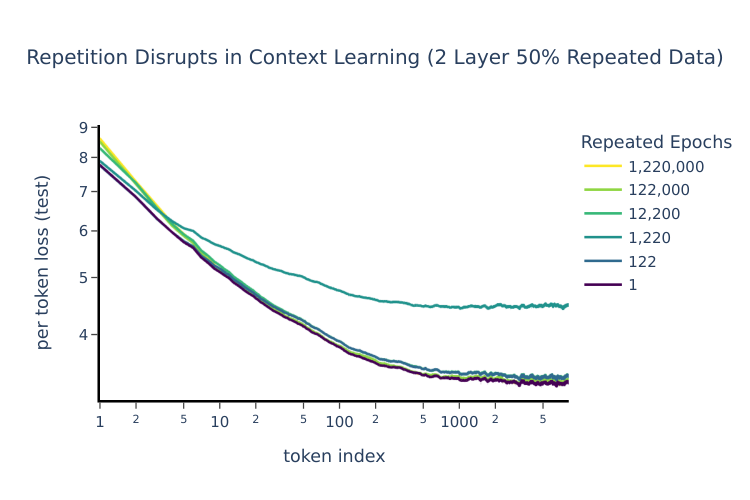
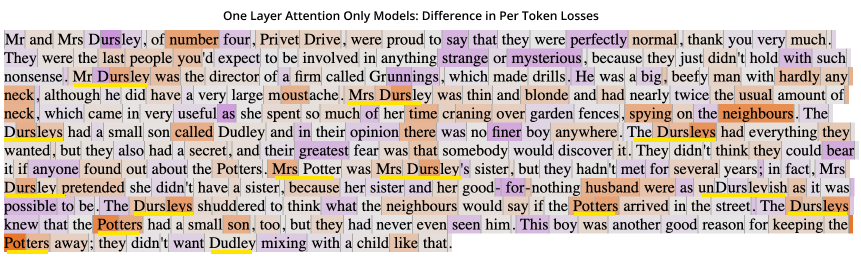
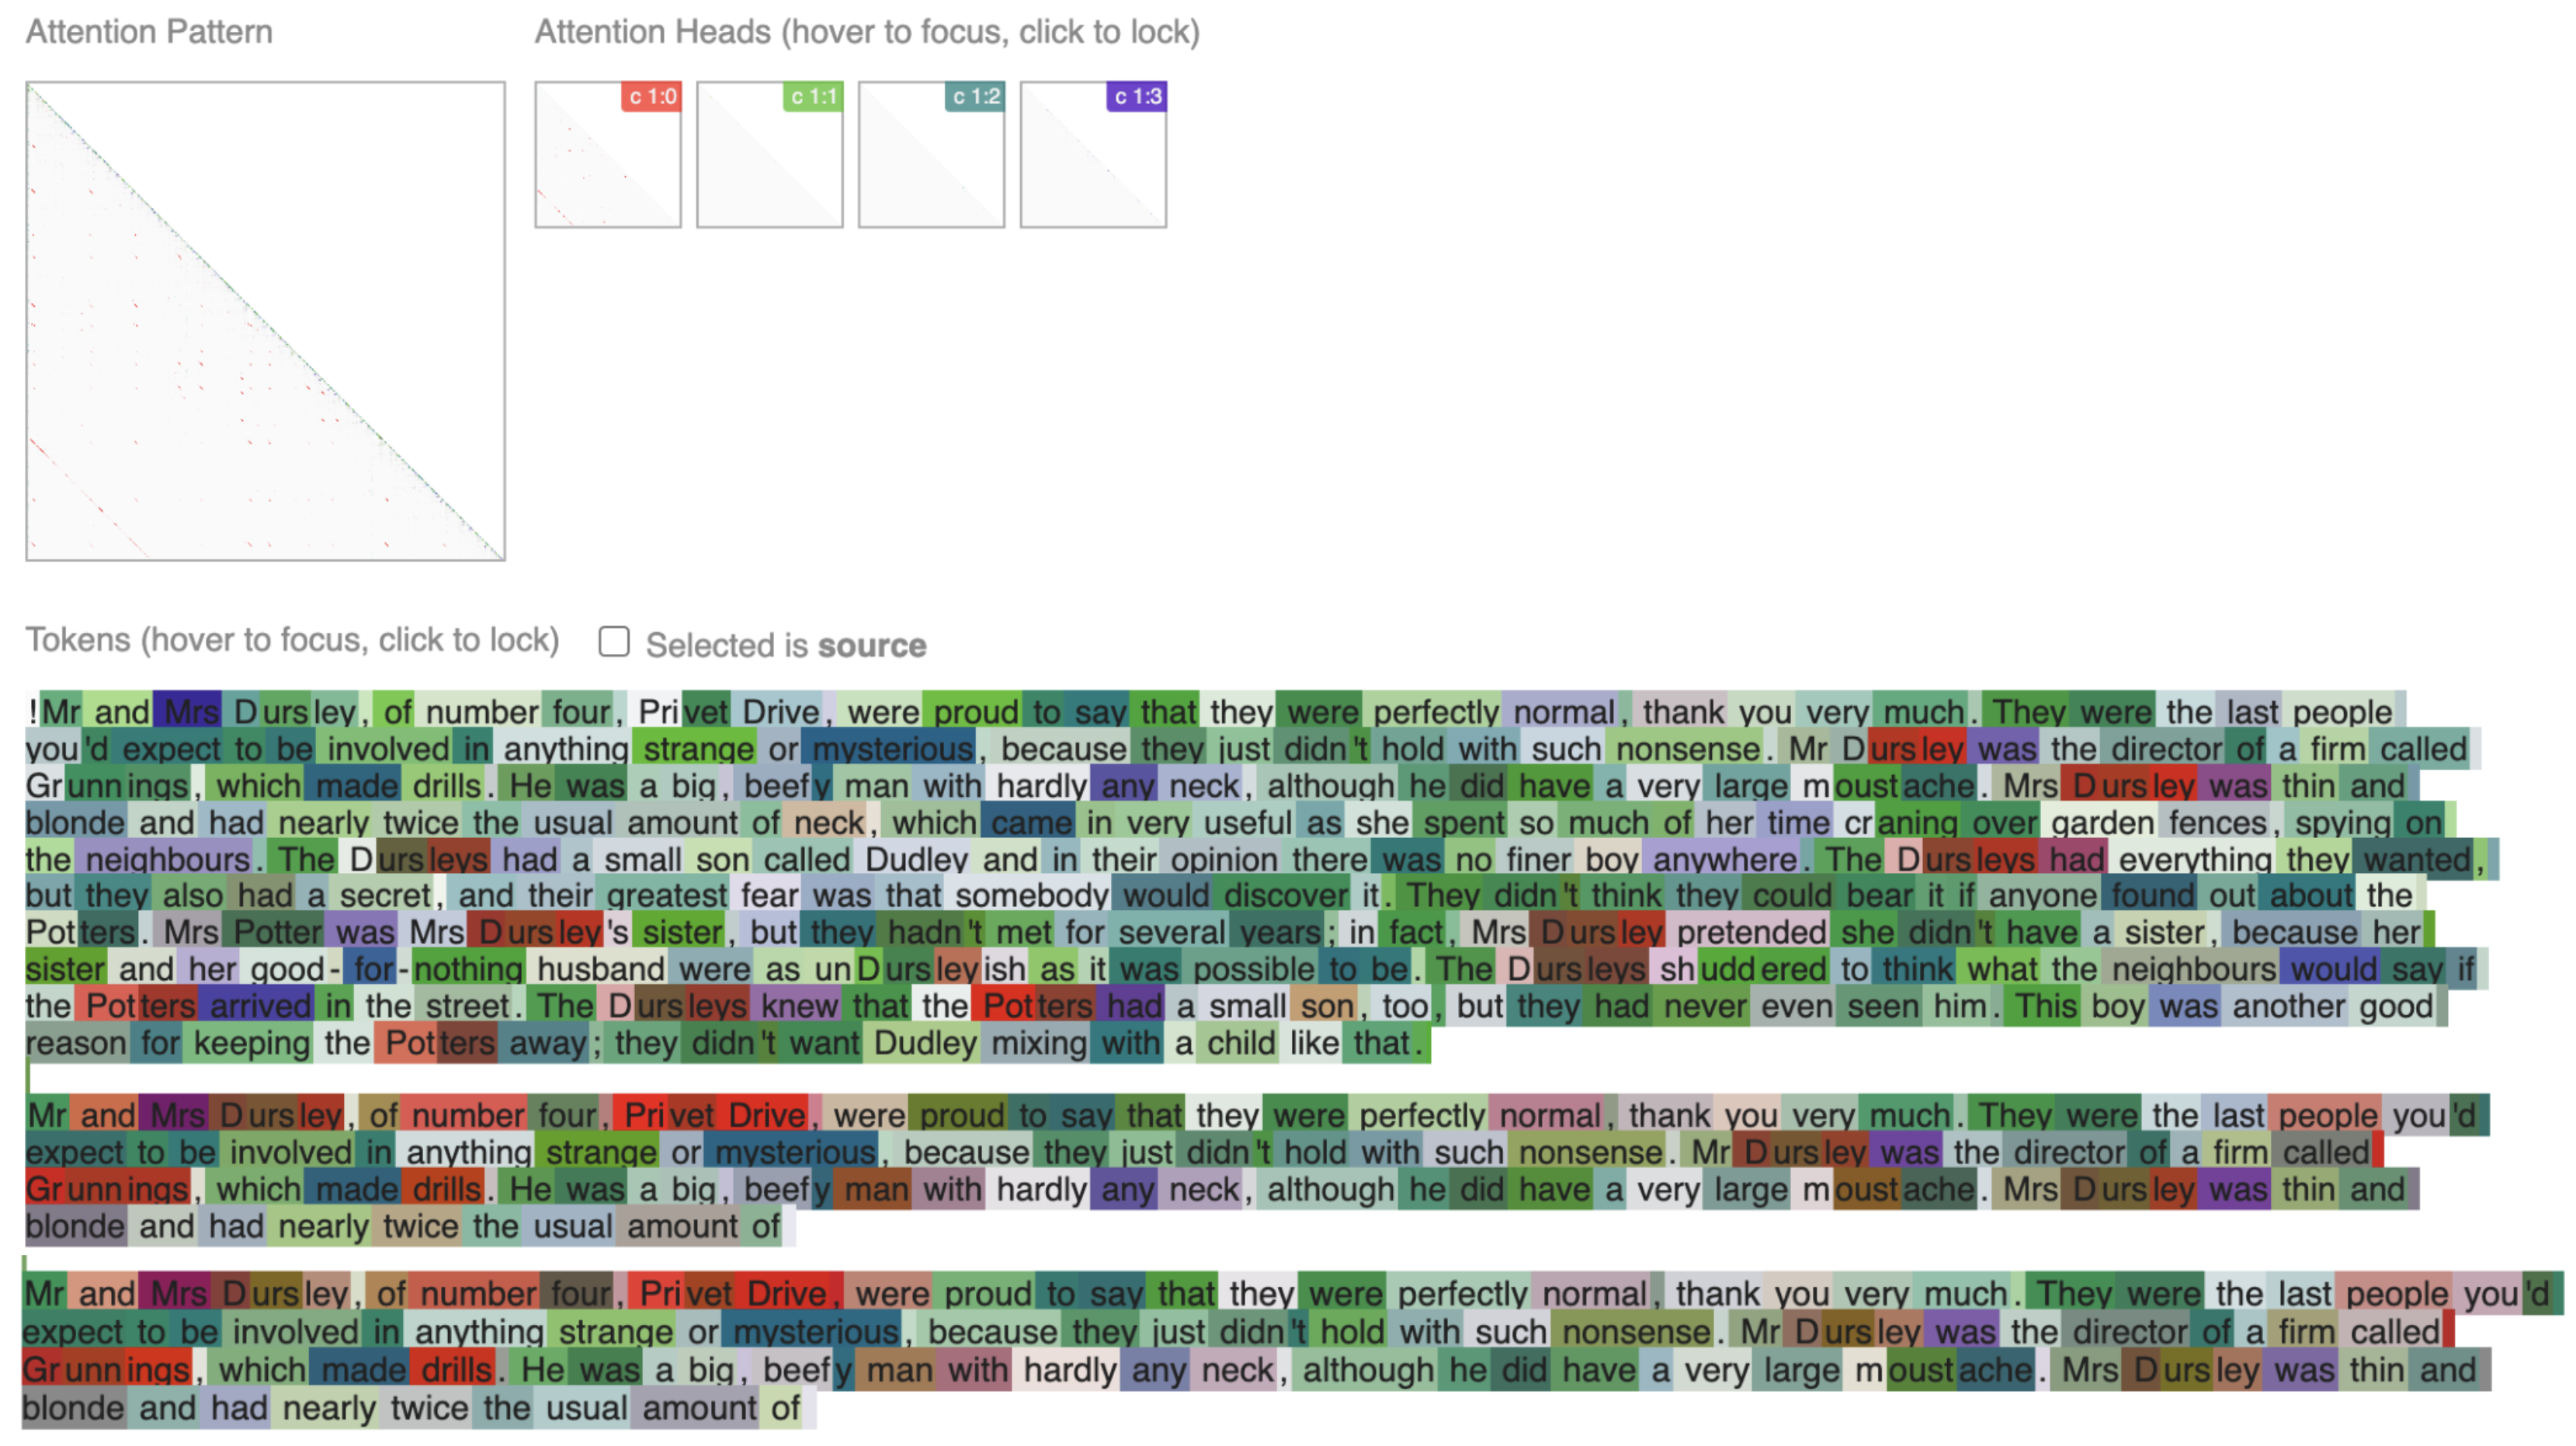
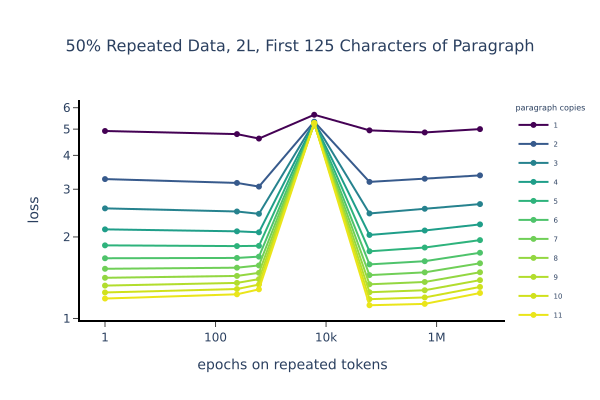
Figure 7: Degradation of copying and in-context learning at the peak of the double descent curve. On the left we show the 2-layer models trained on 50% repeated data from Figure 5, evaluated on the first paragraph of Harry Potter copied X times where X runs from 1 to 11. In Appendix D, we explore shortening the length of the paragraph to verify the problem is with copying rather than long contexts. The right shows per token losses on the test set. Both graphs show dramatically reduced performance (higher copying loss, lower benefit to in-context learning) at the peak of the double descent.Figure 8: Visualization of the difference in loss on the first paragraph of Harry Potter for control and 10%-repeated-data runs of a 1-layer attention-only model. Orange highlights correspond to the control model performing better, purple corresponds to the repeated data performing, and the intensity corresponds to the magnitude of the difference in per token losses. Proper names (which are a good target for copying when they occur more than once) are underlined in yellow on second or later occurance; it is clear that the control model performs better on these. Often the difference is dramatic: for the last three appearances of “Potters” the control model puts a >97% chance on “ters” given “Pot”, whereas the repeated data model puts <4% chance on that token.Equations
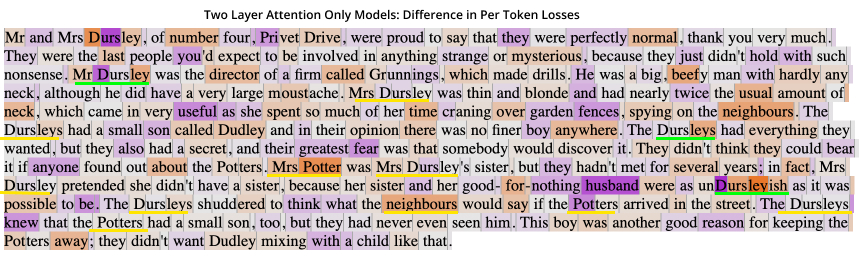
Figure 9: Same as Figure 9, but for 2-layer attention-only models. Proper names (which are a good target for copying when they occur more than once) are underlined in yellow on second or later occurance. Here the repeated-data model sometimes does better on repeated proper names, but there are still clear examples of the control performing much better. These examples are highlighted in green and discussed. On the token [ley] in the second appearance of [D][urs][ley] the control model places a 92% likelihood on [ley] whereas the repeated data model places a 10% likelihood. On the token [leys] in the second appearance of [D][urs][leys] the control model places a 44% likelihood on [leys] whereas the repeated data model places a 4.9% likelihood. On the [ley] in [ un][D][urs][ley][ish] the control model places a 68% likelihood on [ley] whereas the repeated data model places a 0.4% likelihood.
Figure 10: We observe that training on high levels of repeated data causes a small disproportionate drop on out-of-distribution performance (Python loss). The effect is noisy, but since we do not see a model size effect we take the average in the figure on the right (harmonic mean of multipliers). For large repeated fractions of 50% and 90% we see model size multipliers of .84 and .75.
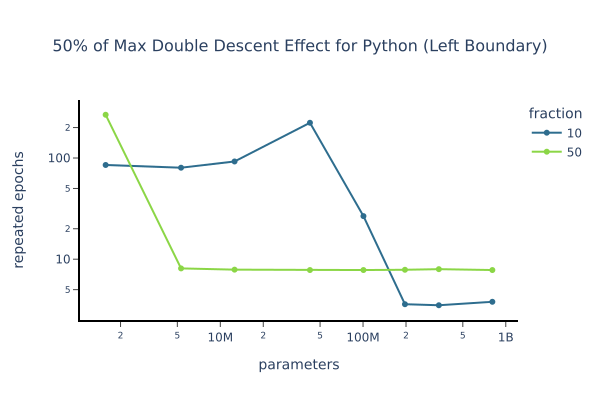
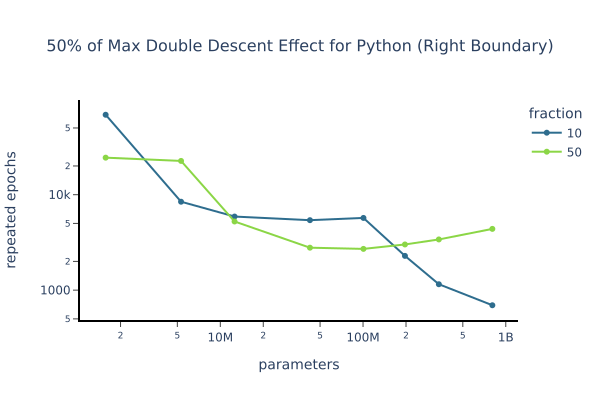
Figure 11: Double descent phenomenon for models trained on python. Training on Python gives similar results to what Figure 2 and Figure 4 show for language models. Here 50% of the dataset consists of repeats and 50% is unique. On the left side is degradation in performance, occurring over a specific range of repetition that varies with model size. On the right, we again see a large region of poor performance as we did in Figure 4, although the fit is noisier. Again the blue and green curves correspond to the right and left sides of the double descent curve where we observe 50% of the maximum effect.
Figure 12: Effect of repeated data during pre-training on fine-tuning. Models were pre-trained on 90% repeated data (red lines) or on totally unique data (blue lines), and then fine-tuned on Python (always unique data). The repetition frequency was chosen to maximize the performance hit. The model pre-trained on repeated data encounters a sizable performance hit during fine-tuning (left panel), causing it to not only perform worse than the model pre-trained on unique data, but also worse than a model trained from scratch (green line). The right panel shows fine-tuning curves of the two models. The model pretrained on repeated data performs much worse for several billion tokens (red line), but eventually catches up to the model pretrained on unique data (blue line).
3 Methods
Decoder-only transformers use 8,192-token contexts and a 50,304-token GPT-2 vocabulary. The 400-billion-token language pool comprises 55% filtered Common Crawl, 32% internet books, and smaller sources including OpenWebText, Wikipedia, and Stack Exchange. Python experiments use 45 billion tokens for 2.2 epochs. Fine-tuning uses half the pretraining learning rate and shorter warmup; model and repetition settings span several orders of magnitude.
4 Related Work
The work combines scaling-law analysis, mechanistic circuit analysis, and the double-descent literature. Its contribution is to show that memorization of only a training subdistribution can cause a large global loss penalty, then connect that penalty to interpretable copying circuits. This complements prior evidence that deduplication improves language models [22] and that induction heads help implement in-context learning [26].
5 Discussion
5.1 Why does repeating a small fraction of data damage performance so much?
Memorization can improve the training objective while harming generalization: driving loss near zero on 10% of tokens may outweigh a moderate loss increase on the remaining 90%. The proposed explanation is a capacity trade-off. A broad lightly repeated subset is hard to memorize; a tiny highly repeated subset takes little capacity; intermediate subsets may absorb enough capacity to cause the largest damage. The experiments support this interpretation without directly measuring the parameters devoted to memorization.
5.2 Generalization, memorization, and induction heads
Poor held-out loss coincides with reduced copying and weaker prefix matching, consistent with memorization displacing generalizing algorithms. The authors interpret one two-layer model as replacing an induction head with a simpler skip-trigram behavior. These observations strengthen the induction-head account of copying, but do not isolate a universal mechanism for every repetition-induced failure.
5.3 Bridging mechanistic interpretability and scaling laws
Aggregate scaling curves show that an internal change matters for performance; circuit analysis suggests a mechanism behind that change. Combining both views can provide better diagnostics than either alone. The paper presents this connection as a research strategy, not as a complete explanation of language-model scaling.
5.4 Repeated data and fine-tuning
The authors call it ossification when pretraining makes later fine-tuning worse than training from scratch at a fixed compute and data budget. Strong ossification requires extreme repetition in these experiments, and fine-tuning repairs much of the original damage. Repetition is therefore a plausible contributor to ossification, rather than an established explanation for all transfer-learning failures.
5.5 Limitations
The study fixes training tokens across model sizes rather than following a compute-optimal frontier. Harmful-region boundaries are noisy and depend on the setup. Repeated examples are randomly drawn from the same distribution, so the results do not directly establish the effect of deliberately upweighting higher-quality material. Evaluation emphasizes loss rather than downstream tasks. Regularization, early stopping, other duplication patterns, and systems simpler than one-layer attention-only models remain untested.
5.6 Future Directions
Future experiments could follow a compute-optimal training frontier, vary sentence- and document-level duplication, and measure which parameters encode repeated material. The authors also suggest testing whether memorization competes directly with induction heads and whether rapid memorization contributes to training-loss spikes.
6 Conclusion
A small repeated subdistribution can induce large, predictable loss penalties and disproportionately disrupt copying. The practical lesson is to examine the amount and frequency of repetition together with model size and training duration. The proposed memorization–generalization mechanism motivates further causal analysis.
Acknowledgments
The authors acknowledge feedback on the manuscript and organizational support for the project.
Author Contributions
Danny Hernandez led the experiments, analysis, and writing. The remaining authors contributed training and interpretability infrastructure, datasets, technical advice, project framing, and supervision; the original article records individual contributions.
Appendix A Model Size Multiplier and Poor Performance Region Fits
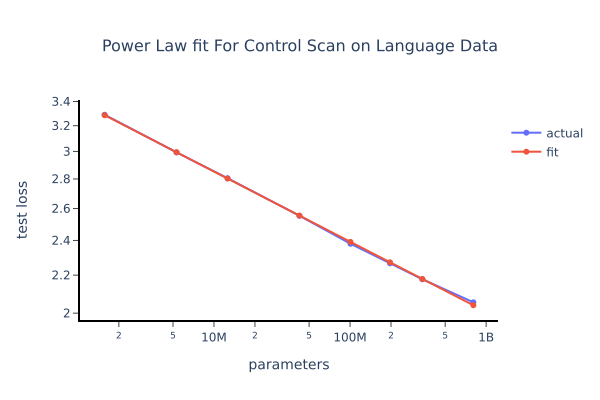
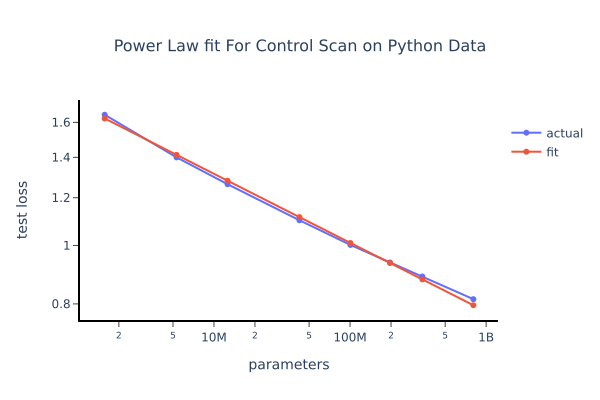
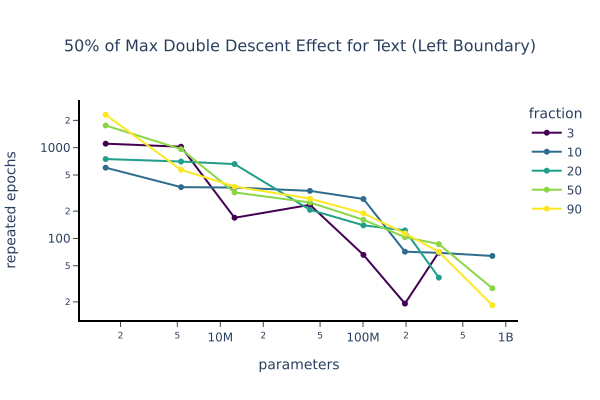
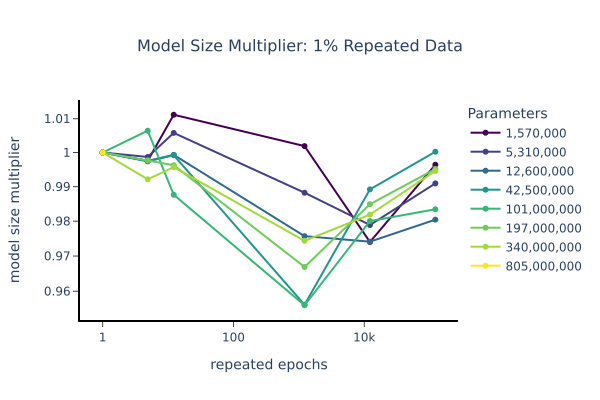
Control-model power laws convert losses into equivalent model-size multipliers. The authors interpolate each scan at half its maximum degradation and average the resulting boundary estimates. They exclude noisy 1% repetition scans, retaining fractions of 3% and above. Sparse sampling and interpolation make exact boundaries uncertain; Python estimates average fewer, noisier scans. These curves support a qualitative harmful region, not precise universal thresholds.
Figure 13: We see a power laws provide good fits for both language and Python data. We can use these fit to re-parameterize loss for our models trained on repeated data into model size multipliers.
Figure 14: We estimate how many repeated epochs half of the maximum effect size (on a log scale) would be observed using linear interpolation on the left and right side of the double descent peak for each fraction of repeated data. We then averaged these curves to make an overall estimate for the left and right boundaries of the poor performance region shown in Figure 4
Figure 15: it is easier to see the sharpness of the double descent peaks in this diagram than Figure 2. The 1% runs was much noisier than the rest so we excluded it from our fits
.
Figure 16: We estimate how many repeated epochs half would cause half of the maximum effect size (on a log scale) for our Python models using linear interpolation on the left and right side of the double descent peak for each fraction of repeated data. We then averaged these two curves to make an overall estimate for the left and right boundaries of the poor performance region shown in Figure 11
Appendix B Appendix: Logit Attribution Analysis, 2 Layer Models
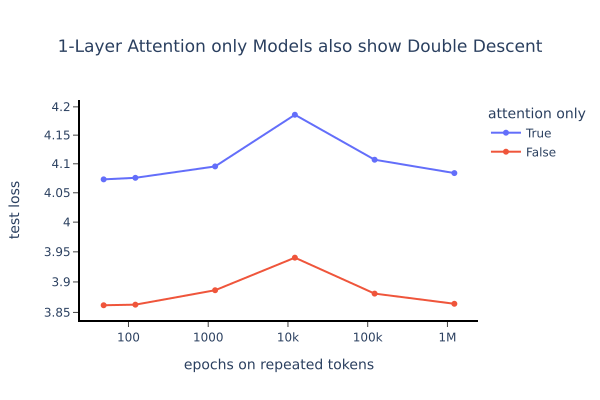
Direct logit attribution in two-layer attention-only models gives weak indications of both reduced induction-head contributions and interference from other heads. It does not decisively separate those explanations. The appendix also shows double descent in one-layer attention-only models, indicating that the overall effect does not require a full induction-head circuit.
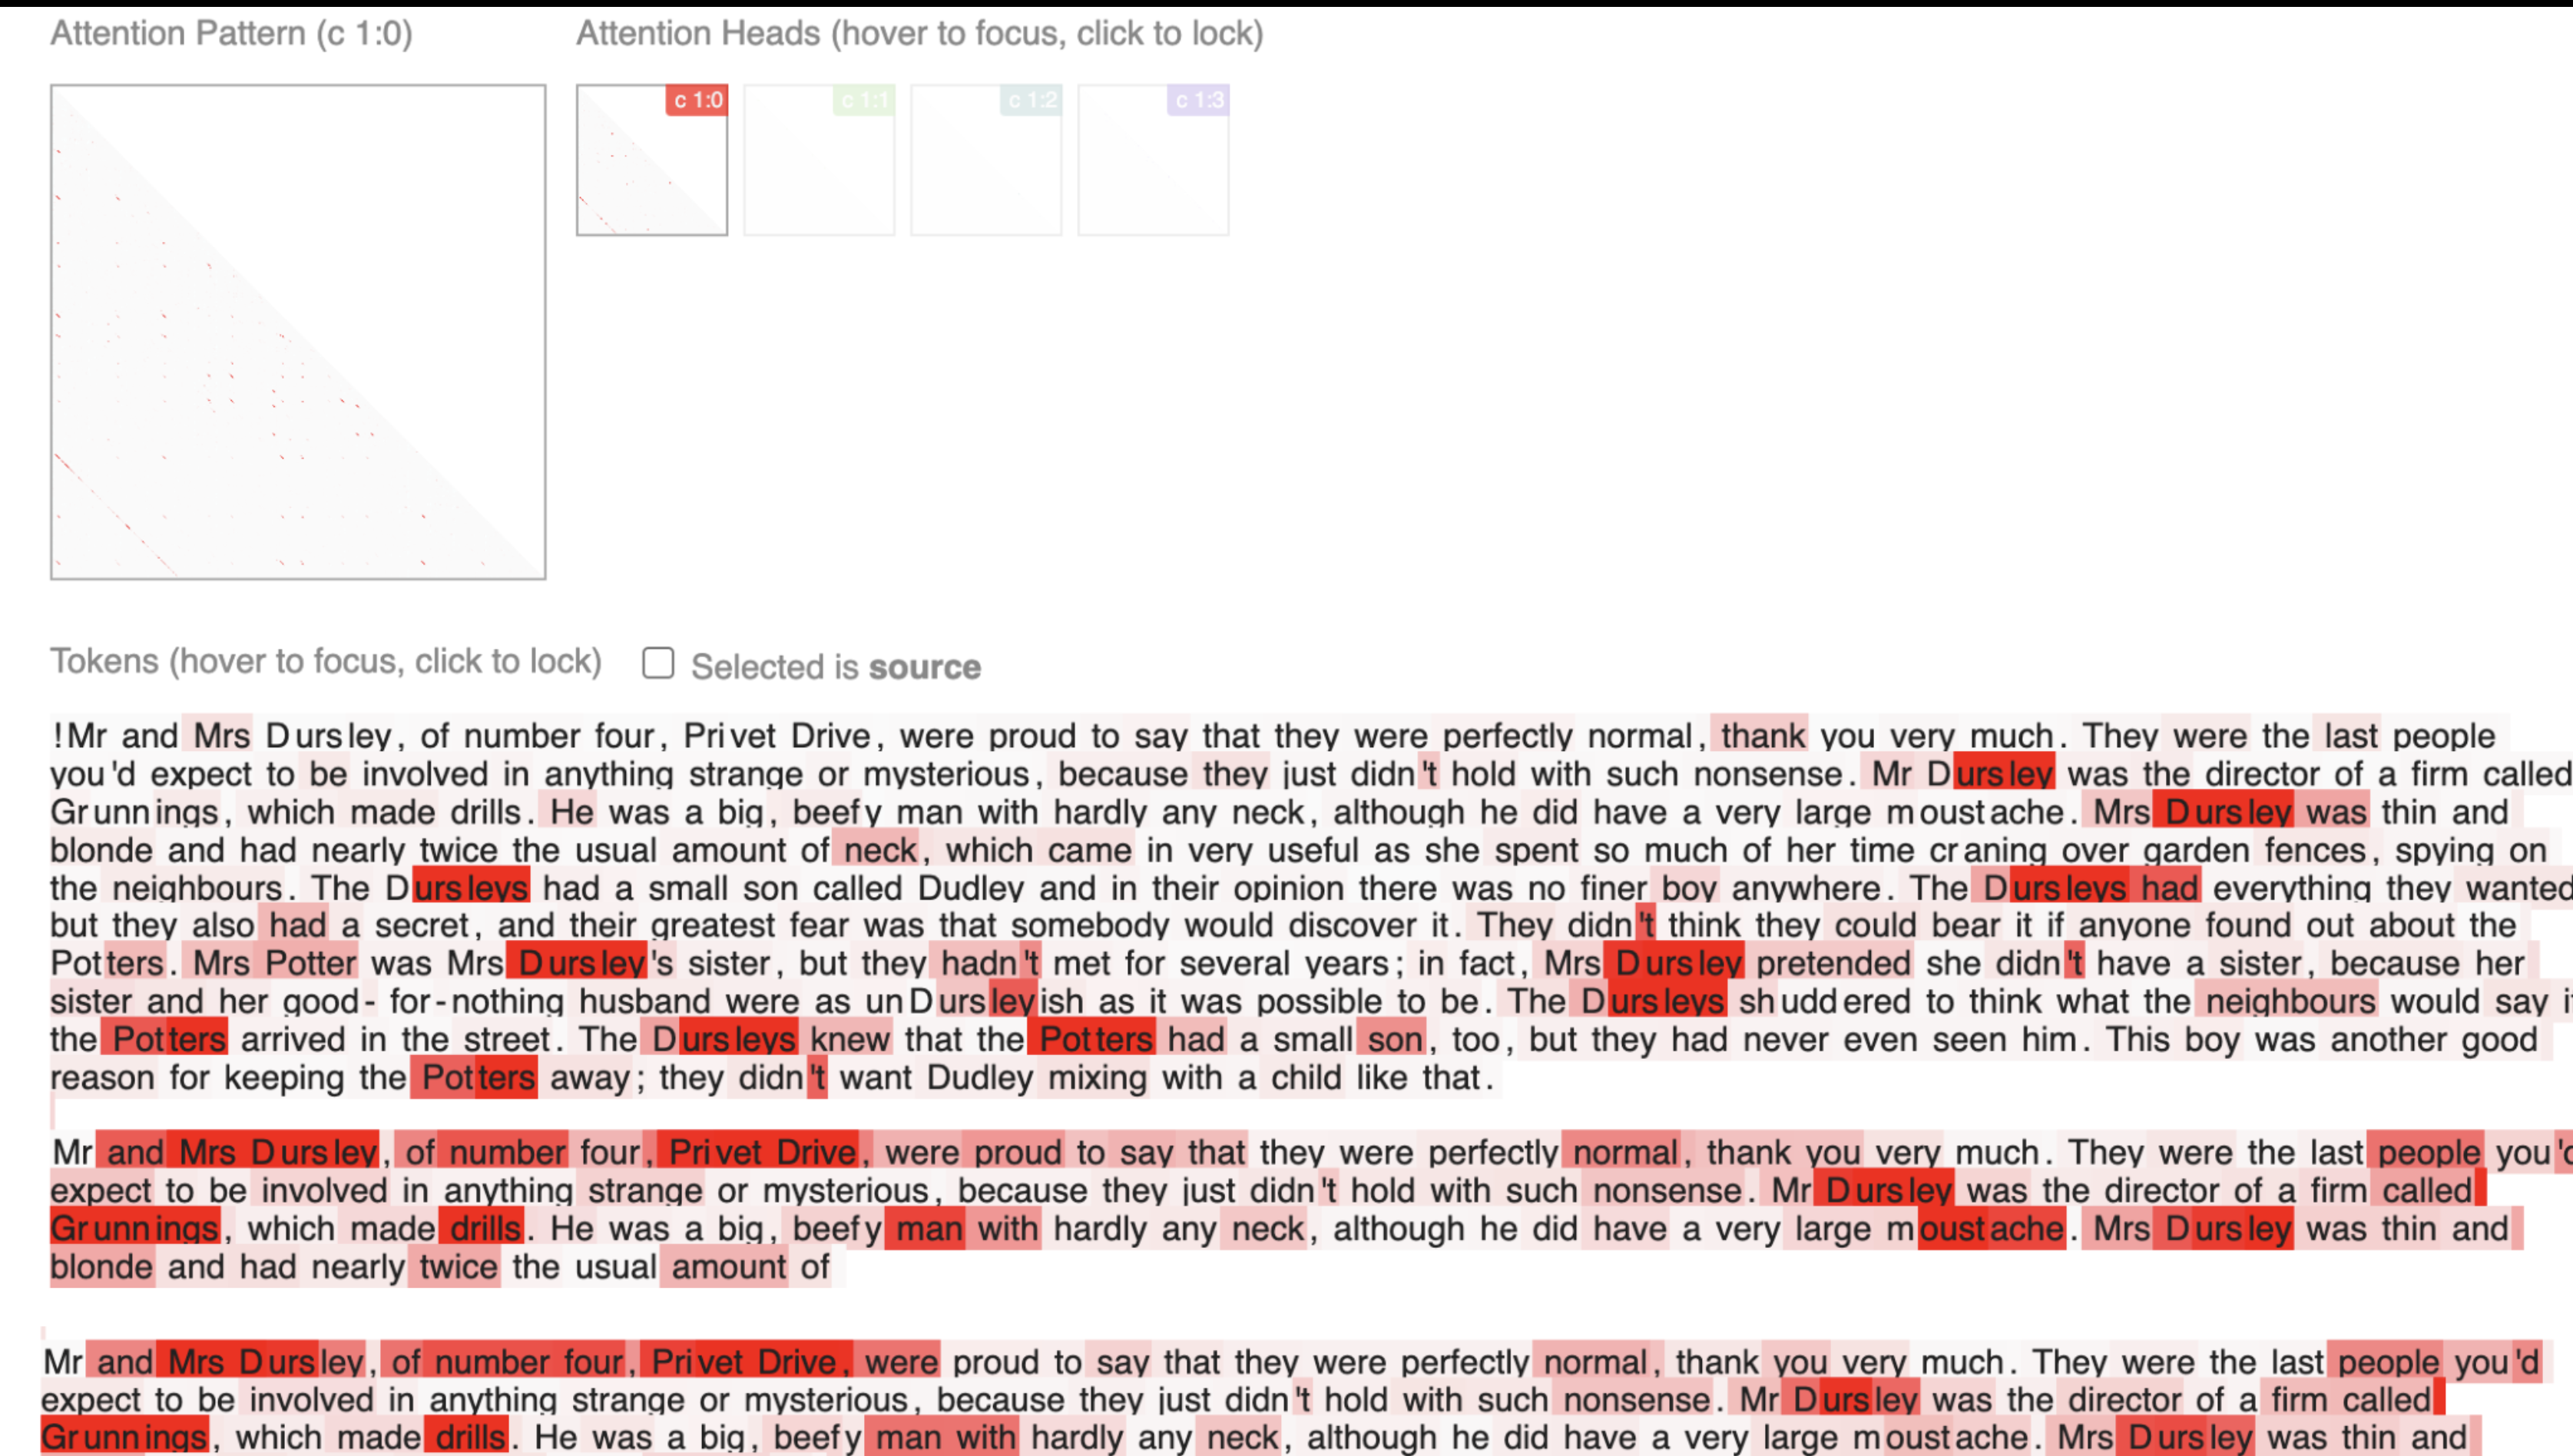
Figure 17: For attention only models we can directly attribute contributions of the attention heads to the logits as shown in [Elhage et al., 2021, Olsson et al., 2022]. Both models were evaluated on the first paragraph of Harry Potter copied twice. The induction head appeared to be head 0, shown in red for both models. The control model’s logit attribution is shown for the first two paragraph, and the third paragraph shown is from the repeated model at the double descent peak for comparison.Figure 18: For attention only models we can directly attribute contributions of the attention heads to the logits as shown in [Elhage et al., 2021, Olsson et al., 2022]. Similar to Figure 17 both models were evaluated on the first paragraph of Harry Potter copied twice, but here the contribution of all attention heads is shown. The other attention heads in the repeated data model appears more active (several of the reddish tokens in the second paragraph are brown in the third paragraph).Figure 19: We still observe double descent on repeated data with 1 layer attention only models, so it is possible we’d observe double descent on repeated data for simpler model types.
Appendix C Appendix: Copying and Prefix Matching Score Fits
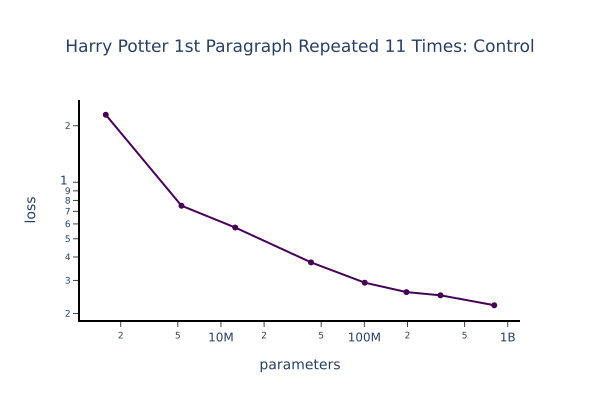
The copying comparison interpolates control-model loss on eleven paragraph repetitions; extrapolating beyond these controls is less secure. Prefix-matching comparisons use a linear control fit. The accompanying scans and model-size aggregates show how these choices produce the effective-size comparisons in the main results.
Figure 20: In order to do the model size interpolation used in Figure 5 we use the loss on Harry Potter’s first paragraph copied 11 times for our control models (no repeated data). it is relatively well behaved, but it was not obvious how to extrapolate the curve. On the right, as a sanity check, we check to make sure we still see peaks moving left as model size increases that approximately line up with what was observed in 2
Figure 21: For the model size multiplier in Figure 6 we a linear fit on the prefix matching score for the control models shown on the left. On the right, similar to 10 we show that if we take an average over model size (harmonic mean of multiplier), we get a relatively clean relationship.
Appendix D Appendix: Harry Potter Copying Evaluation with Fewer Characters
A shorter copying test uses 125 characters instead of 1,463. The two-layer model trained with 50% repeated tokens near the double-descent peak still obtains almost no benefit from additional copies. This checks that the original failure is not specific to learning a long paragraph.
Figure 22: In order to make sure the copying eval was not merely evaluating in context learning, we tried a much shorter copied sequence (approximately 10x shorter, 125 characters instead of 1463). We still observe approximately no learning from repeated copying for the 2L model trained on 50% repeated data at the double descent peak
34 references
[Advani and Saxe, 2017]
Advani, M. S. and Saxe, A. M. (2017).
High-dimensional dynamics of generalization error in neural networks.
[Amodei et al., 2018]
Amodei, D., Hernandez, D., Sastry, G., Clark, J., Brockman, G., and Sutskever,
I. (2018).
Ai and compute.
Heruntergeladen von https://blog. openai. com/aiand-compute.
[Askell et al., 2021]
Askell, A., Bai, Y., Chen, A., Drain, D., Ganguli, D., Henighan, T., Jones, A.,
Joseph, N., Mann, B., DasSarma, N., Elhage, N., Hatfield-Dodds, Z.,
Hernandez, D., Kernion, J., Ndousse, K., Olsson, C., Amodei, D., Brown, T.,
Clark, J., McCandlish, S., Olah, C., and Kaplan, J. (2021).
A general language assistant as a laboratory for alignment.
[Belkin et al., 2018]
Belkin, M., Hsu, D., Ma, S., and Mandal, S. (2018).
Reconciling modern machine learning practice and the bias-variance
trade-off.
[Bi et al., 2020]
Bi, B., Li, C., Wu, C., Yan, M., Wang, W., Huang, S., Huang, F., and Si, L.
(2020).
Palm: Pre-training an autoencoding and autoregressive language model
for context-conditioned generation.
[Brown et al., 2020]
Brown, T. B., Mann, B., Ryder, N., Subbiah, M., Kaplan, J., Dhariwal, P.,
Neelakantan, A., Shyam, P., Sastry, G., Askell, A., Agarwal, S.,
Herbert-Voss, A., Krueger, G., Henighan, T., Child, R., Ramesh, A., Ziegler,
D. M., Wu, J., Winter, C., Hesse, C., Chen, M., Sigler, E., Litwin, M., Gray,
S., Chess, B., Clark, J., Berner, C., McCandlish, S., Radford, A., Sutskever,
I., and Amodei, D. (2020).
Language models are few-shot learners.
[Ganguli et al., 2022]
Ganguli, D., Hernandez, D., Lovitt, L., DasSarma, N., Henighan, T., Jones, A.,
Joseph, N., Kernion, J., Mann, B., Askell, A., Bai, Y., Chen, A., Conerly,
T., Drain, D., Elhage, N., Showk, S. E., Fort, S., Hatfield-Dodds, Z.,
Johnston, S., Kravec, S., Nanda, N., Ndousse, K., Olsson, C., Amodei, D.,
Amodei, D., Brown, T., Kaplan, J., McCandlish, S., Olah, C., and Clark, J.
(2022).
Predictability and surprise in large generative models.
[Gao et al., 2021]
Gao, L., Biderman, S., Black, S., Golding, L., Hoppe, T., Foster, C., Phang,
J., He, H., Thite, A., Nabeshima, N., Presser, S., and Leahy, C. (2021).
The pile: An 800gb dataset of diverse text for language modeling.
[Geiger et al., 2019]
Geiger, M., Spigler, S., d’Ascoli, S., Sagun, L., Baity-Jesi, M., Biroli, G.,
and Wyart, M. (2019).
Jamming transition as a paradigm to understand the loss landscape of
deep neural networks.
Physical Review E, 100(1):012115.
[Goh et al., 2021]
Goh, G., Nick, C., Chelsea, V., Carter, S., Petrov, M., Schubert, L., Radford,
A., and Olah, C. (2021).
Multimodal neurons in artificial neural networks.
Distill.
https://distill.pub/2021/multimodal-neurons.
[Henighan et al., 2020]
Henighan, T., Kaplan, J., Katz, M., Chen, M., Hesse, C., Jackson, J., Jun, H.,
Brown, T. B., Dhariwal, P., Gray, S., Hallacy, C., Mann, B., Radford, A.,
Ramesh, A., Ryder, N., Ziegler, D. M., Schulman, J., Amodei, D., and
McCandlish, S. (2020).
Scaling laws for autoregressive generative modeling.
[Hernandez et al., 2021]
Hernandez, D., Kaplan, J., Henighan, T., and McCandlish, S. (2021).
Scaling laws for transfer.
arXiv preprint arXiv:2102.01293.
[Hestness et al., 2017]
Hestness, J., Narang, S., Ardalani, N., Diamos, G., Jun, H., Kianinejad, H.,
Patwary, M. M. A., Yang, Y., and Zhou, Y. (2017).
Deep learning scaling is predictable, empirically.
[Hoffmann et al., 2022]
Hoffmann, J., Borgeaud, S., Mensch, A., Buchatskaya, E., Cai, T., Rutherford,
E., Casas, D. d. L., Hendricks, L. A., Welbl, J., Clark, A., Hennigan, T.,
Noland, E., Millican, K., Driessche, G. v. d., Damoc, B., Guy, A., Osindero,
S., Simonyan, K., Elsen, E., Rae, J. W., Vinyals, O., and Sifre, L. (2022).
Training compute-optimal large language models.
[Kaplan et al., 2020]
Kaplan, J., McCandlish, S., Henighan, T., Brown, T. B., Chess, B., Child, R.,
Gray, S., Radford, A., Wu, J., and Amodei, D. (2020).
Scaling laws for neural language models.
[Lee et al., 2021]
Lee, K., Ippolito, D., Nystrom, A., Zhang, C., Eck, D., Callison-Burch, C., and
Carlini, N. (2021).
Deduplicating training data makes language models better.
arXiv preprint arXiv:2107.06499.
[Malzahn and Opper, 2001]
Malzahn, D. and Opper, M. (2001).
A variational approach to learning curves.
In Dietterich, T., Becker, S., and Ghahramani, Z., editors, Advances in Neural Information Processing Systems, volume 14. MIT Press.
[Nakkiran et al., 2019]
Nakkiran, P., Kaplun, G., Bansal, Y., Yang, T., Barak, B., and Sutskever, I.
(2019).
Deep double descent: Where bigger models and more data hurt.
[Ouyang et al., 2022]
Ouyang, L., Wu, J., Jiang, X., Almeida, D., Wainwright, C. L., Mishkin, P.,
Zhang, C., Agarwal, S., Slama, K., Ray, A., Schulman, J., Hilton, J., Kelton,
F., Miller, L., Simens, M., Askell, A., Welinder, P., Christiano, P., Leike,
J., and Lowe, R. (2022).
Training language models to follow instructions with human feedback.
[Prato et al., 2021]
Prato, G., Guiroy, S., Caballero, E., Rish, I., and Chandar, S. (2021).
Scaling laws for the few-shot adaptation of pre-trained image
classifiers.
[Radford et al., 2021]
Radford, A., Kim, J. W., Hallacy, C., Ramesh, A., Goh, G., Agarwal, S., Sastry,
G., Askell, A., Mishkin, P., Clark, J., Krueger, G., and Sutskever, I.
(2021).
Learning transferable visual models from natural language
supervision.
[Radford et al., 2019]
Radford, A., Wu, J., Child, R., Luan, D., Amodei, D., Sutskever, I., et al.
(2019).
Language models are unsupervised multitask learners.
OpenAI blog, 1(8):9.
[Rae et al., 2021]
Rae, J. W., Borgeaud, S., Cai, T., Millican, K., Hoffmann, J., Song, F.,
Aslanides, J., Henderson, S., Ring, R., Young, S., Rutherford, E., Hennigan,
T., Menick, J., Cassirer, A., Powell, R., Driessche, G. v. d., Hendricks,
L. A., Rauh, M., Huang, P.-S., Glaese, A., Welbl, J., Dathathri, S., Huang,
S., Uesato, J., Mellor, J., Higgins, I., Creswell, A., McAleese, N., Wu, A.,
Elsen, E., Jayakumar, S., Buchatskaya, E., Budden, D., Sutherland, E.,
Simonyan, K., Paganini, M., Sifre, L., Martens, L., Li, X. L., Kuncoro, A.,
Nematzadeh, A., Gribovskaya, E., Donato, D., Lazaridou, A., Mensch, A.,
Lespiau, J.-B., Tsimpoukelli, M., Grigorev, N., Fritz, D., Sottiaux, T.,
Pajarskas, M., Pohlen, T., Gong, Z., Toyama, D., d’Autume, C. d. M., Li, Y.,
Terzi, T., Mikulik, V., Babuschkin, I., Clark, A., Casas, D. d. L., Guy, A.,
Jones, C., Bradbury, J., Johnson, M., Hechtman, B., Weidinger, L., Gabriel,
I., Isaac, W., Lockhart, E., Osindero, S., Rimell, L., Dyer, C., Vinyals, O.,
Ayoub, K., Stanway, J., Bennett, L., Hassabis, D., Kavukcuoglu, K., and
Irving, G. (2021).
Scaling language models: Methods, analysis, and insights from
training gopher.
[Vaswani et al., 2017]
Vaswani, A., Shazeer, N., Parmar, N., Uszkoreit, J., Jones, L., Gomez, A. N.,
Kaiser, L., and Polosukhin, I. (2017).
Attention is all you need.