At a glance
Intuition. Separate proposing an answer from judging it. A generator tries several solution paths, and a verifier ranks them, much like a programmer proposing candidate implementations and using a learned reviewer to choose one. Here the reviewer is probabilistic, not a proof checker or an exact unit test. More candidates buy extra chances at the cost of extra computation.
Reading the math. The verifier assigns each question–solution pair a predicted correctness score; inference selects the highest-scoring candidate. This can help only if the generator produces a correct candidate and the verifier ranks it well. A correct final-answer label does not certify every intermediate reasoning step.
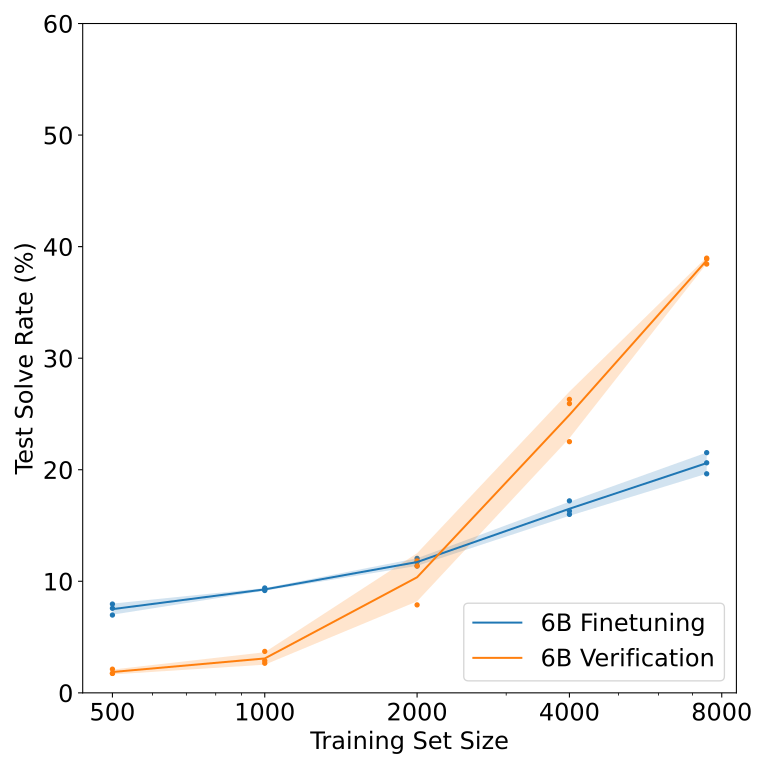
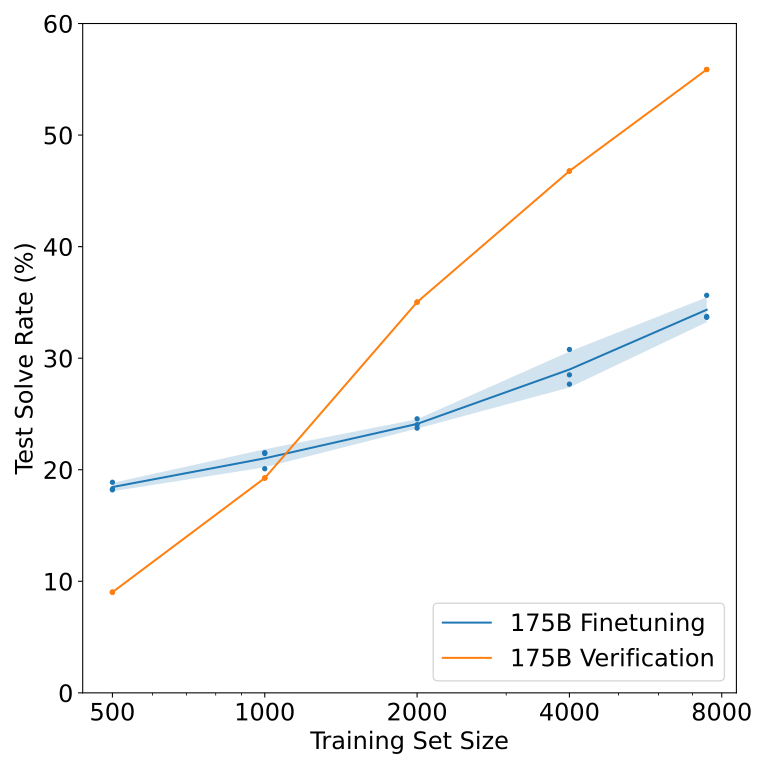
GSM8K introduces diverse grade-school word problems with natural-language solutions. The paper improves the tested GPT-3 models by sampling many solutions and using a learned verifier to choose among them. Verification becomes more useful as training data grows, but depends on generator coverage, imperfect final-answer labels and extra inference computation.
1 Introduction
A single reasoning mistake can derail an autoregressive solution. The proposed remedy separates generation from ranking: produce multiple candidates, then choose the one with the highest learned correctness score. Relative to a single-sample fine-tuning baseline, 6B verification roughly matches or exceeds 175B fine-tuning on this dataset. The “30×” comparison concerns model size and accuracy, not equal training or inference cost.
The work complements contemporary generate-and-rank methods, contributes the dataset and analyzes verifier scaling and dropout. All results are the original 2021 experiments.
2 Dataset
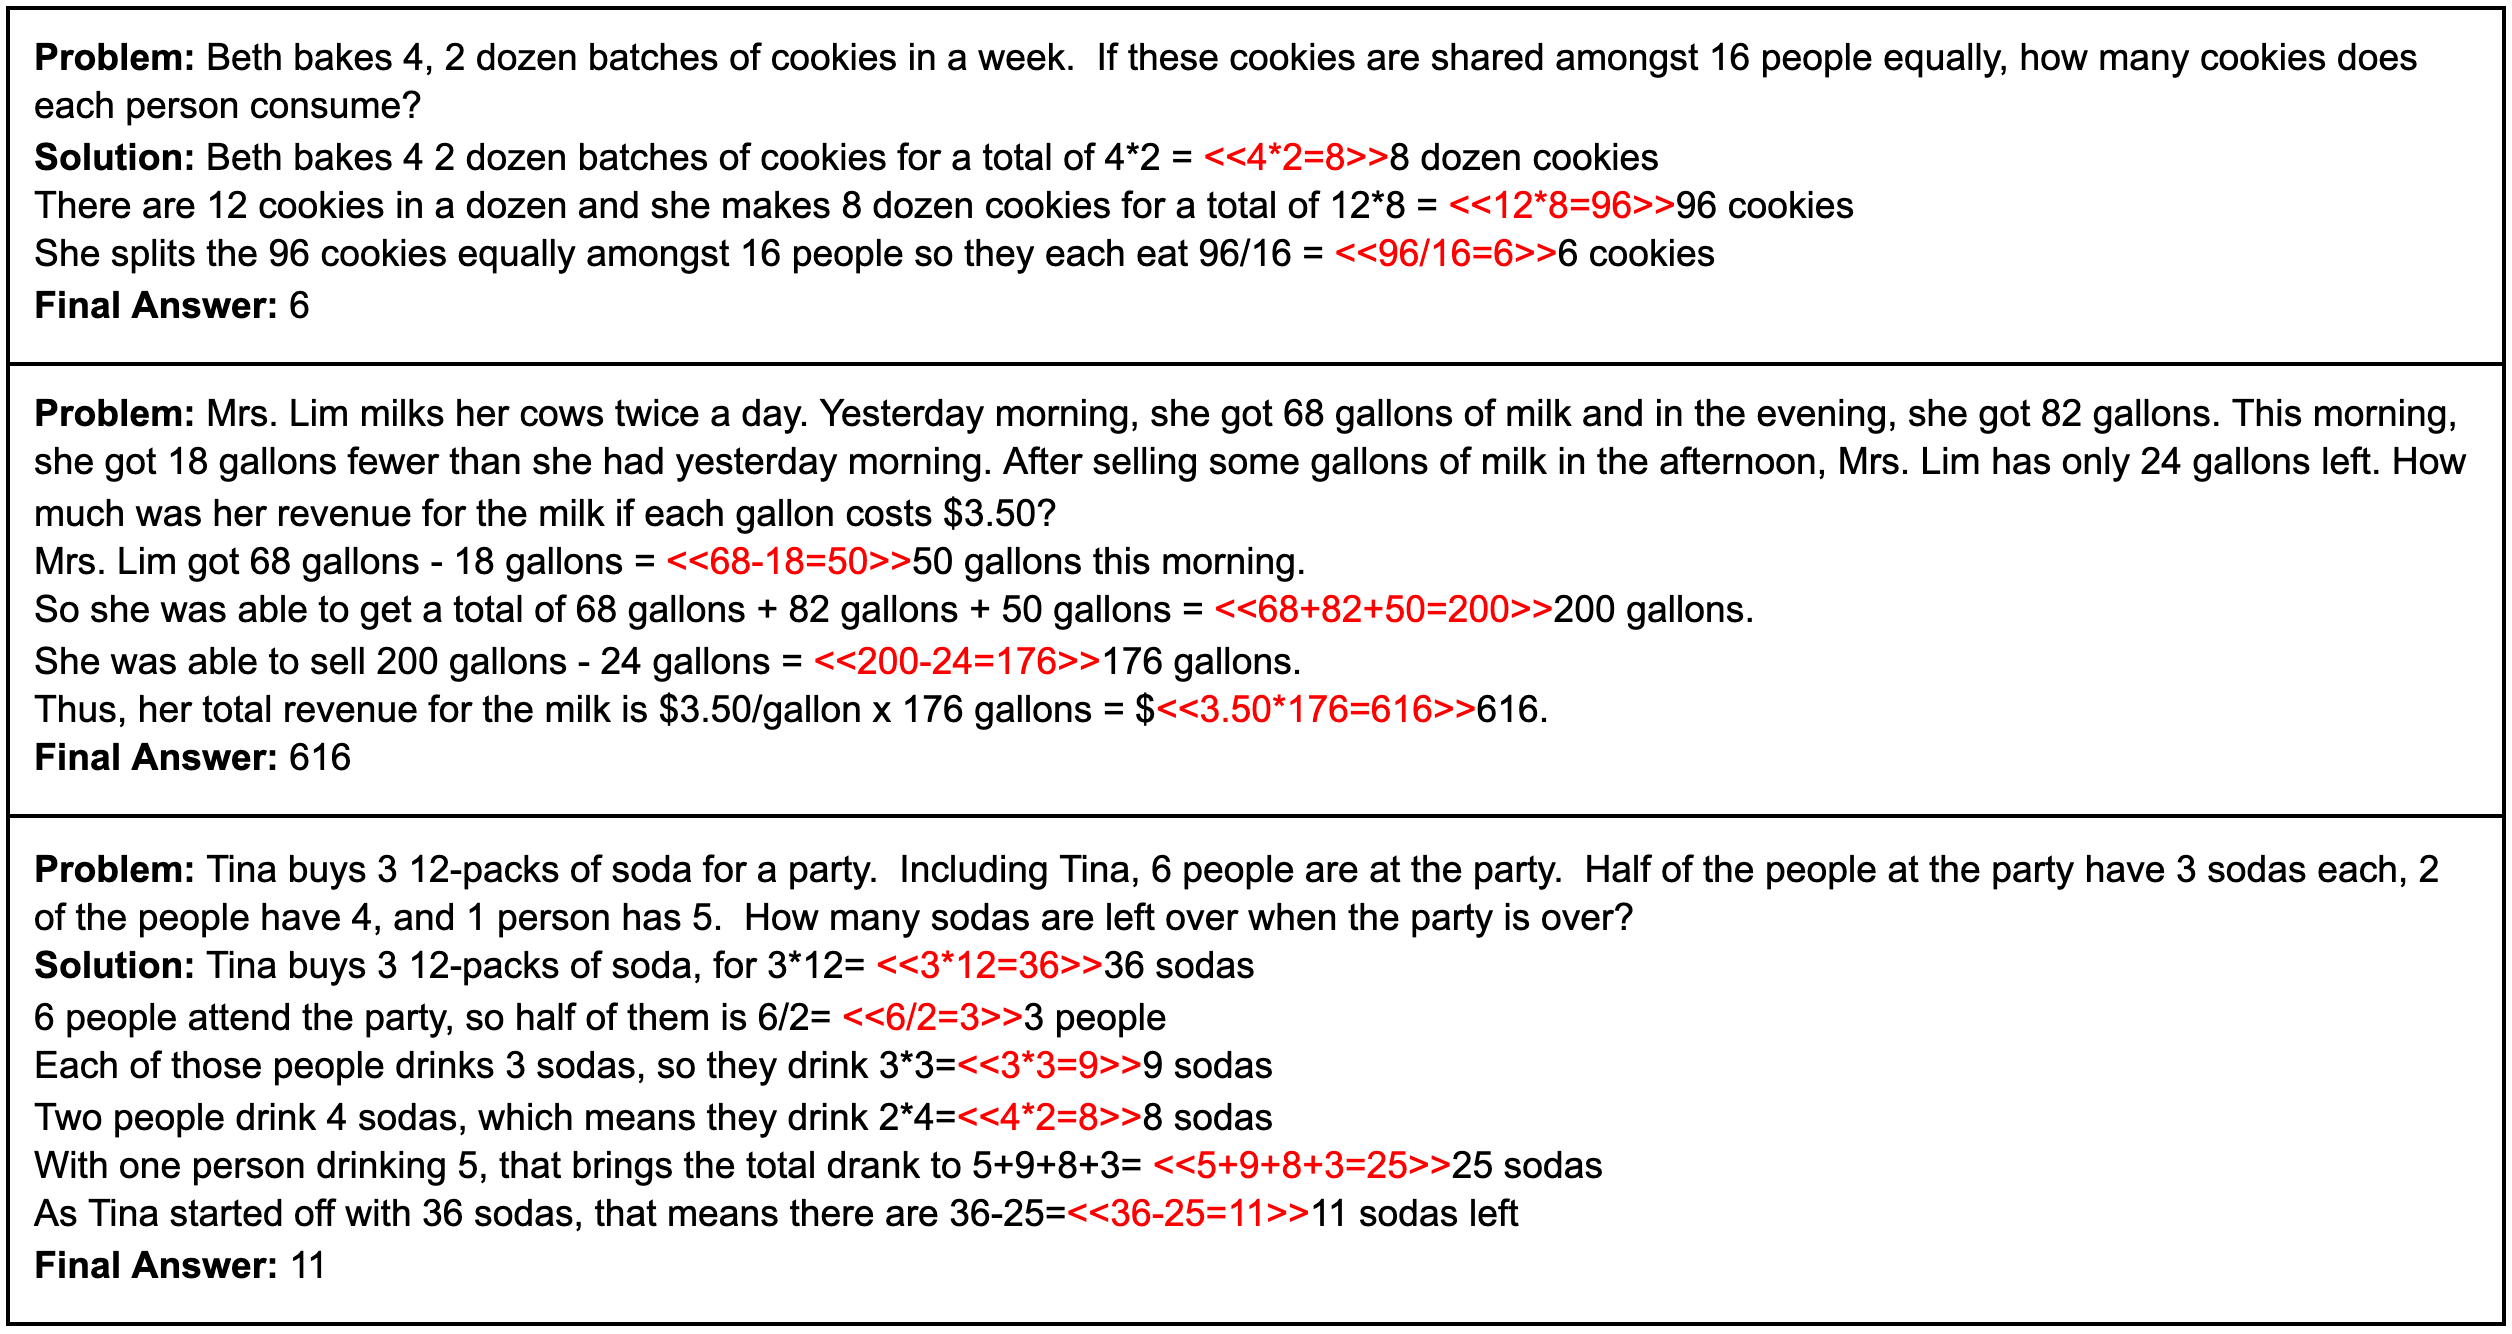
The paper describes about 8.5K human-written problems, split into roughly 7.5K training and 1K test problems. Typical solutions require 2–8 elementary arithmetic steps, with linguistic diversity prioritized over reusable templates. Natural-language explanations accompany final answers. The aim is moderate conceptual difficulty with varied phrasing, not a comprehensive test of mathematics.
Agreement checks suggest fewer than 2% breaking errors, but the appendix allows subtler mistakes. Writers could use GPT-3-generated seeds, modify them or invent their own questions; “human-written” does not mean every problem was conceived without model assistance.
3 Related Work
The related-work comparison separates dataset diversity and solution format from the choice of generation, pretraining or ranking method.
3.1 Related Datasets
Earlier word-problem datasets vary in size, templating, language and solution annotations. GSM8K emphasizes diverse English questions and explanatory solutions; MATH tests substantially more advanced material. Dataset-size and quality comparisons are the authors’ contemporary assessments. Background knowledge and reading comprehension remain part of GSM8K’s difficulty.
3.2 Related Methods
Prior work uses sequence models, specialized mathematical architectures, pretrained encoders and extra mathematical pretraining. Sample-and-rank methods also appear in storytelling and concurrent math research. This paper emphasizes natural-language solutions, data scaling and separate generator/verifier networks, keeping generator training short to preserve candidate diversity.
4 Methods
The baseline fine-tunes a GPT-3-family model and returns one low-temperature solution. Verification instead samples multiple higher-temperature solutions and selects the largest learned score. Both use calculator annotations, so the reported system includes external arithmetic assistance. Verifier labels depend only on final-answer equality and can mark flawed reasoning as correct.
4.1 Finetuning
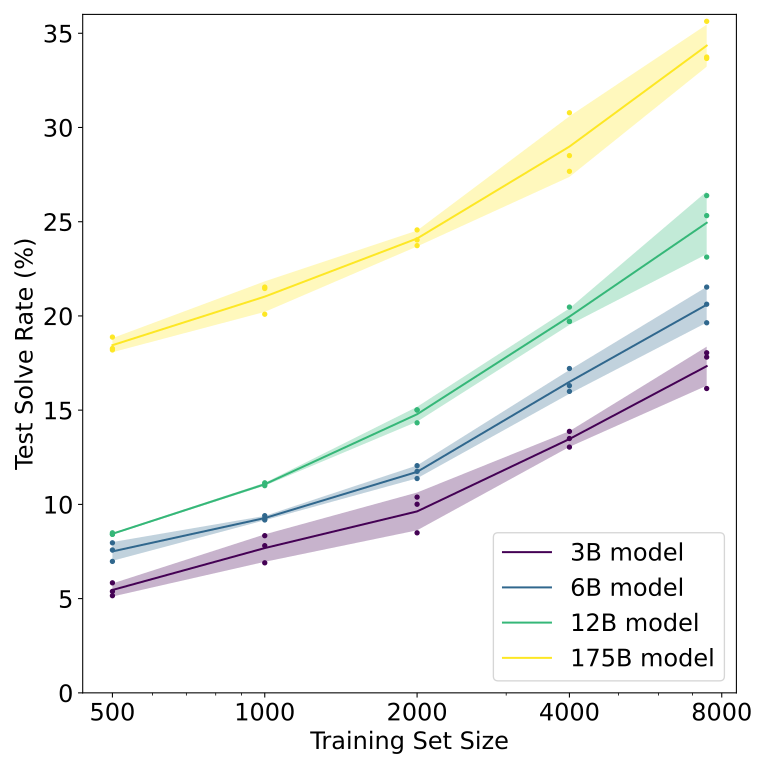
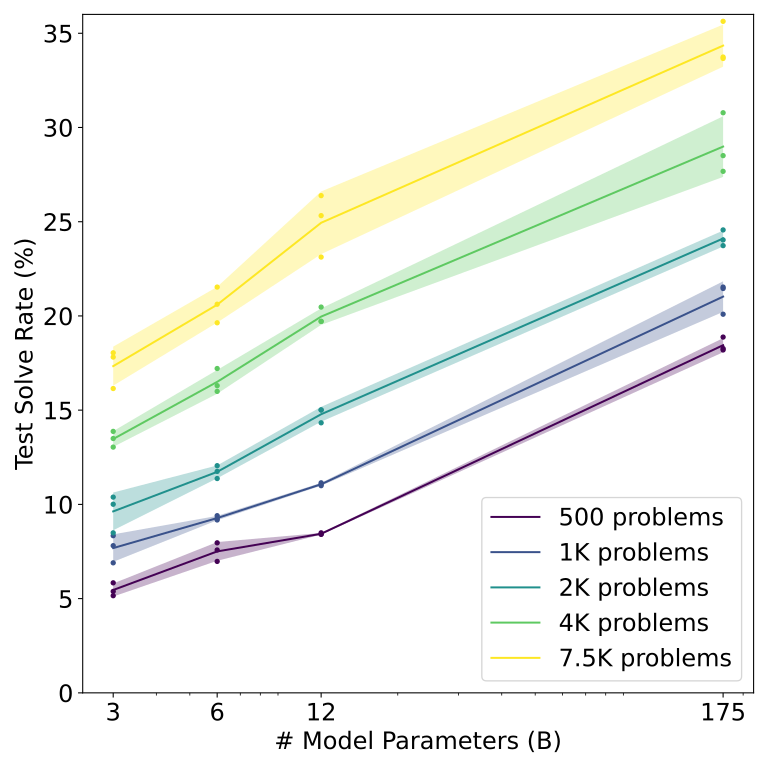
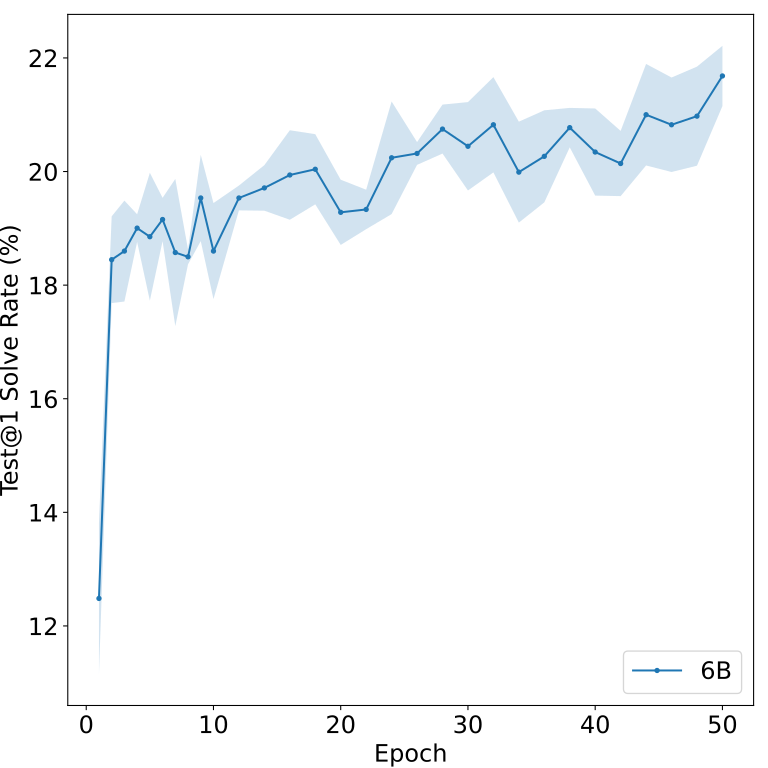
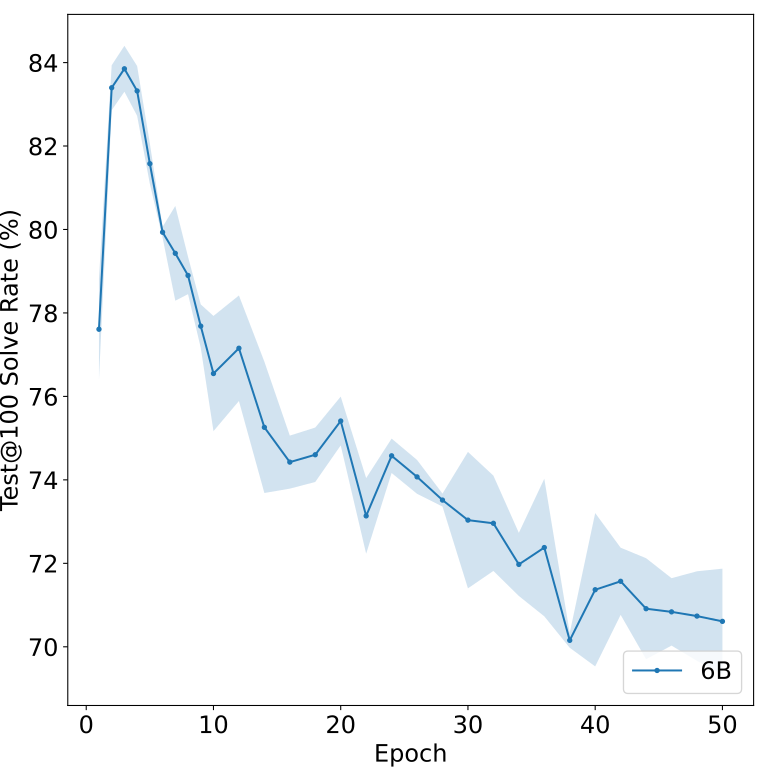
The baseline minimizes token cross-entropy. Larger models perform better, but naive log-linear extrapolation to 80% accuracy yields an implausibly large parameter requirement; this extrapolation is a motivation, not a reliable forecast. Training longer can improve greedy test@1 while hurting test@100, the fraction with at least one correct candidate among 100 samples. Test@100 is an oracle coverage measure, not directly deployable selected-answer accuracy.
The generator is therefore trained for only two epochs before making verifier data. Suppressing intermediate explanation and predicting only an answer lowers the 6B result from 20.6% to 5.2% in this comparison, supporting the usefulness of the solution format under this training protocol.
4.2 Verification
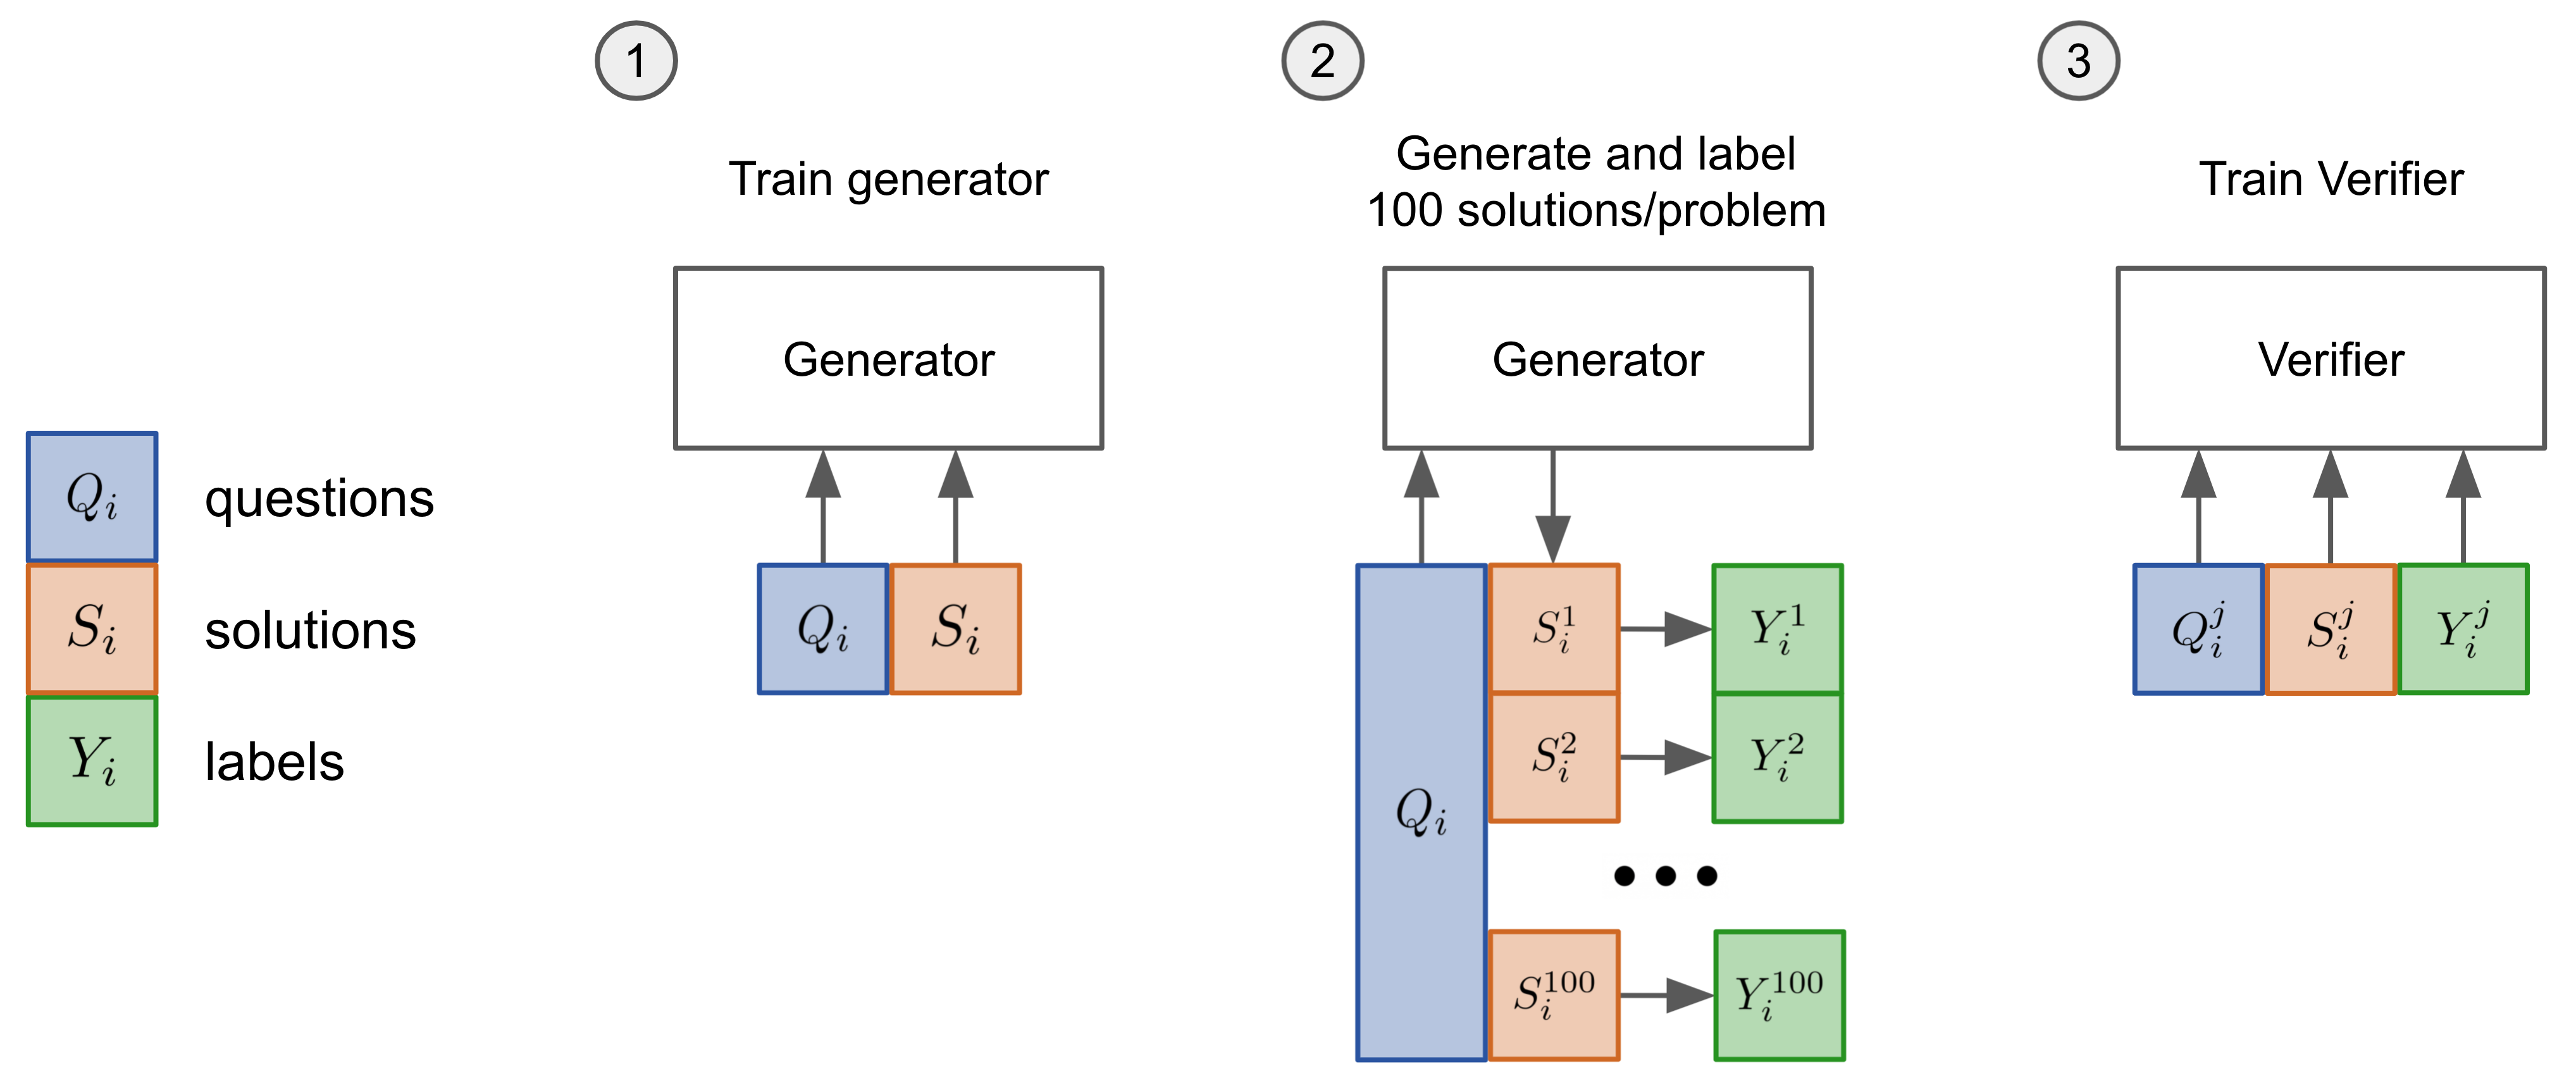
Train a generator for two epochs, sample 100 solutions per training problem, label their final answers and train a separate verifier for one epoch. At test time rank 100 samples and return the top one. The verifier also learns an auxiliary language-model objective. Small datasets can encourage answer memorization before useful reasoning discrimination develops; with enough data the benefit becomes substantial.
Figure 5 averages three runs except 175B verification, which has only one run. Generator and verifier are normally the same size; their two-model training and 100-candidate search differ materially from the single-sample baseline.
4.3 Verification Ablations
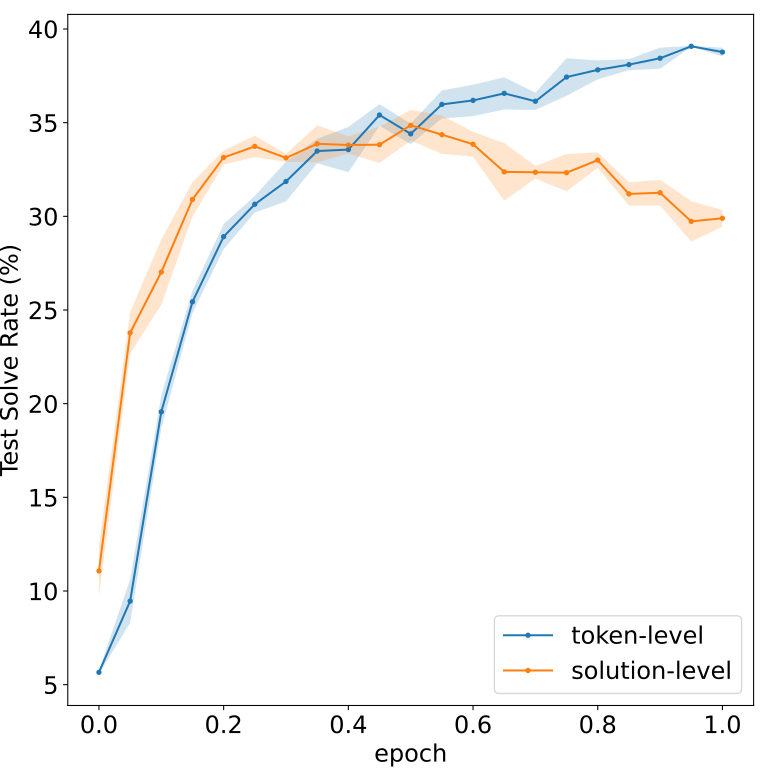
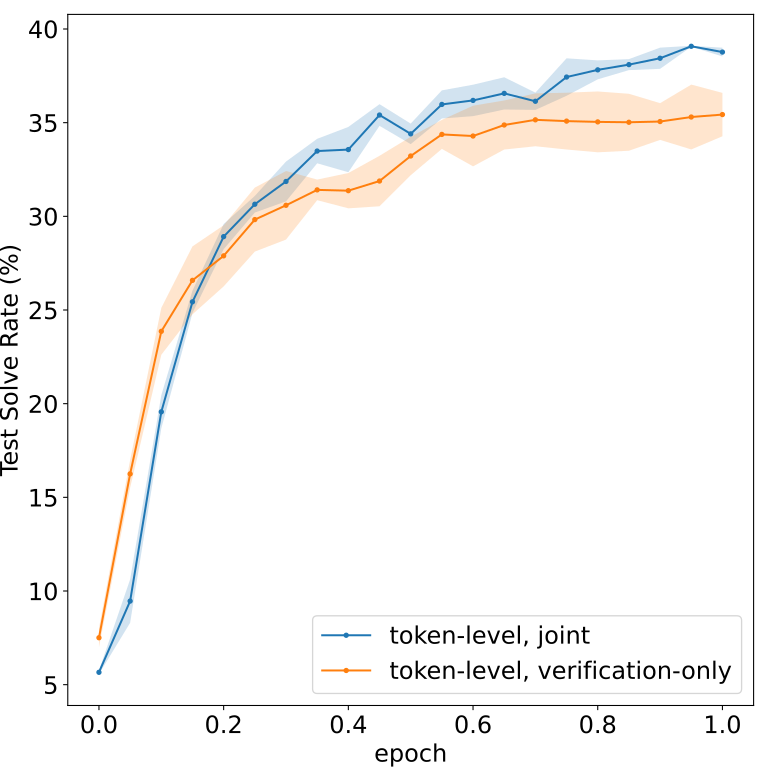
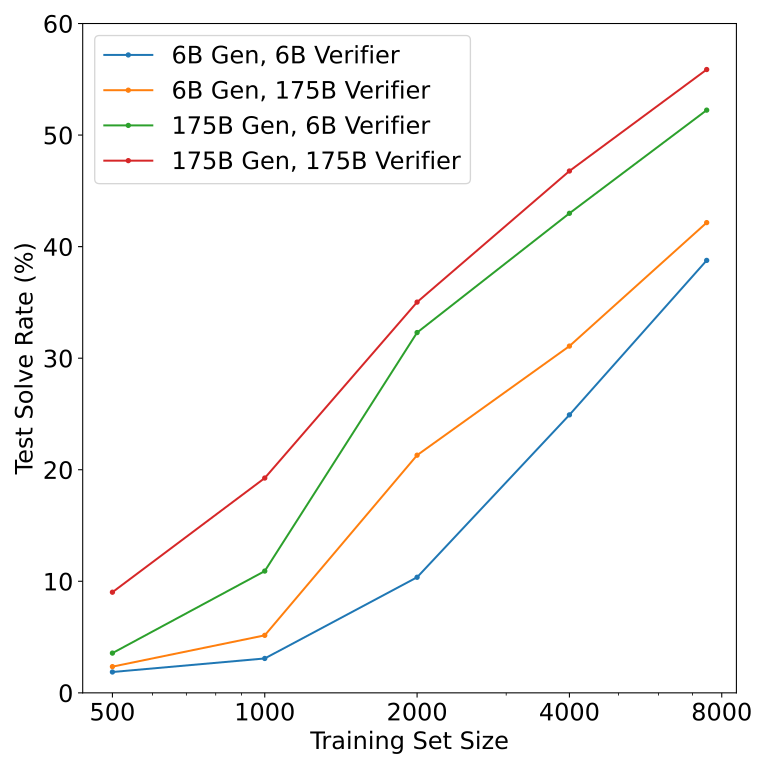
A token-level verifier predicts the eventual final-answer label after every prefix. It ultimately outperforms a solution-end-only head and overfits less in the reported ablation. These are repeated outcome labels, not human judgments that each intermediate step is correct. Adding the language-model loss further helps. A larger generator with a small verifier works better than the reverse, indicating that candidate quality and coverage are major constraints; coarse ranking heuristics may suffice without formal proof checking.
5 Additional Experiments
The additional experiments vary inference search and regularization rather than treating verifier size as the only route to improvement.
5.1 Test Time Compute
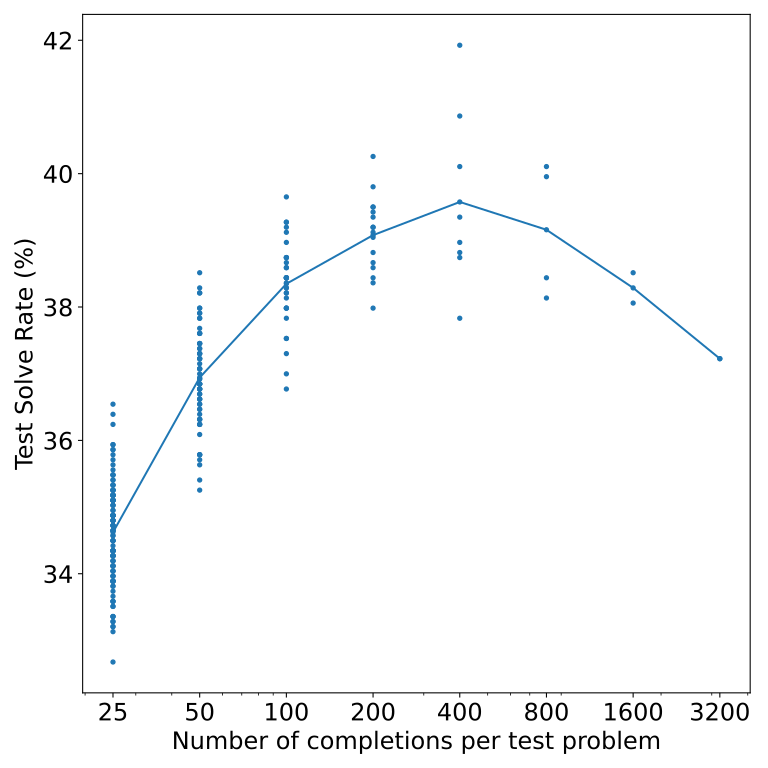
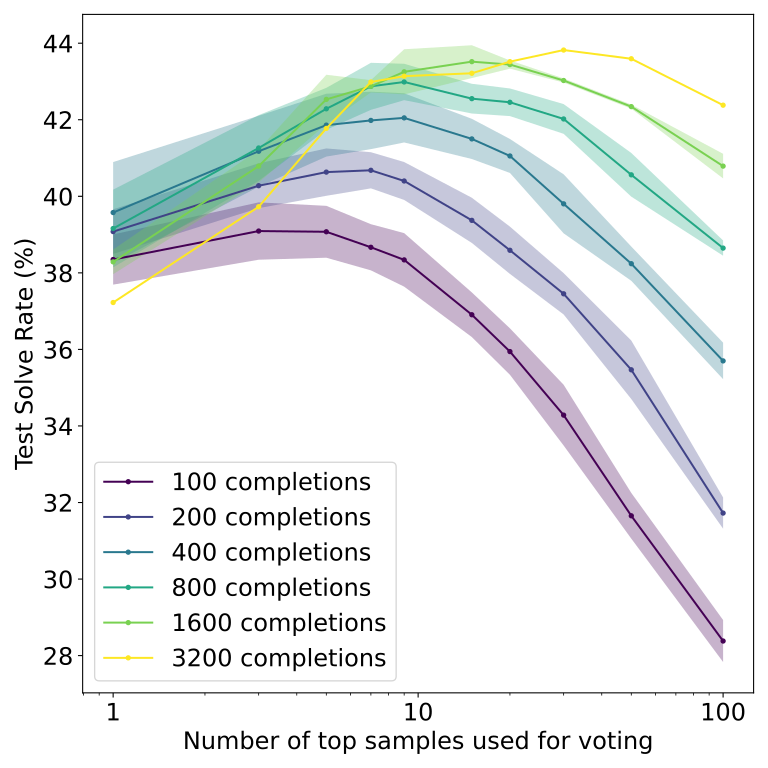
For the tested 6B verifier, selected-answer accuracy improves up to roughly 400 candidates and then declines, consistent with search increasingly finding verifier mistakes. The usual 100-candidate setting captures much of the benefit. Voting among top-ranked final answers can help: about 3–5 voters works best with 100 candidates, while about 30 works well with 3,200 candidates. These are empirical optima in this experiment, not universal search budgets.
5.2 Regularization
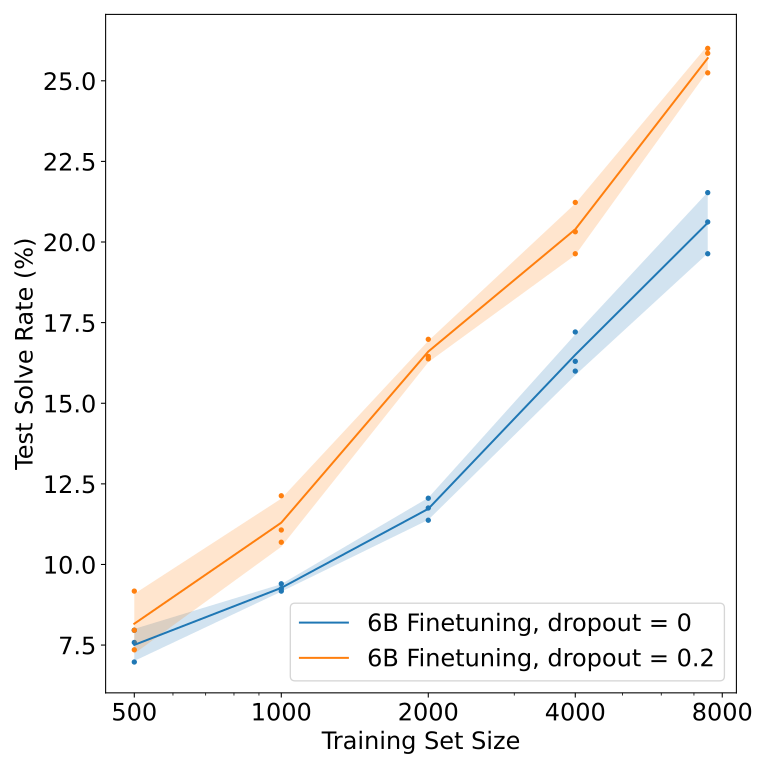
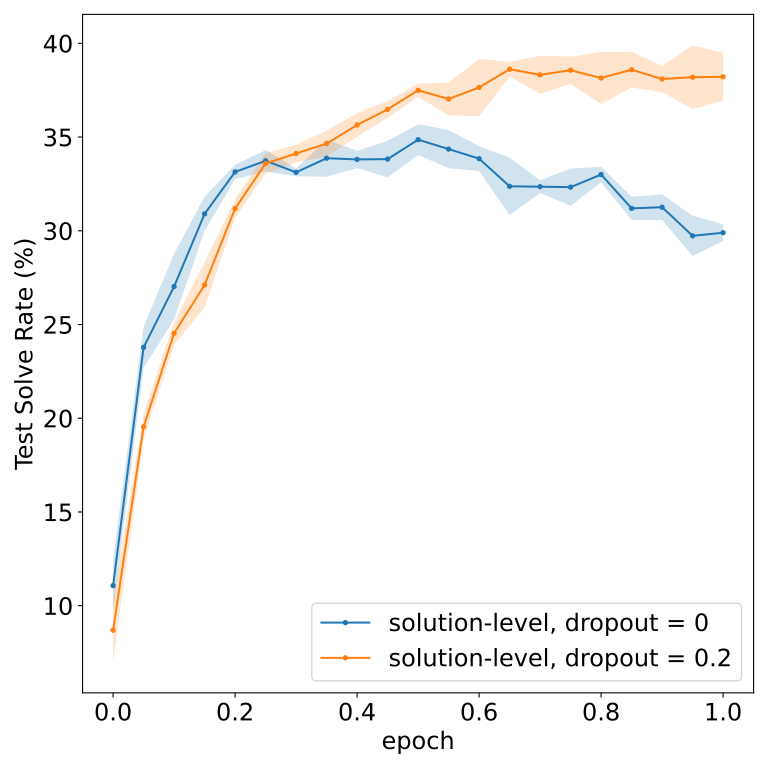
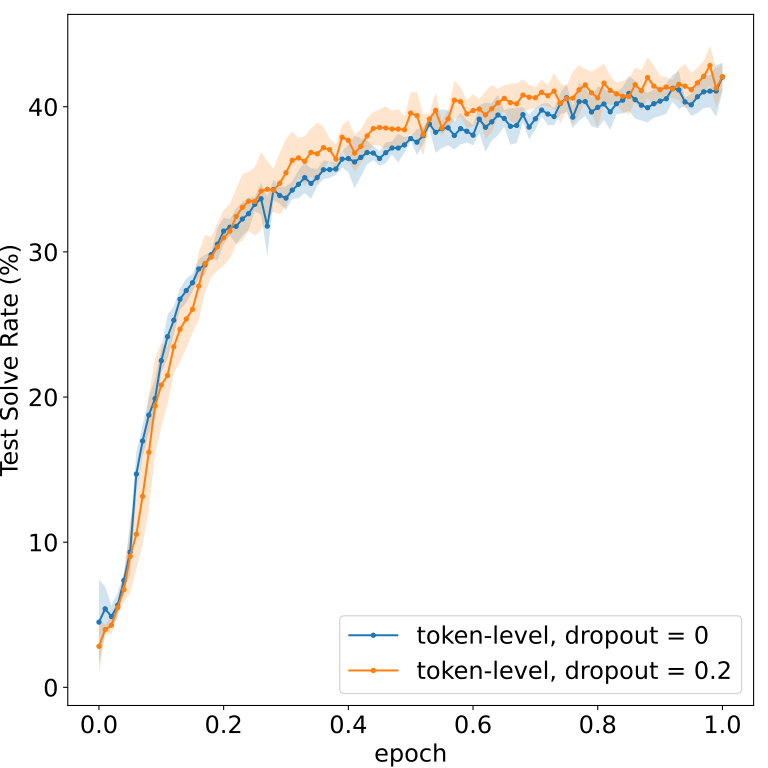
Residual dropout of 20% improves fine-tuning and especially solution-level verification. Since the initial GPT-3 models lacked dropout, these runs first receive additional pretraining with dropout to reduce distribution shift; the intervention includes that extra training. Token-level verifiers gain less because they already overfit less. Their dropout experiment also changes batch size by 4× and uses 300 training/test completions, as the original table caption specifies, so it is not a one-variable comparison.
6 Conclusion
Learned verification offers a substantial accuracy gain on GSM8K, particularly with adequate training data. The gain trades extra models and candidate computation for better selection. Token-level targets and regularization help generalization, but the results do not establish reliable reasoning verification or scaling to all harder mathematical domains.
Acknowledgements
The authors acknowledge research feedback, technical and infrastructure support from OpenAI, and Surge AI’s dataset collection work.
Appendix A Dataset Details
Freelance writers first produced about 1,000 problems, then Surge AI expanded collection. Different workers independently re-solved questions; disagreements led to repair or removal. A later subset check still found 1.7% disagreement, used as an estimate of breaking errors or ambiguity rather than a guarantee of full correctness. GPT-3 seed questions and pairwise-similarity feedback supported writing while discouraging reused templates.
Appendix B Hyperparameters
The original hyperparameter table is retained, including separate fine-tuning and verification settings. Reported learning-rate/batch-size sweeps found no significant improvement within the explored ranges. Alternative verifier temperature 1.0 and cross-entropy loss performed similarly in their ablations. The table’s exceptions matter: Figure 8c uses 4× tokens per batch and 300 completions at training and test time; standard verification uses 100.
| General Hyperparameters | Value |
|---|---|
| Batch Size | tokens |
| Max Sample Length | 400 tokens |
| Tokenization | reversible_50000 |
| Optimizer | Adam, , |
| Dropout | |
| Learning Rate Schedule | Linear decay to 0 |
| Finetuning Hyperparameters | Value |
| Epochs | 20 |
| Sampling Temperature | 0 (argmax) |
| Base Learning Rate () | (3B) |
| (6B) | |
| (12B) | |
| (175B) | |
| Learning Rate | |
| Verification Hyperparameters | Value |
| Epochs | 2 for generator, 1 for verifier |
| Sampling Temperature | |
| Learning Rate | |
| Loss weight | |
| Verifier loss | MSE |
| Completions per train problem | 100 |
| Completions per test problem | 100 |
Appendix C Calculator Annotations
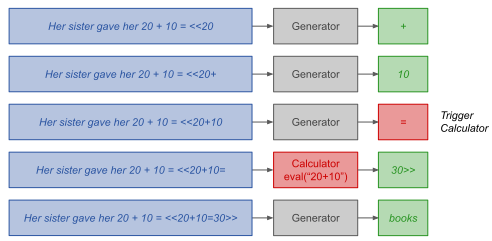
Calculator annotations are generated by heuristics and a fine-tuned model, with some eligible calculations omitted. During training they are ordinary tokens. At inference, a well-formed annotation triggers replacement of the result after “=” inside <<…>>; failures fall back to normal sampling. This describes the paper’s experiment, not a recommendation to execute arbitrary expressions.
The authors disclose minor bugs in the calculator used for all reported results. Fixing them raises full-data verification accuracy by about one percentage point, with changes below 1% in most experiments; the retained figures remain the original reported results.
Appendix D Example Model Solutions
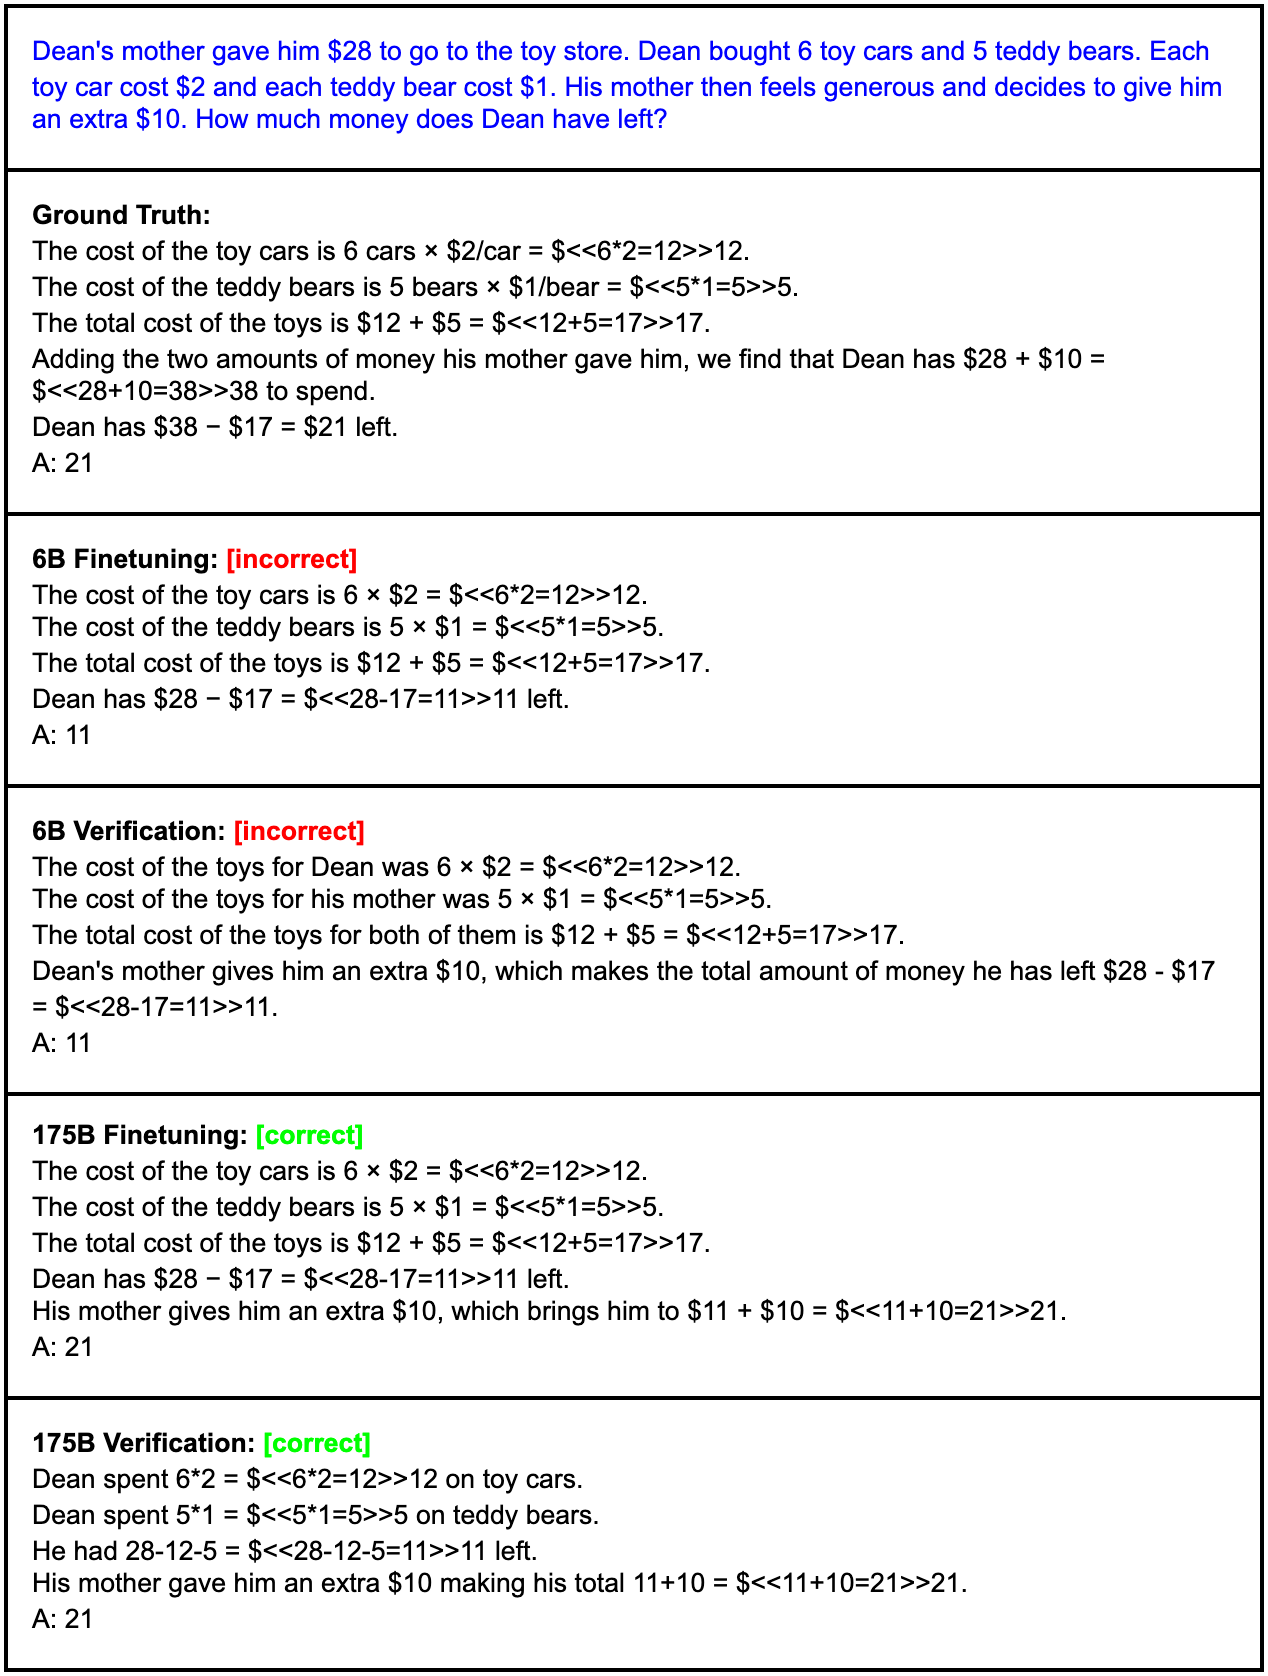
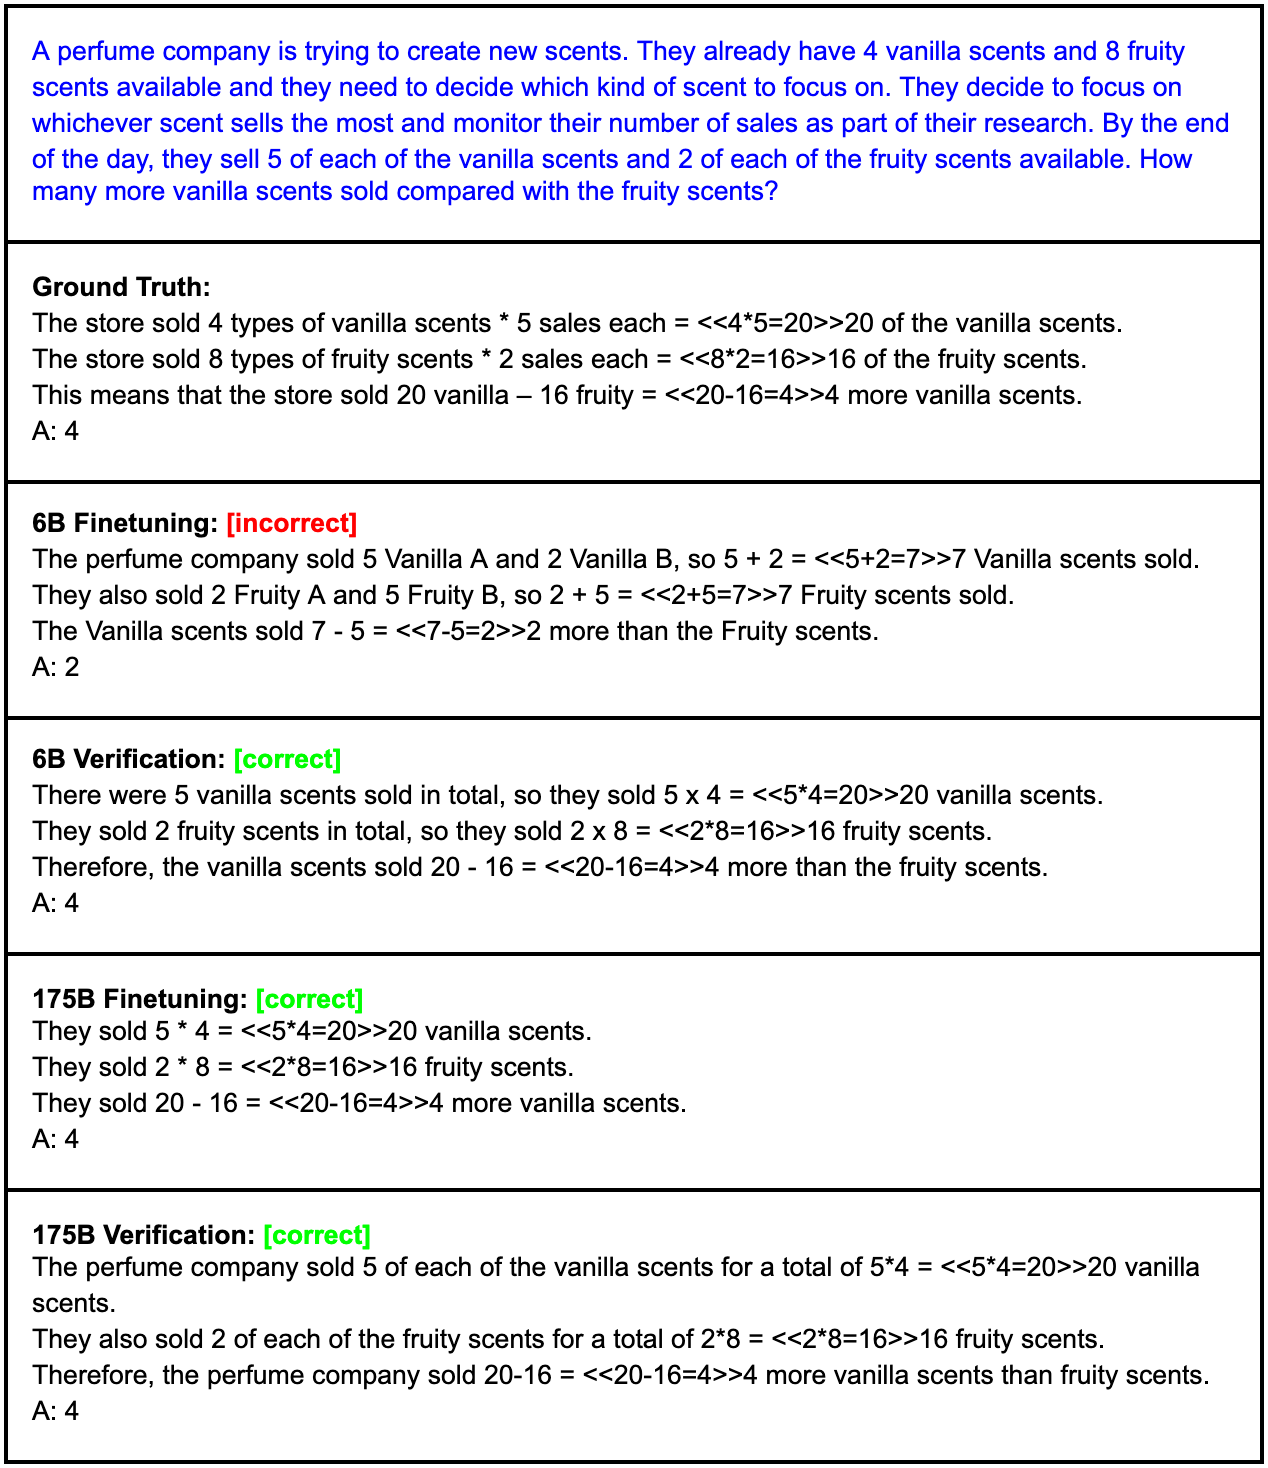
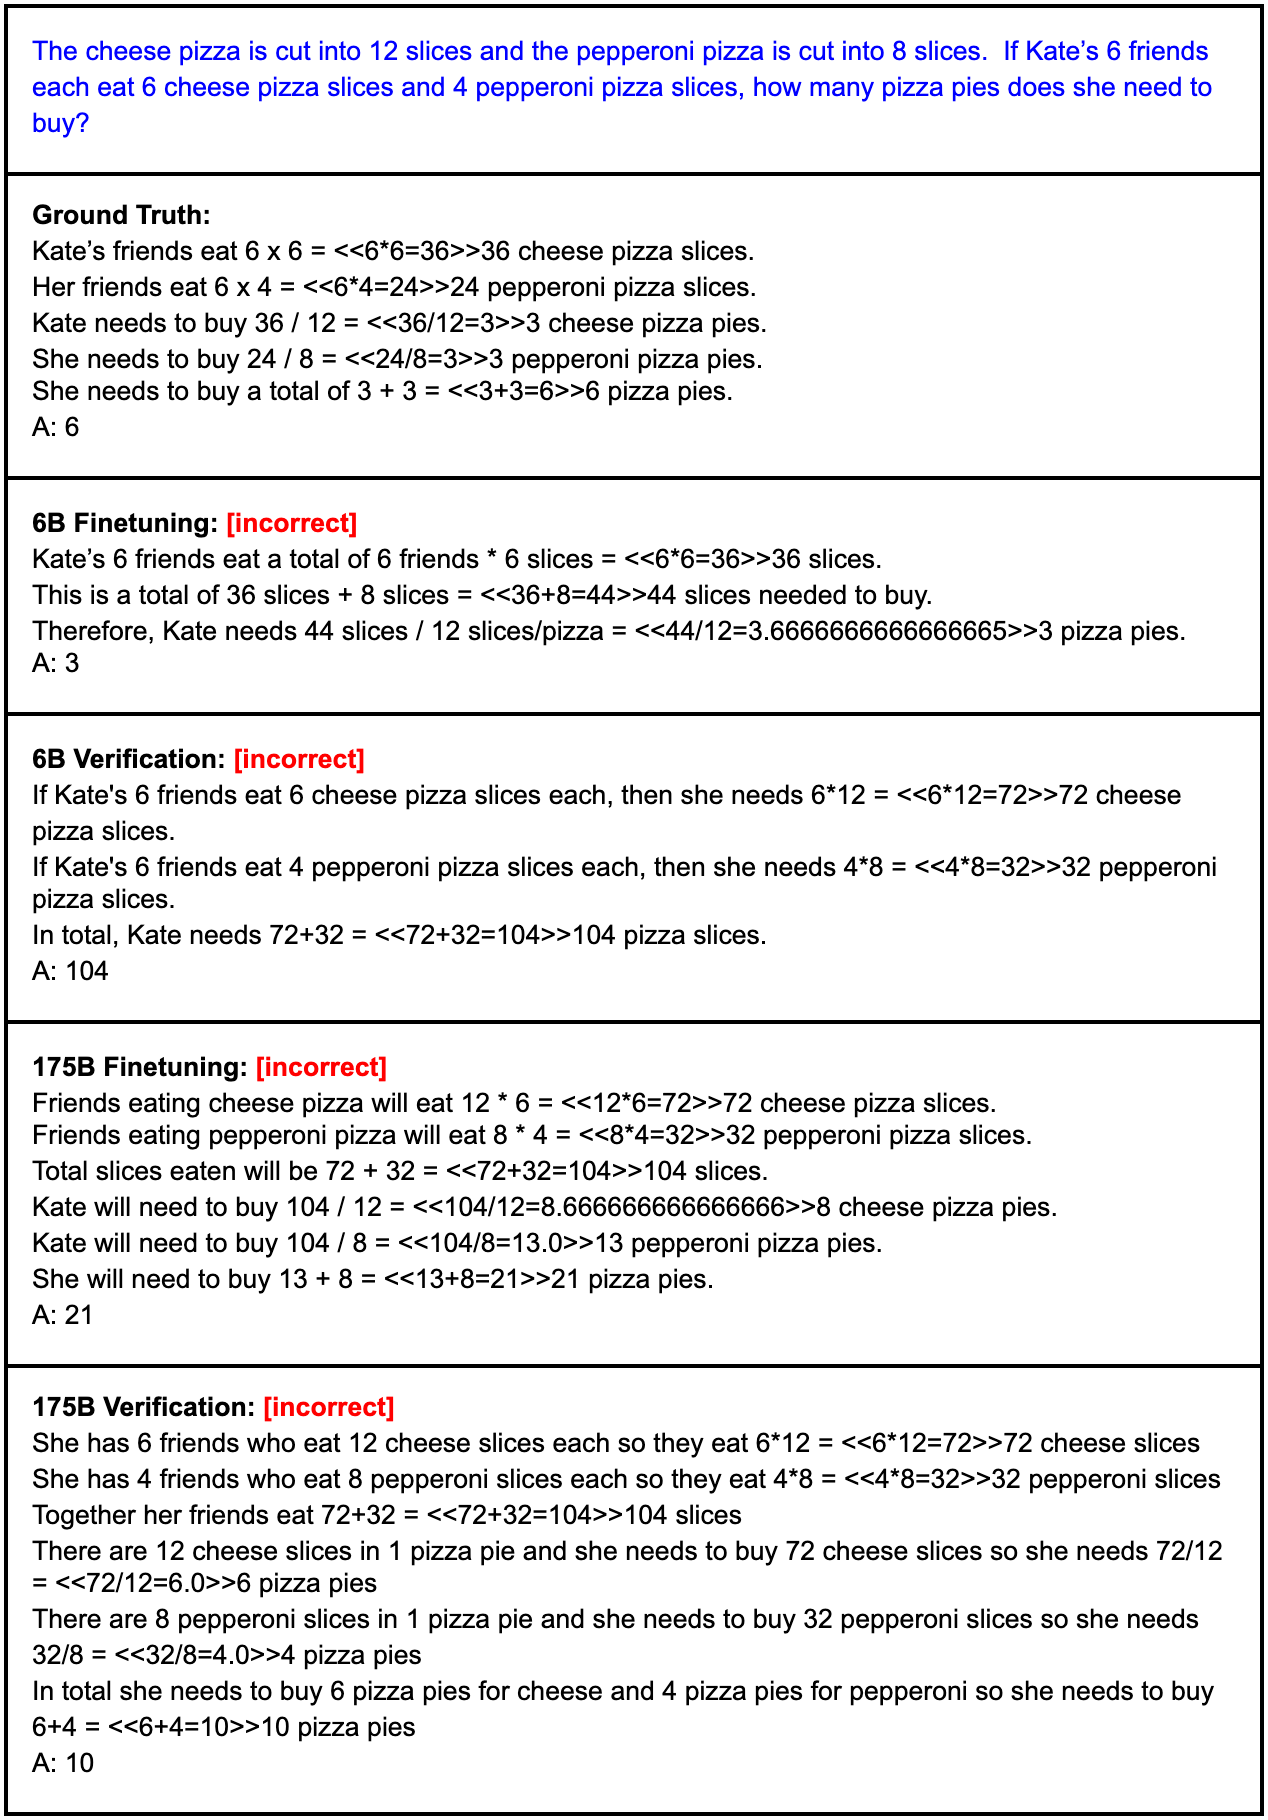
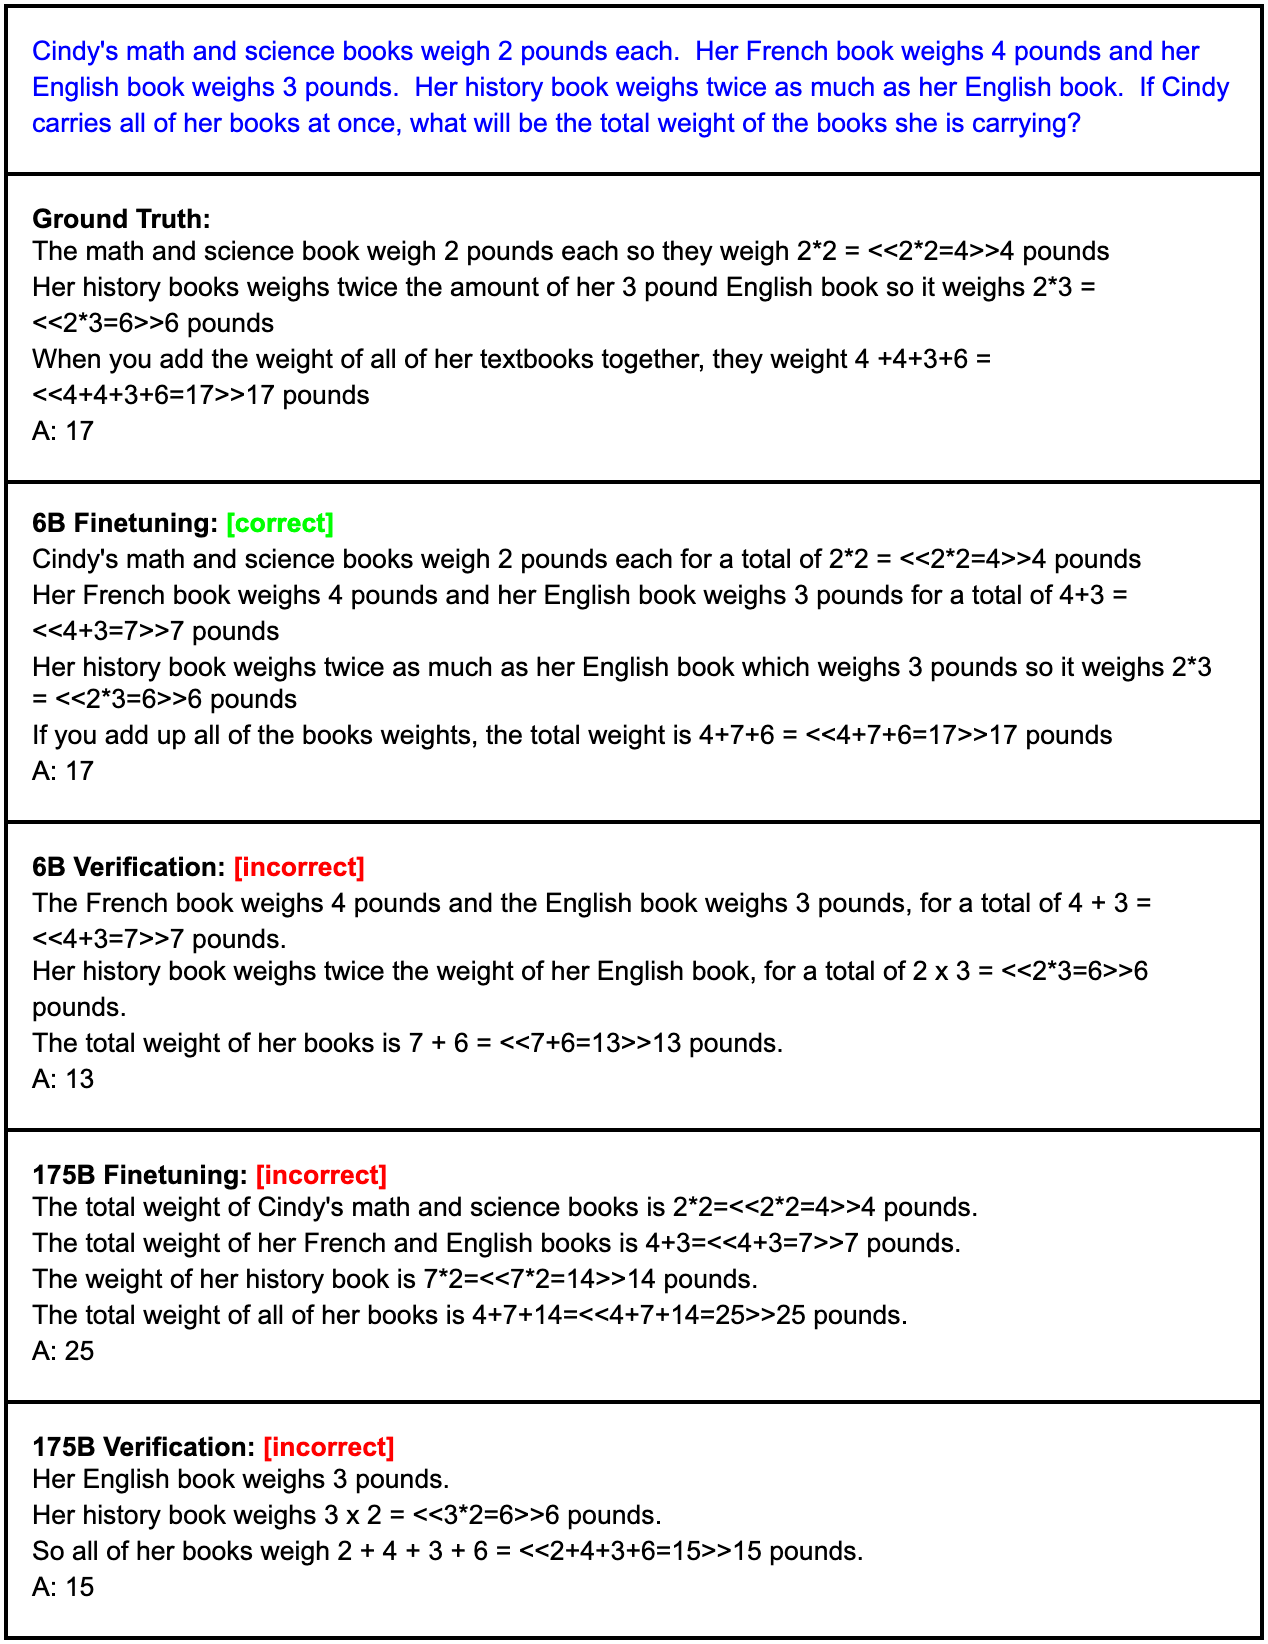
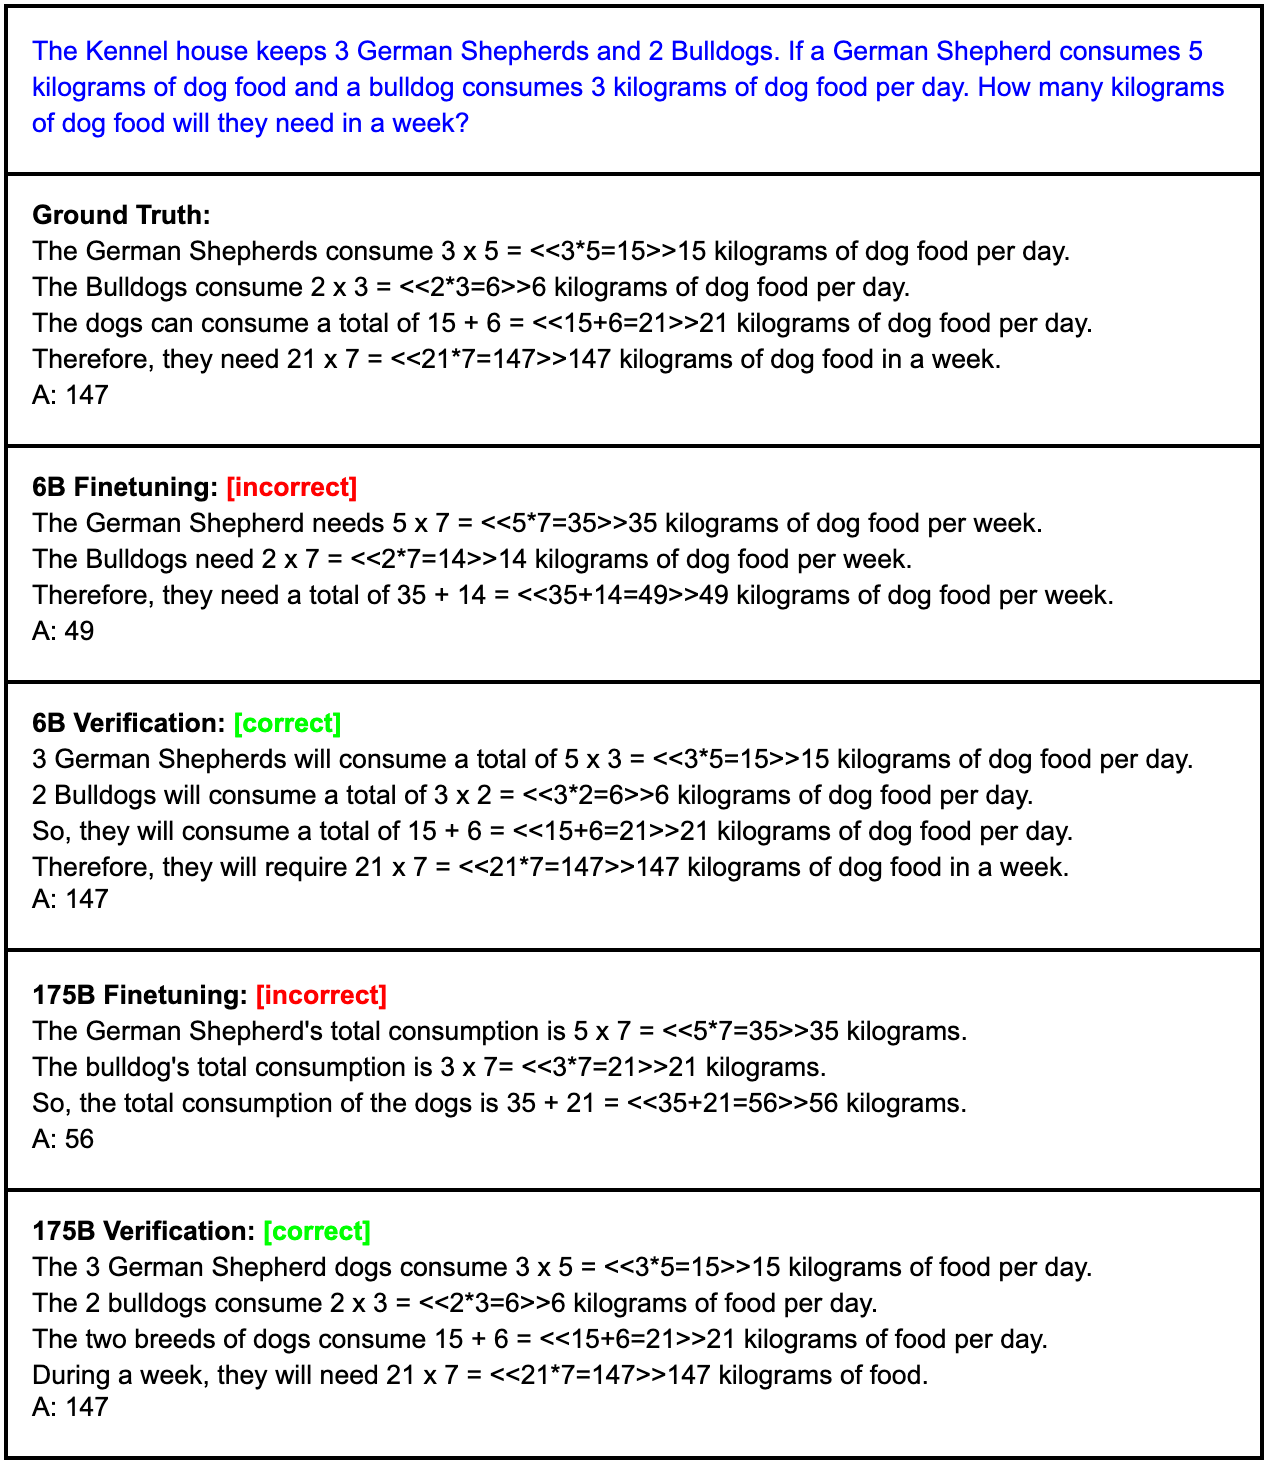
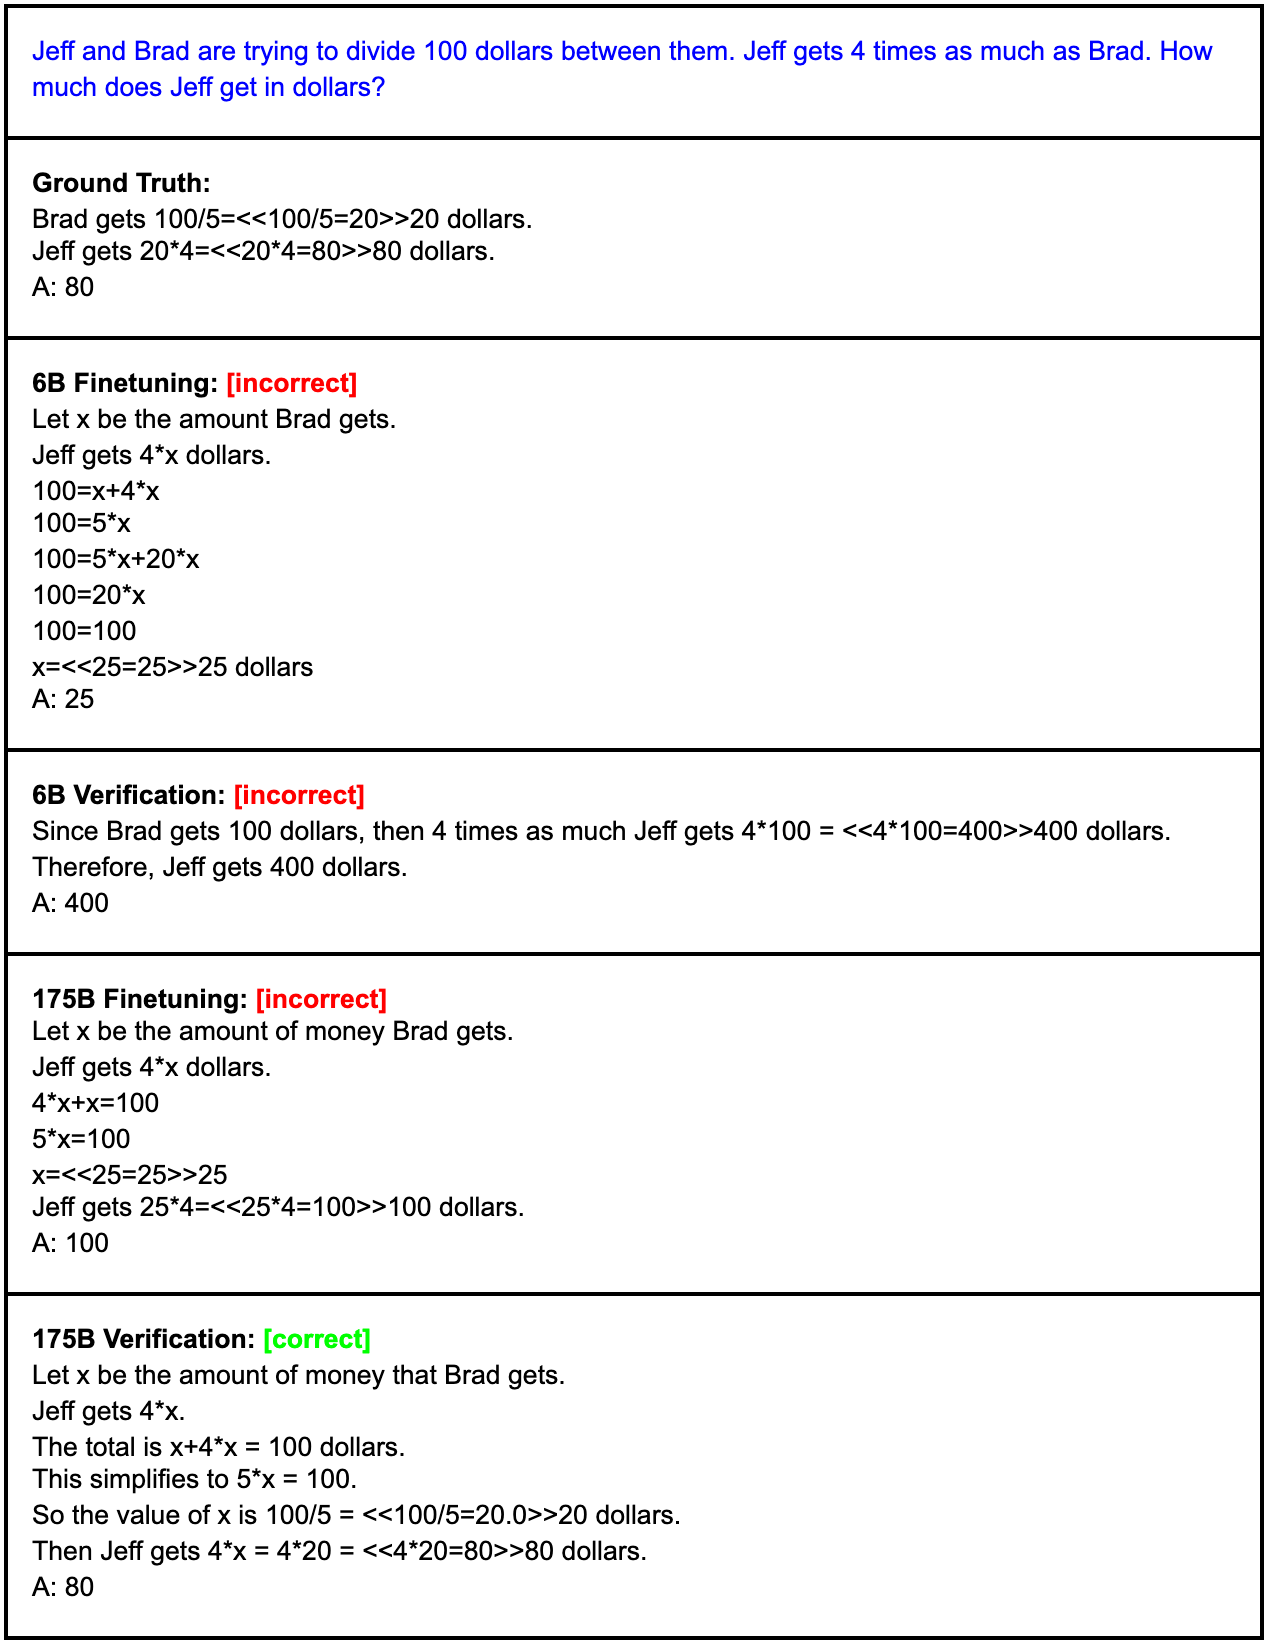
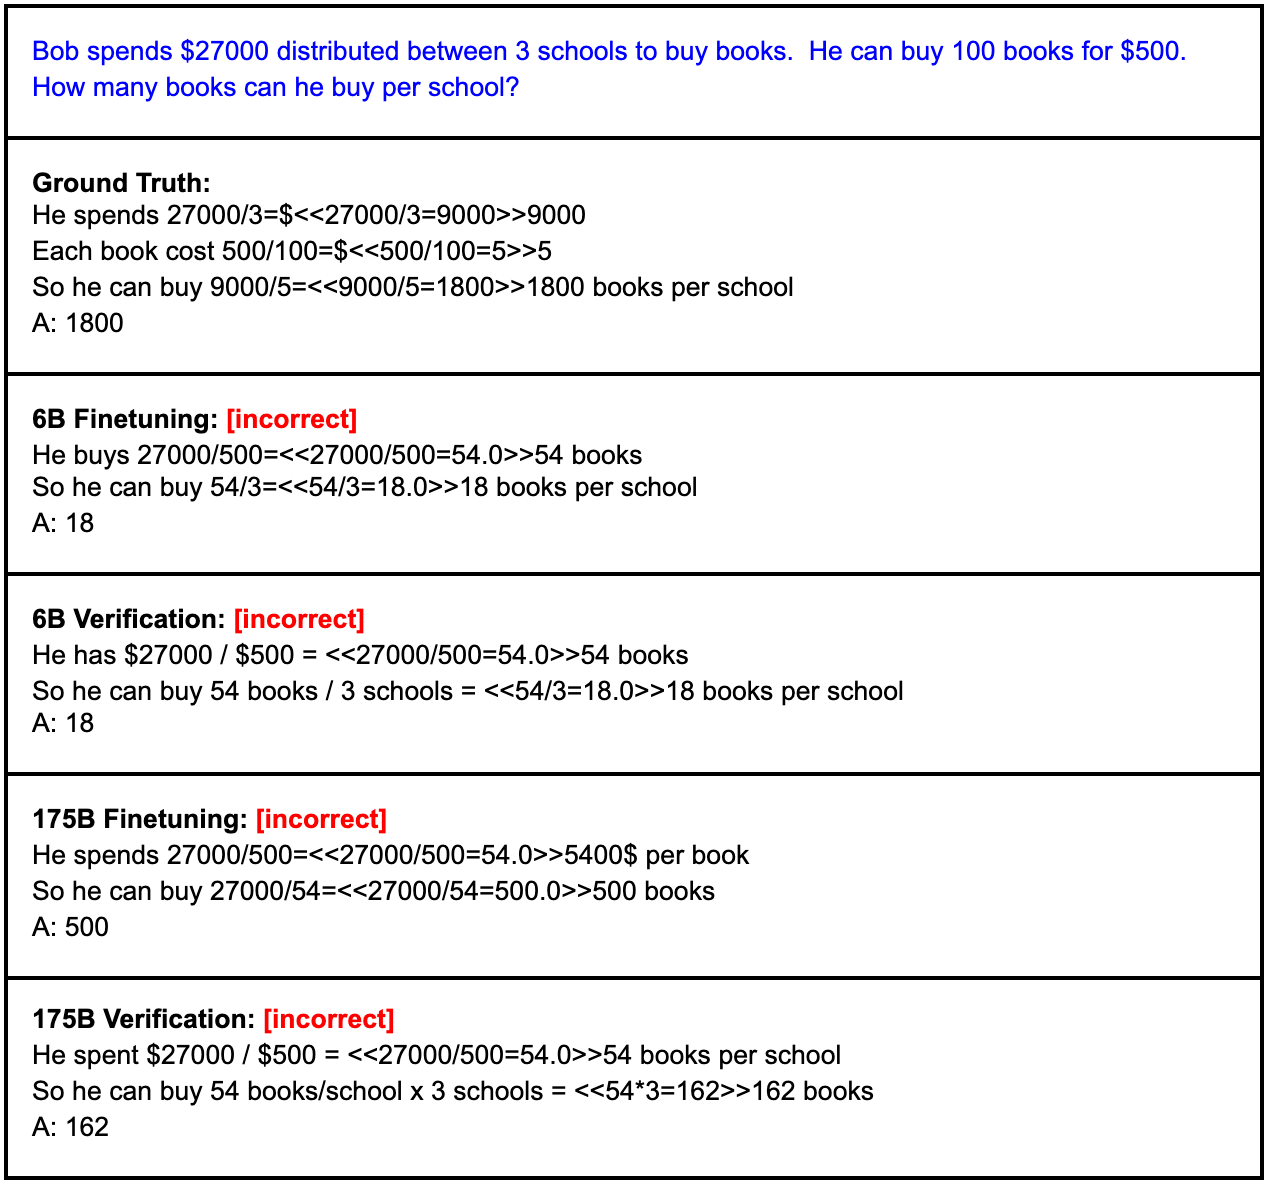
The eight complete example panels compare ground truth, 6B/175B fine-tuning and 6B/175B verification. The authors selected them partly for diversity, so they illustrate error patterns and successes without estimating their prevalence. All original colored correctness labels and solution text remain intact.

Appendix E Verifier Details
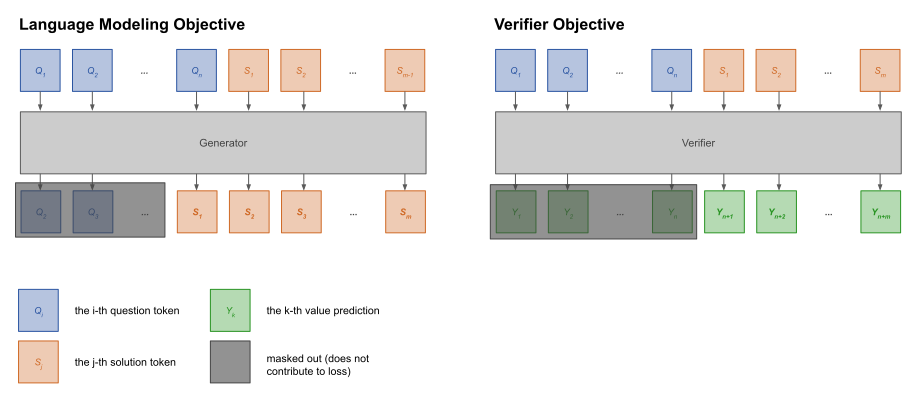
The verifier adds a scalar prediction through a bias and gain applied to a reserved vocabulary-token logit, leaving other logits available for language modeling. Initialization from the corresponding two-epoch generator works slightly better in their ablation. Joint training mixes original language solutions and verifier examples equally; because each problem yields 100 verifier completions, this effectively upsamples the original language data 100-fold. Losses are added without extra weighting, and an epoch means seeing each verifier example once. Both objectives mask question tokens and train only on solution tokens.
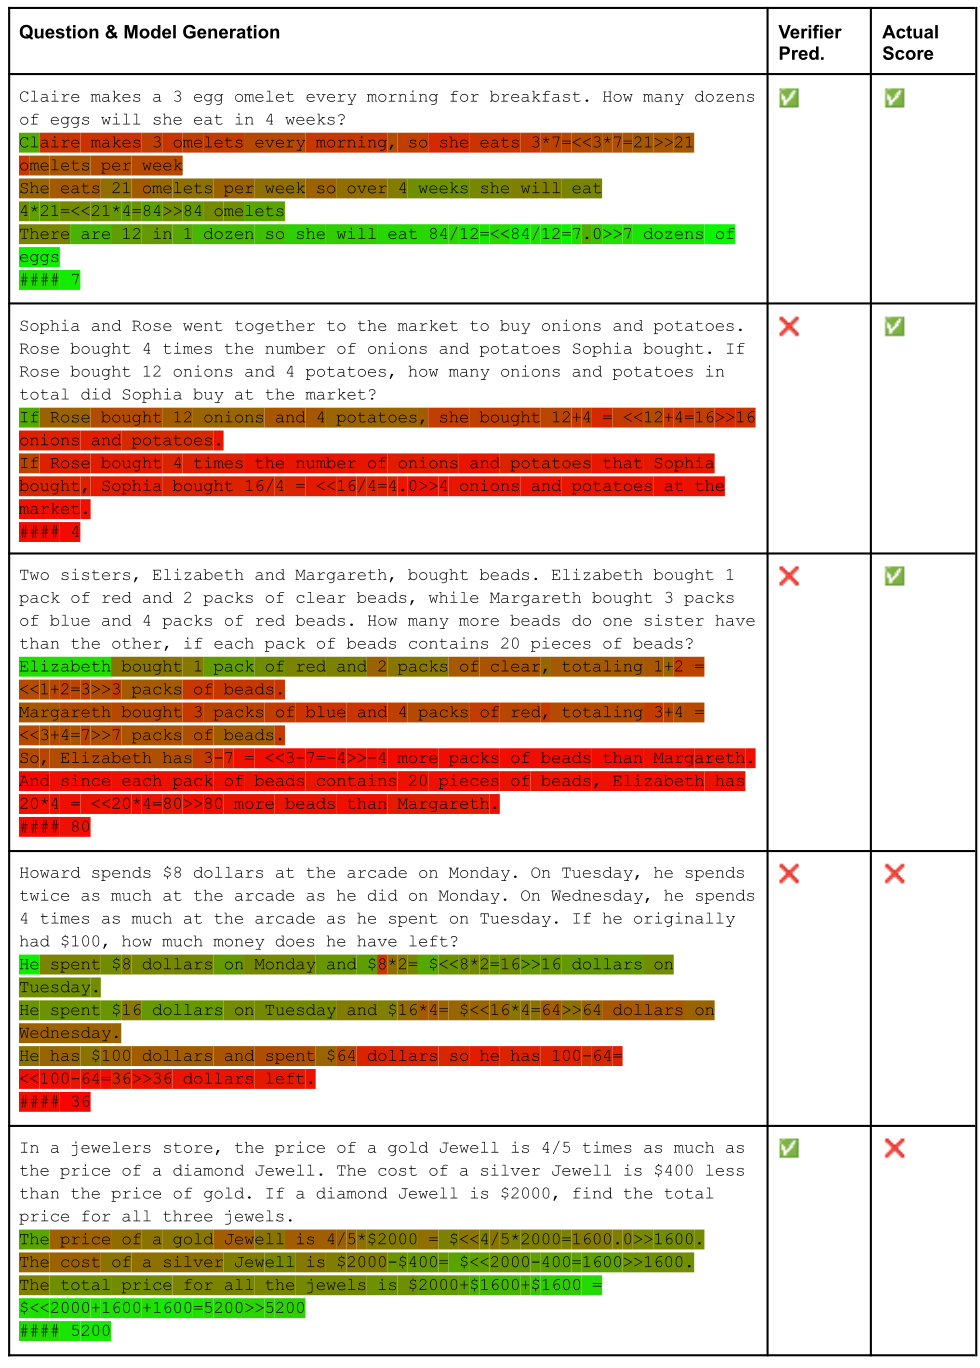
Appendix F Verifier Visualization
Five deliberately selected examples visualize prefix scores from a 175B verifier. They include a true positive, a correct answer rejected, a correct final answer with flawed reasoning, a clearly incorrect answer detected, and an incorrect answer accepted after a quantity-binding error. Thus final-answer labels and reasoning quality can disagree. The colored scores show the model’s predictions, not guaranteed causal explanations or calibrated per-step truth judgments.