At a glance
Intuition. A controller tries actions and learns which worked better than expected. The advantage A estimates that improvement: positive A encourages the sampled action; negative A discourages it. PPO tries to reuse those observations without rewarding excessively large policy changes.
Reading the math. The ratio r = πnew(a|s)/πold(a|s) compares the probability of action a in state s. A change from 0.2 to 0.3 gives r = 1.5. With clipping width ε = 0.2 and positive A, the clipped objective stops crediting that sample beyond 1.2A. Shared network updates can still change other probabilities, so clipping is not a hard bound on every policy change.
PPO alternates fresh environment rollouts with several minibatch optimization epochs on the same batch. A clipped likelihood-ratio objective discourages excessively beneficial-looking changes without the second-order constrained optimization used by TRPO. In the paper’s 2017 simulated-control and Atari experiments, it offers a favorable simplicity, sample-efficiency and performance tradeoff; the evidence is benchmark-specific.
1 Introduction
The goal is a first-order policy-gradient method that reuses samples while avoiding destructive updates. PPO replaces the usual objective with either clipped ratios or an adaptive KL penalty. Clipping performs best in the tested control ablations. The historical comparison concerns these implementations and architectures, not a general impossibility result for Q-learning or a guarantee that every PPO update improves true return.
2 Background: Policy Optimization
The background distinguishes empirical policy-gradient objectives from trust-region constraints and their theoretical motivation.
2.1 Policy Gradient Methods
The gradient estimator multiplies the score function by an estimated advantage, averaged over sampled timesteps. Differentiating the log-policy objective gives that estimator. Repeatedly optimizing this ordinary loss on a fixed batch can move the policy too far from the one that generated the data; sample reuse needs an additional control mechanism.
Equations


2.2 Trust Region Methods
TRPO maximizes an importance-ratio surrogate under an average KL constraint, using local objective/constraint approximations and conjugate gradients. Its theoretical lower-bound motivation involves a maximum-over-states KL quantity, which differs from the practical average penalty. A single fixed penalty coefficient is difficult to tune across tasks and training stages; PPO therefore explores clipping or adaptive penalties.
Equations


3 Clipped Surrogate Objective
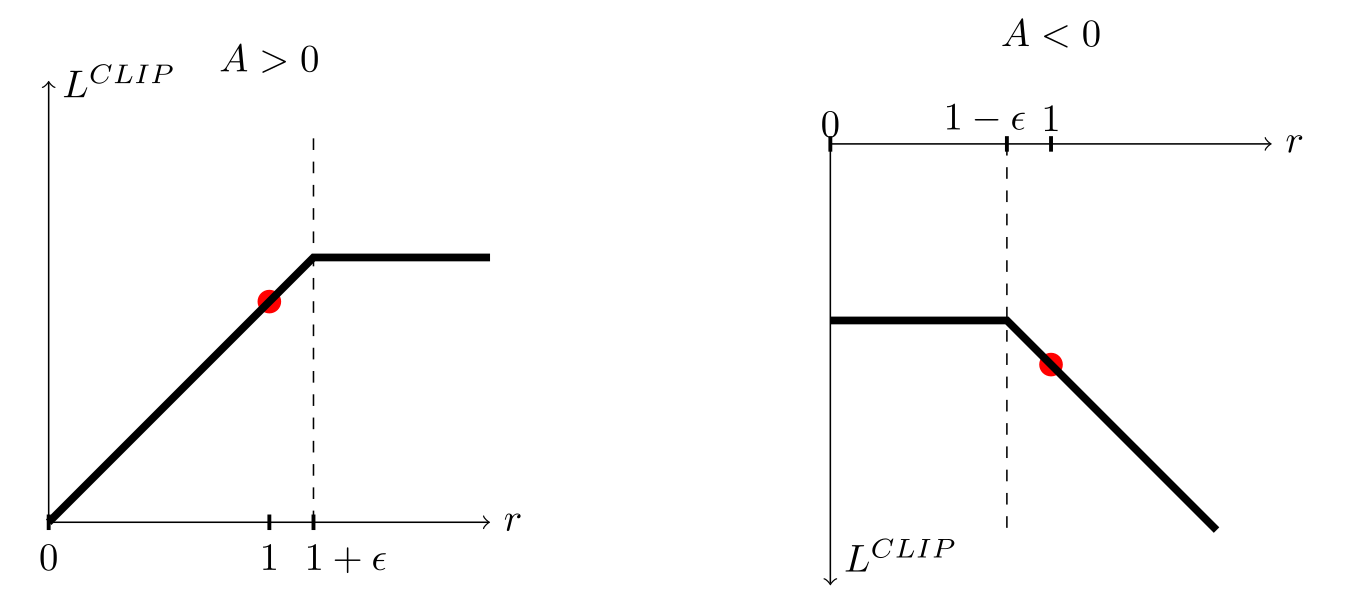
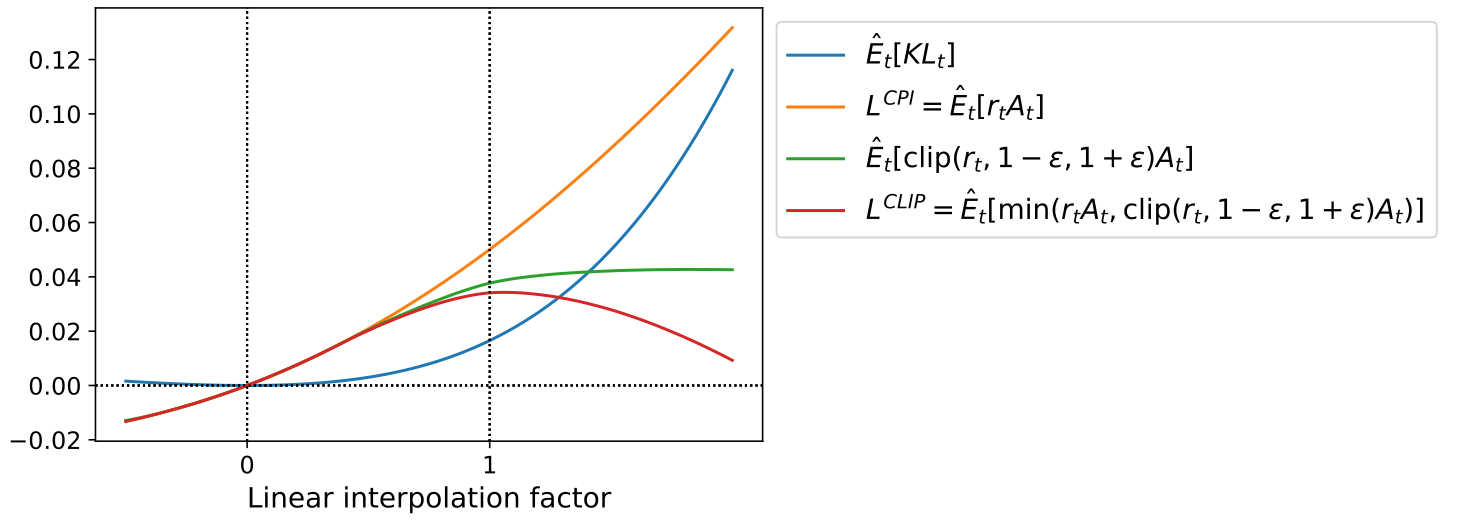
Let r be the new-to-old probability ratio for a sampled action. PPO takes the smaller of rA and the same product with r clipped to [1−ε,1+ε]. For positive advantages, gains stop growing beyond 1+ε; for negative advantages, gains stop growing below 1−ε. Changes that worsen the surrogate remain penalized. The two objectives share the first-order gradient at the old policy.
This is a lower bound on the unclipped sampled surrogate; it does not impose a hard bound on all policy ratios or establish monotonic true-return improvement. Figure 2 illustrates one Hopper update, not a universal KL guarantee.
Equations


4 Adaptive KL Penalty Coefficient
The alternative optimizes a KL-penalized ratio objective, measures the resulting mean KL, and adjusts β for the next update: halve it below the target divided by 1.5, double it above 1.5 times the target. These are heuristic control rules, and individual updates can overshoot the target. Adaptive KL performs worse than clipping in the reported ablation but remains a useful baseline.
Equations


5 Algorithm
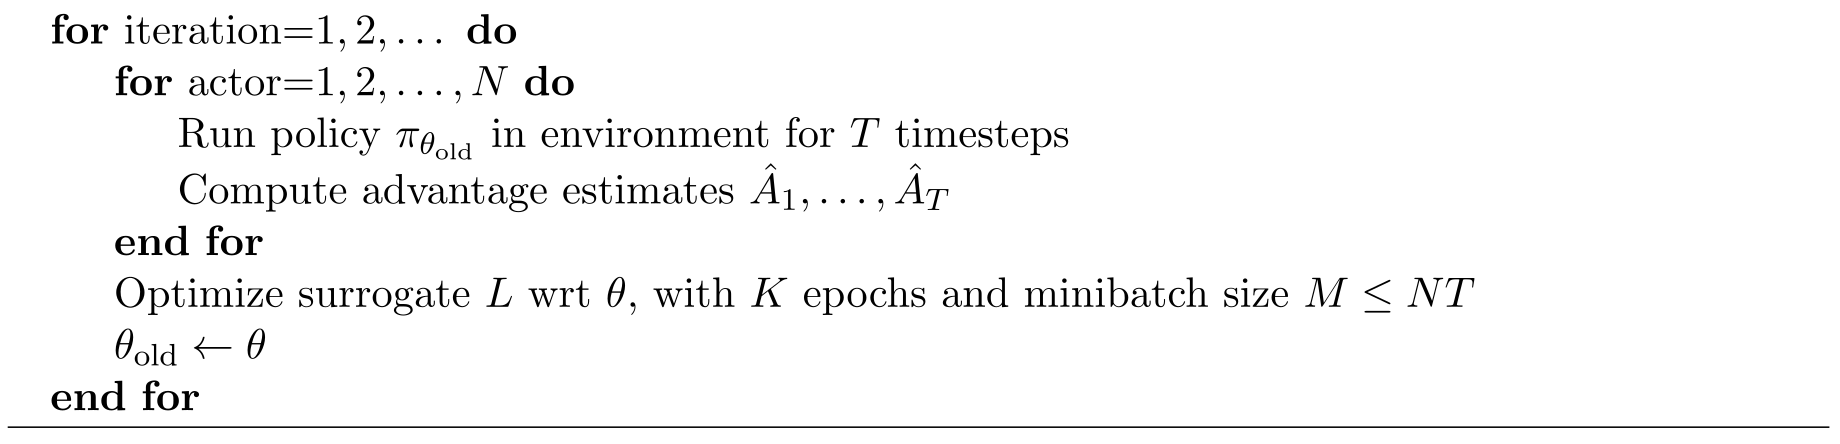
Each of N actors collects T timesteps under the old policy. Compute advantages, optimize the surrogate over this NT-sample batch for K minibatch epochs, then refresh the old-policy parameters and collect new data. Shared policy/value networks add a value-error loss and an entropy bonus; the continuous-control experiments instead use separate networks and no entropy bonus. Generalized advantage estimation supplies a truncated advantage estimate; Adam is the usual optimizer.
The native equations preserve the source’s printed finite-horizon exponents and indexing. Equations 10–11 show T−t+1 on the last reward/residual term, an apparent indexing inconsistency for a sequence ending at T−1; this edition does not silently change the original formulas.
Equations



6 Experiments
The evaluations separately test surrogate choices, continuous-control baselines, a humanoid showcase, and Atari learning speed versus final performance.
6.1 Comparison of Surrogate Objectives
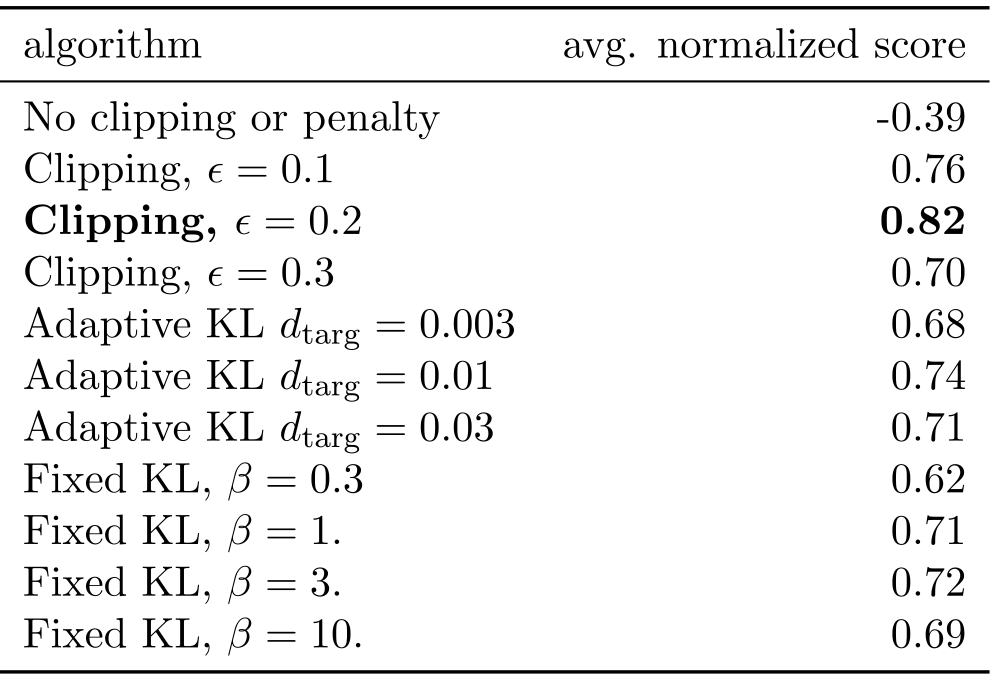
Seven MuJoCo tasks each use one million timesteps and three seeds. Scores average the last 100 episodes, then normalize each environment between a random policy and the best observed result before averaging 21 runs. A two-hidden-layer 64-unit tanh network parameterizes a Gaussian policy, with a separate value network. Clipping ε=.2 scores .82 versus .74 for the best adaptive-KL setting and −.39 without clipping or penalty; one very poor HalfCheetah result drives the negative aggregate.
These are tuned, benchmark-relative aggregates rather than raw cross-task returns or uncertainty estimates. The original ablation display’s clipping-parenthesis typo is retained; Equation 7 states the intended objective.
Equation

6.2 Comparison to Other Algorithms in the Continuous Domain
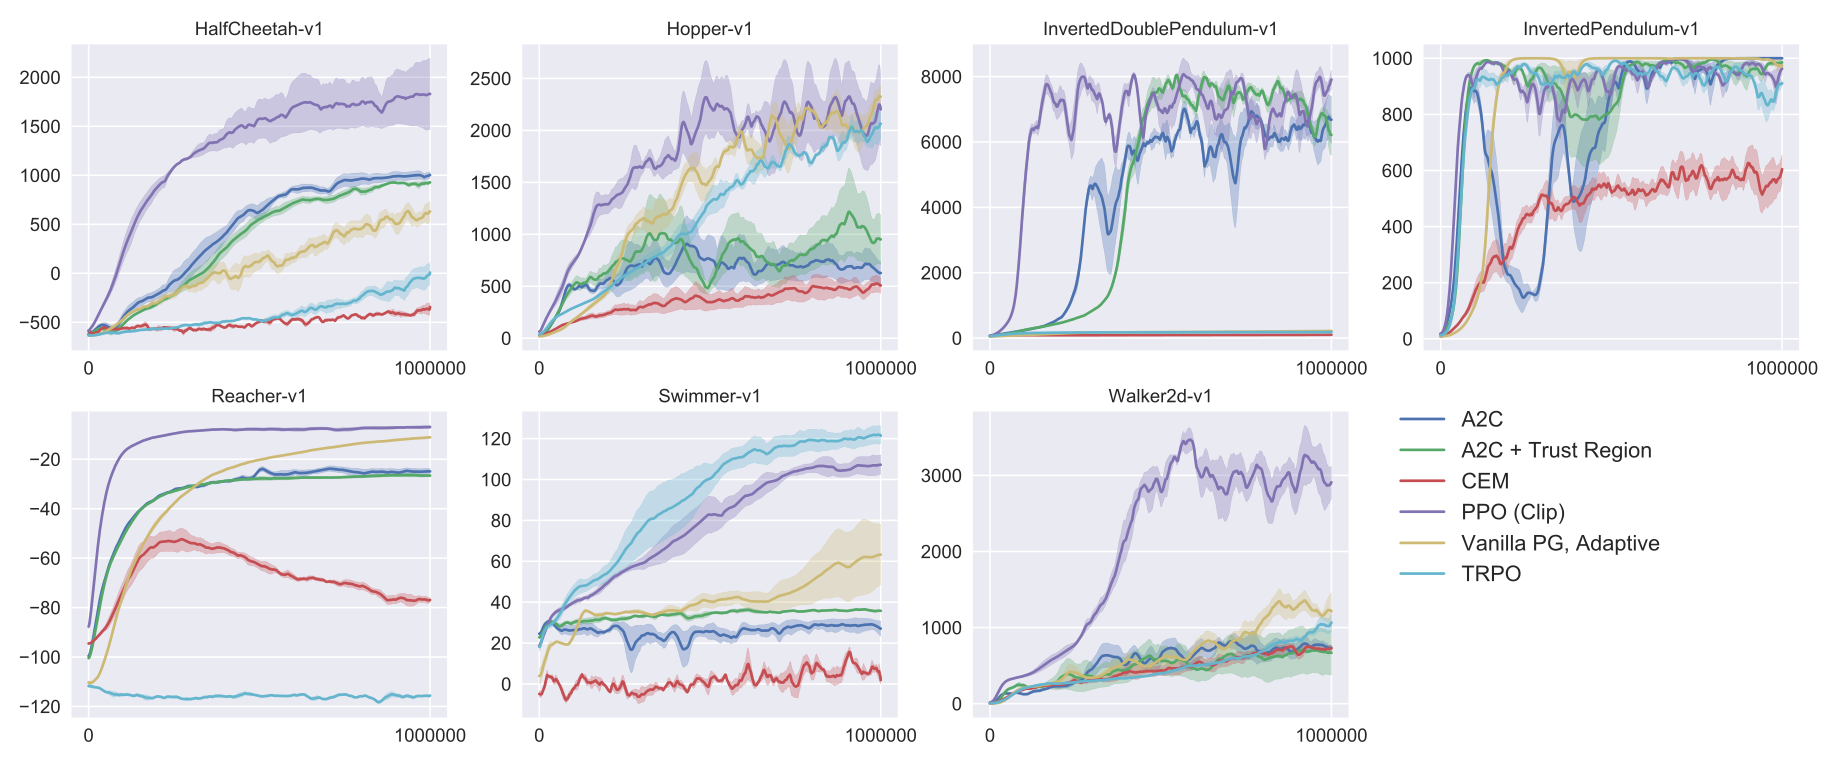
With ε=.2, PPO is compared with tuned TRPO, cross-entropy search, vanilla policy gradients with an adaptive stepsize, A2C and A2C with a trust region. Figure 3 shows learning curves on all seven tasks. PPO generally performs well, but the per-task curves matter more than a universal claim of dominance. A2C is the synchronous counterpart of the asynchronous actor-critic baseline.
6.3 Showcase in the Continuous Domain: Humanoid Running and Steering
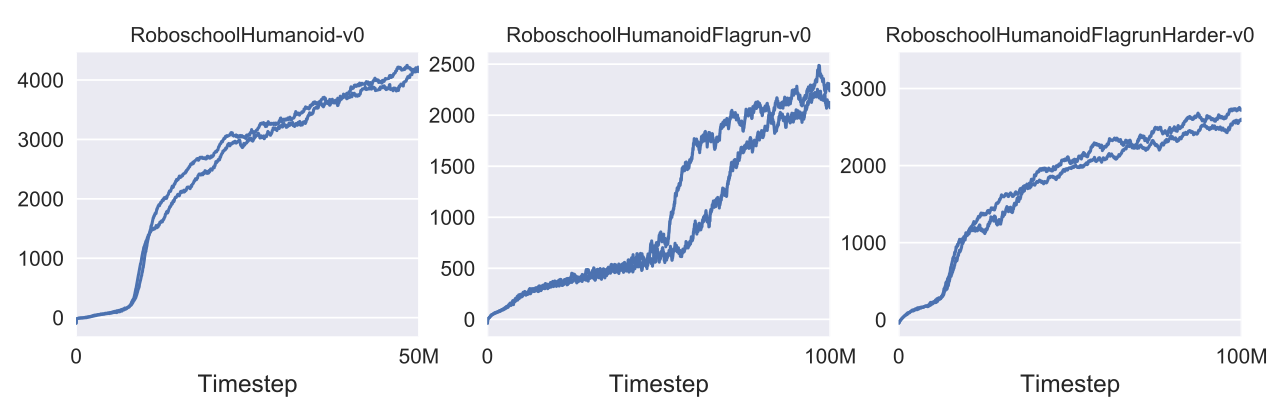
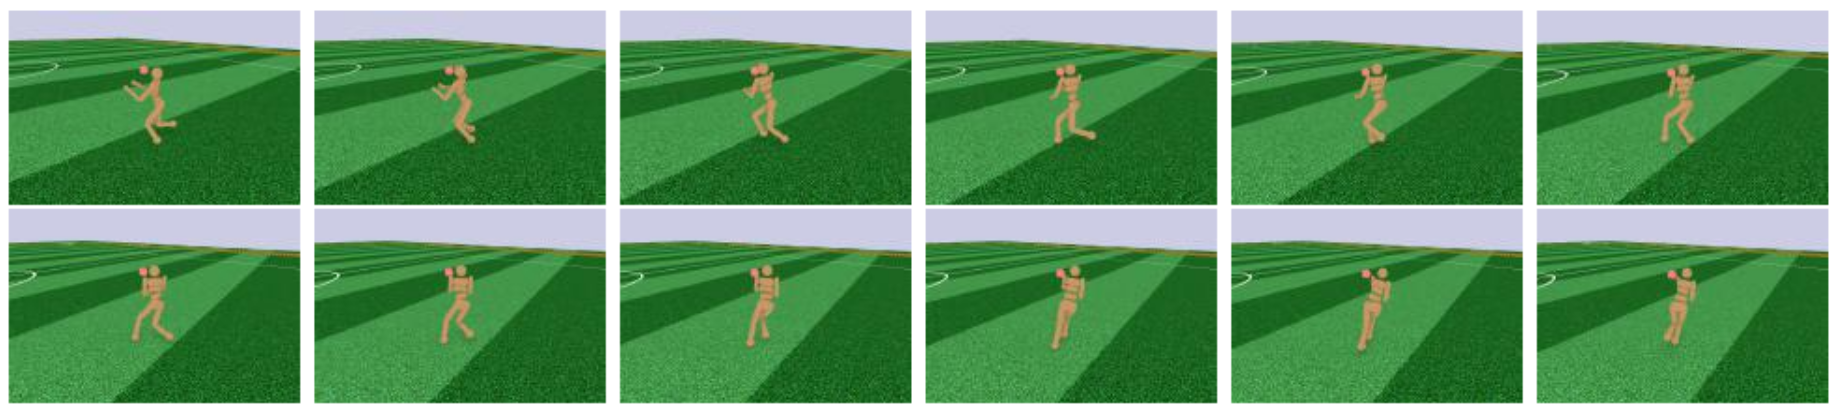
The Roboschool showcase learns humanoid forward running, changing-target navigation, and a harder task requiring recovery while being struck by cubes. Targets move every 200 timesteps or when reached. Figures 4–5 retain all learning curves and the 12-frame turning sequence. These simulated demonstrations establish the tested behavior; they do not evaluate physical-robot deployment or unseen disturbances.
6.4 Comparison to Other Algorithms on the Atari Domain
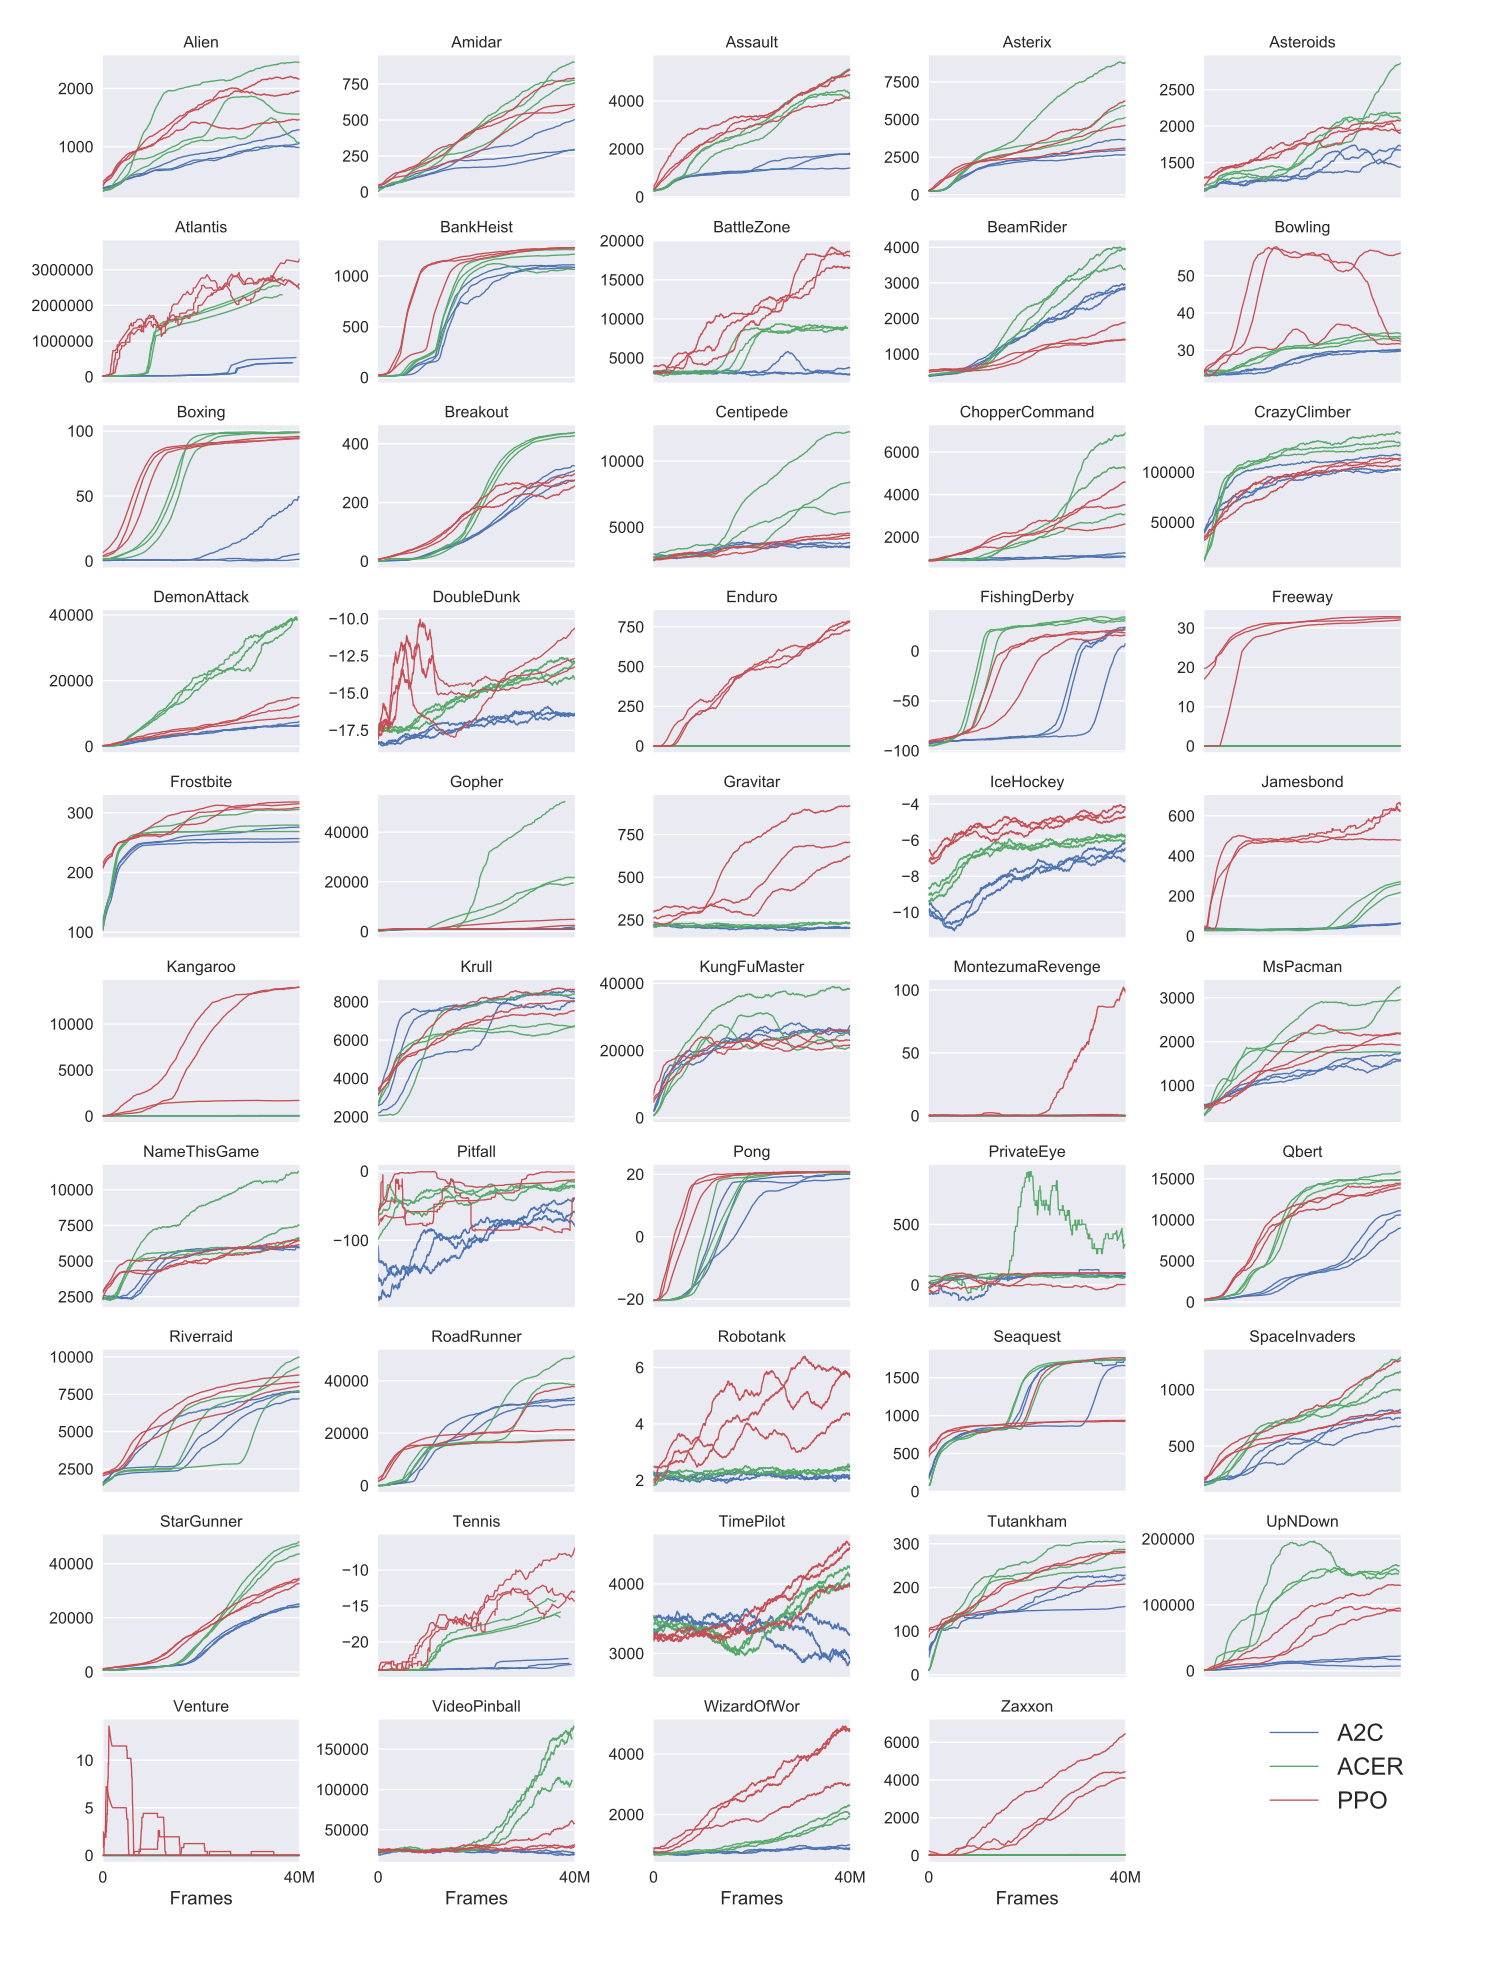
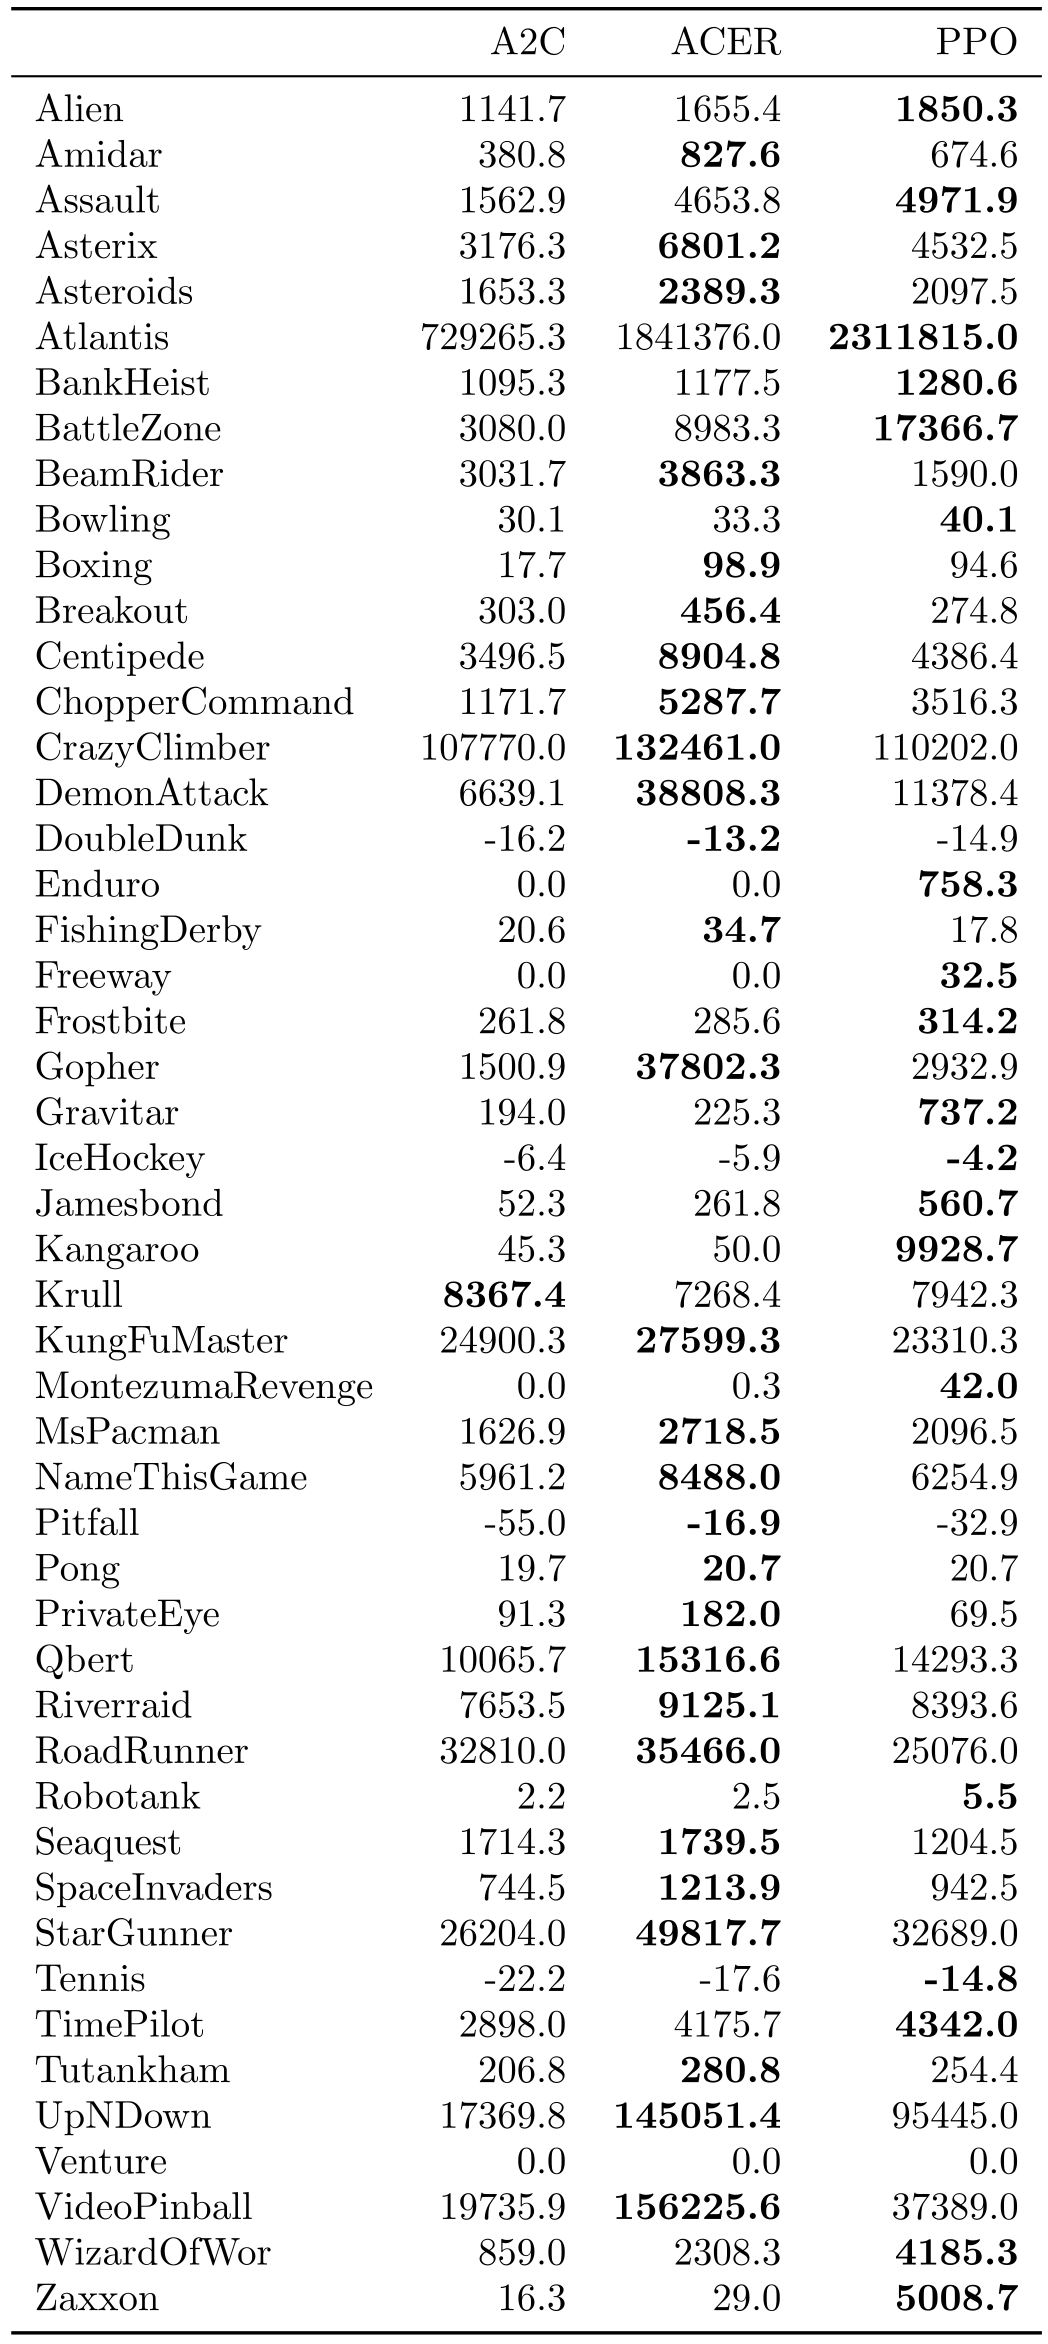
On 49 Atari games, the methods share the policy architecture and each setting has three trials. PPO wins 30 games by average reward across training, versus 18 for ACER and 1 for A2C. By final 100-episode reward, ACER wins 28, PPO 19, A2C 1, with 1 tie. Thus PPO’s advantage is stronger in this learning-speed measure; it does not have the highest final score on most games. Appendix B gives all per-game results after 40 million frames.

7 Conclusion
PPO’s contribution is a practical family of first-order policy updates that can reuse on-policy batches for several epochs. The clipped variant is the strongest of the tested objectives, with comparatively simple implementation and competitive benchmark performance. Its empirical stability should be distinguished from a strict trust-region or monotonic-return theorem.
8 Acknowledgements
The authors thank Rocky Duan, Peter Chen and other OpenAI colleagues for comments.
A Hyperparameters
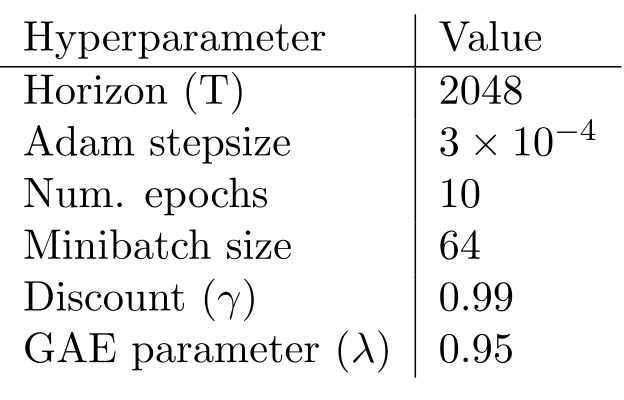
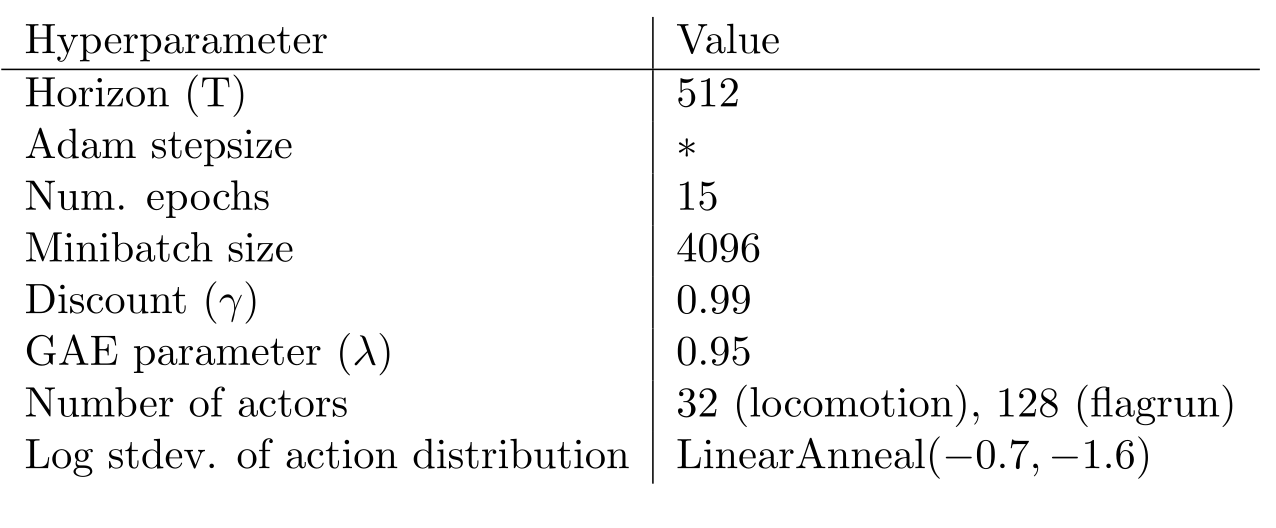
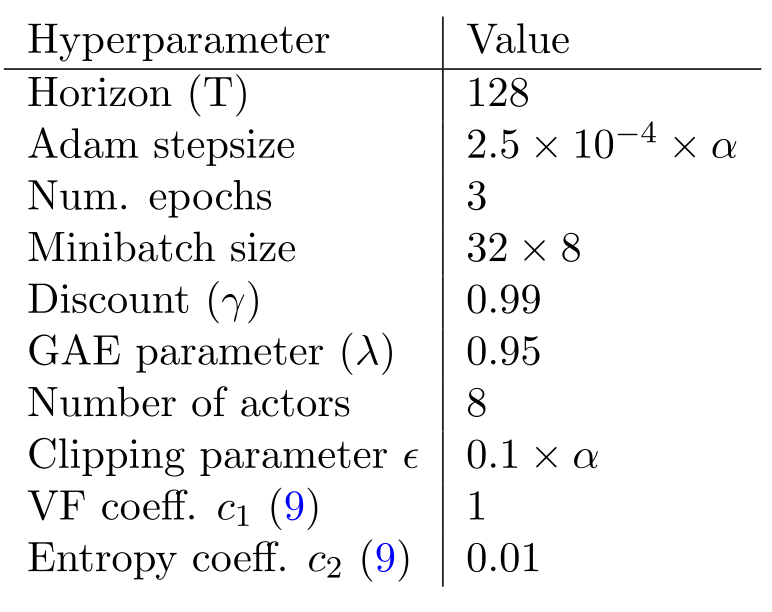
The retained tables give task-specific settings. MuJoCo uses horizon 2048, 10 epochs,minibatches 64 and Adam 3×10⁻⁴. Roboschool uses horizon 512, 15 epochs,minibatches 4096 and 32 or 128 actors, with KL-adjusted stepsize and annealed action log-standard-deviation. Atari uses 8 actors,horizon 128, 3 epochs,minibatches 256; both stepsize and clipping decrease linearly, with value coefficient 1 and entropy coefficient .01. Discount .99 and GAE λ=.95 are shared.
B Performance on More Atari Games
Figure 6 retains every one of the 49 game panels, all three methods and their seed curves; Table 6 retains every final score. Although their original captions name only PPO and A2C, both also include ACER. Outcomes vary substantially by game, and the three-seed means alone do not establish statistically significant pairwise superiority.