At a glance
EchoGPT is a Llama-2 model fine-tuned to turn echocardiography Findings into draft Impressions. On Mayo Clinic reports it leads the tested open models on automatic metrics; four cardiologists reviewing 30 cases prefer its conciseness, with no significant preference on completeness, correctness, or clinical utility.
This result does not establish equivalence to clinicians or reliable cross-institution use. On external MIMIC-EchoNotes reports, experts prefer the original summaries on completeness, correctness, and clinical utility. Common text metrics are also weakly sensitive to clinically consequential changes in measurement numbers.
Graphical Abstract
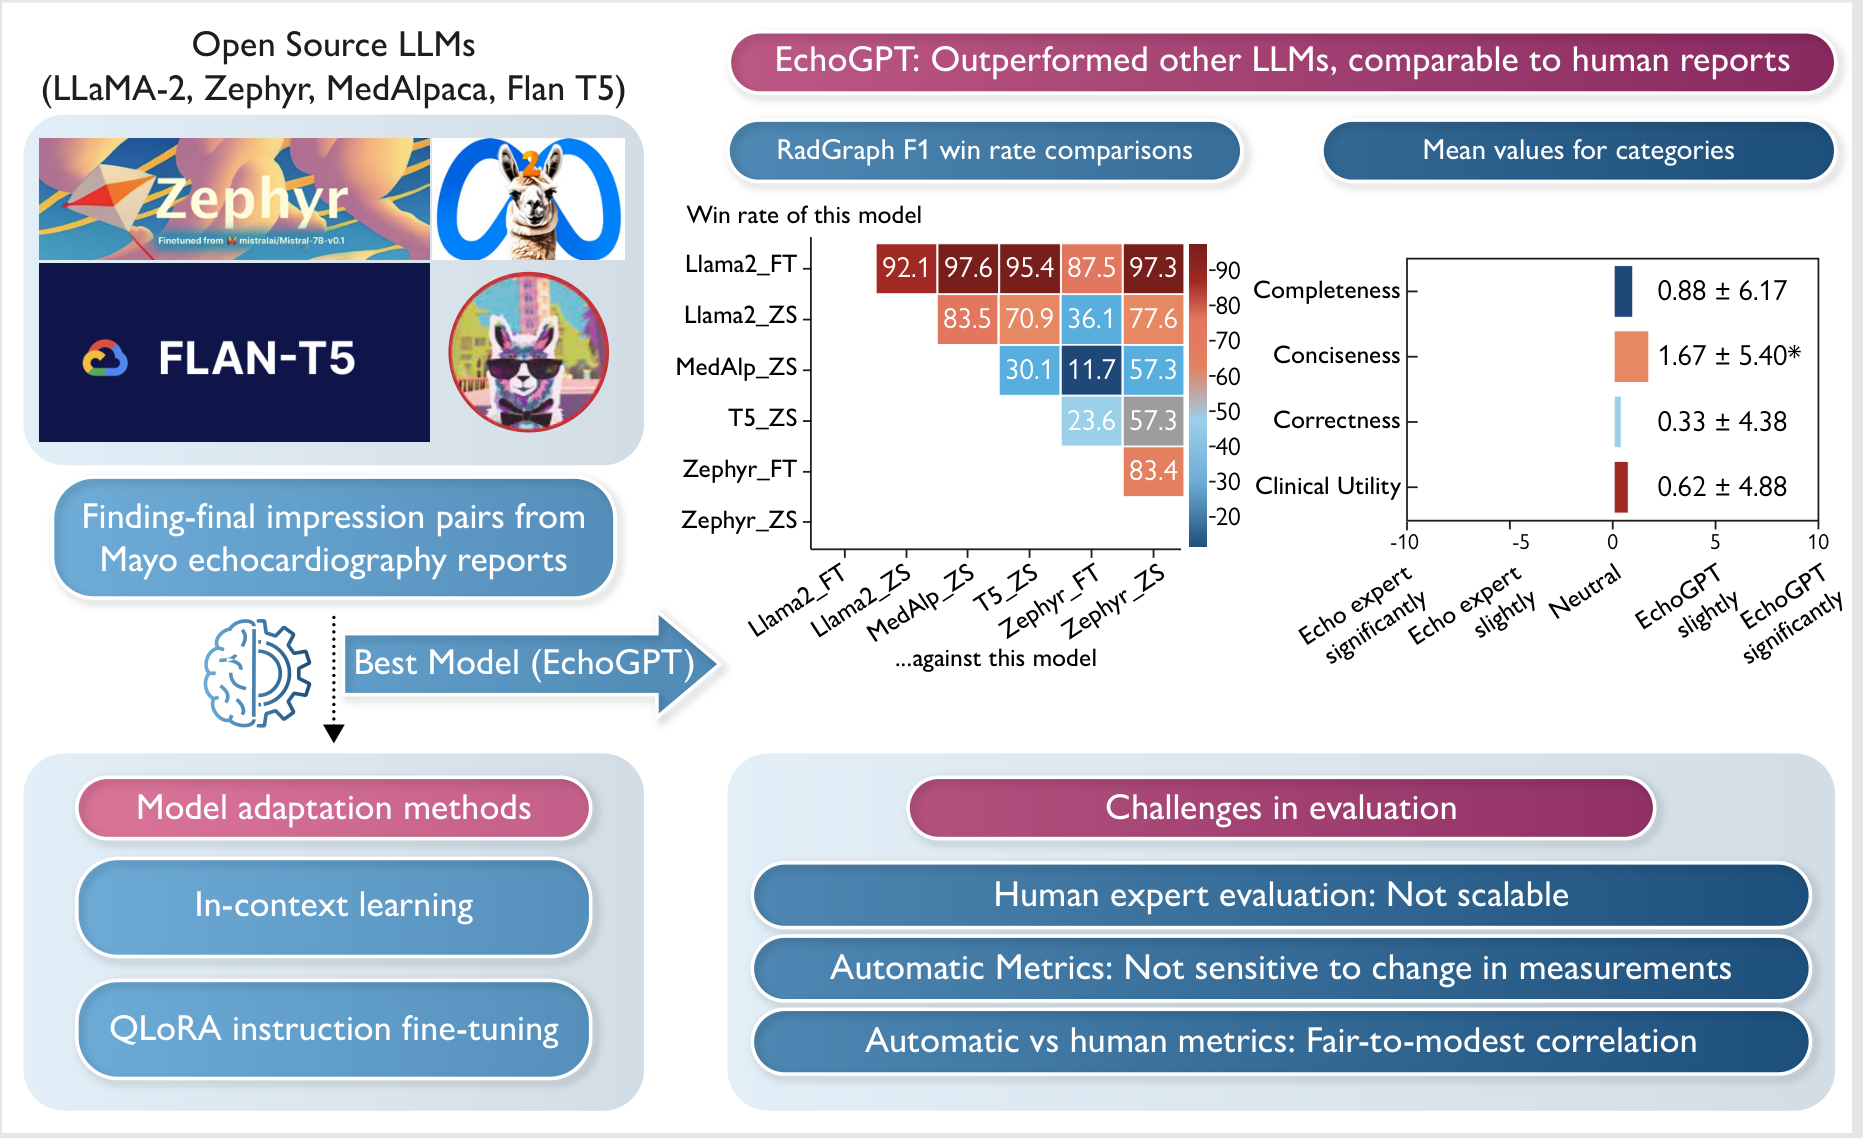
Open-source LLMs (Llama-2, MedAlpaca, Zephyr, and Flan-T5) were evaluated using in-context learning (ICL) and quantized low-rank adaptation (QLoRA) FT for summarizing echo reports from ‘Findings’ to ‘Impressions.’ EchoGPT, a QLoRA fine-tuned Llama-2 model, surpassed other LLMs in multiple automatic metrics and produced reports on par with those of cardiologists in qualitative reviews. However, challenges in evaluating generated reports included limited scalability of expert reviews, modest correlations between automatic and human metrics, and the automatic metrics’ insensitivity to changes in measurements.
Introduction
Echocardiography reporting requires synthesizing detailed measurements into clinically relevant impressions. Image-analysis tools can generate findings, but do not by themselves perform this summarization. The study examines locally deployable language models, adapting earlier clinical summarization approaches [9] to echo reports.
The contribution is a comparison of zero-shot inference, retrieved in-context examples, and parameter-efficient instruction tuning, together with tests of automatic metrics and cardiologist judgments. Prior EchoGen work [20] motivates the task, but its model was unavailable for direct comparison.
Methods
Dataset
The retrospective Mayo cohort contains adult transthoracic, transoesophageal, and stress echocardiograms from calendar year 2017. Findings and Final Impression sections form input–target pairs. External evaluation uses a sample of the public MIMIC-III ECHO-NOTE2NUM dataset [24], drawn from intensive-care echo reports at Beth Israel Deaconess Medical Center during 2001–2012.
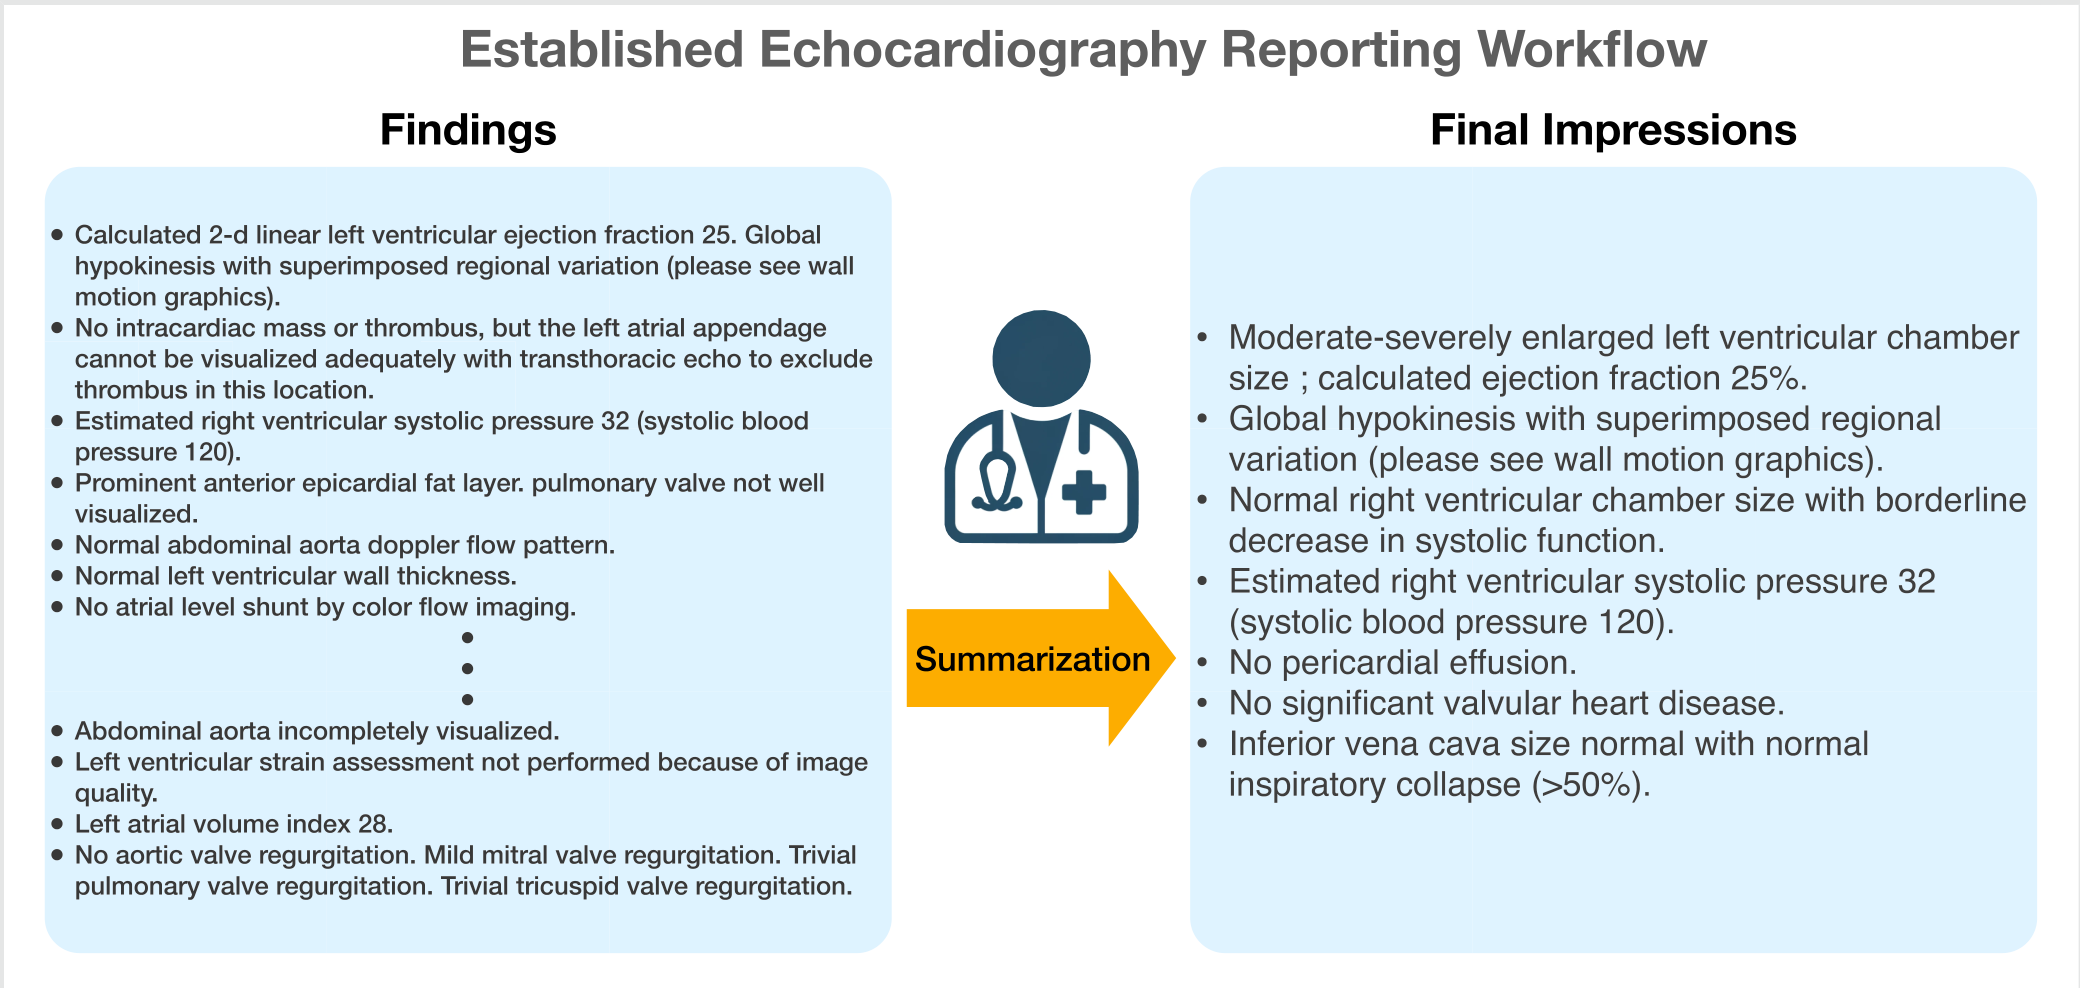
The current workflow of summarizing echo findings into clinically relevant final impressions.
Data curation and preprocessing
Reports missing either section, containing fewer than 15 words in either section, or marked limited are excluded where corresponding metadata are available. Preprocessing removes capitalized subheadings, quality-control boilerplate, and comparisons to prior studies, since prior reports are absent from the input.
MIMIC reports use a different structure: General Comments are combined with Findings, while Conclusions are combined with Impression. Common abbreviations are expanded. These adaptations change the comparison target and do not eliminate the underlying difference between institutions.
Data split
Rochester, Florida, and Mayo Clinic Healthcare reports form the development cohort; Arizona is held out for a site-transfer test. The development cohort contributes 1,000 non-duplicated validation cases and 1,000 test cases; remaining reports train the models. Arizona and MIMIC each contribute 1,000 non-duplicated random evaluation cases. Token counts and the unique-token/total-token ratio characterize the text.
Model selection
The candidate models are Llama-2-7b-chat, Zephyr-7b, MedAlpaca, and Flan-T5-base. Selection favors locally manageable models and adequate context length. Proprietary models were excluded under the study’s patient-privacy constraints. Flan-T5 serves as a sequence-to-sequence baseline because EchoGen was unavailable.
Model inference hyperparameter search
A 100-case subset of the test set is used to compare temperatures 0.1, 0.5, and 0.9 and repetition penalties 1.1, 1.2, and 1.3, varying one parameter at a time. The chosen temperature 0.1 and penalty 1.1 are reused for in-context and fine-tuned models. This is a limited search using test examples, rather than fully independent tuning on the validation split; Supplementary Table 1 preserves every tested result.
Model adaptation
Prompt
The prompt specifies a knowledgeable cardiologist and asks for a concise summary with minimal text. An additional instruction introduces demonstration examples for in-context learning. For MIMIC, the authors change the instruction to a ten-bullet clinical summary and request omission of numbers other than ejection fraction, responding to the different report style. Table 1 retains the Mayo prompt verbatim.
| Prompt Component | |
|---|---|
| Prefix | ‘You are a knowledgeable cardiologist.’ |
| Instruction | ‘For the following echocardiography report findings, please write a concise summary with a minimal amount of text.’ |
| Suffix (ICL only) | ‘Use the following examples to guide word choice.’ |
Prompt template
In-context learning
PubMedBERT embeds training and test examples. Each test case retrieves its nearest training examples for prompts containing one, two, or four demonstrations. Model weights remain unchanged; the retrieval is intended to provide relevant wording and structure.
Instruction tuning with quantized low-rank adaptation
QLoRA [32] fine-tunes Llama-2 and Zephyr against the original Final Impression, using the same instruction template. Training loads weights in four-bit precision and uses low-rank adapters with rank 64, scaling 16, and dropout 0.1. The effective batch size is 24 on one 24 GB graphics card.
A paged 32-bit AdamW optimizer starts at learning rate 0.001, with 100 warm-up steps and cosine decay to 0.0001. MedAlpaca and Flan-T5 are not fine-tuned; their zero-shot results should not be read as a comparison of each architecture’s best adapted performance.
Model performance evaluation
Automatic natural language processing evaluation metrics
BLEU, METEOR, ROUGE-L F1, and BERTScore measure lexical or contextual similarity to the reference. RadGraph F1, based on extracted clinical entities and relations [40], is the primary metric because factual content matters. Supplementary Table 2 explains each metric. None is a complete measure of echo-report diagnostic quality.
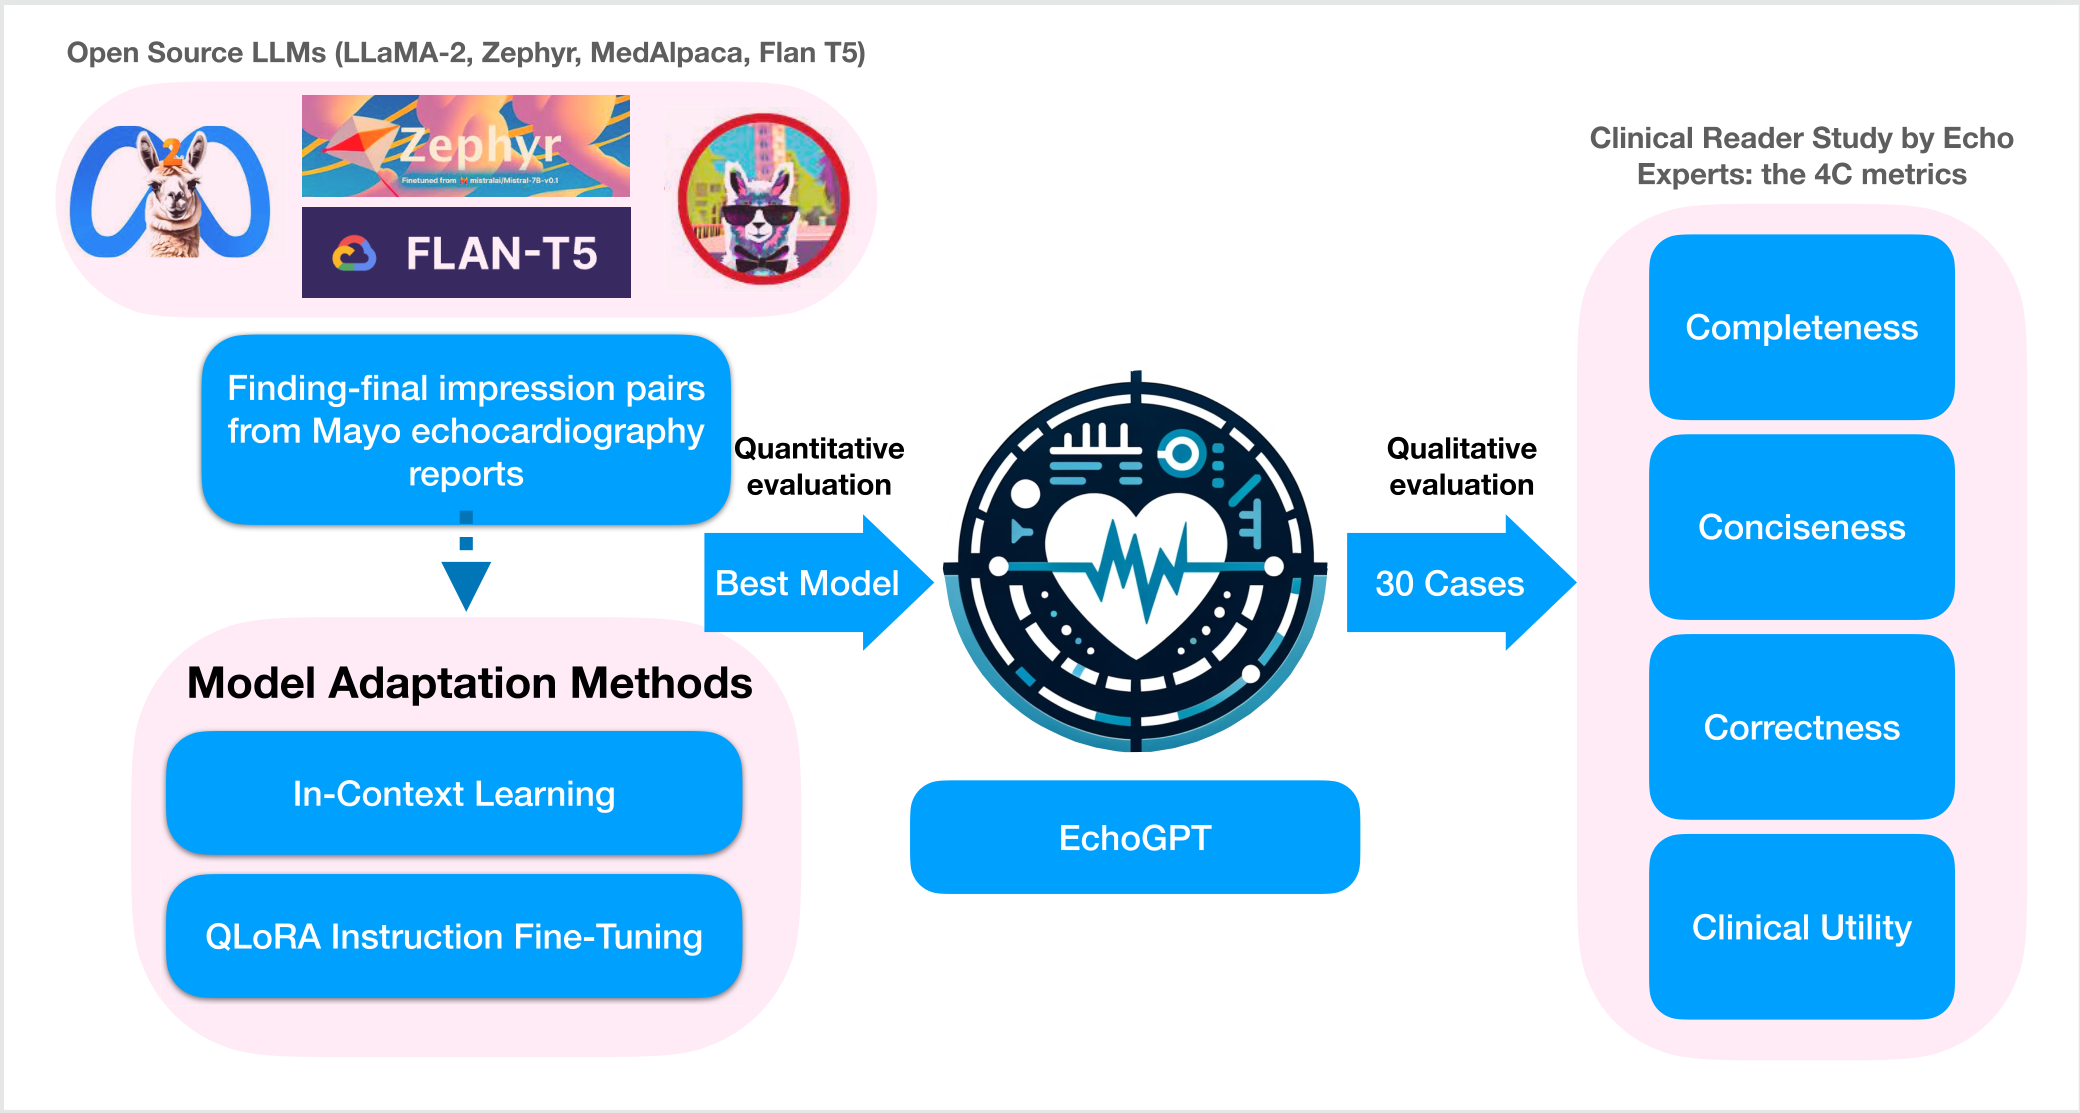
Overview of the EchoGPT study.
Evaluation of significance of measurement numbers in automatic metrics
To test numerical sensitivity, measurement values in generated reports are replaced by random integers from 1 to 99. Automatic scores on the original and corrupted versions are compared. The test targets a clinically important failure mode that ordinary text similarity may overlook.
Human expert evaluation metrics
Four echo-board-certified cardiologists blindly compare model and reference summaries for 30 randomly selected cases. They rate five-level preference on completeness, conciseness, correctness, and clinical utility. Reviewers are instructed to use only information present in Findings, because reference impressions can include additional events or communications.
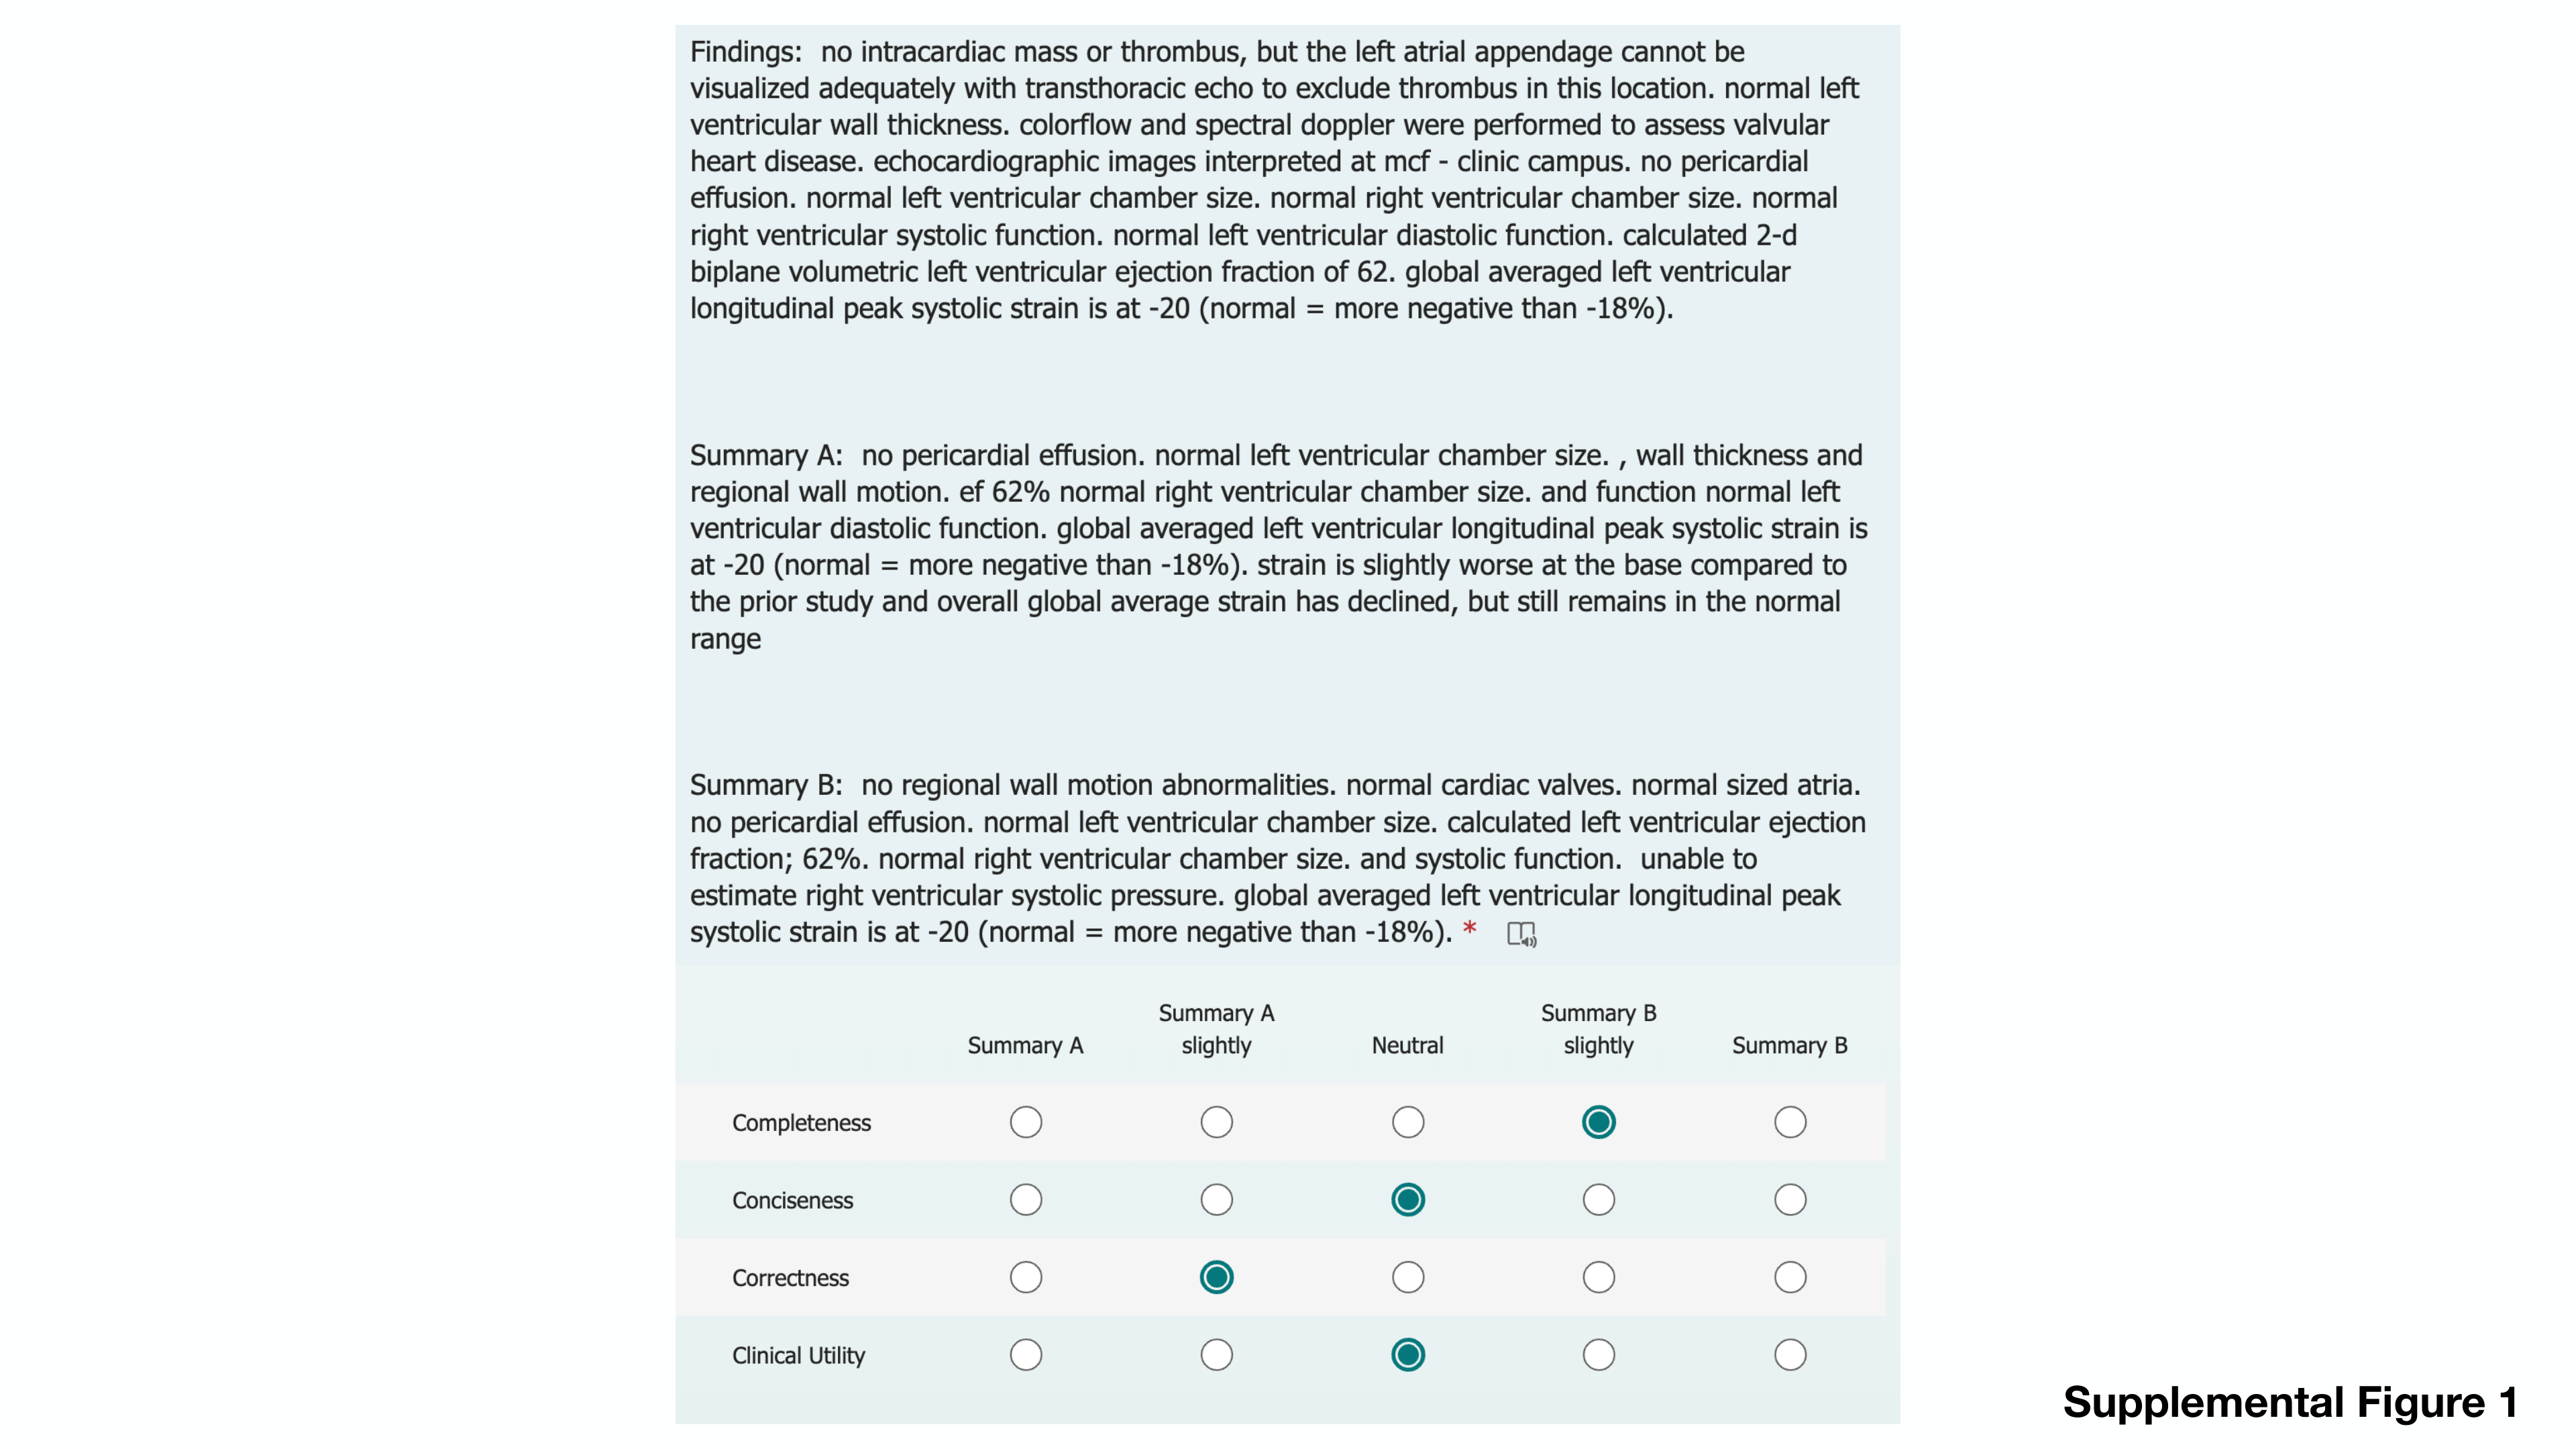
Table 2 preserves the four definitions; Supplementary Figure 1 preserves the review questionnaire. This is a small preference study, with limited clinical context, rather than a prospective assessment of diagnostic or patient outcomes.
| Metric | Definition |
|---|---|
| Completeness | This metric evaluates whether the generated contents include all relevant details, elements, or aspects, leaving no important information gaps. |
| Conciseness | This metric measures the quality of being clear and succinct, presenting information or content in a brief and straightforward manner without unnecessary elaboration or redundancy. |
| Correctness | This metric assesses whether the generated information is true, free from mistakes, and aligned with established facts or standards. It is designed as a surrogate marker to detect hallucinations. |
| Clinical Utility | This metric evaluates whether the generated information is useful in clinical practice and can be used for decision making in the given context. |
Definition of the 4C human expert evaluation metrics
Statistical analysis
Models are compared with paired t-tests or signed-rank tests as appropriate, plus per-case win rates. Sex, race, and clinically important subgroups are examined. Human preferences use signed-rank tests, inter-reader agreement uses Fleiss’ kappa, and relationships between metrics use Pearson correlation. The stated significance threshold is p < 0.05.
Results
Patient cohort and dataset
The development cohort contains 97,506 reports from 71,717 patients, with mean age 64.3 years; 91.8% of reports are from white patients. Arizona contributes a 1,000-patient evaluation sample selected from 19,557 reports. Transthoracic studies dominate all three datasets. Table 3 retains demographic, disease, report-length, and lexical-variation statistics.
| Development Set | AZ validation set | MIMIC-EchoNotes | ||||
|---|---|---|---|---|---|---|
| All | Train | Validation | Test | |||
| n = 97 506 | n = 95 506 | n = 1000 | n = 1000 | n = 1000 | n = 1000 | |
| Age | 64.3 ± 15.8 | 64.3 ± 15.8 | 64.9 ± 16.0 | 64.7 ± 15.7 | 63.9 ± 16.0 | — |
| Race | ||||||
| White | 89 466 (91.8%) | 87 632 (91.8%) | 914 (91.4%) | 920 (92.0%) | 885 (88.5%) | — |
| Black | 3326 (3.4%) | 3257 (3.4%) | 35 (3.5%) | 34 (3.4%) | 42 (4.2%) | — |
| Other | 2850 (2.9%) | 2790 (2.9%) | 28 (2.8%) | 32 (3.2%) | 35 (3.5%) | — |
| Asian | 1415 (1.5%) | 1390 (1.5%) | 16 (1.6%) | 9 (0.9%) | 22 (2.2%) | — |
| Native American | 362 (0.4%) | 353 (0.4%) | 5 (0.5%) | 4 (0.4%) | 13 (1.3%) | — |
| Pacific Islander | 87 (0.1%) | 84 (0.1%) | 2 (0.2%) | 1 (0.1%) | 3 (0.3%) | — |
| Sex | ||||||
| Male | 54 010 (55.4%) | 52 920 (55.4%) | 563 (56.3%) | 527 (52.7%) | 584 (58.4%) | — |
| Female | 43 496 (44.6%) | 42 586 (44.6%) | 437 (43.7%) | 473 (47.3%) | 416 (41.6%) | — |
| HTN | 11 578 (11.9%) | 11 320 (11.9%) | 115 (11.5%) | 143 (14.3%) | 125 (12.5%) | — |
| DM | 14 406 (14.8%) | 14 105 (14.8%) | 142 (14.2%) | 159 (15.9%) | 115 (11.5%) | — |
| CAD | 4983 (5.1%) | 4863 (5.1%) | 51 (5.1%) | 69 (6.9%) | 57 (5.7%) | — |
| CHF | 38 908 (39.9%) | 38 105 (39.9%) | 384 (38.4%) | 419 (41.9%) | 293 (29.3%) | — |
| CKD | 15 071 (15.5%) | 14 759 (15.5%) | 140 (14.0%) | 172 (17.2%) | 170 (17.0%) | — |
| Stroke | 2879 (3.0%) | 2812 (2.9%) | 30 (3.0%) | 37 (3.7%) | 21 (2.1%) | — |
| Echo Study Type | ||||||
| Adult TTE | 79 902 (81.9%) | 78 243 (81.9%) | 833 (83.3%) | 826 (82.6%) | 776 (77.6%) | 881 (88.1%) |
| Adult TEE | 7829 (8.0%) | 7685 (8.0%) | 65 (6.5%) | 79 (7.9%) | 63 (6.3%) | 108 (10.8%) |
| Exercise Stress | 6781 (7.0%) | 6652 (7.0%) | 64 (6.4%) | 65 (6.5%) | 131 (13.1%) | 11 (1.1%) |
| Pharmacological Stress | 2994 (3.1%) | 2926 (3.1%) | 38 (3.8%) | 30 (3.0%) | 30 (3.0%) | — |
| Data Characteristics | ||||||
| Average Number of Tokens (Findings) | 215.7 ± 55.8 | 215.7 ± 55.9 | 213.1 ± 55.2 | 214.8 ± 53.3 | 217.1 ± 77.3 | 184.3 ± 50.0 |
| Average Number of Tokens (Final Impression) | 88.2 ± 34.3 | 88.2 ± 34.3 | 87.1 ± 33.7 | 86.8 ± 33.6 | 97.7 ± 37.9 | 163.2 ± 40.4 |
| Average Lexical Variance (Findings) | 0.51 | 0.51 | 0.52 | 0.51 | 0.52 | 0.54 |
| Average Lexical Variance (Final Impression) | 0.65 | 0.65 | 0.65 | 0.65 | 0.64 | 0.52 |
Data distribution of the development and AZ validation sets
Zero-shot, in-context learning, and quantized low-rank adaption fine-tuned performance
Fine-tuned Llama-2, named EchoGPT, leads all other tested configurations on all five automatic metrics, with reported win rates of 87–99%. QLoRA improves both selected models. Flan-T5 is competitive on some text-overlap metrics but substantially weaker on RadGraph F1; its examples omit important clinical information.
Llama-2 and Zephyr perform best with one retrieved example, then decline with more examples. Llama-2 mixes measurements from demonstration cases into the requested report in 34/1,000 two-example cases and 69/1,000 four-example cases. Supplementary Table 4 preserves an example of this contamination.
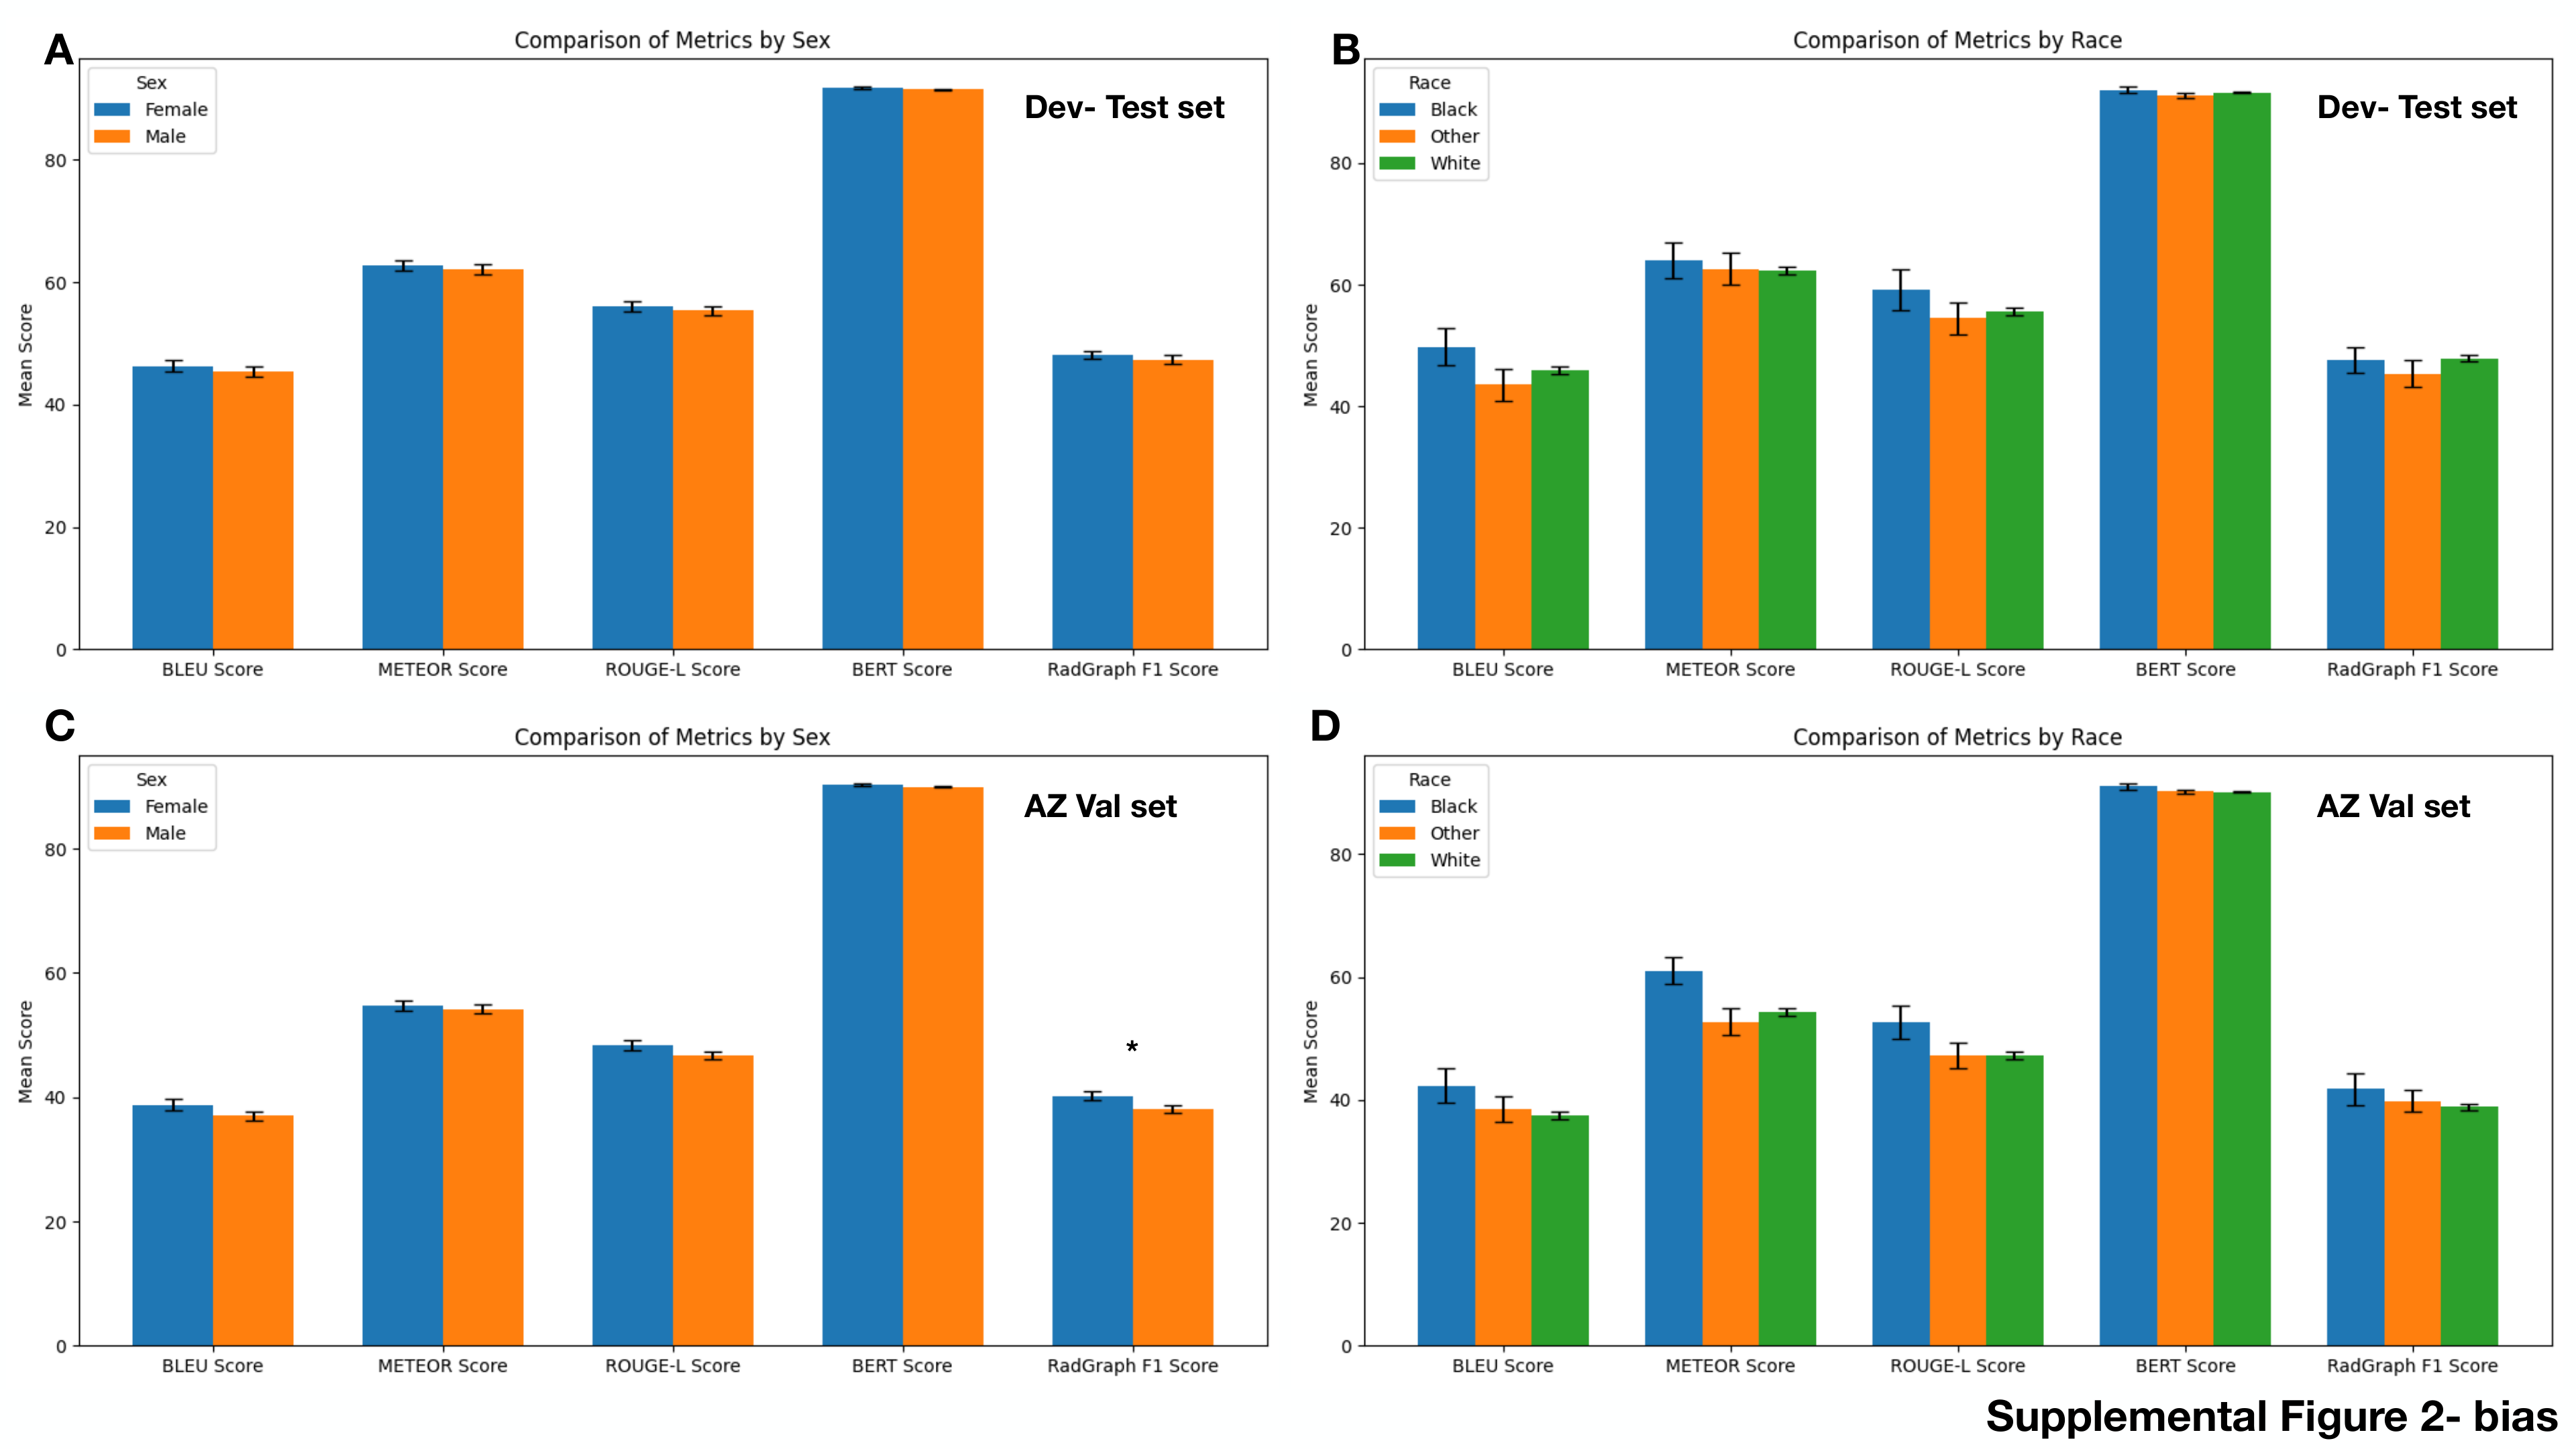
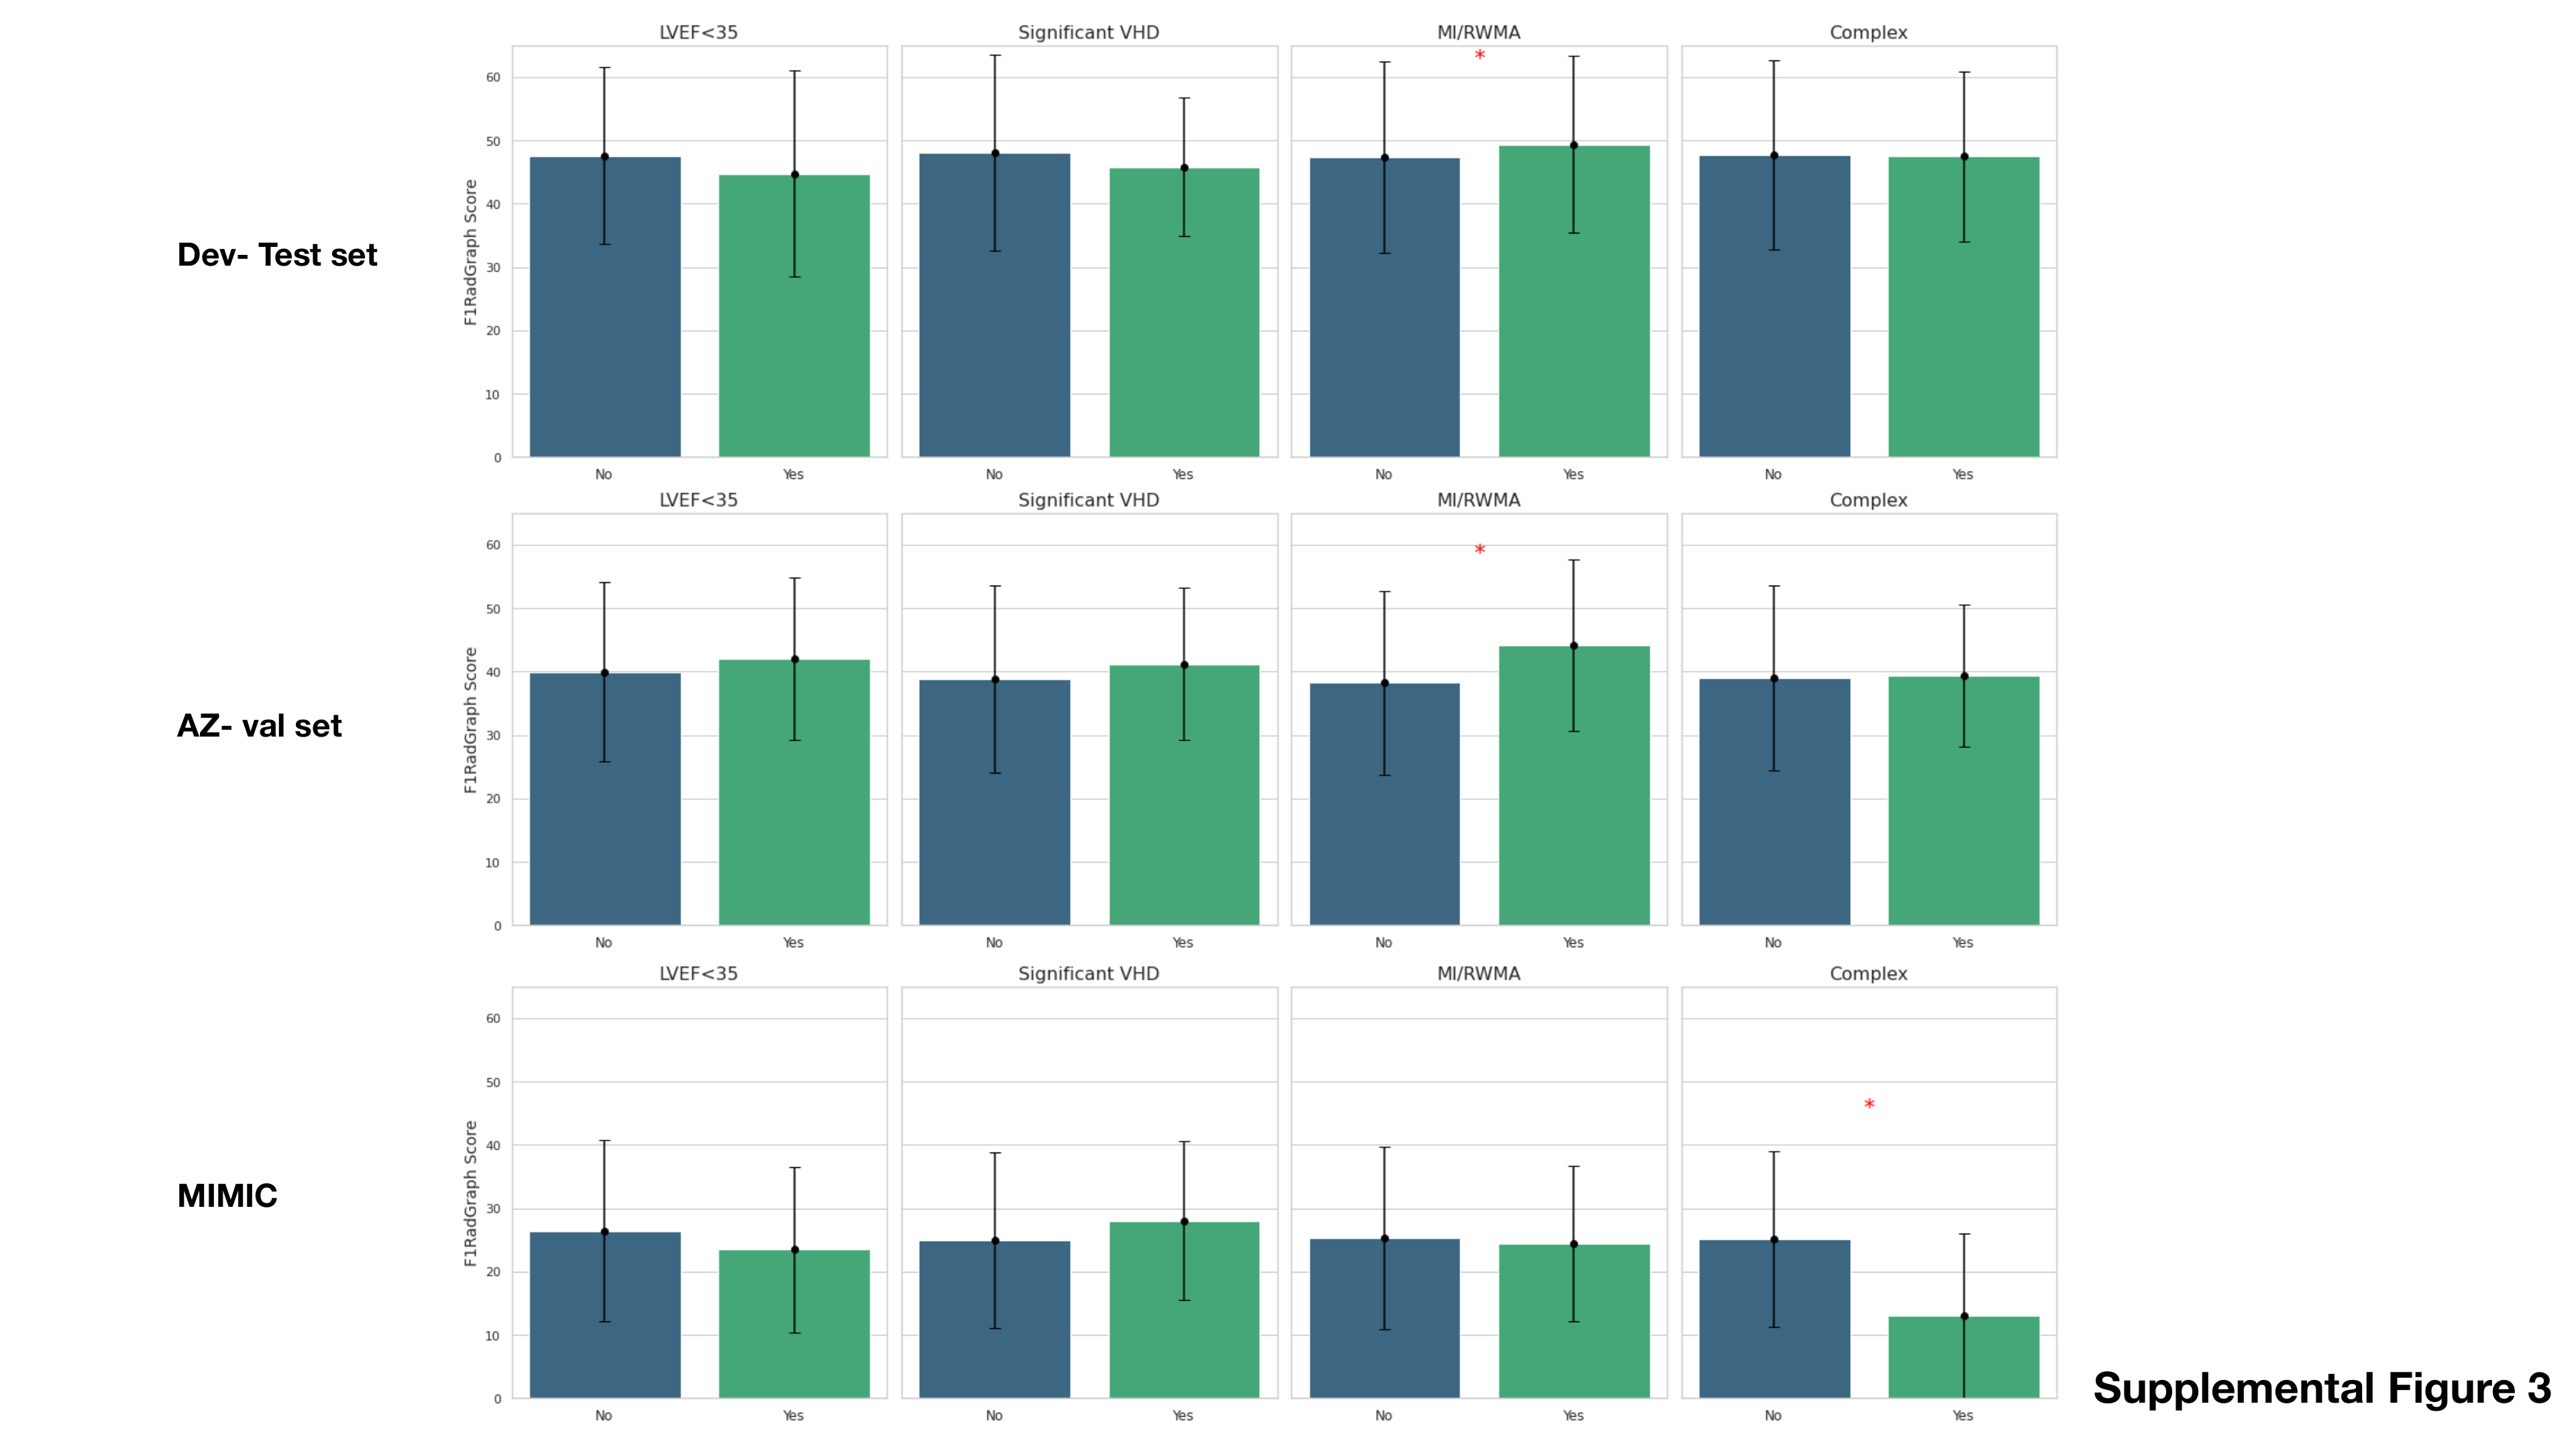
Performance differences by sex and race are mostly not significant, with one Arizona sex difference in RadGraph F1. This limited subgroup analysis does not demonstrate absence of bias. Performance is better in Mayo infarction/wall-motion-abnormality cases but worse for complex MIMIC findings; the full subgroup plots remain in the supplement.
| Model | Flan-T5 | MedAlpaca | Llama-2 | Zephyr | |||||
|---|---|---|---|---|---|---|---|---|---|
| Metric | zero-shot | zero-shot | zero-shot | QLoRA | P-valuea | zero-shot | QLoRA | P-valuea | P-valueb |
| BLEU | 9.8 ± 9.8 | 2.0 ± 4.4 | 6.8 ± 5.5 | 45.9 ± 18.9 | <0.0001 | 3.5 ± 4.2 | 20.6 ± 15.5 | <0.0001 | <0.0001 |
| METEOR | 35.6 ± 16.0 | 18.8 ± 9.6 | 21.6 ± 7.3 | 62.4 ± 18.0 | <0.0001 | 21.8 ± 7.9 | 35.0 ± 16.1 | <0.0001 | <0.0001 |
| ROUGE-L | 22.4 ± 12.0 | 17.5 ± 9.6 | 21.3 ± 8.5 | 55.7 ± 17.8 | <0.0001 | 19.1 ± 7.4 | 32.8 ± 15.3 | <0.0001 | <0.0001 |
| BERT Score | 85.9 ± 2.5 | 81.6 ± 3.4 | 85.4 ± 2.0 | 91.6 ± 3.0 | <0.0001 | 83.5 ± 2.7 | 87.4 ± 3.9 | <0.0001 | <0.0001 |
| RadGraph F1 | 17.6 ± 10.8 | 11.2 ± 8.8 | 24.2 ± 11.6 | 47.7 ± 14.9 | <0.0001 | 14.7 ± 9.4 | 29.3 ± 10.4 | <0.0001 | <0.0001 |
BLEU, Bilingual Evaluation Understudy; METEOR, Metric for Evaluation of Translation with Explicit Ordering; ROUGE-L, Recall-Oriented Understudy for Gisting Evaluation—Longest Common Subsequence; BERT, Bidirectional Encoder Representations from Transformers.
aCompared zero-shot to QLoRA performance of the same model.
bCompared performance of QLoRA Llama-2 and Zephyr.
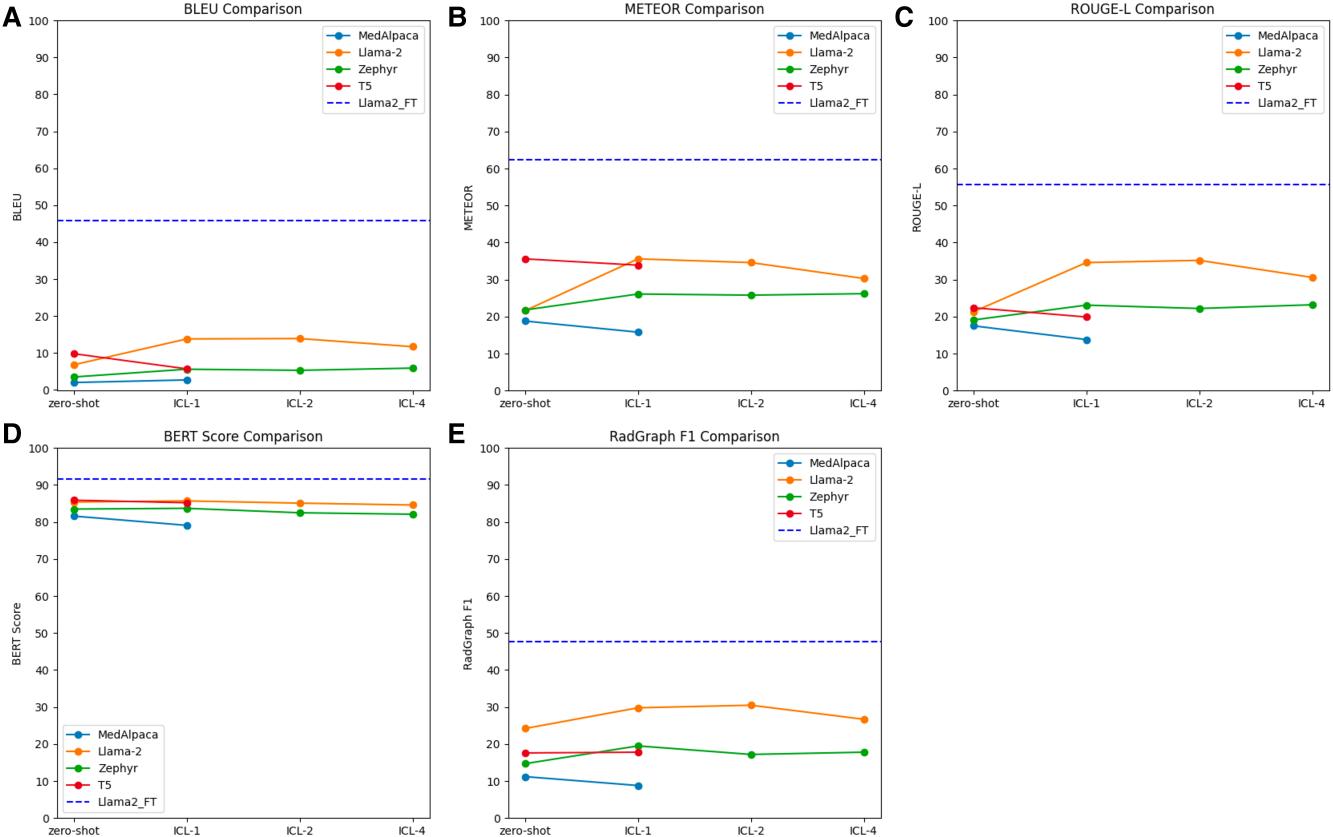
ICL performance of each LLM. Panel A to E correspond to BLEU, METEOR, ROUGE-L, BERT Score, and RadGraph F1 Score, respectively. Zero-shot and fine-tuned Llama-2 (EchoGPT; horizontal purple dashed line) performance was included for reference.
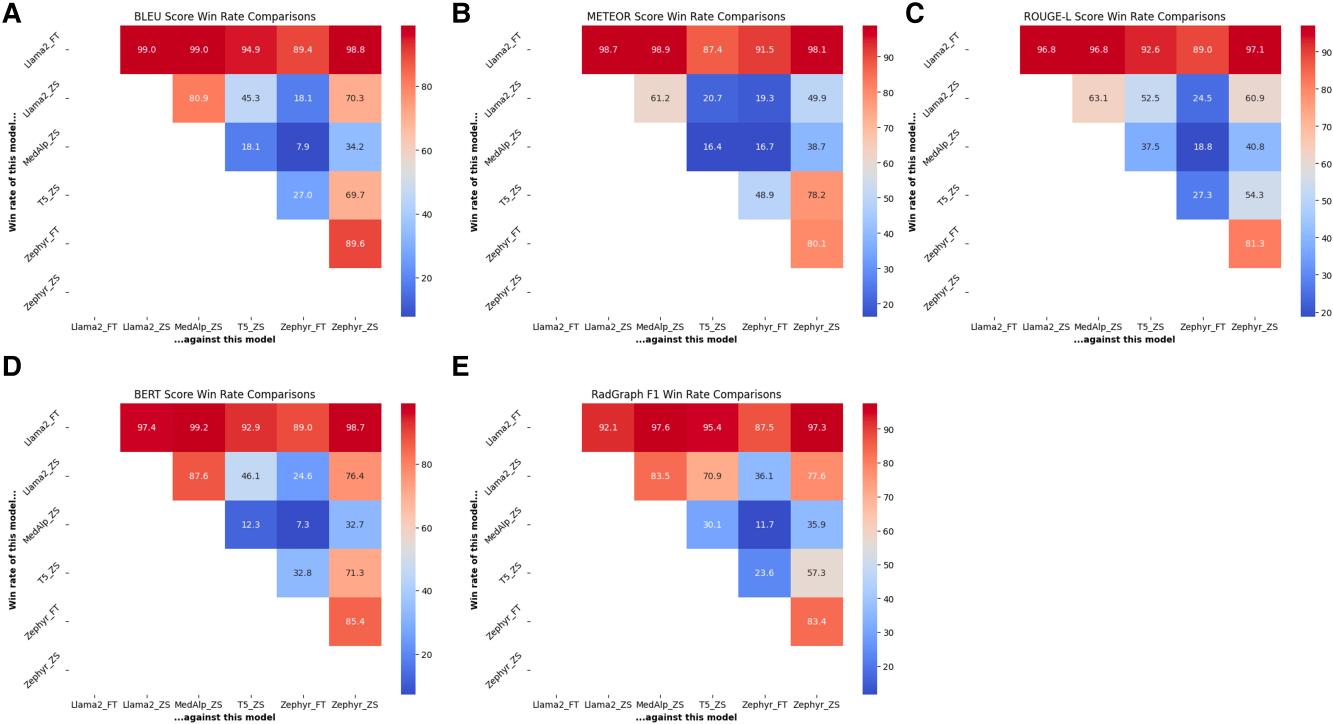
Model win rates on the test set. Model win rate heatmap illustrates the head-to-head win rate comparisons (in percentile) among different models based on the selected metrics. Cool colours indicate lower win rates and warm colours indicate higher win rates. We compared Llama-2 (base and fine-tuned), Zephyr (base and fine-tuned), T5 (base), and MedAlpaca (base). Fine-tuned Llama-2 consistently outperformed all other models across all five automatic metrics. FT, fine-tuned; ZS, zero-shot (base model). Result for each score were shown in Panel A–E.
Significance of measurement numbers in automatic metrics
Randomizing measurement values produces small score reductions despite obviously implausible clinical content. Table 5 reports RadGraph F1 decreasing from 47.7 to 45.3 and BERTScore from 91.6 to 91.2; all reported metric changes are statistically significant. Statistical significance here does not make the metrics sufficiently sensitive to harmful numerical errors.
| Model: EchoGPT | Original Response | Synthetic Response: Replaced Measurements with Random Numbers | QLoRA | Random Measurements | P-value |
|---|---|---|---|---|---|
| BLEU | Grade 1/4 left ventricular diastolic dysfunction, consistent with low to normal left ventricular filling pressure. Estimated right ventricular systolic pressure 24 (systolic blood pressure 108). Calculated ejection fraction; 64%. No regional wall motion abnormalities. Mildly enlarged mid ascending aorta diameter of 40. | Grade 9/53 left ventricular diastolic dysfunction, consistent with low to normal left ventricular filling pressure. Estimated right ventricular systolic pressure 68 (systolic blood pressure 52). Normal left ventricular chamber size. Calculated ejection fraction; 98%. No regional wall motion abnormalities. Mildly enlarged mid ascending aorta diameter of 12. | 45.9 ± 18.9 | 40.4 ± 16.4 | <0.0001 |
| METEOR | 62.4 ± 18.0 | 58.7 ± 16.8 | <0.0001 | ||
| ROUGE-L | 55.7 ± 17.8 | 52.2 ± 16.5 | <0.0001 | ||
| BERT Score | 91.6 ± 3.0 | 91.2 ± 2.8 | <0.0001 | ||
| RadGraph F1 | 47.7 ± 14.9 | 45.3 ± 13.7 | <0.0001 |
Comparison of automatic metrics between the original response and the synthetic response
Human expert evaluation
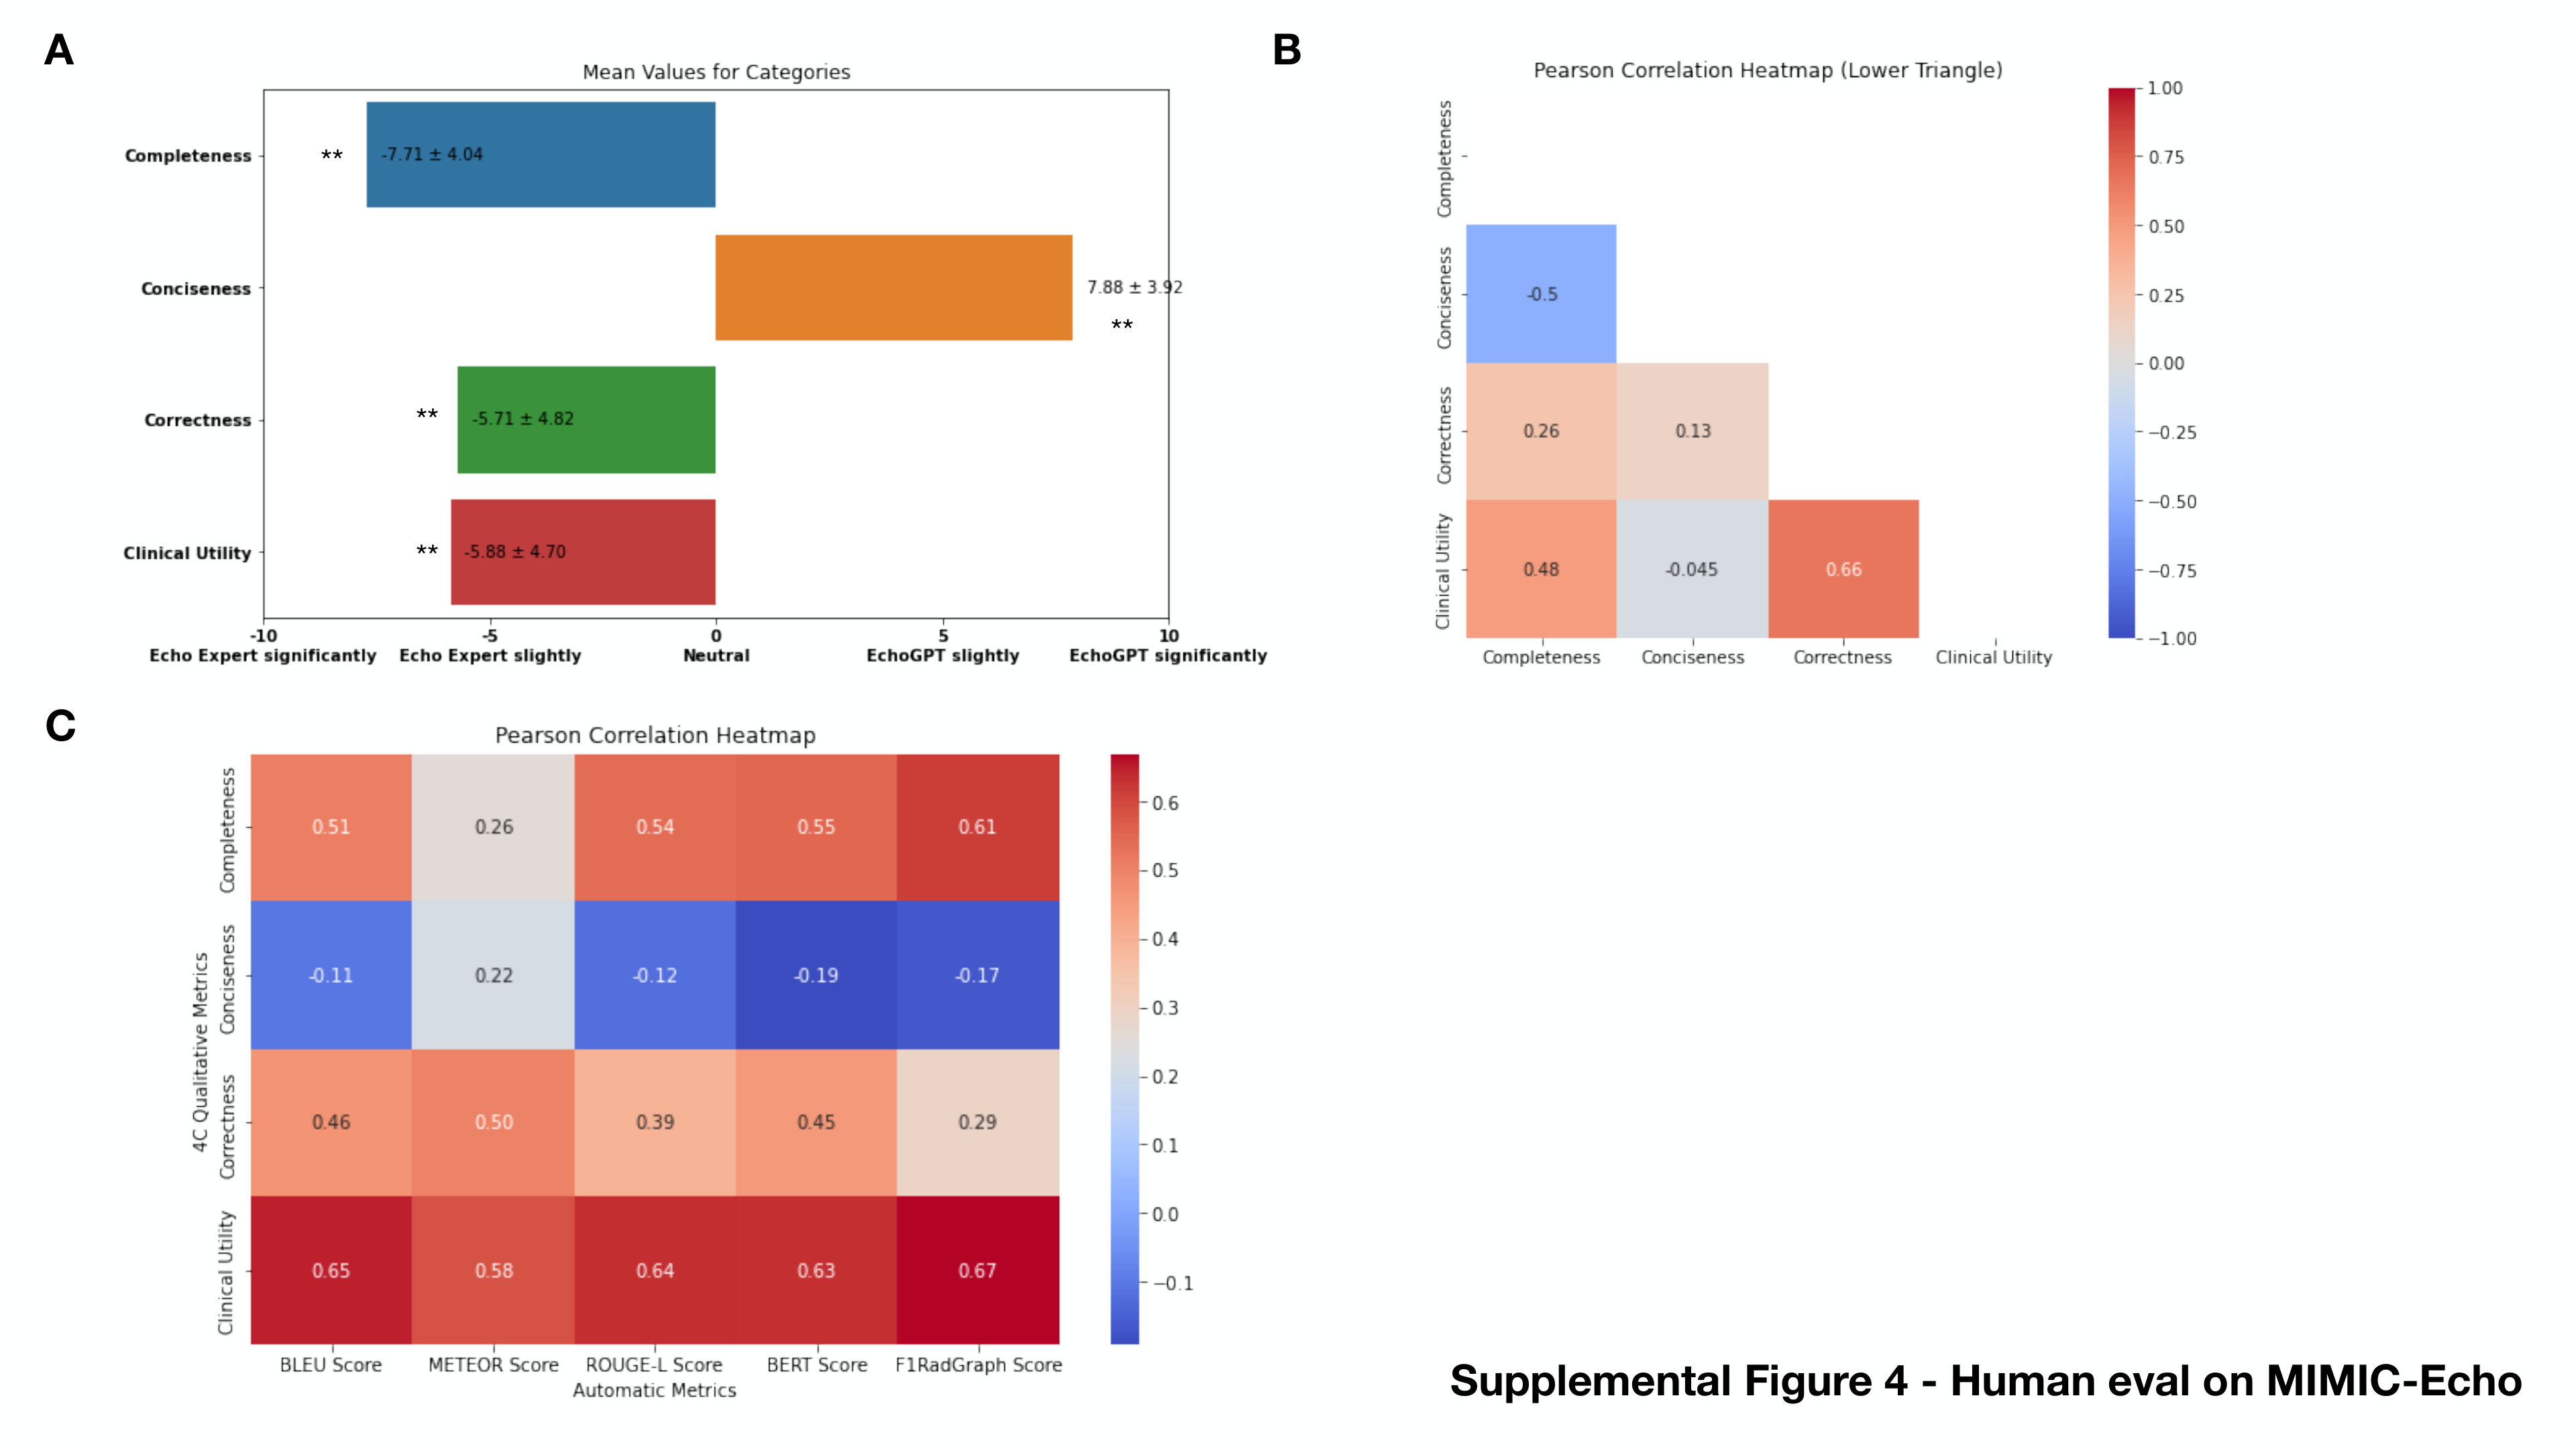
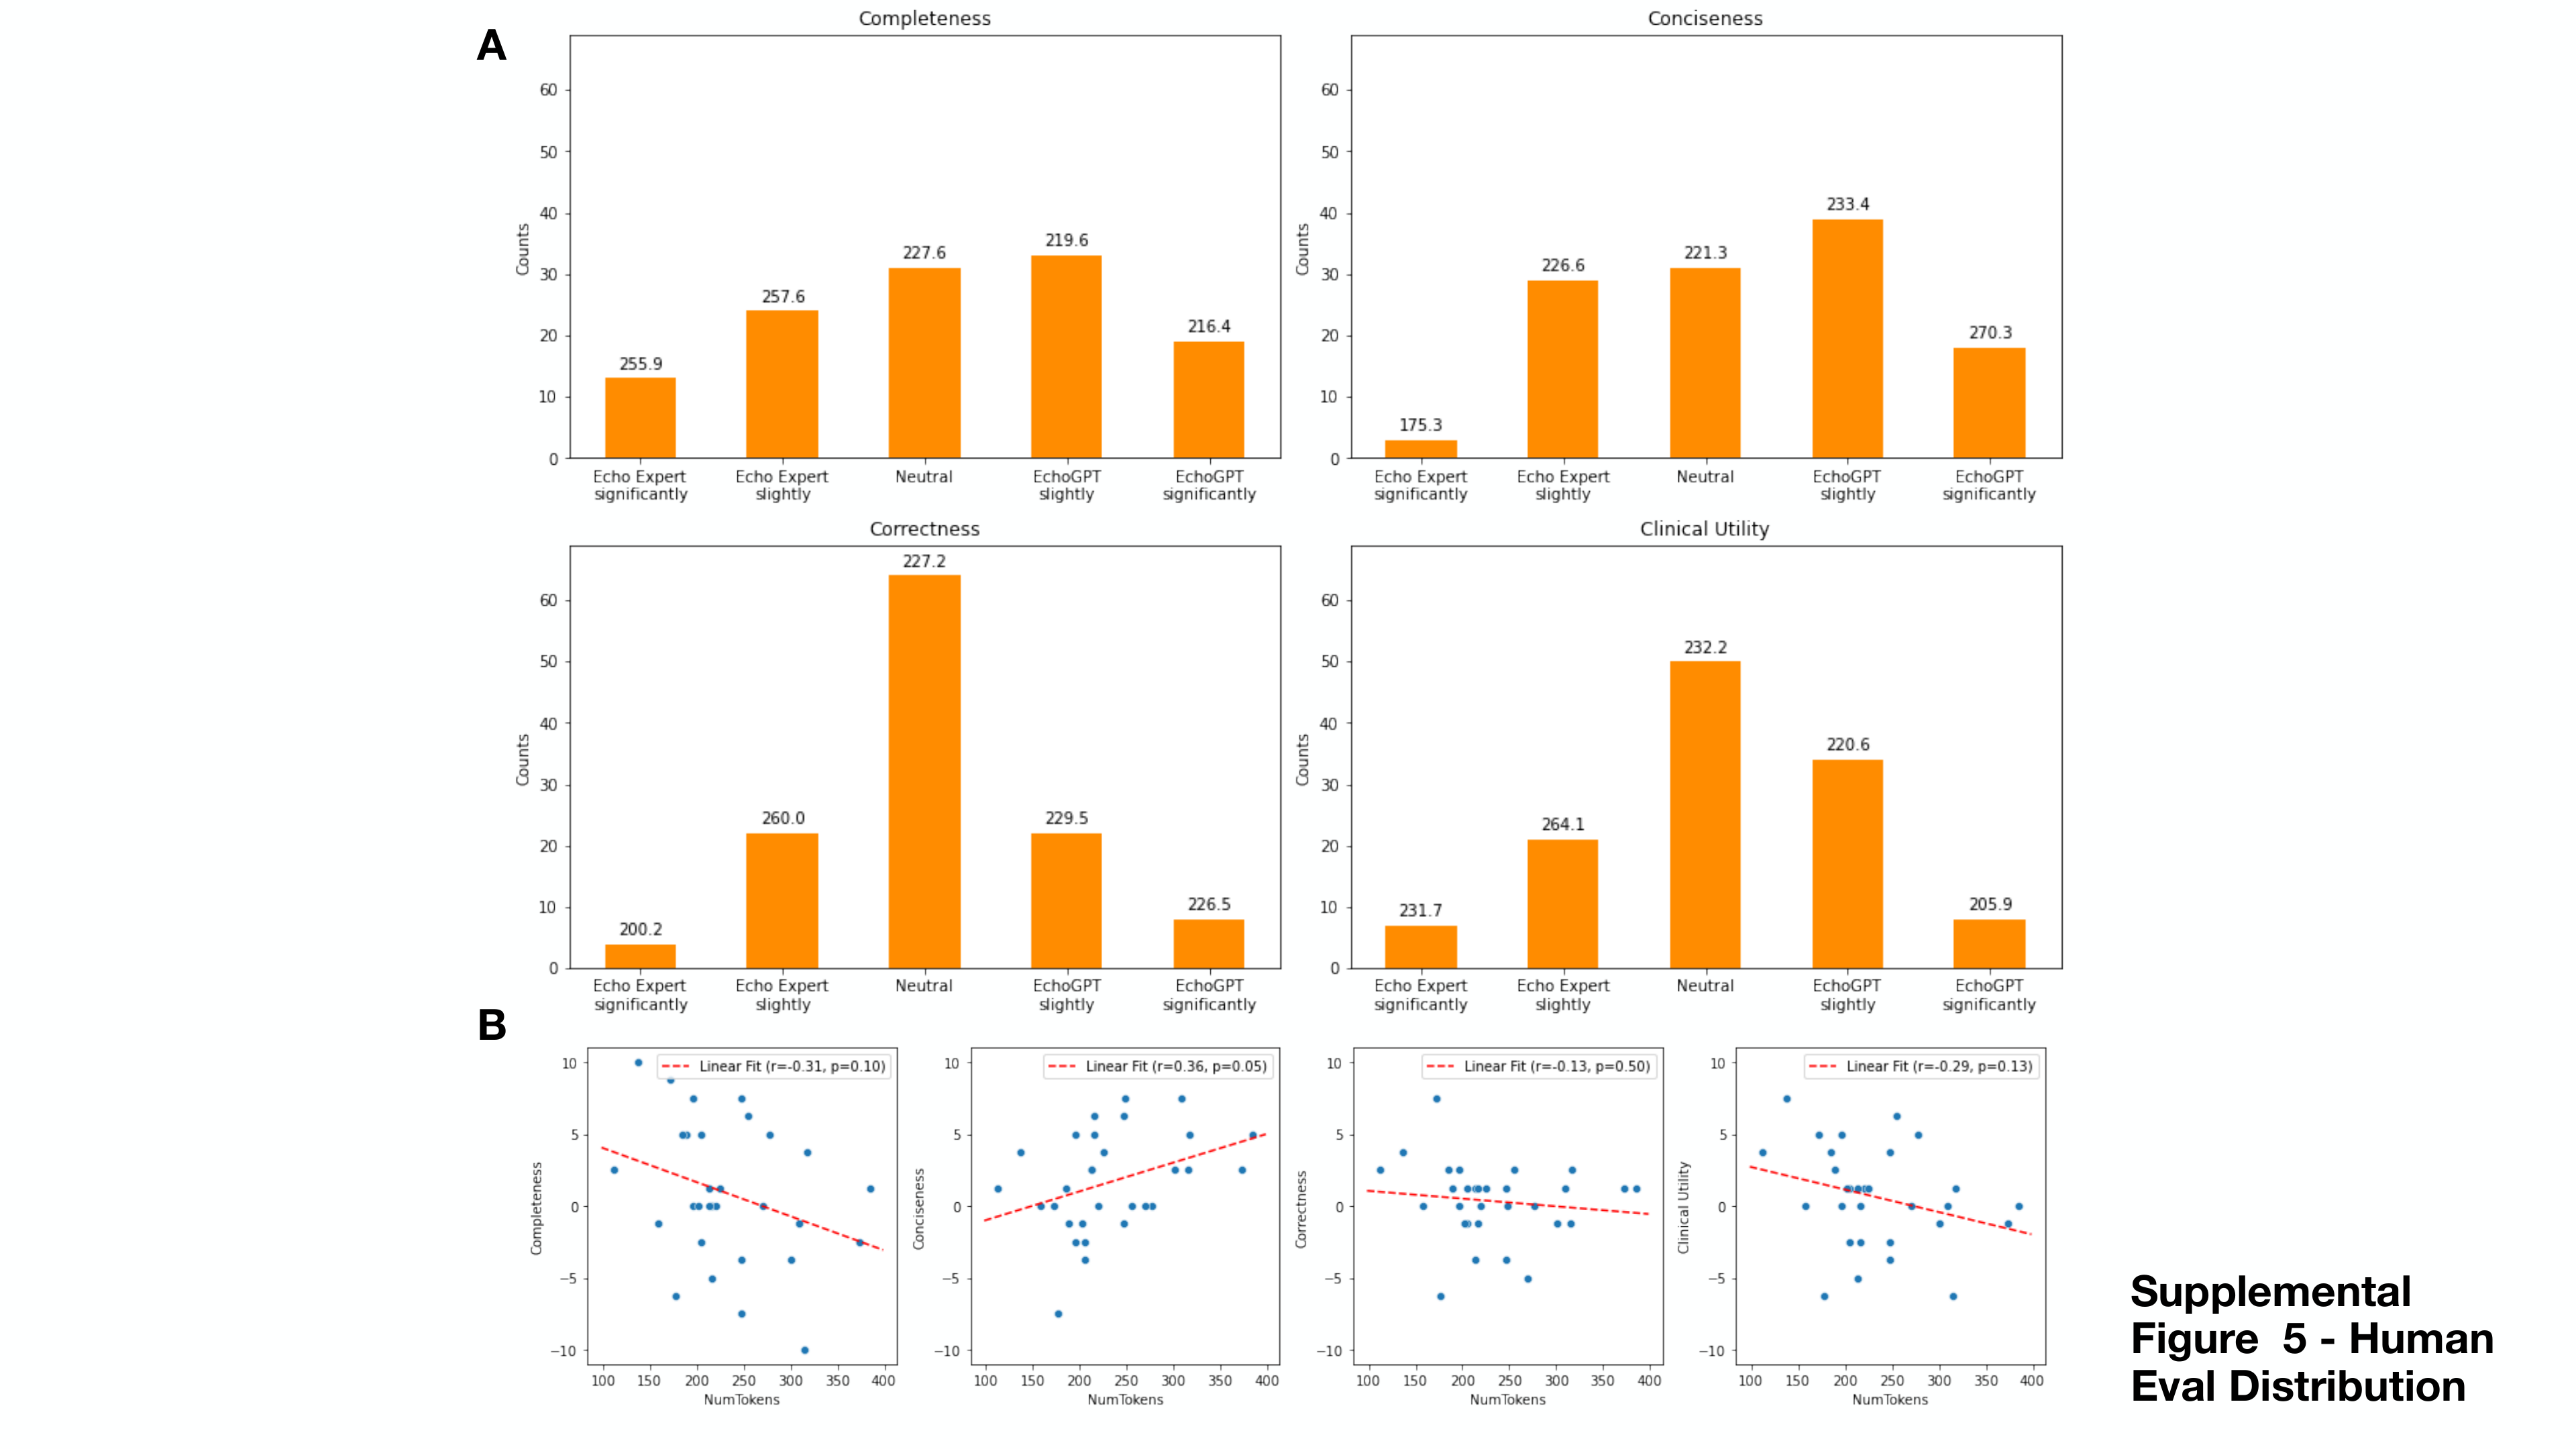
On the Mayo reader-study cases, EchoGPT is significantly preferred for conciseness (p < 0.001). Completeness, correctness, and clinical utility show no significant preference; this is not a formal equivalence result. Inter-reader agreement ranges from slight for correctness to moderate for completeness.
Completeness and clinical utility correlate strongly (r = 0.78). The largest reported automatic-metric correlation with clinical utility is RadGraph F1 at r = 0.42. Thus automatic scores capture only part of the experts’ assessment.
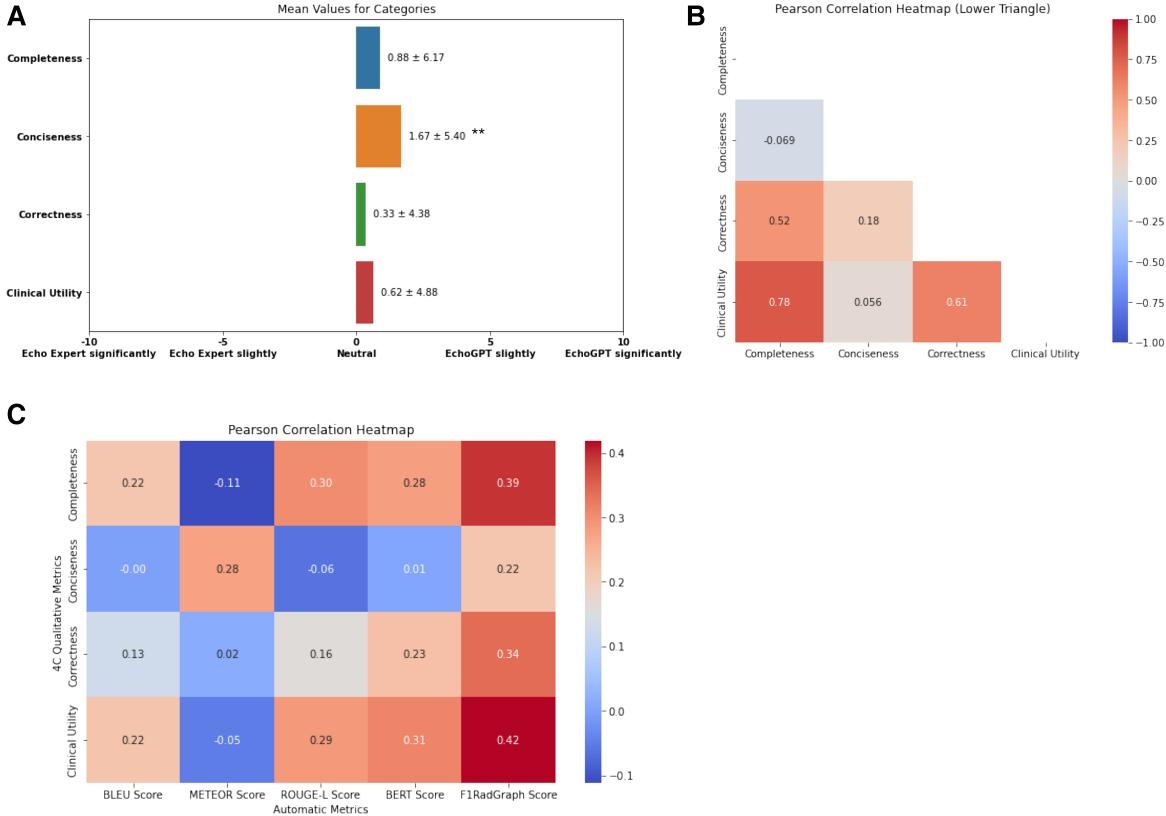
Human expert qualitative evaluation results. (A) In the four categories, EchoGPT significantly outperformed human experts in conciseness (P < 0.001). We did not observe significant differences among the other three categories (completeness, correctness, and clinical utility). (B) Showed interdependence of the 4C metrics, especially the correlations between clinical utility and completeness (Pearson’s r = 0.78), and modest to moderate correlations between other metrics. (C) Correlations between automatic metrics and the 4C metrics. Across all automatic metrics, RadGraph F1 had modest to moderate correlations with all four human evaluation metrics. Preference ratings were expressed as mean ± standard deviation, **indicates P < 0.001.
External validation on the MIMIC-EchoNotes dataset
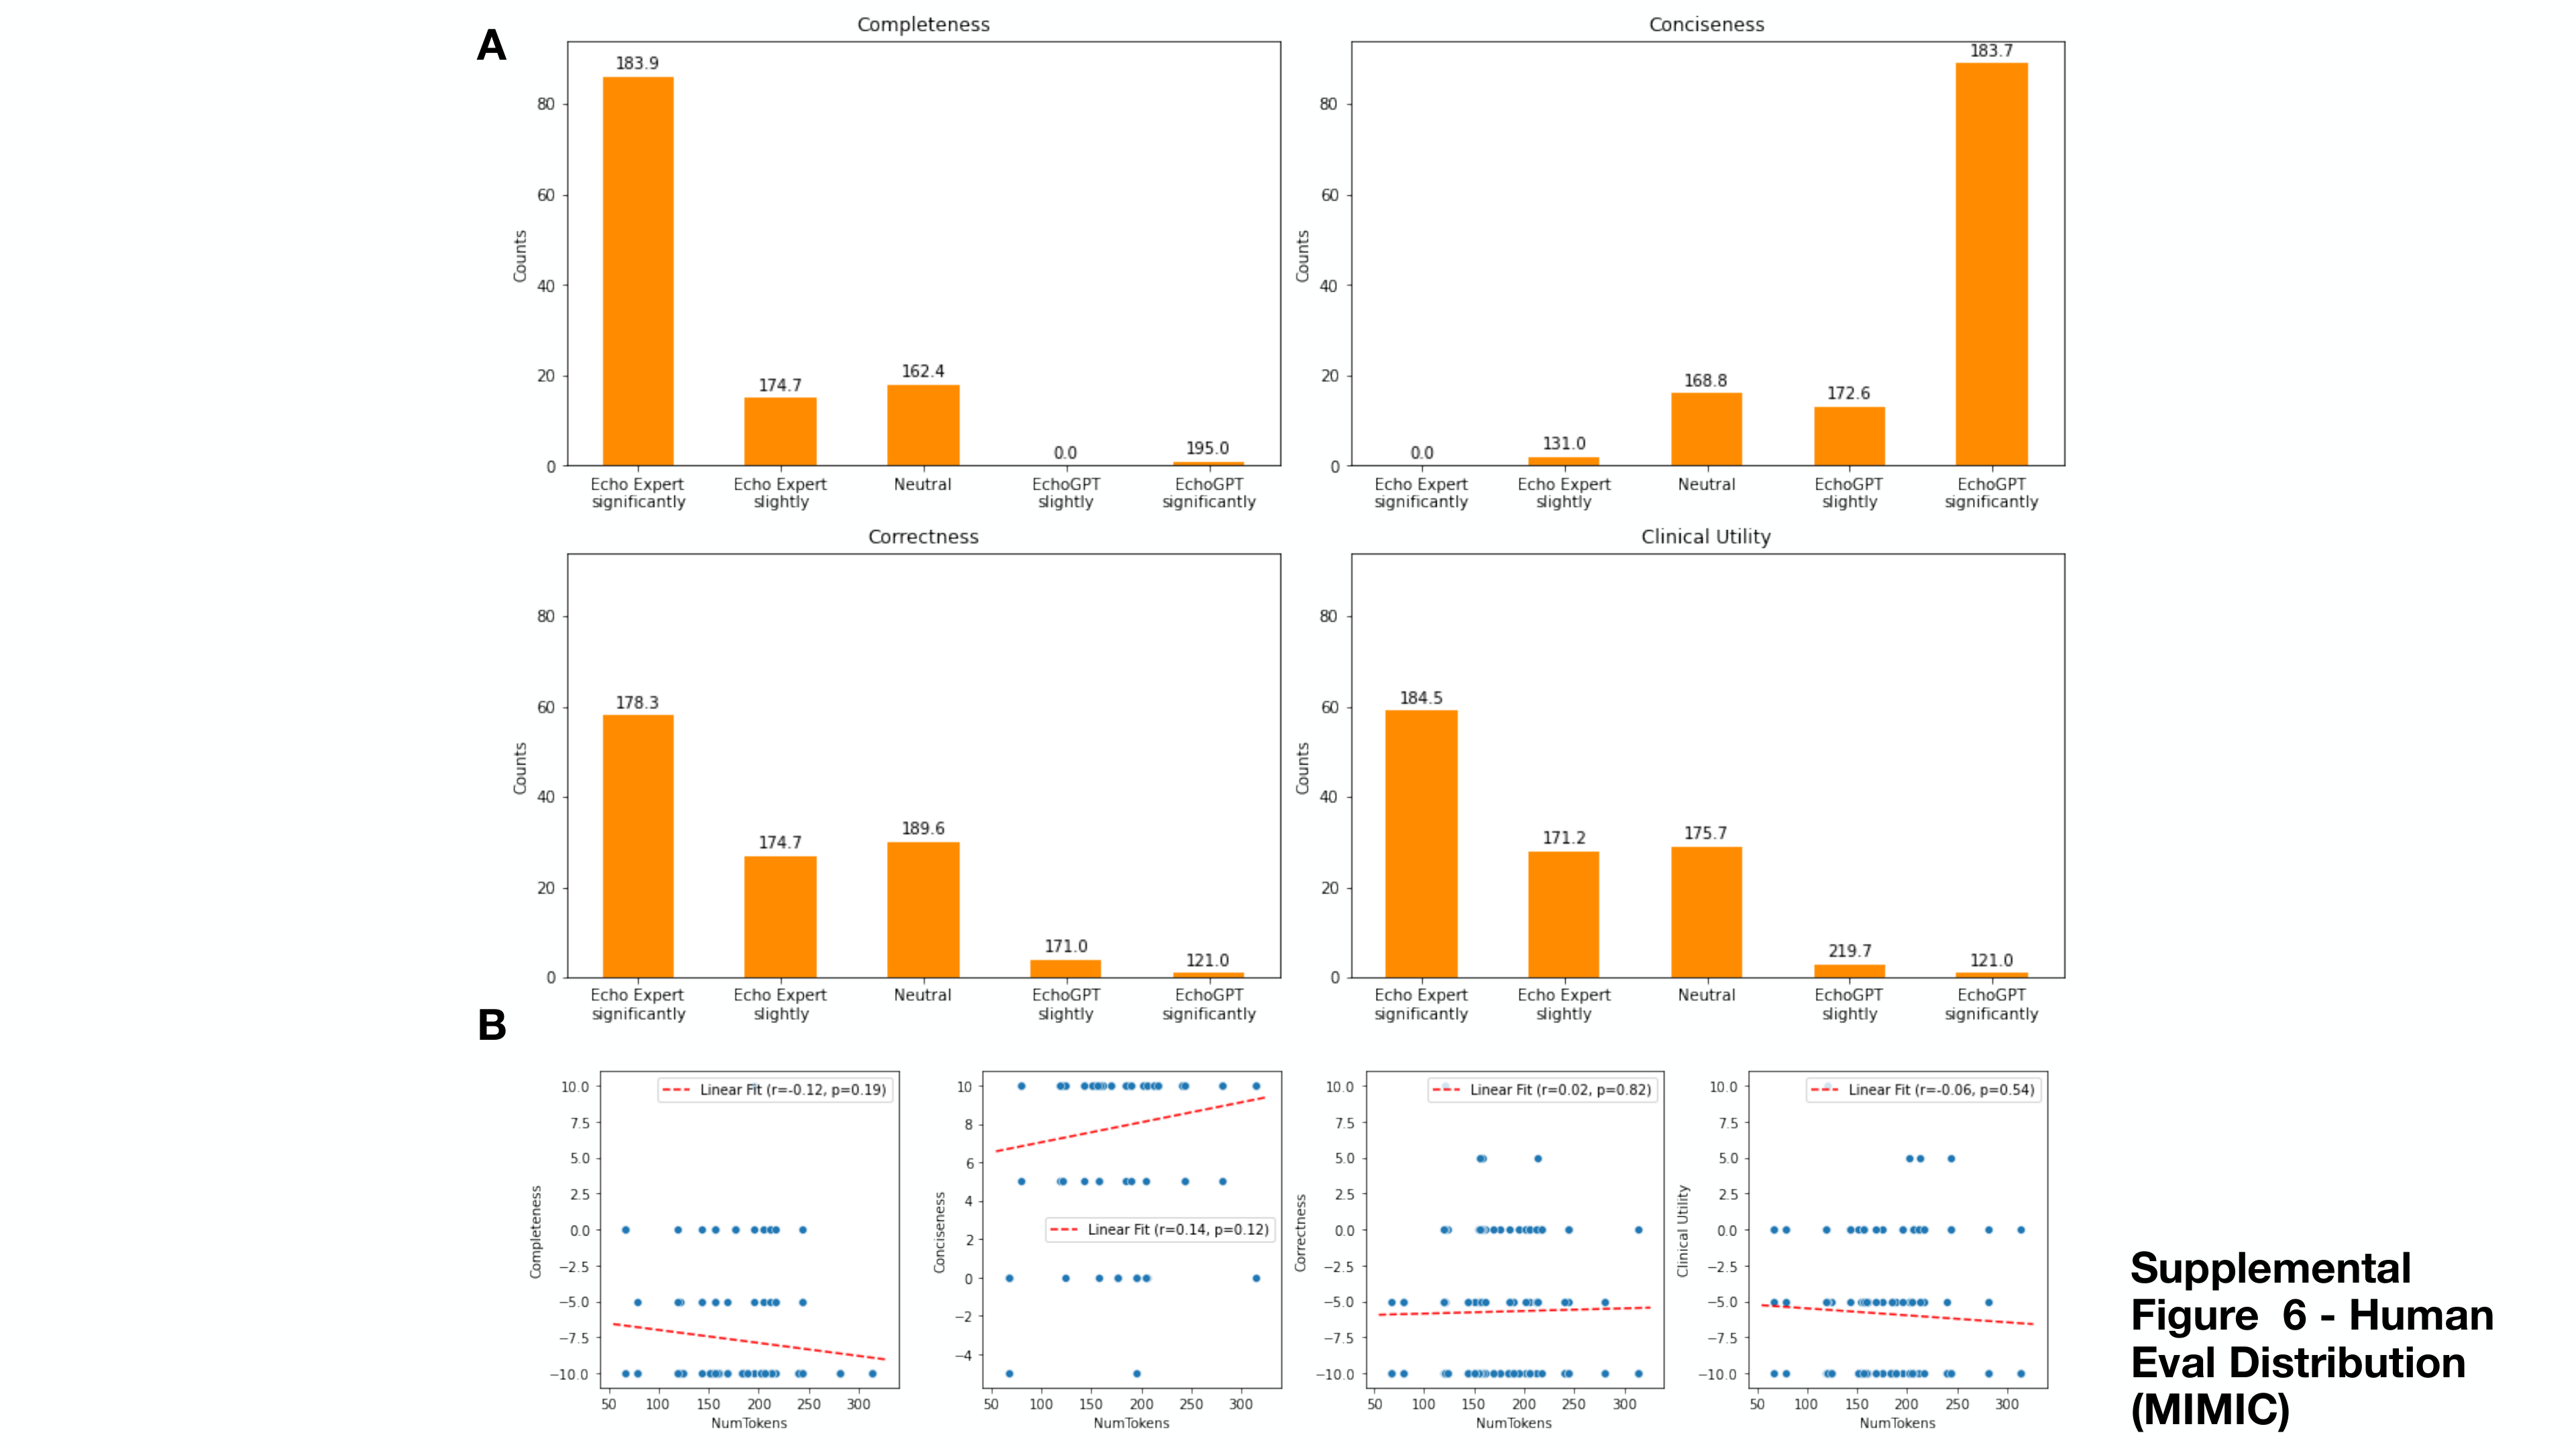
External MIMIC performance falls substantially: EchoGPT’s RadGraph F1 is 25.1 versus 47.7 in the development test and 39.0 in Arizona, on the source’s percentage scale. It still exceeds fine-tuned Zephyr, but cardiologists prefer the original MIMIC reports for completeness, correctness, and clinical utility (all p < 0.001). EchoGPT remains preferred for conciseness.
MIMIC reference summaries combine Conclusions and Impression and are often nearly as long as Findings. Free-text style and information beyond Findings also complicate comparison. Table 6 and Supplementary Figures 4 and 6 retain the actual examples, reviewer feedback, and preferences.
| Mayo Echo Report | Findings | Impression | EchoGPT Summary |
|---|---|---|---|
| Representative Example | Calculated 2-d linear left ventricular ejection fraction 61. No regional wall motion abnormalities. Aortic valve strands (on the ventricular side of the valve). Estimated right ventricular systolic pressure 23 (systolic blood pressure 108). Normal abdominal aorta Doppler flow pattern. Normal left ventricular wall thickness. No atrial level shunt by colour flow imaging. Left atrial volume index 30. Trivial aortic valve regurgitation. Trivial mitral valve regurgitation. Trivial pulmonary valve regurgitation. Trivial tricuspid valve regurgitation. No pericardial effusion. Normal aortic valve. Thickness. Normal pulmonary valve. Normal mitral valve. Normal tricuspid valve. Trileaflet aortic valve. Normal left ventricular chamber size. Normal right ventricular chamber size. Normal right atrial size. Normal left atrial size with normal inspiratory collapse (>50%) inferior vena cava size normal. Normal ascending aorta diameter. Normal right ventricular systolic function. Normal pulmonary valve systolic velocities. No abdominal aortic aneurysm. Normal left ventricular diastolic function. Calculated 2-d monoplane volumetric left ventricular ejection fraction 59. | Normal left ventricular chamber size. Calculated ejection fraction 61%. No regional wall motion abnormalities. Normal right ventricular chamber size and function. Estimated right ventricular systolic pressure 23 mmHg. Inferior vena cava size: normal, with normal inspiratory collapse (>50%). Normal left ventricular diastolic function. | No regional wall motion abnormalities. Normal cardiac valves. Estimated right ventricular systolic pressure 23 (systolic blood pressure 108). No pericardial effusion. Normal left ventricular chamber size and wall thickness. Calculated left ventricular ejection fraction 61%. Normal right ventricular chamber size and systolic function. Inferior vena cava size: normal, with normal inspiratory collapse (>50%) |
| Comments | Numbers were utilized in pertinent statements, such as right ventricular systolic pressure, systolic blood pressure, ejection fraction, and left atrial volume index. Typical reports detail the method of LVEF measurement alongside the value. | This section typically contains a 7–10-point summary that covers the overall condition of the heart. In this case, no information beyond the Findings was included. | EchoGPT captured the relevant findings, although not in the same order. LV ejection fraction measurement was included in the summary (61%). |
| MIMIC-EchoNote Report | Findings | Conclusions/Impression | EchoGPT Summary |
|---|---|---|---|
| Representative Example | Highly mobile echodensity (0.8 × 0.5 cm) in the right atrium, best seen on right ventricle inflow views, which appears to be attached to a catheter (catheter not fully visualized, but patient with history of port-A-cath). Doppler across tricuspid valve suggestive of tricuspid valve prolapse. Normal left atrium size. Normal right atrium size. Right atrium mass. Normal inferior vena cava diameter (≤2.1 cm) with >50% decrease with sniff (estimated right atrium pressure (0–5 mmHg). Normal left ventricle wall thickness, cavity size and regional/global systolic function (left ventricular ejection fraction >55%). Normal right ventricle chamber size and free wall motion. Normal diameter of aorta at the sinus, ascending and arch levels. No 2D or Doppler evidence of distal arch coarctation. Normal aortic valve leaflets (3). No aortic stenosis. No aortic regurgitation. Normal mitral valve leaflets with trivial mitral regurgitation. TVP. Mild tricuspid regurgitation. Normal pulmonic valve leaflet. No PS. Physiologic pulmonary regurgitation. No pericardial effusion. If clinically indicated, a transoesophageal echocardiographic examination is recommended. Echocardiographic results were reviewed by telephone with the MD caring for the patient. | The left atrium is normal in size. A highly mobile mass, measuring 0.8 × 0.5 cm, is seen in the right atrium (possibly attached to a catheter?) which may represent thrombus or vegetation. The estimated right atrial pressure is 0–5 mmHg. Left ventricular wall thickness, cavity size and regional/global systolic function are normal (left ventricular ejection fraction >55%). Right ventricular chamber size and free wall motion are normal. The diameters of aorta at the sinus, ascending and arch levels are normal. The aortic valve leaflets (3) appear structurally normal with good leaflet excursion and no aortic stenosis or aortic regurgitation. Tricuspid valve prolapse is present based on Doppler findings with mild tricuspid regurgitation. The mitral valve appears structurally normal with trivial mitral regurgitation. There is no pericardial effusion. Highly mobile mass is seen in the right atrium (possibly attached to a catheter?) which may represent thrombus or vegetation. Clinical correlation advised. Normal biventricular systolic function. Tricuspid valve prolapses with mild tricuspid regurgitation. If clinically indicated, a transoesophageal echocardiographic examination is recommended. Drs. and were notified of these findings at 4:45 p.m. today. | Mass noted in right atrium, measuring 0.8 × 0.5 cm, attached to a catheter (catheter not fully visualized but has history of port-A-cath). Doppler across tricuspid valve suggestive of tricuspid valve prolapse. Normal left ventricular chamber size, normal regional/global systolic function, estimated ejection fraction 60%. Normal right ventricular chamber size and function. Normal diameter of aorta at the sinus, ascending and arch levels. No 2D or Doppler evidence of distal arch coarctation. No pericardial effusion. If clinically indicated, a transoesophageal echocardiographic examination is recommended. |
| Comments | In the Findings section, normal LVEF was described as ‘LVEF > 55%’ without further specification. Measurements such as right ventricular systolic pressure, and LA volume index were not included in the report. | The combined section was longer than the Findings section. Information beyond the Findings was in the text: ‘Drs. and were notified…” | Relatively brief summary generated by EchoGPT, capturing the important findings (right atrial mass attached to catheter) and relevant recommendations. However, EchoGPT hallucinated estimated ejection fraction, which was a template sentence used at Mayo. |
Representative examples in reader study
Discussion
The study supports task-specific fine-tuning for drafting summaries within the evaluated workflow. It also exposes two separate weaknesses: example contamination during in-context learning and automatic scores that underreact to wrong measurements. The external reader study limits the broader claim that generated reports are comparable to cardiologists.
Model adaption approaches: in-context learning vs. fine-tuning
Long echo reports restrict in-context prompts to at most four examples. More examples increase computation and can contaminate the output with unrelated measurements. Fine-tuning avoids that particular prompt-level mixture and performs better here, although other tasks may favor in-context learning.
The discussion speculates that overly brief outputs may explain weaknesses of earlier EchoGen/BART summaries. This remains an interpretation: neither that model nor its qualitative examples was available for a direct comparison.
Evaluation of echo report summarization
Institution-specific templates and reporting practices affect both model quality and evaluation scores. Arizona performance is lower than development performance, and transfer to MIMIC is substantially worse even after changing the prompt. Human judgments themselves have limited agreement, especially for correctness and utility.
An exploratory longitudinal-comparison test uses 306 cases and performs poorly on automatic metrics. Supplementary Table 7 reports RadGraph F1 8.1 ± 18.3, while the main discussion states 8.2 ± 18.3. EchoGPT was not trained for this task; 71.9% of reference comparisons say no significant change. The complete examples and table are retained.
A dedicated measurement-aware evaluation is needed: text overlap and entity extraction do not adequately distinguish clinically different ejection-fraction values. Expert review can detect these errors but is expensive to scale.
Application of EchoGPT
The proposed use is a draft-report interface requiring expert review and approval. Hallucinations remain possible. Factuality optimization, preference optimization, retrieval, and clinical-impact evaluation are proposed future work, not demonstrated components of EchoGPT. Exporting a model trained on sensitive reports also requires attention to the source’s de-identification constraints.
Conclusions
Local QLoRA adaptation improves echo-report summarization and produces concise drafts, but automated evaluation, numerical fidelity, expert-assessment scalability, and transfer across institutions remain unresolved.
Limitations
The retrospective Mayo data are predominantly white and use standardized statements; results may not generalize to other populations or free-text workflows. Proprietary models and full fine-tuning are not compared. The reader study lacks full clinical context, and the model is not trained for longitudinal comparisons, factuality rewards, or human preferences.
Funding
The study received partial support from the American Society of Echocardiography’s Early-Career Development Grant for Echo Scientists.
Data availability
Mayo reports remain in controlled-access storage because of patient privacy. MIMIC-EchoNotes is public. The authors release a Llama-2 checkpoint and fine-tuning, inference, and statistical-analysis code in EchoGPT.
Supplementary figures
All six supplemental figure pages are retained with their panel labels and significance marks. Figures 4 and 6 show the external MIMIC preference results; Figure 5 shows the Mayo preference distributions and their relationship with summary length.
Supplementary tables
The seven original tables retain the hyperparameter comparisons, metric definitions, example outputs, in-context measurement contamination, external-model scores, reader agreement, and longitudinal-comparison results. Red highlights in Table 4 preserve the source’s numerical emphasis.
| Temperature (RP fixed at 1.1) | Repetition Penalty (Temp fixed at 0.1) | |||
|---|---|---|---|---|---|
| 0.1 | 0.5 | 0.9 | 1.2 | 1.3 |
LLaMA-2 | |||||
8.0 ± 5.4 | 8.8 ± 6.7 | 8.0 ± 6.1 | 5.5 ± 4.6 | 1.1 ± 1.8 | |
23.3 ± 8.2 | 24.1 ± 8.2 | 23.0 ± 8.1 | 20.1 ± 6.9 | 12.9 ± 5.7 | |
22.3 ± 7.4 | 23.2 ± 7.8 | 23.3 ± 9.3 | 18.7 ± 7.0 | 11.6 ± 5.3 | |
BERT Score | 85.7 ± 1.5 | 86.0 ± 1.4 | 85.8 ± 1.6 | 84.7 ± 2.0 | 82.4 ± 1.6 |
RadGraph F1 | 26.2 ± 9.9 | 25.9 ± 10.7 | 26.2 ± 12.4 | 20.4 ± 9.9 | 10.3 ± 7.0 |
MedAlpaca | |||||
0.9 ± 2.8 | 0.5 ± 1.6 | 0.7 ± 2.0 | 0.1 ± 0.8 | 0.0 ± 0.0 | |
12.3 ± 7.4 | 13.9 ± 8.9 | 13.1 ± 9.4 | 9.2 ± 6.1 | 5.6 ± 3.2 | |
9.9 ± 7.3 | 10.4 ± 7.9 | 9.4 ± 7.5 | 6.7 ± 4.9 | 3.9 ± 2.7 | |
BERT Score | 81.3 ± 2.7 | 81.6 ± 2.8 | 81.4 ± 3.1 | 80.4 ± 2.2 | 79.4 ± 1.6 |
RadGraph F1 | 7.1 ± 8.2 | 7.4 ± 7.1 | 7.9 ± 8.3 | 3.2 ± 3.9 | 1.0 ± 2.1 |
Zephyr | |||||
4.4 ± 6.3 | 4.0 ± 4.5 | 4.4 ± 5.0 | 1.3 ± 2.7 | 0.1 ± 0.6 | |
23.5 ± 8.3 | 22.8 ± 7.6 | 22.6 ± 9.1 | 18.1 ± 6.6 | 12.8 ± 5.8 | |
20.2 ± 7.8 | 19.6 ± 7.4 | 19.0 ± 7.6 | 14.6 ± 5.5 | 10.6 ± 5.1 | |
BERT Score | 83.6 ± 2.8 | 83.9 ± 2.5 | 83.5 ± 2.9 | 82.8 ± 2.0 | 81.5 ± 1.7 |
RadGraph F1 | 16.5 ± 9.6 | 16.4 ± 9.8 | 14.8 ± 10.8 | 7.9 ± 7.0 | 3.3 ± 4.7 |
Flan-T5 | |||||
9.6 ± 9.3 | 10.3 ± 10.2 | 9.8 ± 8.7 | 9.3 ± 8.2 | 9.9 ± 9.3 | |
37.0 ± 14.8 | 37.9 ± 15.3 | 37.5 ± 15.0 | 37.8 ± 15.0 | 37.7 ± 14.0 | |
22.8 ± 10.2 | 23.2 ± 10.4 | 22.7 ± 9.6 | 22.6 ± 9.8 | 22.8 ± 10.0 | |
BERT Score | 85.8 ± 2.2 | 86.1 ± 2.2 | 85.9 ± 2.3 | 86.0 ± 2.3 | 85.9 ± 2.1 |
RadGraph F1 | 18.2 ± 10.3 | 19.5 ± 10.9 | 18.3 ± 10.0 | 17.9 ± 10.4 | 18.5 ± 9.7 |
Temp: temperature, Repetition Penalty: RP, BLEU: Bilingual Evaluation Understudy, METEOR: Metric for Evaluation of Translation with Explicit ORdering, ROUGE-L: Recall-Oriented Understudy for Gisting Evaluation - Longest Common Subsequence, BERT: Bidirectional Encoder Representations from Transformers. | |||||
Metric | Description | Purpose | Typical Use Case |
|---|---|---|---|
Bilingual Evaluation Understudy; measures the precision of n-grams (up to 4-grams) * in generated text compared to reference texts. | Evaluates the quality of text generation by comparing overlap of n-grams. | Machine Translation, Text Generation | |
Metric for Evaluation of Translation with Explicit ORdering; combines precision, recall, and synonym matching. | Aims to improve upon BLEU by incorporating synonyms and stemming. | Machine Translation, Text Summarization | |
Recall-Oriented Understudy for Gisting Evaluation; measures overlap of n-grams, word sequences, and word pairs between generated and reference texts. | Focuses on recall and measures the quality of summaries or generated text. | Text Summarization, Document Retrieval | |
BERT Score | Uses contextual embeddings from BERT to evaluate the semantic similarity between generated and reference texts. | Measures the quality of text generation based on semantic similarity rather than surface-level features. | Text Generation, Summarization, Translation |
RadGraph F1 | RadGraph F1 score evaluates the performance of graph-based methods in medical imaging report generation, focusing on the precision and recall of entities and relations. | Assesses the accuracy of structured data representation in medical text. | Medical Report Generation, Information Extraction |
*In Natural Language Processing (NLP), a "gram" refers to a contiguous sequence of n items from a given text or speech sequence. | |||
Model | Ground Truth | LLaMA-2 | Flan-T5 | Zephyr | MedAlpaca |
|---|---|---|---|---|---|
Representative Example | Global hypokinesis with superimposed regional variation (please see wall motion graphics). estimated right ventricular systolic pressure 32 (systolic blood pressure 120). no pericardial effusion. no significant valvular heart disease. moderate-severely enlarged left ventricular chamber size; calculated ejection fraction 25%. normal right ventricular chamber size. with borderline decrease in systolic function. with normal inspiratory collapse (>50%) inferior vena cava size normal. indeterminate left ventricular diastolic function." | The patient presents with global hypokinesia and regional variation in left ventricular wall motion. There is no evidence of intracardiac mass or thrombus, but the left atrial appendage cannot be adequately visualized for thrombus exclusion. The estimated right ventricular systolic pressure is 32 mmHg, and there is an anterior epicardial fat layer. The pulmonary valve is partially visualized, and the abdominal aorta has an incomplete Doppler flow pattern. The left ventricular wall thickness is normal, and there is no atrial level shunt. However, the left atrium volume index is slightly elevated, and there is mild mitral valve regurgitation and trivial pulmonary valve regurgitation. Additionally, the patient has moderate-severe left ventricular chamber enlargement, normal right ventricular chamber size, and normal aortic valve function. Overall, the patient's cardiac function appears compromised, likely due to chronic heart failure. Further evaluation and management are warranted. | Calculated 2-d linear left ventricular ejection fraction 25. global hypokinesis with superimposed regional variation. No intracardiac mass or thrombus. | LVEF: 25% with superimposed regional variation (hypokinesis) - No intracardiac mass, but LAA cannot be ruled out for thrombus (transthoracic only) - Mild MR; trivial TR and PVR - Anterior epicardial fat; pulmonary valve not well visualized - Normal RV systolic pressures, AV, and RA sizes - Moderate-severe chamber enlargement; borderline RV syst. | Summary: This is a good study from which I can conclude that the patient has mild MR and TR. His LVESD is slightly above normal and his RVSV is slightly decreased. His PVR is also low. He does have a thrombus in the left atrial appendage, although it may not be noticeable on this particular study. His pulmonary artery velocity is normal, but the abdominal aorta could not be measured adequately. So, more information is needed for a full diagnosis. There is some fat in the epicardium, which is also nonspecific and might be seen in many patients. There is evidence of LV strain but again, more information is needed. The LA size is normal as is the RV size, and the IVC was normal. The aorta was normal in size. In general, there are no significant abnormalities and no cause for concern at this time. |
Comments | -- | Summary of the findings with transitioning words that did not alter the original meaning. | Concise summary but omitted clinical important information. | Concise bullet point summary with false information. | Medical Professional-sounding, but hallucinated information. |
| Sentence | Model Summary |
|---|---|---|
Case | Calculated 2-d linear left ventricular ejection fraction 57. | "Calculated 2-d linear left ventricular ejection fraction 57, 61, 75 (3 reports)" |
ICL Examples | Calculated 2-d linear left ventricular ejection fraction 56. | |
| Calculated 2-d linear left ventricular ejection fraction 75 | |
| Calculated 2-d linear left ventricular ejection fraction 69 | |
| Calculated 2-d linear left ventricular ejection fraction 61 |
Dataset | Mayo AZ validation | MIMIC-EchoNote | ||||
|---|---|---|---|---|---|---|
Model | LLaMA-2 | Zephyr | LLaMA-2 | Zephyr | ||
| P-value* | P-value* | ||||
37.8 ± 17.5 | 17.6 ± 13.8 | <0.0001 | 9.6 ± 10.6 | 3.6 ± 4.5 | <0.0001 | |
54.4 ± 17.3 | 32.9 ± 14.9 | <0.0001 | 40.2 ± 13.3 | 23.3 ± 10.1 | <0.0001 | |
47.4 ± 16.9 | 29.1 ± 13.7 | <0.0001 | 25.1 ± 12.8 | 14.6 ± 7.2 | <0.0001 | |
BERT Score | 90.1 ± 2.9 | 86.6 ± 3.8 | <0.0001 | 85.4 ± 2.0 | 80.2 ± 15.2 | <0.0001 |
RadGraph F1 | 39.0 ± 14.5 | 25.4 ± 12.2 | <0.0001 | 25.1 ± 13.9 | 15.4 ± 9.8 | <0.0001 |
*Compared performance of QLoRA Llama-2 and Zephyr. | ||||||
Metric | Fleiss’ Kappa between 4 raters | |
|---|---|---|
| Mayo | MIMIC-Echo |
Completeness | 0.49 | 0.49 |
Conciseness | 0.22 | 0.60 |
Correctness | 0.17 | 0.12 |
Clinical Utility | 0.34 | 0.14 |
Dataset | Longitudinal Report Comparison Subset | Representative Examples |
|---|---|---|
Model | EchoGPT | |
0.2 ± 1.2 | [Example 1] Reference Report: “No significant change has occurred.” EchoGPT: “No significant change in LV and RV size/function. No significant change in estimated RVSP.” [Example 2] Reference Report: “No significant change has occurred.” EchoGPT: Compared to the prior echo report, the EF has decreased and RVSP is lower. | |
7.3 ± 7.9 | ||
9.6 ± 9.0 | ||
BERT Score | 81.5 ± 11.8 | |
RadGraph F1 | 8.1 ± 18.3 | |
In the examples, EchoGPT was able to provide valid summaries, though these did not always match the ground truth and scored low on automatic metrics. It is important to note that this is a task for which EchoGPT was not specifically trained, and the reference reports can be highly variable and practice based. | ||