At a glance
The Clinical Behavioral Atlas (CBA) recognizes bedside activities and entities from ordinary RGB video. The study collected 140,160 camera-hours in eight rooms at one hospital and densely annotated selected clinically relevant clips. A hierarchical model links people, objects, poses and relationships to 40 activity labels.
Mean activity AP was 0.73 for room splits and 0.64 for time splits. Results support technical feasibility, with substantial variation across classes; they do not establish improved patient outcomes or readiness for routine clinical deployment. This edition retains all main-paper figures, tables and references. The separate supplementary appendix remains unavailable.
Introduction
Ambient intelligence uses environmental sensors and machine learning to interpret activities. The ICU is a demanding setting because care involves many people, overlapping events, small objects and occlusion [1] [2] [3].
The paper separates development, held-out testing and eventual deployment. Detailed clinical annotation is a central bottleneck. Recognition accuracy on selected videos is an intermediate result; reducing documentation burden or improving care requires subsequent validation in actual workflows.
Methods
The methods combine continuous video collection, a clinically defined label hierarchy, staged human annotation, a hierarchical recognition model, and spatial/temporal evaluation. Detailed architecture and some statistical procedures are referred to the separately linked appendix.
DATA COLLECTION
Sixteen cameras covered eight Stanford Hospital rooms from November 2021 to November 2022: two cameras per room, with one neurological ICU room and seven medical ICU rooms. Video resolution was 1920 × 1080 at fifteen frames per second.
This is a single-institution dataset. Multiple rooms and cameras provide variation within that institution, rather than an external hospital validation.
HUMAN SUBJECTS REVIEW
The Stanford Institutional Review Board approved the study. Figure 1 uses a scene recreated by research staff to protect patient privacy; its pictured person should not be interpreted as a study patient.
DATA LABELS (TAXONOMY)
The taxonomy contains 40 activity classes across preventive measures, activities of daily living, diagnostic procedures and therapeutic procedures. It also describes 55 object categories, guided by clinical equipment and nursing documentation.
Five care bundles motivate the activities: ABCDEF, deep-vein thrombosis prophylaxis, pressure-injury prevention, health-care-associated infection prevention and ventilator-associated pneumonia prevention. ABCDEF covers pain, awakening/breathing trials, sedation choice, delirium, early mobility and family engagement. The full supplementary category definitions were not retrieved.
DATA ANNOTATION
Clinicians, nurses and safety monitors first selected relevant clips and assigned activity labels. Vendor annotators then drew entity boxes, labeled attributes and relationships, and tracked entities across frames. A preliminary model helped identify potentially useful additional clips, followed by human review and subsampling.
The resulting annotated sample is enriched for selected clinical events. Its class frequencies do not directly estimate how often those events occur throughout unselected continuous ICU video. Repeated frame boxes and track instances are distinct from independent patients.
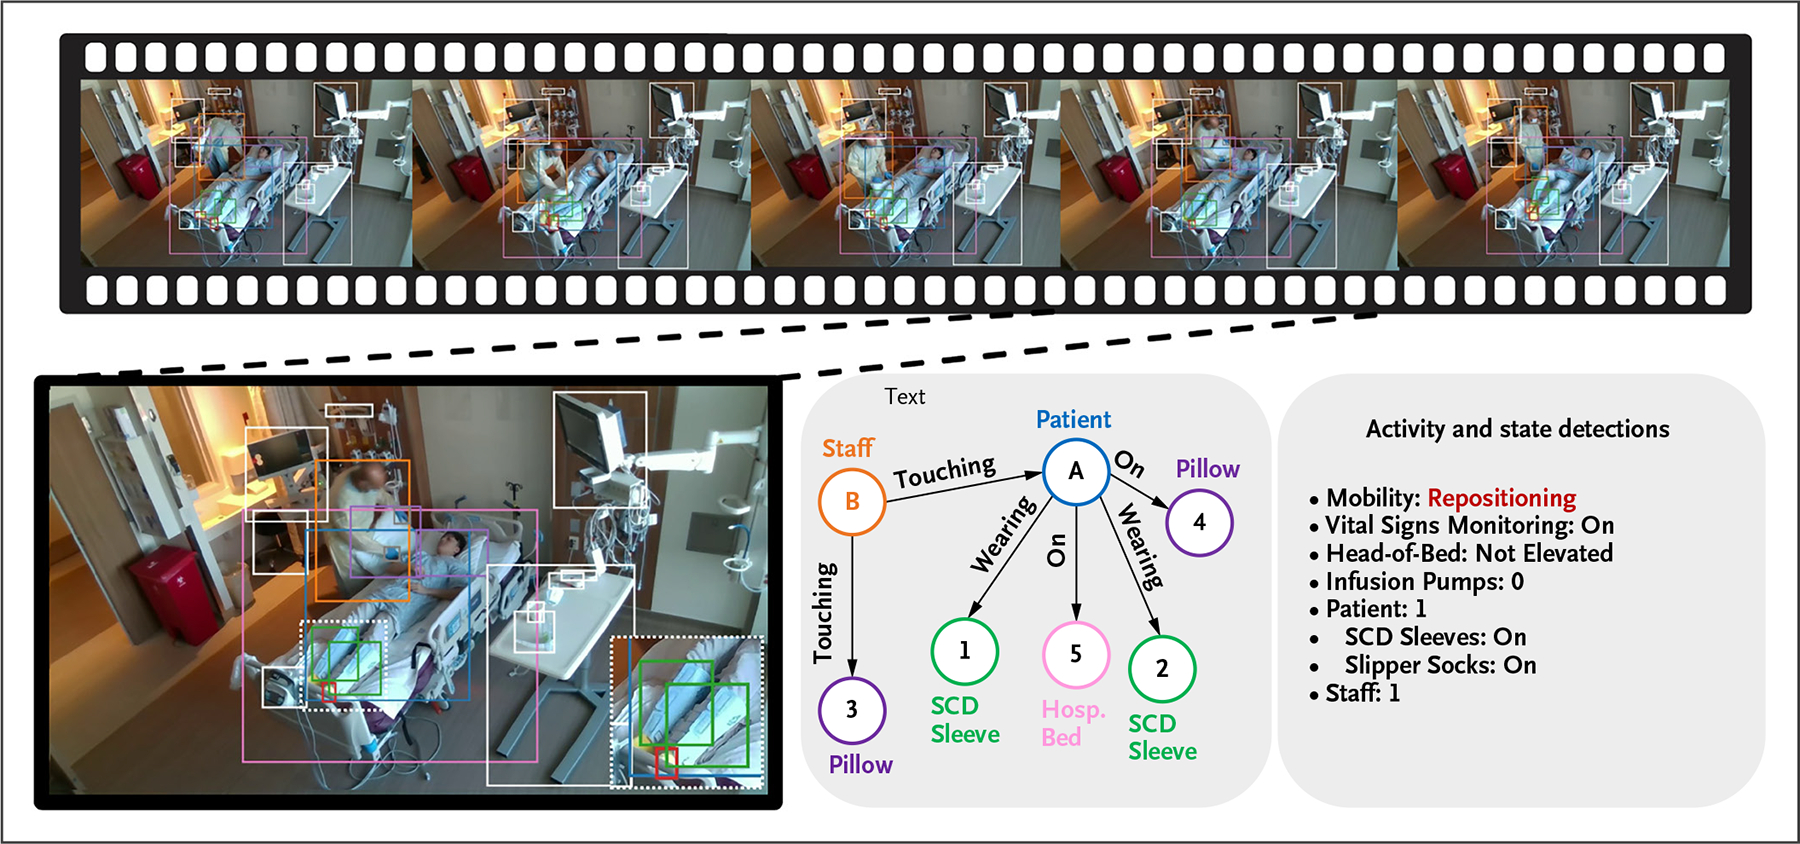
Example data collected from our intensive care unit rooms, with overlayed entity annotations (bottom row, left), relationships between entities (bottom row, middle) and details about activities, objects, and attributes (bottom row, right). Note that this is an example setup recreated by our research staff to preserve the privacy of the patients. Hosp denotes hospital; and SCD, sequential compression device.
Table 1. Demographic and Clinical Characteristics of the Study Cohort. *
The complete original cohort table is retained. It reports 494 patients, 196 receiving ventilation and 31 receiving CPAP/BiPAP. The displayed female/male rows sum to 443; each displayed age and weight grouping also sums to 443, leaving 51 patients unaccounted for in these breakdowns.
Ventilation counts in the demographic rows sum to 181 and CPAP/BiPAP counts to 26, rather than the overall totals. The source does not explain these differences. Percentages use all 494 patients as the denominator; they are not within-subgroup treatment rates.
Demographic and Clinical Characteristics of the Study Cohort.*
| Group | Total n (%) | Ventilated n (%) | CPAP/BiPAP Therapy n (%) | Length of Stay (days) |
|---|---|---|---|---|
| Total | 494 (100.00) | 196 (39.68) | 31 (6.28) | 3.76 |
| Gender | ||||
| Female | 162 (32.79) | 56 (11.34) | 14 (2.83) | 3.94 |
| Male | 281 (56.88) | 125 (25.30) | 12 (2.43) | 3.69 |
| Age (year) | ||||
| 18–29 | 9 (1.82) | 3 (0.61) | 0 (0.00) | 3.26 |
| 30–39 | 25 (5.06) | 11 (2.23) | 3 (0.61) | 3.44 |
| 40–49 | 37 (7.49) | 14 (2.83) | 0 (0.00) | 3.54 |
| 50–59 | 88 (17.81) | 40 (8.10) | 3 (0.61) | 4.27 |
| 60–69 | 121 (24.49) | 58 (11.74) | 8 (1.62) | 3.52 |
| 70–85 | 136 (27.53) | 52 (10.53) | 8 (1.62) | 4.01 |
| >85 | 27 (5.47) | 3 (0.61) | 4 (0.81) | 2.96 |
| Weight (kg) | ||||
| <50 | 13 (2.63) | 3 (0.61) | 0 (0.00) | 2.66 |
| 50–59 | 50 (10.12) | 17 (3.44) | 2 (0.40) | 2.62 |
| 60–69 | 94 (19.03) | 39 (7.89) | 7 (1.42) | 4.81 |
| 70–79 | 82 (16.60) | 29 (5.87) | 4 (0.81) | 4.04 |
| 80–89 | 86 (17.41) | 38 (7.69) | 8 (1.62) | 3.55 |
| >90 | 118 (23.89) | 55 (11.13) | 5 (1.01) | 3.55 |
ALGORITHM DEVELOPMENT
The recognition hierarchy first describes the entities and their relationships, then uses those descriptions to identify clinically relevant activities.
Problem Formulation
The upper level performs multilabel activity parsing, allowing simultaneous activities. The lower level generates a scene graph: people and objects are entities, while their attributes and pairwise relationships are predicates. Actor entities also carry body-joint keypoints [9].
Model Architecture
The pipeline detects people and objects, estimates poses and attributes, tracks entities across frames, and aggregates those features into a graph. A graph neural network recognizes activities and states over the target period. Public-image pretraining precedes fine-tuning on the CBA dataset [9] [10] [11].
The main article provides this high-level design. Its detailed model description is in appendix section SA5, which is not included here; the edition does not infer missing implementation details.
EVALUATION AND STATISTICAL ANALYSIS
Evaluation tests different rooms and time periods, reports per-class recognition metrics, and compares the model with four video-recognition baselines. The split unit matters because nearby frames and repeated observations of one patient are correlated.
Dataset Splits and Algorithm Testing
Each split uses 75% training data and 25% test data. Four room-based splits train on six rooms and test on two held-out rooms. Two time-based splits hold out consecutive video periods. Performance is averaged within each split category.
The paper says several splitting schemes separate patients between training and testing. Without the detailed SA4 appendix, this should not be strengthened to a claim that every split is patient-disjoint. Room holdout also does not test transfer to another hospital.
Descriptive Analytics
Applying the model to long video streams could describe event frequency, timing and context. The paper presents this as a potential use of the system, rather than a validated clinical intervention or a demonstrated reduction in staff workload.
Algorithm Performance
Activity recognition is evaluated as per-frame multilabel classification using AP and other classification metrics. Entity detection additionally requires localization and categorization. The paper reports uncertainty across train/test splits and uses 1,000 label permutations to compare recognition with shuffled-label models [12] [13] [14].
Most activity categories exceed the permutation baseline at p < 0.05. This is evidence against that chance model, rather than a test of clinical utility or a guarantee against every form of overfitting. The missing appendix prevents checking the permutation details and treatment of correlated frames.
Uncertainty notation is inconsistent: the results call the overall ± values standard deviations, while table headings describe 95% confidence intervals. Only two temporal and four room splits underlie the respective summaries; the ± values should not be interpreted as uncertainty from thousands of independent patients.
Sensitivity Analysis
The study examines associations between performance, available examples and entity size. Those comparisons help identify difficult classes. Across-class associations alone do not establish how much a given model would improve after collecting a specified amount of additional data.
Results
From 140,160 recorded camera-hours, the team selected 33,397 clips totaling 175.4 hours, then densely labeled 354,995 frames. The annotations include 877,069 actor boxes and 6,997,841 object boxes, grouped into 77,937 actor-track and 654,425 object-track instances. These are repeated observations, rather than counts of distinct people or physical objects.
The model achieved room-split mean AP 0.73 ± 0.10, sensitivity 0.81 and specificity 0.95; temporal values were 0.64 ± 0.13, 0.75 and 0.95. Against ViViT, mean AP differences were 0.45 for room splits and 0.30 for time splits [15] [16] [17] [18].
The source says all methods performed better on room splits, but Table 3 shows the opposite for all four learned baselines: for example, ViViT is 0.34 on time splits and 0.28 on room splits. Only CBA follows the claimed direction. Figure 2 reports an across-class performance–duration association with R² = 0.58; it is not a controlled data-scaling experiment.
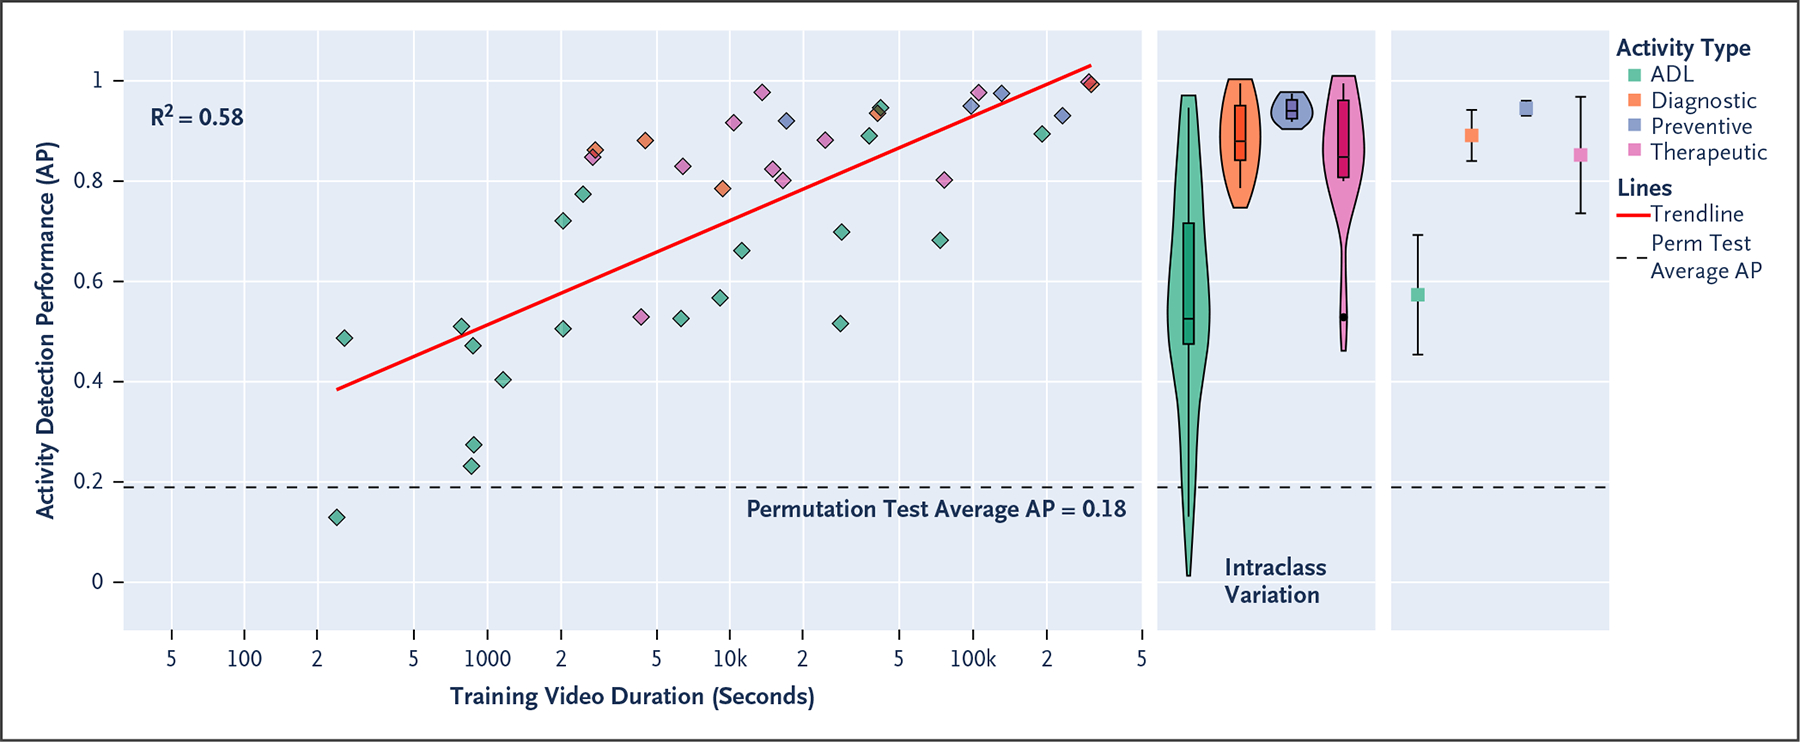
The relationship between model performance, object activity, and the number of data for model development, defined in terms of video duration. The activities included in each category are listed in Table A1 in the Supplementary Appendix. The main plot (left) highlights a positive correlation between activity detection and video duration. The first marginal graph shows the intraclass variations of activity detection within superclasses, while the second marginal graph illustrates activity detection’s cross-validation results across six data-splitting methods, including 95% confidence intervals. ADL denotes activities of daily living; AP, average precision; and R2, coefficient of determination.
Table 2. Entity Detection Results: The Model Was Trained and Evaluated on 354,995 Annotated Frames. *
The full table preserves every entity class, size, count and reported AP. Its AP values are percentages, whereas Table 3 uses fractions. Hospital-bed AP is 94.2%, but oral-swab/toothbrush AP is only 7.9%; small clinical tools remain difficult.
There are 56 displayed entity rows, including patient and non-patient classes and several device variants. This displayed inventory should not be silently equated with the stated 55-object taxonomy. Frame-level counts contain repeated appearances of the same tracked entity.
Entity Detection Results: The Model Was Trained and Evaluated on 354,995 Annotated Frames.*
| Entity Class | Size | Count | mAP (95% CI) |
|---|---|---|---|
| Bed pad | M | 143,546 | 57.4±5.5 |
| Call light | S | 146,758 | 58.9±5.2 |
| Cell phone | S | 170,070 | 62.9±4.4 |
| Chair | M | 168,267 | 73.1±3.5 |
| Commode | M | 31,528 | 78.2±2.0 |
| CPAP/BiPAP machine | M | 26,399 | 83.7±2.3 |
| CRRT machine | L | 11,485 | 84.8±4.7 |
| Drink | S | 674,528 | 72.9±3.1 |
| ECG machine | M | 7659 | 89.0±2.7 |
| Enteral feeding pump | S | 42,984 | 78.4±2.0 |
| Face mask | S | 361,864 | 60.4±1.6 |
| Food | S | 106,190 | 48.4±5.7 |
| Food tray | S | 33,884 | 81.4±3.3 |
| Hair cap | S | 38,082 | 71.3±9.2 |
| Heel protector | S | 41,355 | 71.1±7.5 |
| Hemodialysis Machine | L | 4581 | 81.6±6.2 |
| Hemodynamic Monitor | M | 45,569 | 81.1±3.3 |
| HFNC machine | M | 7080 | 59.6±5.7 |
| Hospital bed | L | 354,008 | 94.2±0.9 |
| IABP machine (model 1) | M | 13,715 | 76.2±6.1 |
| IABP machine (model 2) | M | 2584 | 52.5±13.0 |
| Incentive spirometer | S | 98,670 | 54.6±7.5 |
| Infusion pump | S | 572,914 | 88.4±1.5 |
| IPV machine | M | 17,208 | 77.0±3.5 |
| Laptop | S | 5777 | 59.5±18.1 |
| Nitric oxide machine | M | 14,971 | 84.2±6.9 |
| Oral suctioning tool | S | 98,225 | 45.7±4.9 |
| Oral swab/toothbrush | S | 5655 | 7.9±2.0 |
| Patient | M | 352,345 | 87.4±2.4 |
| Patient lift | S | 268,489 | 72.9±3.2 |
| Patient room phone | S | 152,513 | 63.2±4.8 |
| Pillow | S | 869,745 | 75.6±2.8 |
| SCD pump | S | 184,897 | 81.4±1.9 |
| SCD sleeve | S | 113,551 | 64.4±4.2 |
| Slipper sock | S | 184,306 | 73.7±2.6 |
| Sofa | M | 183,891 | 87.0±1.6 |
| Non-patient | M | 524,724 | 93.2±0.7 |
| Stool | S | 125,658 | 83.7±2.7 |
| Surgical glove | S | 368,968 | 62.0±1.3 |
| Tablet | S | 12,223 | 41.9±3.6 |
| Tray table | M | 225,105 | 92.5±1.4 |
| Ultrasound machine (model 1) | L | 4842 | 86.5±2.8 |
| Ultrasound machine (model 2) | M | 8029 | 82.2±4.3 |
| Ultrasound machine (model 3) | M | 1483 | 79.8±30.3 |
| Urinal | S | 62,551 | 75.7±5.8 |
| Urinary drainage bag | S | 31,532 | 43.8±3.6 |
| Ventilator (model 1) | M | 102,025 | 81.9±1.5 |
| Ventilator (model 2) | M | 14,689 | 71.3±0.2 |
| Vital signs monitor | M | 348,173 | 93.1±1.3 |
| Walker | M | 17,592 | 72.6±11.7 |
| Wedge | S | 63,326 | 54.3±1.9 |
| Wet wipe | S | 50,533 | 51.8±6.8 |
| Wheelchair | M | 4987 | 39.5±16.6 |
| Workstation (fixed) | M | 337,575 | 90.8±1.9 |
| Workstation (portable) | M | 7297 | 75.5±22.4 |
| X-ray machine | L | 4098 | 91.2±1.7 |
The statistic mAP denotes the per-class average precision for entity detection. The size of each object category is described as small (e.g., a cell phone), medium (e.g., a chair), and large (e.g., a CRRT machine). BiPAP denotes bi-level positive airway pressure; CI, confidence interval; CPAP, continuous positive airway pressure; CRRT, continuous renal replacement therapy; ECG, electrocardiogram; HFNC, high-flow nasal canula; IABP, intra-aortic balloon pump; IPV, intrapulmonary percussive ventilator; L, large; M, medium; mAP, mean average precision; S, small; and SCD, sequential compression device.
Table 3. Activity Detection Results and Model Validation. *
Every original activity, baseline result, uncertainty value and table note is retained. The abstract’s ADL range of 0.23–0.95 refers to selected room-split values. Time-split AP falls to 0.06 for oral care, 0.08 for bed-pad changing and 0.09 for attached-lift mobility. Strong average specificity can coexist with class-specific problems: vital-sign monitoring has specificity 0.25/0.28 despite AP 1.00/0.99.
The table prints baseline citation numbers 39–42 although the bibliography contains 25 items; the matching main entries are 15–18. Its external-catheter time-split uncertainty reads “0.11±0.1o5”; the source typo is retained. Figure 2 labels average permutation AP as 0.18, whereas this table reports 0.14 for both split categories. These discrepancies are not reconciled by the available main text.
Activity Detection Results and Model Validation.*
| Visual Concept | Associated Object | Frames (No.) |
Time-Based Split | Room-Based Split | ||||
|---|---|---|---|---|---|---|---|---|
| Sens | Spec | AP | Sens | Spec | AP | |||
| Preventive measures | ||||||||
| Miscellaneous | ||||||||
| Wearing heel protectors† | Heel protector | 23,714 | 0.97 | 1.00 | 0.95±0.04 | 0.93 | 1.00 | 0.92±0.02 |
| Wearing slipper socks† | Slipper sock | 109,398 | 0.96 | 0.97 | 0.96±0.02 | 0.96 | 0.97 | 0.95±0.02 |
| Wearing SCDs† | SCD pump, SCD sleeve | 147,231 | 0.98 | 0.98 | 0.98±0.01 | 0.97 | 0.98 | 0.98±0.01 |
| Elevated head-of-bed† | Hospital bed | 261,812 | 0.94 | 0.79 | 0.92±0.01 | 0.96 | 0.80 | 0.93±0.01 |
| ADL | ||||||||
| Feeding | ||||||||
| Eating† | Food, food tray | 8837 | 0.87 | 0.97 | 0.72±0.20 | 0.81 | 0.96 | 0.66±0.04 |
| Drinking | Drink | 1585 | 0.70 | 0.97 | 0.46±0.05 | 0.73 | 0.97 | 0.52±0.06 |
| Receiving enteral feeds† | Enteral feeding pump | 40,254 | 0.95 | 1.00 | 0.92±0.03 | 0.96 | 0.99 | 0.89±0.09 |
| Mobility | ||||||||
| Sitting† | Chair, hospital bed, sofa, stool, wheelchair | 48,086 | 0.97 | 0.99 | 0.95±0.00 | 0.95 | 0.99 | 0.95±0.03 |
| Standing† | — | 3896 | 0.86 | 1.00 | 0.68±0.21 | 0.92 | 0.99 | 0.77±0.07 |
| Ambulating independently | 525 | 0.84 | 1.00 | 0.19±0.13 | 0.86 | 0.99 | 0.47±0.12 | |
| Ambulating with assistive devices | Walker, wheelchair | 124 | 0.34 | 1.00 | 0.22±0.31 | 0.86 | 1.00 | 0.48±0.27 |
| Ambulating with human assistance† | 407 | 0.33 | 1.00 | 0.35±0.17 | 0.51 | 1.00 | 0.51±0.06 | |
| Repositioning† | Pillow, wedge | 5677 | 0.54 | 0.94 | 0.67±0.07 | 0.51 | 0.95 | 0.68±0.03 |
| Lying† | Hospital bed | 291,942 | 0.95 | 0.68 | 0.88±0.02 | 0.96 | 0.69 | 0.89±0.01 |
| Attached to lifts | Patient lift | 1188 | 0.08 | 1.00 | 0.09±0.13 | 0.37 | 1.00 | 0.40±0.40 |
| Personal Hygiene | ||||||||
| Body cleansing† | Wet wipe | 10,085 | 0.74 | 0.96 | 0.45±0.02 | 0.65 | 0.98 | 0.57±0.09 |
| Oral care | Oral swab/toothbrush | 939 | 0.13 | 1.00 | 0.06±0.01 | 0.20 | 1.00 | 0.23±0.16 |
| Oral suctioning | Oral suctioning tool | 2372 | 0.79 | 1.00 | 0.24±0.21 | 0.59 | 0.99 | 0.50±0.22 |
| Changing bed pads | Bed pad | 963 | 0.39 | 0.99 | 0.08±0.05 | 0.48 | 0.99 | 0.27±0.06 |
| Toileting | ||||||||
| Commode usage† | Commode | 2870 | 0.66 | 0.99 | 0.61±0.22 | 0.70 | 1.00 | 0.72±0.06 |
| Urinal usage† | Urinal | 2396 | 0.81 | 1.00 | 0.75±0.02 | 0.78 | 0.99 | 0.72±0.15 |
| External catheter usage | External catheter | 252 | 0.30 | 1.00 | 0.11±0.1o5 | 0.22 | 1.00 | 0.12±0.19 |
| Urinary catheter† | 31,125 | 0.85 | 0.93 | 0.52±0.09 | 0.78 | 0.99 | 0.72±0.15 | |
| IADL | ||||||||
| Electronics usage† | Call light, cell phone, laptop, patient room phone, tablet | 32,556 | 0.72 | 0.97 | 0.69±0.09 | 0.73 | 0.96 | 0.70±0.06 |
| Diagnostic procedures | ||||||||
| Exam | ||||||||
| Ultrasound exam† | Ultrasound machine | 10,043 | 0.94 | 0.99 | 0.90±0.03 | 0.92 | 0.99 | 0.78±0.09 |
| X-ray exam† | X-ray machine | 2992 | 0.97 | 1.00 | 0.71±0.27 | 0.97 | 1.00 | 0.86±0.08 |
| ECG exam† | ECG machine | 4992 | 0.98 | 0.99 | 0.89±0.06 | 0.98 | 0.99 | 0.88±0.05 |
| Monitoring | ||||||||
| Vital signs monitoring† | Vital signs monitor | 346,457 | 0.99 | 0.25 | 1.00±0.00 | 0.99 | 0.28 | 0.99±0.00 |
| Hemodynamic monitoring† | Hemodynamic monitor | 45,562 | 0.99 | 0.99 | 0.91±0.04 | 0.98 | 0.99 | 0.93±0.03 |
| Therapeutic procedures | ||||||||
| Respiratory therapy | ||||||||
| Incentive spirometry† | Incentive spirometer | 3069 | 0.95 | 1.00 | 0.93±0.11 | 0.91 | 1.00 | 0.85±0.07 |
| Ventilation† | Ventilator | 116,090 | 0.97 | 0.99 | 0.96±0.03 | 0.99 | 0.99 | 0.98±0.02 |
| CPAP/BiPAP therapy† | CPAP/BiPAP machine | 28,126 | 0.91 | 0.98 | 0.62±0.32 | 0.98 | 0.98 | 0.88±0.05 |
| HFNC therapy† | HFNC machine | 7069 | 0.43 | 1.00 | 0.41±0.58 | 0.91 | 1.00 | 0.83±0.15 |
| Nitric oxide therapy† | Nitric oxide machine | 14,969 | 0.98 | 1.00 | 0.96±0.02 | 1.00 | 1.00 | 0.98±0.04 |
| IPV therapy† | IPV machine | 17,188 | 0.45 | 1.00 | 0.42±0.59 | 0.98 | 1.00 | 0.80±0.19 |
| Renal therapy | ||||||||
| CRRT† | CRRT machine | 11,472 | 0.99 | 1.00 | 0.94±0.09 | 0.99 | 1.00 | 0.92±0.09 |
| Hemodialysis† | Hemodialysis machine | 4581 | 0.50 | 1.00 | 0.32±0.46 | 0.75 | 1.00 | 0.53±0.52 |
| Miscellaneous | ||||||||
| IV therapy† | Infusion pump | 337,653 | 0.96 | 0.83 | 0.99±0.00 | 0.98 | 0.79 | 1.00±0.00 |
| IABP therapy† | IABP machine | 16,241 | 0.57 | 0.99 | 0.40±0.56 | 0.93 | 1.00 | 0.82±0.08 |
| Social activities | ||||||||
| Family visit† | — | — | 0.89 | 0.92 | 0.81±0.04 | 0.91 | 0.91 | 0.80±0.07 |
| Aggregated results | ||||||||
| Random permutation | — | — | 0.15 | 0.85 | 0.14±0.02 | 0.15 | 0.85 | 0.14±0.01 |
| VideoMAE39 | — | — | 0.18 | 0.92 | 0.27±0.02 | 0.19 | 0.90 | 0.24±0.07 |
| ViViT40 | — | — | 0.25 | 0.91 | 0.34±0.02 | 0.22 | 0.91 | 0.28±0.02 |
| CNN-Bi-LSTM41 | — | — | 0.10 | 0.90 | 0.17±0.01 | 0.11 | 0.89 | 0.16±0.01 |
| 3D-CNN-LSTM42 | — | — | 0.15 | 0.90 | 0.23±0.02 | 0.15 | 0.90 | 0.20±0.03 |
| Our model† | — | — | 0.75 | 0.95 | 0.64±0.13 | 0.81 | 0.95 | 0.73±0.10 |
To assess whether our results were the result of overfitting within the dataset, we completed two independent assessments of model performance. In the time-based split methodology, 25% of the video data, sourced consecutively, are designated as the test set, with the remaining 75% allocated for training purposes. Conversely, in the room-based split approach, footage from two randomly selected rooms out of a total of eight is utilized as the test set, while the footage from the remaining six rooms comprises the training set. The time-based split is performed two times, while the room-based split is performed four times, with each time using different sets of data. The final performance is averaged within each category, as detailed in the Section SA1. Performance metrics such as sensitivity (Sens), specificity (Spec), and average precision (AP) scores are reported for each activity class. Note that Sens measures the proportion of actual positives correctly identified, Spec measures the proportion of actual negatives correctly identified, and AP computes the average of precision values at different recall thresholds for ranking of positive instances. The comparison methods under the aggregated results column are tested with the same procedure. ADL denotes activities of daily living; AP, average precision; BiPAP, bi-level positive airway pressure; CPAP, continuous positive airway pressure; CRRT, continuous renal replacement therapy; ECG, electrocardiogram; HFNC, high-flow nasal canula; IABP, intra-aortic balloon pump; IADL, instrumental activities of daily living; IPV, intrapulmonary percussive ventilator; IV, intravenous; SCD, sequential compression device; Sens, sensitivity; and Spec, specificity.
Indicates the performance is significantly better than chance with a P value of less than 0.05 using the permutation test.
Discussion
The main contribution is fine-grained, simultaneous recognition of care activities and scene entities. Frequent or visually distinctive equipment is easier to recognize than tiny, deformable or transparent objects. Blankets and other occlusions, similar-looking intravenous/arterial lines, ceiling-camera distance and poor nighttime lighting remain limitations.
Some diagnostic, preventive and therapeutic classes perform well, but the broad claim that most clinical activities exceed AP 0.85 should not obscure lower temporal results, including high-flow nasal cannula 0.41, hemodialysis 0.32 and intra-aortic balloon pump 0.40. Clinical adequacy depends on the event and the consequences of misses and false alarms.
Earlier ICU sensing studies address narrower activity targets [22] [23] [24] [25]. This study expands the taxonomy but remains a single-site feasibility evaluation. Larger multisite datasets, better rare-event annotation, prospective workflow testing and patient-outcome evidence are needed before the proposed care and documentation benefits can be assumed.
Supplementary Material
The source links a separate supplementary appendix containing additional taxonomy, split, permutation, scaling and architecture details. Its PDF could not be retrieved, so those supplementary figures, tables and technical details are not included in this edition. The complete main text, both main figures and all three main tables are preserved.
The original appendix PDF link remains available through PMC.
Acknowledgments
Support included Schmidt Futures, Stanford Medicine, K-Bank and Stanford Human-Centered Artificial Intelligence cloud credits. The original acknowledgment credits clinical coordination, infrastructure, annotation review and nursing input.
Footnotes
Author disclosures and other supplementary materials are linked through the publisher.