At a glance
This study compares eight people with unilateral transfemoral amputation and eight controls during treadmill walking at 1, 2 and 3 km/h. It measures local dynamic stability with short-term Lyapunov exponents and regularity with fuzzy entropy across fifteen body locations.
The clearest result is a larger between-group difference in acceleration stability at the slowest speed, with additional asymmetries in angular velocity and speed-dependent regularity. These are exploratory kinematic associations in a small sample using one prosthetic knee model, not validated fall-risk predictions or evidence that a particular rehabilitation strategy works. All six figures, the equation and eight supplementary tables are retained.
1. Introduction
Prosthetic gait involves altered sensory feedback, mechanical constraints and compensatory movement throughout the body. Nonlinear time-series measures may reveal aspects of movement that average speed or joint motion alone misses [22] [35].
The study asks which body-segment signals vary most and how their stability and regularity depend on walking speed. Greater irregularity is not automatically better or worse: the interpretation depends on the signal, task and comparison population.
2.1 Participants
The amputation group used the Genium X3 knee and comprised seven men and one woman, with mean age 54.4±14.5 years. Controls comprised five men and three women, aged 42.0±12.2 years. Reported height and weight also differ between groups.
The age comparison has p=0.067; a nonsignificant test in sixteen people does not demonstrate demographic equivalence. Neurological, orthopedic and cardiovascular conditions were exclusion criteria. Participants consented under University of Freiburg approval 21–1245.
2.2 Data collection
Each participant completed three two-minute trials at each of three speeds, in randomized order, after a two-minute familiarization at 2 km/h. This gives nine repeated trials per participant; the independent participant sample remains sixteen.
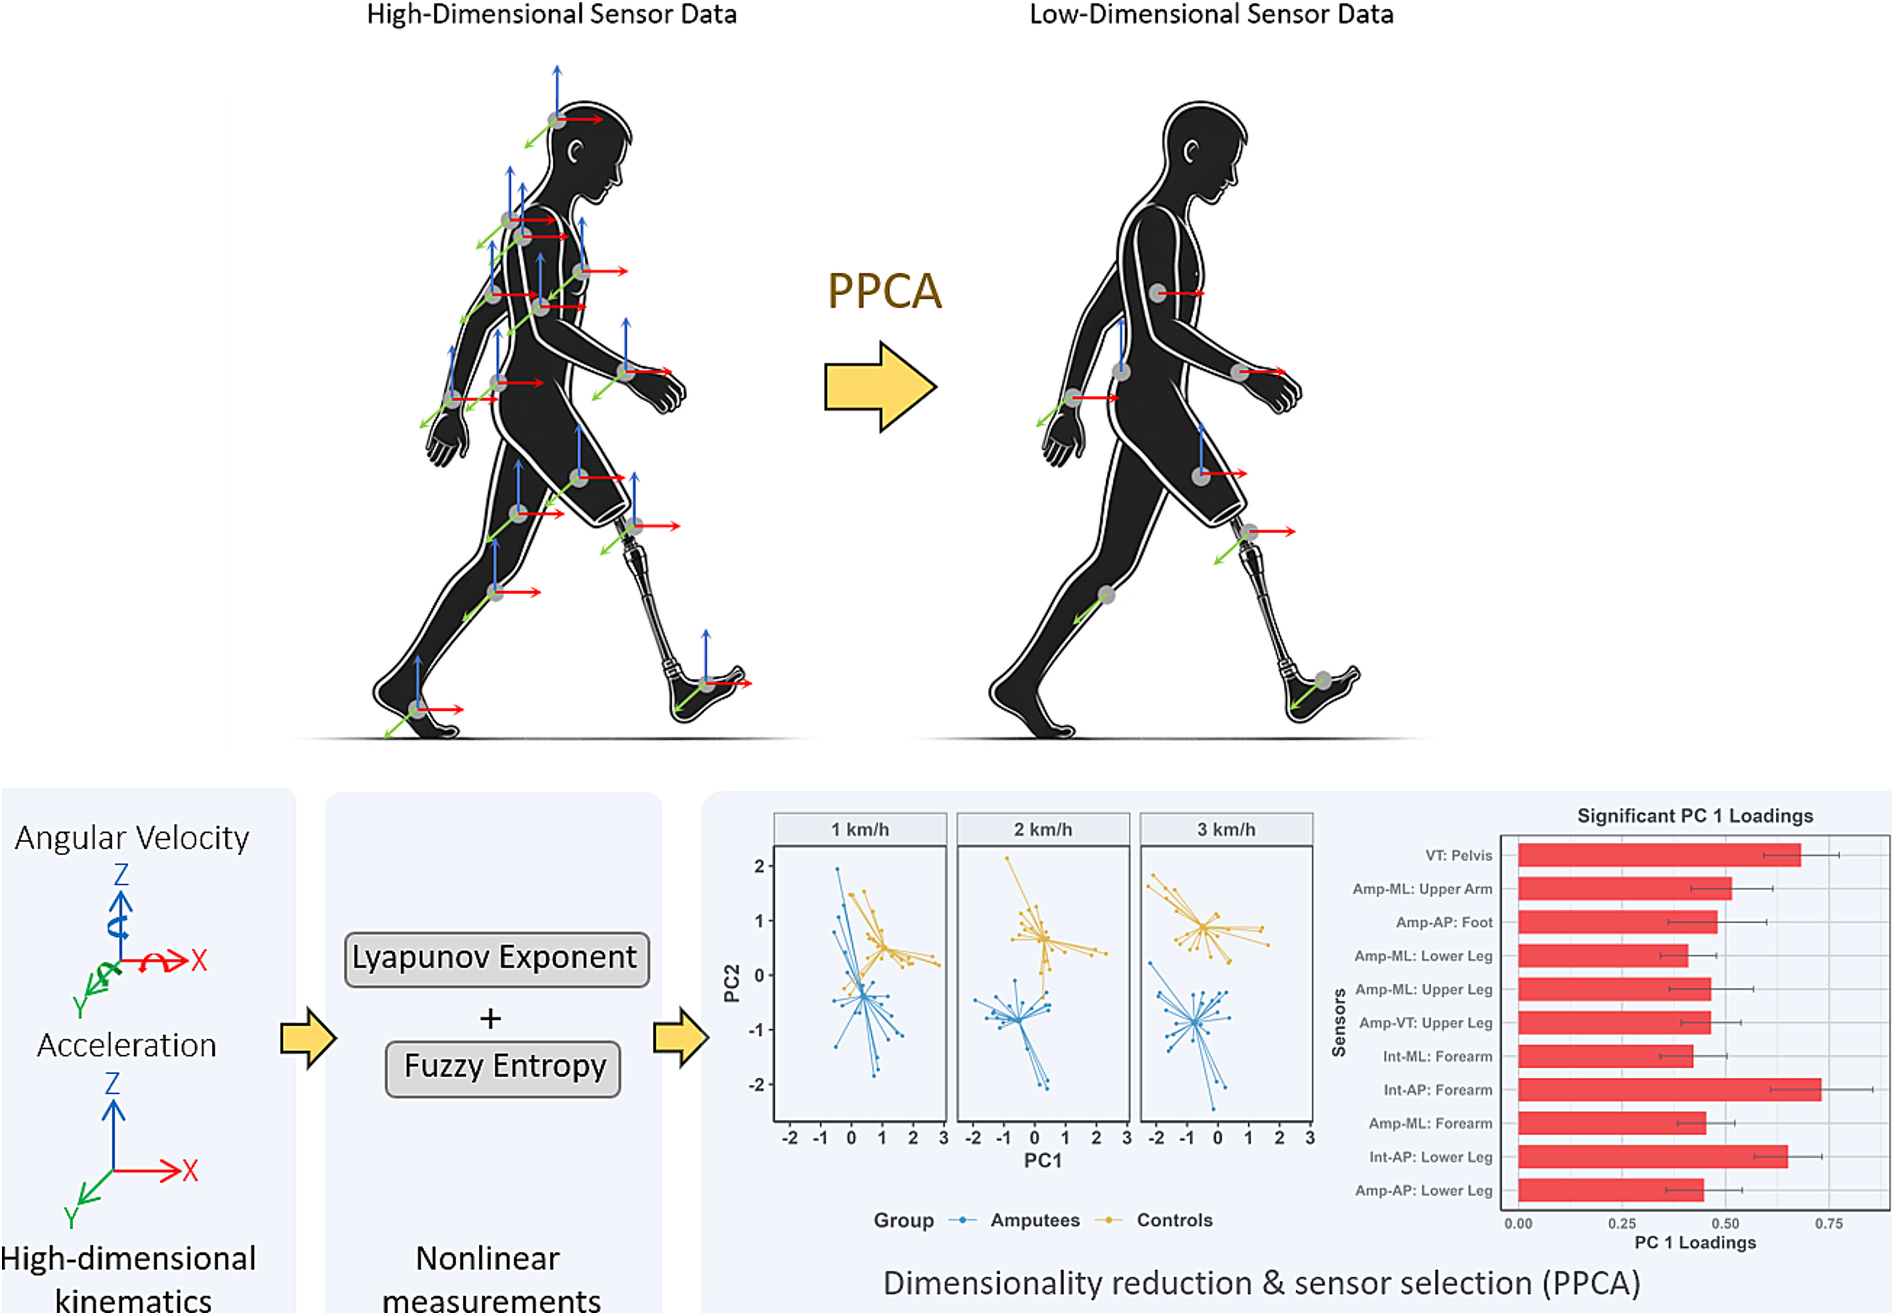
Inertial sensors recorded three-dimensional acceleration and angular velocity at 120 Hz. Hand sensors were excluded as redundant with the forearms, leaving fifteen body locations. The analysis pairs the intact/prosthetic sides with dominant/non-dominant control sides. Figure 1 retains the full workflow and coordinate convention.
2.3 Data analysis
The first 600 samples are discarded, then 10,000 samples—83.33 seconds—are analyzed per signal. Fifteen locations times three directions yield 45 channels for each signal/metric combination.
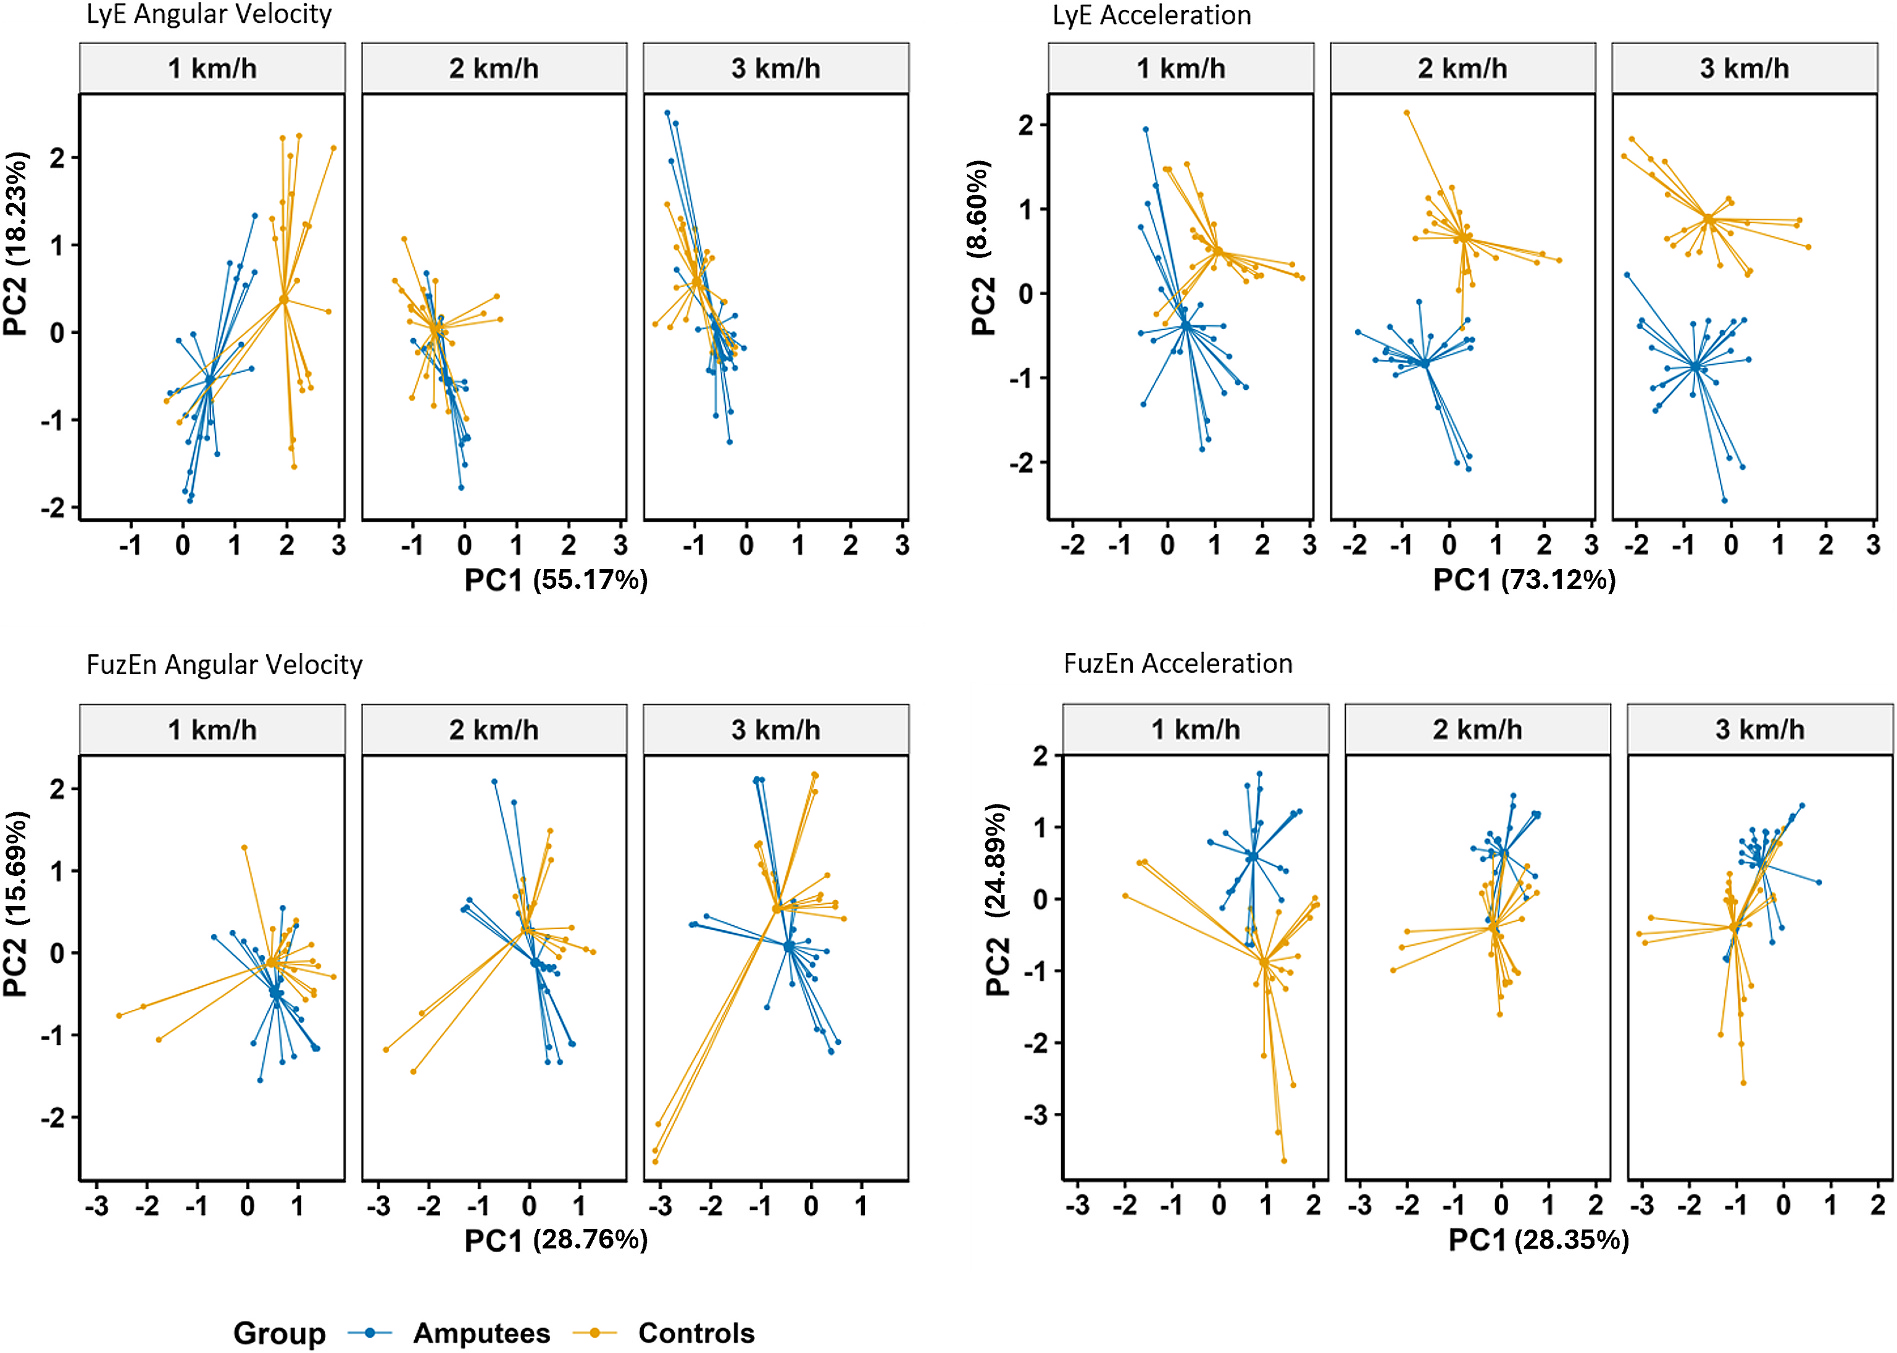
PPCA identifies channels with substantial contributions to variation; selected channels then enter mixed models. The selected counts refer to sensor-direction channels, not necessarily distinct physical sensors. Figure 2 retains all four low-dimensional projections.
2.4 Fuzzy entropy
Fuzzy entropy measures similarity of local signal patterns using the original membership function below. The settings are segment length m=2, tolerance r=0.25 times the signal standard deviation, and exponent n=4.5. The exponent was chosen by sweeping 0.5–9 on a random 10% subsample until entropy variability stabilized [9] [10].
Lower entropy denotes greater regularity under these settings. This is a single-scale estimate; the physiological meaning and numerical values depend on parameter choices and preprocessing [52].
Equation

2.5 Lyapunov exponent
The short-term Lyapunov exponent estimates divergence of nearby reconstructed trajectories. The paper fits the divergence curve over zero to one stride, interpreting larger values as less local dynamic stability [15].
Stride durations come from peaks in foot acceleration and angular velocity, using a minimum 50-sample spacing and a height threshold based on the 75th percentile plus median absolute deviation. Peak detection was visually checked. The methods do not fully specify state-space reconstruction details such as embedding dimension and delay, which limits exact reproduction of the estimates.
2.6 Probabilistic principal component analysis
Signals are median-centered and scaled by their interquartile range. PPCA fits a probabilistic low-dimensional representation using expectation–maximization; channels are selected at a visually identified drop in their contributions [34] [48].
High variance contribution does not itself establish diagnostic importance or the best separation between groups. Selection and subsequent testing use the same dataset, without an independent validation cohort; the resulting channel findings should be read as exploratory.
2.7 Surrogate analysis
Amplitude-adjusted Fourier surrogates were generated with twenty random seeds and compared with the original fuzzy-entropy values [44]. The authors report a difference supporting non-random structure under this surrogate construction.
The article does not give the corresponding numerical test results here. Such a comparison does not identify whether the observed structure comes from neural control, prosthetic mechanics or their interaction.
2.8 Statistical analysis
Selected channels are modeled with group and walking speed as fixed effects and participant identity as a random effect. Normal, log-normal or gamma distributions are chosen through residual inspection. False-discovery-rate adjustment is applied separately within four signal/metric families; post-hoc comparisons use Tukey adjustment.
Tables S1–S4 preserve the omnibus Wald tests and Tables S5–S8 the complete pairwise contrasts. Adjustment addresses the specified test families, but does not independently validate the preceding data-driven channel selection or remove small-sample uncertainty.
3.1 Acceleration stability
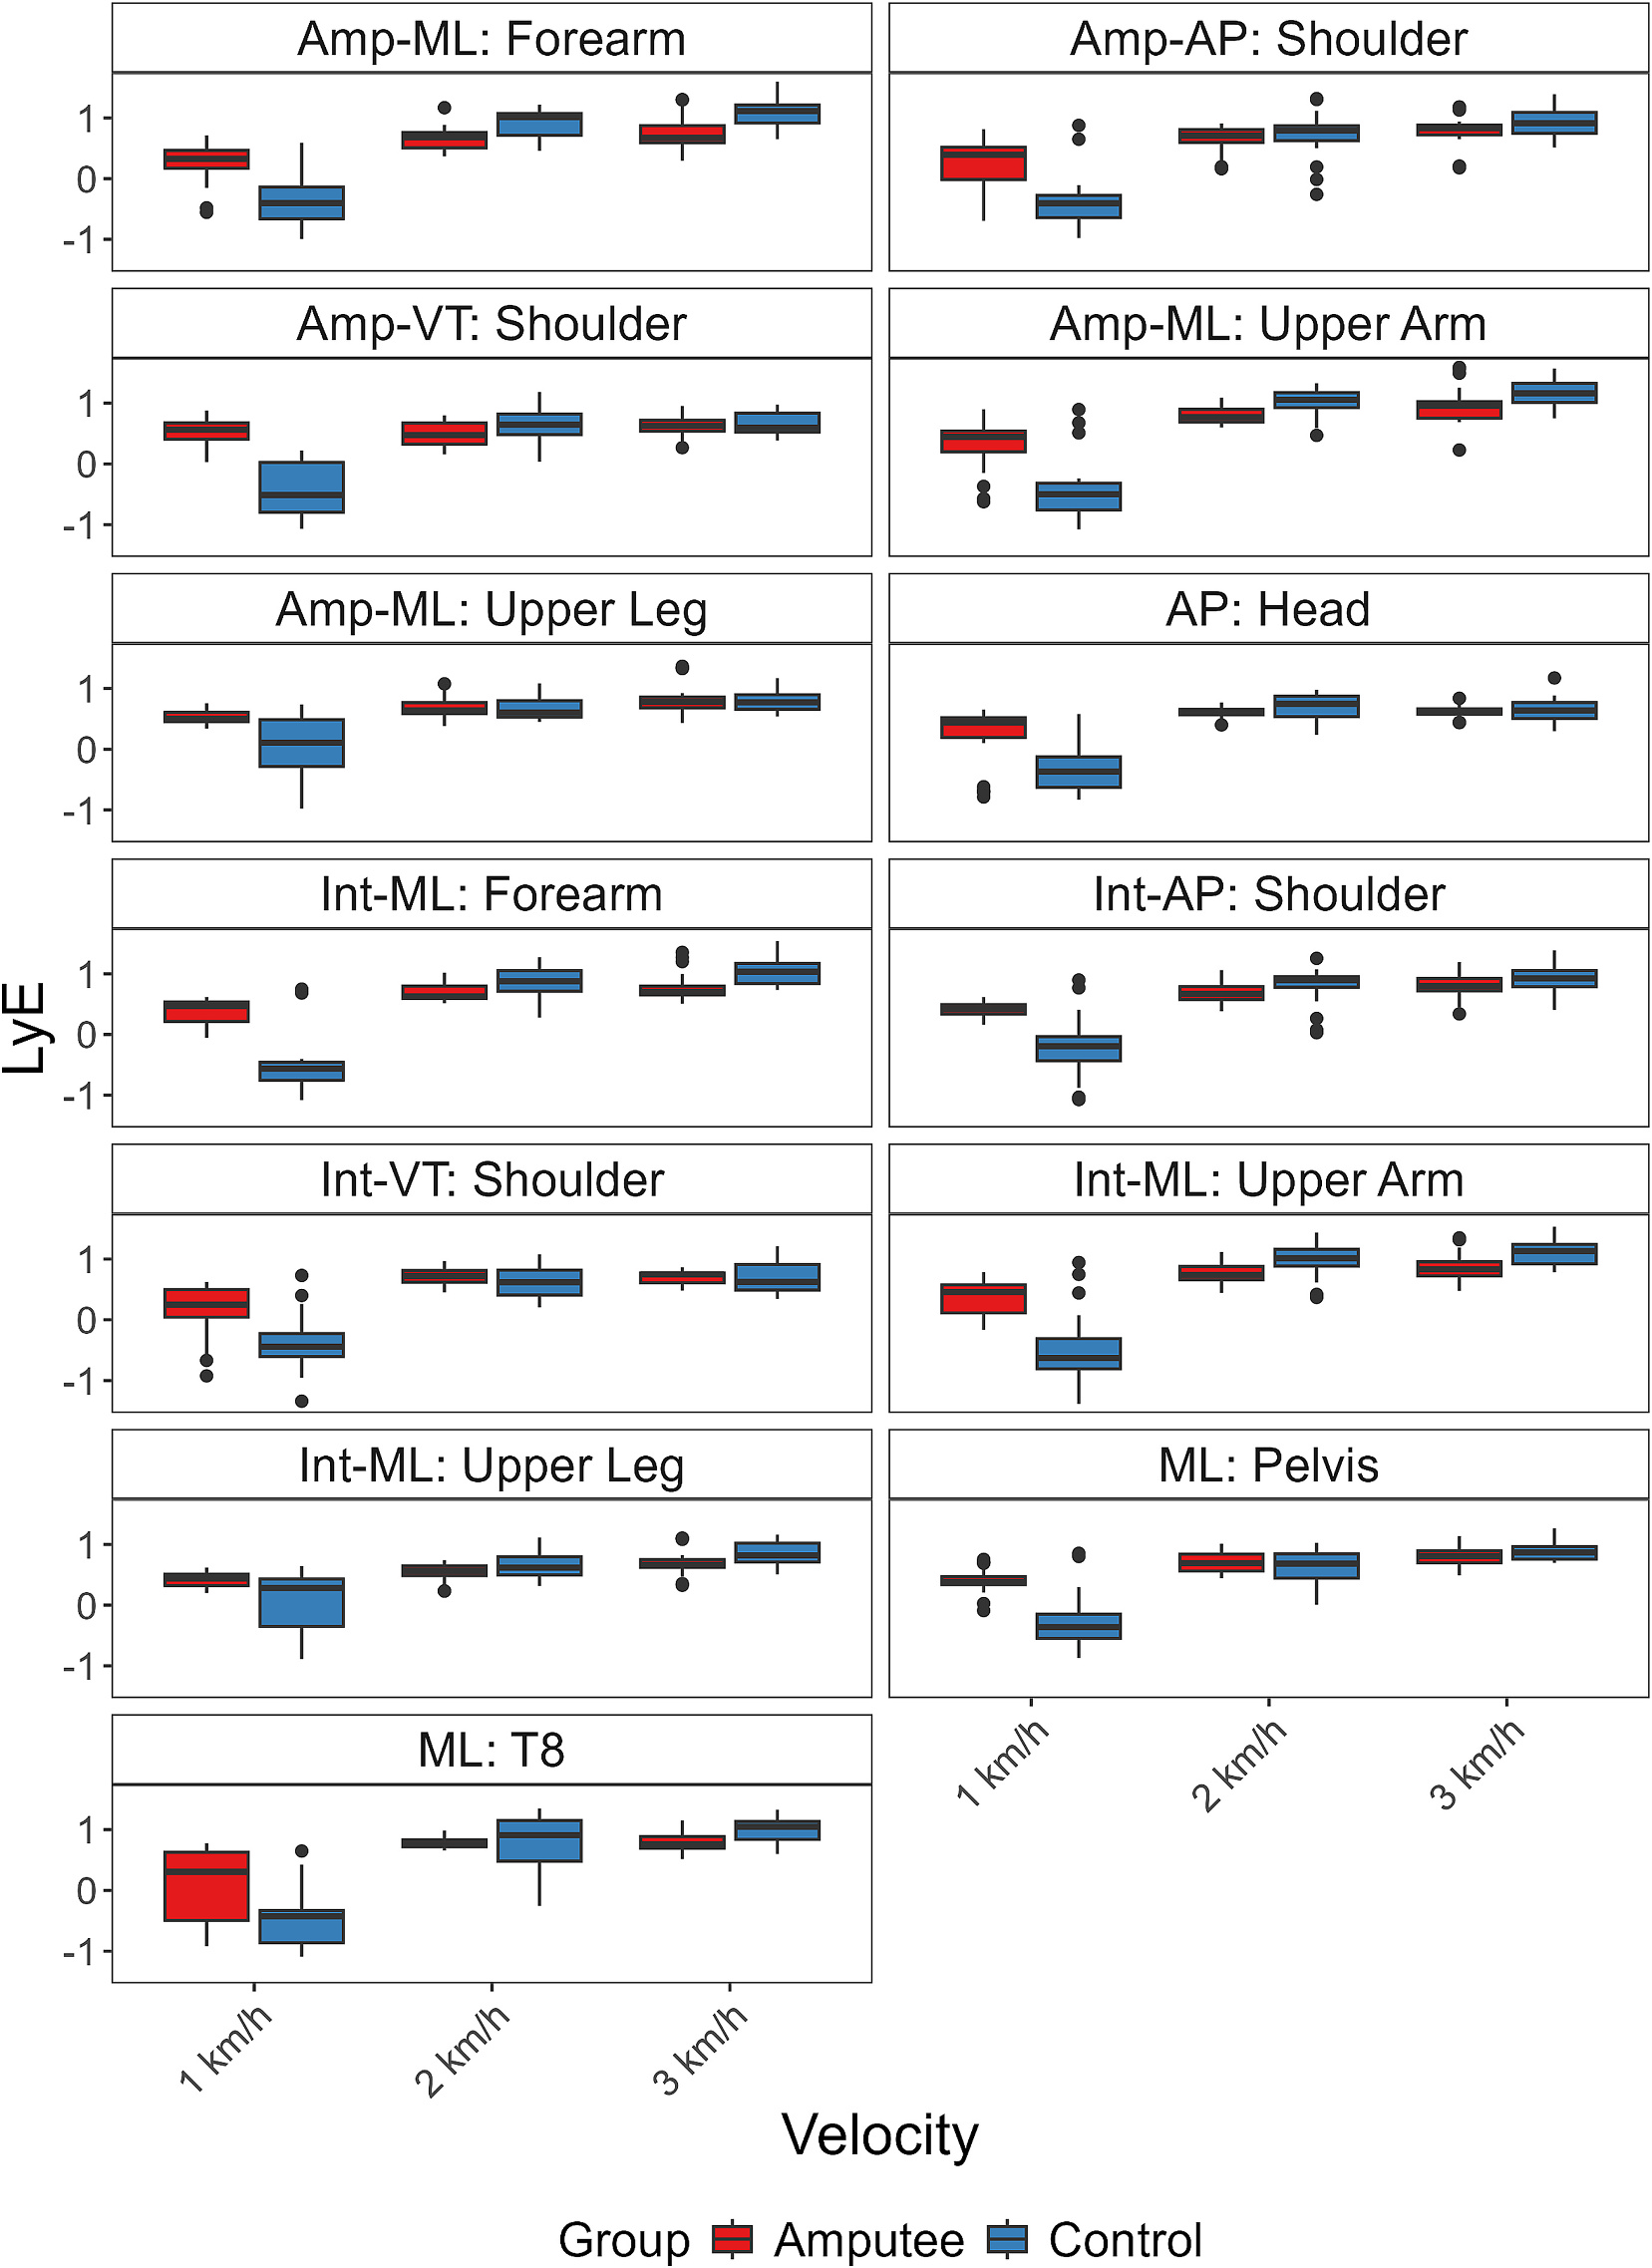
Thirteen selected channels show a group-by-speed interaction. At 1 km/h, Table S5 reports greater Lyapunov values for prosthesis users than controls in every selected channel. Same-speed differences mostly disappear at 2 and 3 km/h, although the two forearm channels still differ at 3 km/h.
The prose also calls the slowest condition more unstable than faster walking within the amputation group. Figure 3 and the negative 1-minus-2/3 contrasts in Table S5 generally show the opposite numerical direction: values rise with speed. The robust reading is the larger between-group gap at low speed, not a universal within-group decrease in instability as speed rises.
3.2 Angular velocity stability
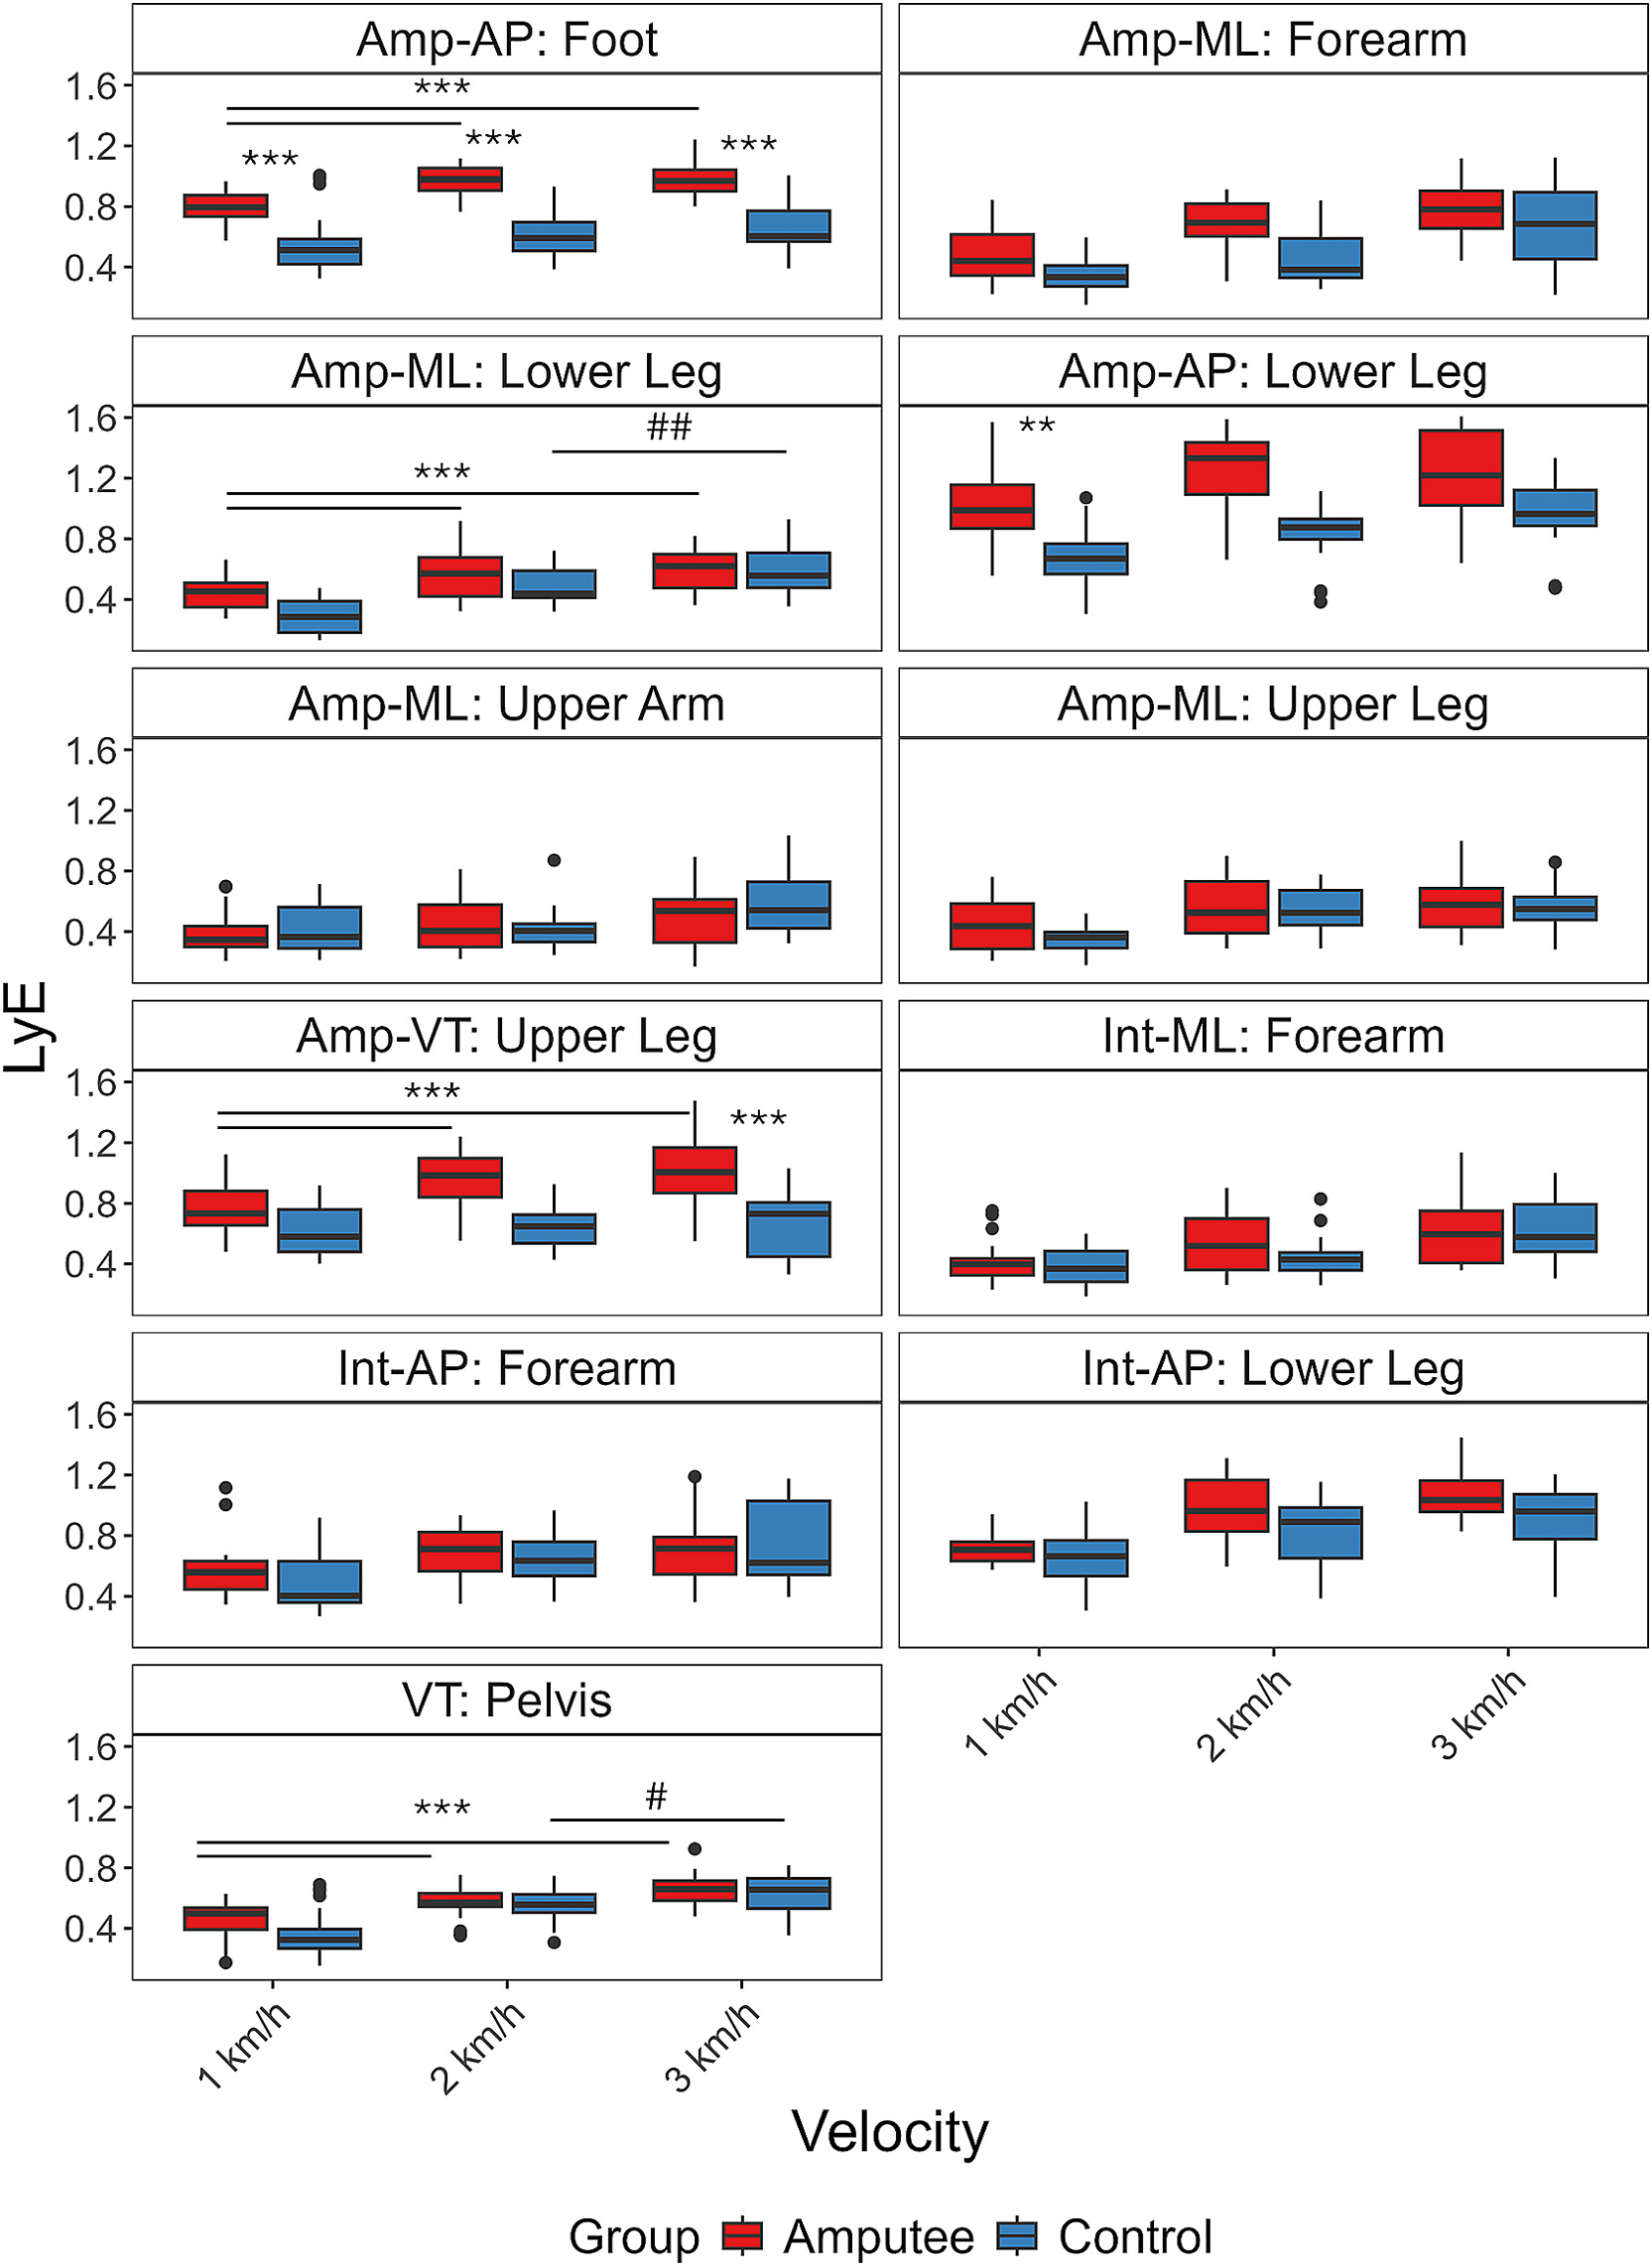
Eleven channels are selected, with prominent differences on the prosthetic side. Table S6 supports higher values for the prosthetic foot in the anterior–posterior direction at all three speeds and for the upper leg in the vertical direction at 2 and 3 km/h. Other channels have more limited or nonsignificant contrasts.
Figure 4’s caption omits some of these same-speed contrasts, and Discussion 4.2 says interactions are absent. Table S2 instead reports adjusted interaction p-values below 0.05 for the prosthetic-side upper leg VT, lower leg ML and foot AP. The complete plots and tables are preserved without resolving these reporting discrepancies.
3.3 Acceleration regularity
Six channels contribute most to acceleration-entropy variation. Controls generally show increasing entropy with speed; prosthesis users show flatter responses in some intact-side leg channels. Table S7 identifies same-speed differences at 1 km/h for the intact lower leg AP and upper leg VT, and at 2 km/h for the intact shoulder ML.
Reduced adaptation is the authors’ interpretation of these patterns. It is not a direct measurement of adaptive capacity, and the original claims of constant entropy should be qualified: for example, the intact upper-leg 1-versus-3 km/h contrast is significant in the amputation group.
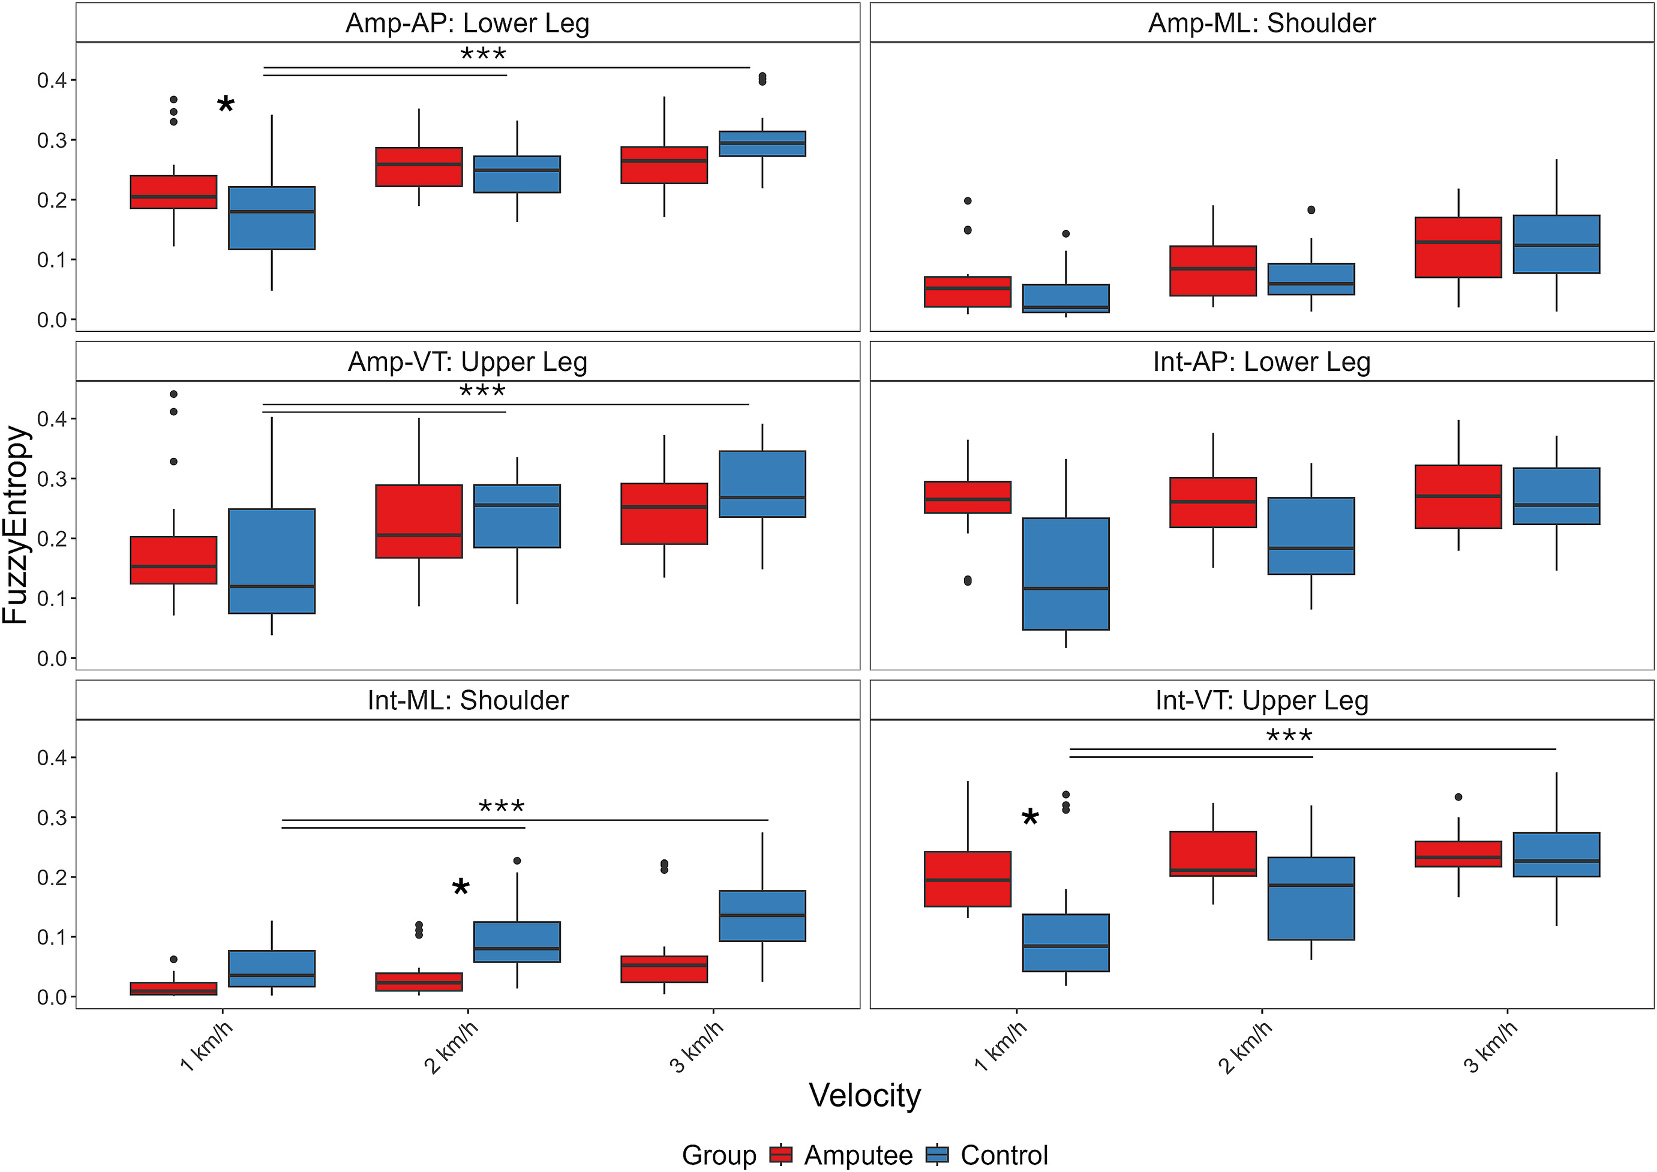
3.4 Angular velocity regularity
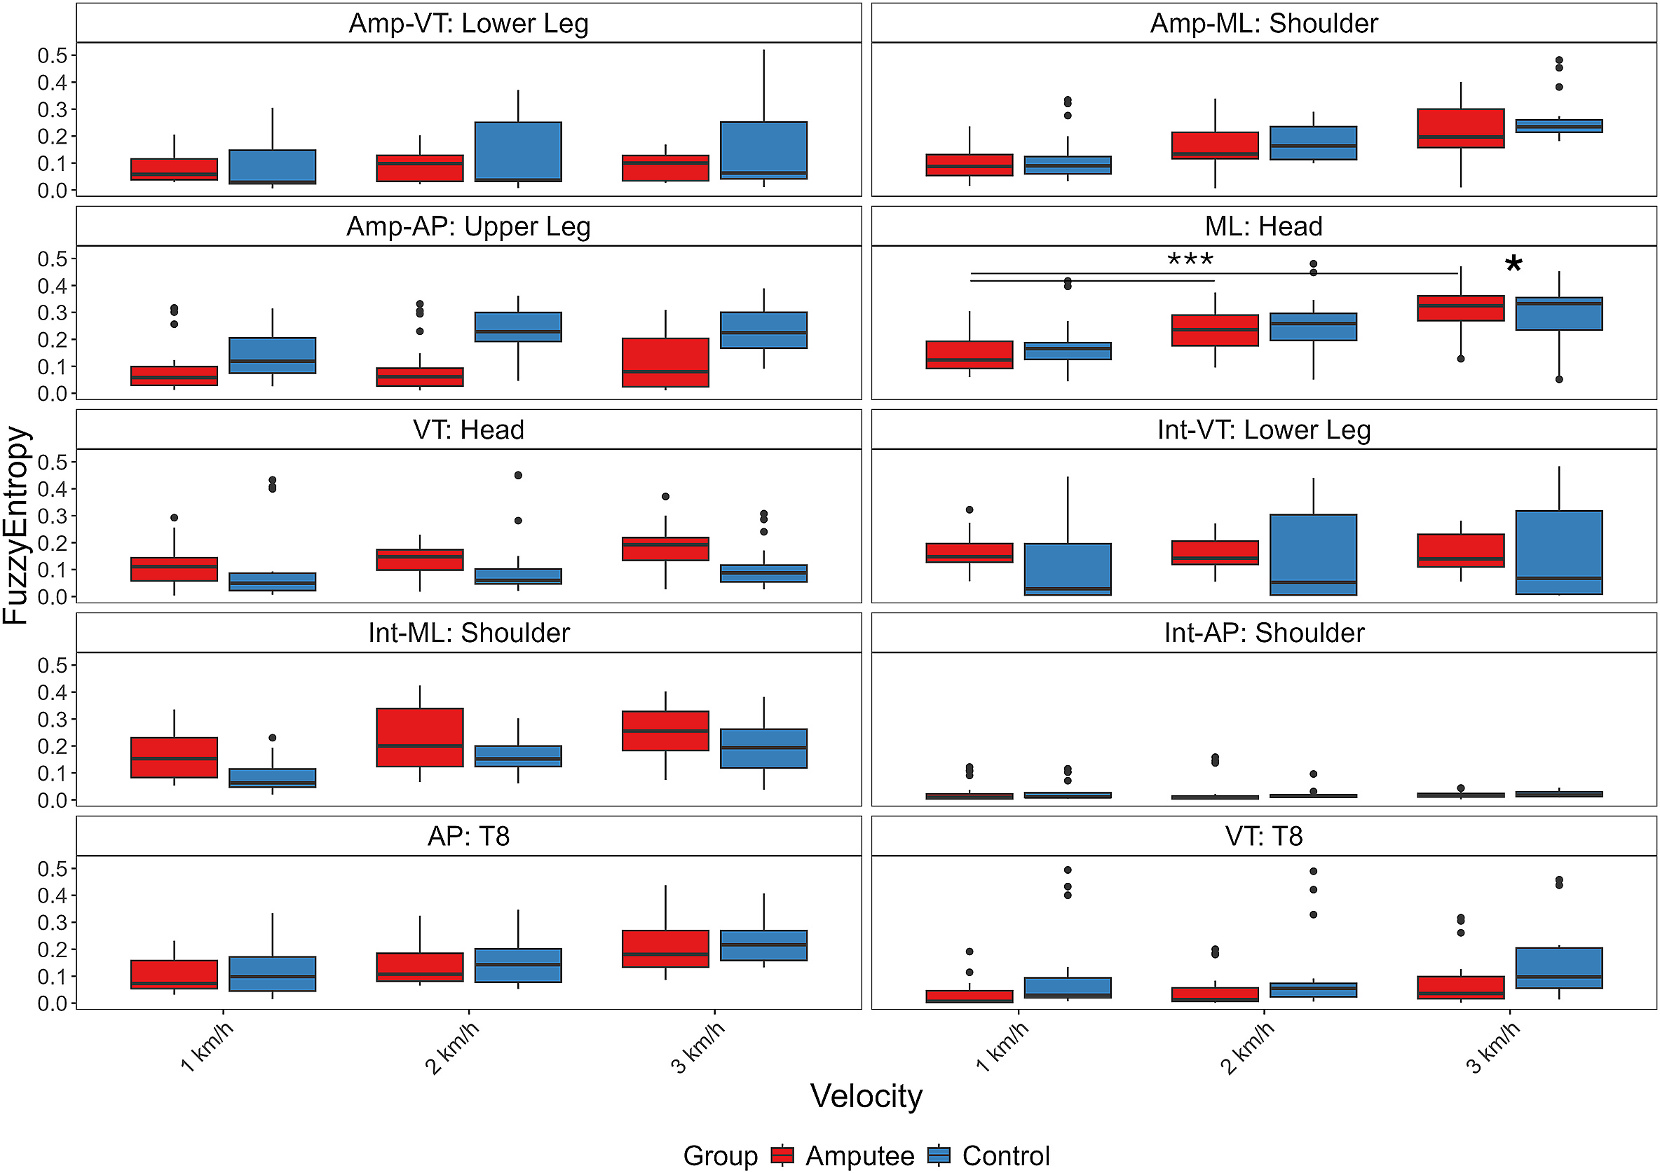
Angular-velocity entropy varies with speed and channel, with ten selected channels and several interactions. The main results text reports no significant same-speed group contrasts.
Figure 6’s caption nevertheless claims a head-ML difference at 3 km/h. Table S8 gives p=0.993 for that contrast, supporting the main-text statement rather than the caption. Its p=0.032 head-ML result compares 1 km/h prosthesis users with 3 km/h controls, a different comparison. The conflicting original caption remains intact.
4. Discussion
The study extends gait analysis beyond the legs to upper-body and trunk signals. Its observations are compatible with distributed compensation and altered speed dependence, but the design does not isolate the mechanisms behind them.
The proposed optimal range of movement complexity is a conceptual interpretation from prior work, not a threshold estimated or validated by this experiment [46].
4.1 Slow walking and adaptability
The authors suggest that very slow walking increases balance and attention demands and makes prosthetic-knee triggering harder. Participants reportedly described this difficulty, but cognitive load and muscle or brain activity were not measured directly.
Mechanical limitations, sensory loss and neural coordination cannot be separated here. Proposed dual-task, EEG and EMG studies would test these explanations. The discussion’s speed-energy analogy also cites running studies; this experiment did not measure metabolic cost.
4.2 Angular velocity and asymmetry
Higher angular-velocity Lyapunov values in selected prosthetic-side channels suggest asymmetric control. Similar trends at faster speeds do not imply equivalence across groups or absence of interaction, particularly given the significant Table S2 interactions.
These findings concern the tested channels, speeds and knee design. They do not establish that faster walking is safer or more suitable for an individual user.
4.3 Acceleration regularity and adaptation
Flatter entropy responses in some intact-side signals may reflect compensation for the prosthetic limb. Other channels change substantially, so the conclusion should remain channel-specific.
The paper discusses mechanical and sensory explanations but does not manipulate either factor. Entropy and local stability are complementary descriptors; neither alone is a direct test of flexibility, comfort or fall prevention.
4.4 Limitations
Only eight prosthesis users and eight controls were studied, with age, sex and body-size differences and one knee model. Treadmill walking at fixed speeds may differ from daily mobility. Repeated trials improve measurement but do not increase the number of independent participants.
The authors acknowledge non-standardized Lyapunov estimation and the lack of multiscale entropy or cognitive-load measurements. Additional limitations include data-dependent channel selection, incomplete reconstruction details, and unresolved conflicts among prose, captions and supplementary results. There is no prospective fall outcome, intervention test or external validation.
5. Conclusion
Whole-body nonlinear measures reveal differences in prosthetic gait that vary by signal, channel and speed. The strongest evidence is for a slow-speed between-group acceleration-stability gap and selected asymmetries and entropy-response differences.
The authors advocate designing rehabilitation and prostheses around users’ remaining capabilities. That is a design implication to investigate, rather than a demonstrated benefit of a tested treatment or device change.
Author contributions
Krauskopf led drafting, visualization and major analysis/methodology work; Pelke contributed analysis and curation. Pasluosta led supervision, validation, project management and funding, with the remaining authors contributing data, resources, conceptualization and review as specified in the original article.
Competing interests
The authors declare no known competing financial interests or personal relationships that could have influenced the work.
Acknowledgments
The study thanks participants and Nina Stobbe for ethics preparation. Support includes DFG grant 505063807, BrainLinks–BrainTools grant EXC 1086, and Baden-Württemberg’s sustainability funding for excellence-initiative projects.
Appendix A. Supplementary data
All eight tables from the publisher’s supplementary document follow, including complete contrasts, merged headings and bold emphasis. The supplement has an earlier title and omits Otyakmazoglu from its author line; the edition’s bibliographic metadata follows the published article.
Table values and labels are retained exactly, including rounded p-values printed as 0.000 and typographical errors. These printed zeros should not be interpreted as mathematically zero probabilities. The University of Freiburg record provides the complete published article.
Supplementary Table S1
Omnibus acceleration-stability tests for all thirteen selected channels. Every group-by-speed interaction is significant after the reported adjustment; main group effects need interpretation in the presence of those interactions.
| Amputated Side Side Upper Arm - ML | Intact Side Upper Arm - ML | |||||
| Term | Χ² | p-value | p-value adjusted | Χ² | p-value | p-value adjusted |
| Group | 2.206 | 0.137 | 0.141 | 5.273 | 0.022 | 0.026 |
| Velocity | 379.289 | < 0.001 | < 0.001 | 330.675 | < 0.001 | < 0.001 |
| Group x Velocity | 80.172 | < 0.001 | < 0.001 | 96.967 | < 0.001 | < 0.001 |
| Amputated Side Fore Arm - ML | Intact Side Fore Arm - ML | |||||
| Term | Χ² | p-value | p-value adjusted | Χ² | p-value | p-value adjusted |
| Group | 5.679 | 0.017 | 0.022 | 10.757 | 0.001 | 0.001 |
| Velocity | 118.845 | < 0.001 | < 0.001 | 311.195 | < 0.001 | < 0.001 |
| Group x Velocity | 53.330 | < 0.001 | < 0.001 | 104.938 | < 0.001 | < 0.001 |
| Amputated Side Shoulder - AP | Intact Side Shoulder - AP | |||||
| Term | Χ² | p-value | p-value adjusted | Χ² | p-value | p-value adjusted |
| Group | 3.443 | 0.064 | 0.069 | 5.468 | 0.019 | 0.024 |
| Velocity | 255.933 | < 0.001 | < 0.001 | 234.371 | < 0.001 | < 0.001 |
| Group x Velocity | 47.197 | < 0.001 | < 0.001 | 59.452 | < 0.001 | < 0.001 |
| Amputated Side Shoulder - VT | Intact Side Shoulder - VT | |||||
| Term | Χ² | p-value | p-value adjusted | Χ² | p-value | p-value adjusted |
| Group | 14.819 | < 0.001 | < 0.001 | 7.820 | 0.005 | 0.007 |
| Velocity | 157.620 | < 0.001 | < 0.001 | 294.927 | < 0.001 | < 0.001 |
| Group x Velocity | 143.025 | < 0.001 | < 0.001 | 35.397 | < 0.001 | < 0.001 |
| Amputated Side Upper Leg - ML | Intact Side Upper Leg - ML | |||||
| Term | Χ² | p-value | p-value adjusted | Χ² | p-value | p-value adjusted |
| Group | 4.497 | 0.034 | 0.038 | 0.140 | 0.708 | 0.708 |
| Velocity | 141.910 | < 0.001 | < 0.001 | 163.428 | < 0.001 | < 0.001 |
| Group x Velocity | 35.364 | < 0.001 | < 0.001 | 45.323 | < 0.001 | < 0.001 |
| Head - AP | T8 - ML | |||||
| Term | Χ² | p-value | p-value adjusted | Χ² | p-value | p-value adjusted |
| Group | 4.733 | 0.030 | 0.034 | 2.509 | 0.113 | 0.119 |
| Velocity | 232.005 | < 0.001 | < 0.001 | 295.388 | < 0.001 | < 0.001 |
| Group x Velocity | 41.196 | < 0.001 | < 0.001 | 36.854 | < 0.001 | < 0.001 |
| Pelvis - ML | ||||||
| Term | Χ² | p-value | p-value adjusted | |||
| Group | 10.861 | 0.001 | 0.001 | |||
| Velocity | 316.795 | < 0.001 | < 0.001 | |||
| Group x Velocity | 80.168 | < 0.001 | < 0.001 | |||
Supplementary Table S2
Omnibus angular-velocity stability tests for eleven channels. Three adjusted interactions are below 0.05, contrary to the discussion’s broad absence-of-interaction statement. All printed precision and headings are preserved.
| Amputated Side Lower Leg - AP | Intact Side Lower Leg - AP | |||||
| Term | Χ² | P-value | p-value adjusted | Χ² | P-value | p-value adjusted |
| Group | 10.088 | 0.001 | 0.003 | 2.830 | 0.092 | 0.113 |
| Velocity | 113.012 | < 0.001 | < 0.001 | 280.839 | < 0.001 | < 0.001 |
| Group x Velocity | 6.425 | 0.040 | 0.069 | 5.845 | 0.053 | 0.077 |
| Amputated Side Fore Arm - ML | Intact Side Fore Arm - ML | |||||
| Term | Χ² | P-value | p-value adjusted | Χ² | P-value | p-value adjusted |
| Group | 5.208 | 0.022 | 0.043 | 0.580 | 0.446 | 0.490 |
| Velocity | 137.856 | < 0.001 | < 0.001 | 81.157 | < 0.001 | < 0.001 |
| Group x Velocity | 6.193 | 0.045 | 0.073 | 3.850 | 0.145 | 0.171 |
| Amputated Side Upper Leg - VT | Amputated Side Upper Leg - ML | |||||
| Term | Χ² | P-value | p-value adjusted | Χ² | P-value | p-value adjusted |
| Group | 17.642809 | < 0.001 | < 0.001 | 0.32293559 | 0.56984878 | 0.60661322 |
| Velocity | 43.3267135 | < 0.001 | < 0.001 | 86.9917283 | < 0.001 | < 0.001 |
| Group x Velocity | 12.057029 | 0.00240907 | 0.00496871 | 5.51339687 | 0.06350108 | 0.08731398 |
| Amputated Side Lower Leg - ML | Amputated Side Foot - AP | |||||
| Term | Χ² | P-value | p-value adjusted | Χ² | P-value | p-value adjusted |
| Group | 3.341 | 0.067 | 0.089 | 32.979 | < 0.001 | < 0.001 |
| Velocity | 200.810 | < 0.001 | < 0.001 | 66.787 | < 0.001 | < 0.001 |
| Group x Velocity | 33.449 | < 0.001 | < 0.001 | 7.280 | 0.026 | 0.048 |
| Amputated Side Upper Arm - ML | Intact Side Fore Arm - AP | |||||
| Term | Χ² | P-value | p-value adjusted | Χ² | P-value | p-value adjusted |
| Group | 0.197 | 0.656 | 0.676 | 0.133 | 0.715 | 0.715 |
| Velocity | 38.745 | < 0.001 | < 0.001 | 57.568 | < 0.001 | < 0.001 |
| Group x Velocity | 5.868 | 0.053 | 0.077 | 6.138 | 0.046 | 0.073 |
| Pelvis – VT | ||||||
| Term | Χ² | P-value | p-value adjusted | |||
| Group | 1.111 | 0.291 | 0.331 | |||
| Velocity | 171.887 | < 0.001 | < 0.001 | |||
| Group x Velocity | 4.908 | 0.086 | 0.109 | |||
Supplementary Table S3
Omnibus acceleration-entropy tests for six channels. The intact shoulder has a significant group main effect but no significant adjusted interaction (p=0.179), although its contrasts appear in the post-hoc table.
| Amputated Side Lower Leg - AP | Intact Side Lower Leg - AP | ||||||||
| Term | Χ² | P-value | p-value adjusted | Χ² | P-value | p-value adjusted | |||
| Group | 0.034 | 0.855 | 0.905 | 3.430 | 0.064 | 0.089 | |||
| Velocity | 198.382 | < 0.001 | < 0.001 | 157.399 | < 0.001 | < 0.001 | |||
| Group x Velocity | 38.018 | < 0.001 | < 0.001 | 95.170 | < 0.001 | < 0.001 | |||
| Amputated Side Shouleder - ML | Intact Side Shoulder - ML | ||||||||
| Term | Χ² | P-value | p-value adjusted | Χ² | P-value | p-value adjusted | |||
| Group | 0.367 | 0.544 | 0.612 | 7.149 | 0.007 | 0.012 | |||
| Velocity | 238.282 | < 0.001 | < 0.001 | 251.121 | < 0.001 | < 0.001 | |||
| Group x Velocity | 15.893 | < 0.001 | 0.001 | 3.809 | 0.149 | 0.179 | |||
| Amputated Side Upper Leg - VT | Intact Side Upper Leg - VT | ||||||||
| Term | Χ² | P-value | p-value adjusted | Χ² | P-value | p-value adjusted | |||
| Group | 0.007 | 0.931 | 0.931 | 2.925 | 0.087 | 0.112 | |||
| Velocity | 122.750 | < 0.001 | < 0.001 | 180.085 | < 0.001 | < 0.001 | |||
| Group x Velocity | 7.215 | 0.027 | 0.041 | 64.647 | < 0.001 | < 0.001 | |||
Supplementary Table S4
Omnibus angular-velocity entropy tests for ten channels. Original heading placement is retained, including the head-VT label within the lower block. Statistical significance is not a measure of effect magnitude or clinical importance.
| Amputated Side Lower Leg - VT | Intact Side Lower Leg - VT | ||||||
| Term | Χ² | P-value | p-value adjusted | Χ² | P-value | p-value adjusted | |
| Group | 0.247 | 0.619 | 0.715 | 4.031 | 0.045 | 0.079 | |
| Velocity | 32.242 | < 0.001 | < 0.001 | 16.228 | < 0.001 | 0.001 | |
| Group x Velocity | 24.997 | < 0.001 | < 0.001 | 24.146 | < 0.001 | < 0.001 | |
| T8 - VT | Amputated Side Upper Leg - AP | ||||||
| Term | Χ² | P-value | p-value adjusted | Χ² | P-value | p-value adjusted | |
| Group | 2.278 | 0.131 | 0.219 | 4.737 | 0.030 | 0.055 | |
| Velocity | 56.415 | < 0.001 | < 0.001 | 28.016 | < 0.001 | < 0.001 | |
| Group x Velocity | 0.383 | 0.826 | 0.854 | 30.819 | < 0.001 | < 0.001 | |
| Amputated Side Shoulder - ML | Intact Side Shoulder - ML | ||||||
| Term | Χ² | P-value | p-value adjusted | Χ² | P-value | p-value adjusted | |
| Group | 0.802 | 0.371 | 0.483 | 1.462 | 0.227 | 0.358 | |
| Velocity | 100.304 | < 0.001 | < 0.001 | 77.135 | < 0.001 | < 0.001 | |
| Group x Velocity | 2.605 | 0.272 | 0.376 | 8.535 | 0.014 | 0.028 | |
| Head - ML | Intact Side Shoulder - AP | ||||||
| Term | Χ² | P-value | p-value adjusted | Χ² | P-value | p-value adjusted | |
| Group | 0.000 | 1.000 | 1.000 | 0.725 | 0.395 | 0.493 | |
| Velocity | 123.303 | < 0.001 | < 0.001 | 34.062 | < 0.001 | < 0.001 | |
| Group x Velocity | 14.084 | 0.001 | 0.002 | 2.577 | 0.276 | 0.376 | |
| T8 - AP | |||||||
| Term | Χ² | P-value | p-value adjusted | Head - VT | |||
| Group | 0.119 | 0.730 | 0.782 | 1.260 | 0.262 | 0.376 | |
| Velocity | 148.621 | < 0.001 | < 0.001 | 45.103 | < 0.001 | < 0.001 | |
| Group x Velocity | 1.012 | 0.603 | 0.715 | 0.632 | 0.729 | 0.782 | |
Supplementary Table S5
All acceleration-stability contrasts are retained in both sensor groups of the original table. Comparisons across two different speeds and groups must be distinguished from same-speed group contrasts; bold emphasis selects only some comparisons.
| Intact Side Shoulder VT | Amputated Side Shoulder VT | Pelvis ML | Amputated Side Upper Leg ML | Head AP | Intact Side Shoulder AP | Amputated Side Upper Arm ML | ||||||||||||||||||||||
| Contrast | t.ratio | p.value | t.ratio | p.value | t.ratio | p-value | t.ratio | p.value | t.ratio | p.value | t.ratio | p.value | t.ratio | p.value | ||||||||||||||
| 1 km/h Amp - 2 km/h Amp | -6.901 | < 0.001 | 0.822 | 0.963 | -4.396 | < 0.001 | -2.368 | 0.175 | -5.214 | < 0.001 | -3.707 | 0.004 | -5.276 | < 0.001 | ||||||||||||||
| 1 km/h Amp - 3 km/h Amp | -6.678 | < 0.001 | -1.238 | 0.817 | -5.885 | < 0.001 | -4.357 | < 0.001 | -5.388 | < 0.001 | -5.200 | < 0.001 | -7.119 | < 0.001 | ||||||||||||||
| 1 km/h Amp - 1 km/h Ctrl | 5.919 | < 0.001 | 10.930 | < 0.001 | 7.986 | < 0.001 | 4.979 | < 0.001 | 5.985 | < 0.001 | 7.204 | < 0.001 | 7.388 | < 0.001 | ||||||||||||||
| 1 km/h Amp - 2 km/h Ctrl | -4.712 | < 0.001 | -1.291 | 0.790 | -2.488 | 0.135 | -1.369 | 0.746 | -5.490 | < 0.001 | -4.514 | < 0.001 | -6.716 | < 0.001 | ||||||||||||||
| 1 km/h Amp - 3 km/h Ctrl | -5.346 | < 0.001 | -1.466 | 0.686 | -5.285 | < 0.001 | -2.625 | 0.098 | -4.755 | < 0.001 | -5.732 | < 0.001 | -8.226 | < 0.001 | ||||||||||||||
| 2 km/h Amp - 3 km/h Amp | 0.291 | 1.000 | -2.069 | 0.310 | -1.447 | 0.698 | -1.966 | 0.367 | -0.123 | 1.000 | -1.456 | 0.693 | -1.790 | 0.476 | ||||||||||||||
| 2 km/h Amp - 1 km/h Ctrl | 11.359 | < 0.001 | 10.237 | < 0.001 | 11.299 | < 0.001 | 6.547 | < 0.001 | 10.440 | < 0.001 | 10.525 | < 0.001 | 12.001 | < 0.001 | ||||||||||||||
| 2 km/h Amp - 2 km/h Ctrl | 0.728 | 0.978 | -1.984 | 0.357 | 0.825 | 0.962 | 0.199 | 1.000 | -1.035 | 0.905 | -1.192 | 0.840 | -2.103 | 0.292 | ||||||||||||||
| 2 km/h Amp - 3 km/h Ctrl | 0.094 | 1.000 | -2.160 | 0.264 | -1.972 | 0.364 | -1.057 | 0.897 | -0.299 | 1.000 | -2.410 | 0.160 | -3.613 | 0.006 | ||||||||||||||
| 3 km/h Amp - 1 km/h Ctrl | 11.210 | < 0.001 | 12.060 | < 0.001 | 12.460 | < 0.001 | 7.876 | < 0.001 | 10.630 | < 0.001 | 11.923 | < 0.001 | 13.667 | < 0.001 | ||||||||||||||
| 3 km/h Amp - 2 km/h Ctrl | 0.505 | 0.996 | -0.259 | 1.000 | 1.918 | 0.396 | 1.496 | 0.667 | -0.938 | 0.936 | 0.100 | 1.000 | -0.558 | 0.993 | ||||||||||||||
| 3 km/h Amp - 3 km/h Ctrl | -0.133 | 1.000 | -0.435 | 0.998 | -0.897 | 0.947 | 0.233 | 1.000 | -0.197 | 1.000 | -1.128 | 0.869 | -2.081 | 0.304 | ||||||||||||||
| 1 km/h Ctrl - 2 km/h Ctrl | -13.776 | < 0.001 | -14.800 | < 0.001 | -14.195 | < 0.001 | -9.795 | < 0.001 | -13.717 | < 0.001 | -13.358 | < 0.001 | -16.479 | < 0.001 | ||||||||||||||
| 1 km/h Ctrl - 3 km/h Ctrl | -14.597 | < 0.001 | -15.012 | < 0.001 | -17.987 | < 0.001 | -11.734 | < 0.001 | -12.838 | < 0.001 | -14.746 | < 0.001 | -18.243 | < 0.001 | ||||||||||||||
| 2 km/h Ctrl - 3 km/h Ctrl | -0.821 | 0.963 | -0.212 | 1.000 | -3.791 | 0.003 | -1.939 | 0.383 | 0.879 | 0.951 | -1.388 | 0.734 | -1.764 | 0.493 | ||||||||||||||
| Contrast | Ampuatated Side Shoulder AP | T8 ML | Intact Side Fore Arm ML | Intact Side Upper Leg ML | Amputated Side Fore Arm ML | Intact Side Upper Arm ML | ||||||||||||||||||||||
| t.ratio | p.value | t.ratio | p.value | t.ratio | p.value | t.ratio | p.value | t.ratio | p.value | t.ratio | p.value | |||||||||||||||||
| 1 km/h Amp - 2 km/h Amp | -4.720 | < 0.001 | -6.786 | < 0.001 | -3.887 | 0.002 | -1.808 | 0.464 | -4.381 | < 0.001 | -4.302 | < 0.001 | ||||||||||||||||
| 1 km/h Amp - 3 km/h Amp | -6.036 | < 0.001 | -6.790 | < 0.001 | -4.785 | < 0.001 | -4.550 | < 0.001 | -5.488 | < 0.001 | -5.519 | < 0.001 | ||||||||||||||||
| 1 km/h Amp - 1 km/h Ctrl | 6.046 | < 0.001 | 5.209 | < 0.001 | 10.224 | < 0.001 | 3.847 | 0.002 | 6.006 | < 0.001 | 9.181 | < 0.001 | ||||||||||||||||
| 1 km/h Amp - 2 km/h Ctrl | -4.584 | < 0.001 | -5.725 | < 0.001 | -5.433 | < 0.001 | -2.448 | 0.148 | -6.718 | < 0.001 | -6.572 | < 0.001 | ||||||||||||||||
| 1 km/h Amp - 3 km/h Ctrl | -6.419 | < 0.001 | -7.572 | < 0.001 | -7.738 | < 0.001 | -4.485 | 0.000 | -8.447 | < 0.001 | -7.808 | < 0.001 | ||||||||||||||||
| 2 km/h Amp - 3 km/h Amp | -1.269 | 0.801 | 0.063 | 1.000 | -0.857 | 0.956 | -2.725 | 0.077 | -1.169 | 0.851 | -1.172 | 0.849 | ||||||||||||||||
| 2 km/h Amp - 1 km/h Ctrl | 10.049 | < 0.001 | 11.026 | < 0.001 | 14.151 | < 0.001 | 5.018 | 0.000 | 8.993 | < 0.001 | 13.375 | < 0.001 | ||||||||||||||||
| 2 km/h Amp - 2 km/h Ctrl | -0.582 | 0.992 | 0.092 | 1.000 | -1.506 | 0.661 | -1.277 | 0.797 | -2.706 | 0.081 | -2.378 | 0.172 | ||||||||||||||||
| 2 km/h Amp - 3 km/h Ctrl | -2.417 | 0.158 | -1.755 | 0.498 | -3.810 | 0.003 | -3.314 | 0.015 | -4.653 | < 0.001 | -3.614 | 0.006 | ||||||||||||||||
| 3 km/h Amp - 1 km/h Ctrl | 11.204 | < 0.001 | 11.063 | < 0.001 | 15.171 | < 0.001 | 6.799 | 0.000 | 9.682 | < 0.001 | 14.655 | < 0.001 | ||||||||||||||||
| 3 km/h Amp - 2 km/h Ctrl | 0.488 | 0.997 | 0.039 | 1.000 | -0.655 | 0.986 | 0.474 | 0.997 | -1.636 | 0.576 | -1.260 | 0.806 | ||||||||||||||||
| 3 km/h Amp - 3 km/h Ctrl | -1.362 | 0.750 | -1.823 | 0.455 | -2.984 | 0.039 | -1.573 | 0.618 | -3.633 | 0.005 | -2.509 | 0.129 | ||||||||||||||||
| 1 km/h Ctrl - 2 km/h Ctrl | -12.807 | < 0.001 | -13.029 | < 0.001 | -15.826 | < 0.001 | -9.929 | < 0.001 | -10.800 | < 0.001 | -16.508 | < 0.001 | ||||||||||||||||
| 1 km/h Ctrl - 3 km/h Ctrl | -15.017 | < 0.001 | -15.229 | < 0.001 | -18.155 | < 0.001 | -13.141 | < 0.001 | -11.883 | < 0.001 | -17.803 | < 0.001 | ||||||||||||||||
| 2 km/h Ctrl - 3 km/h Ctrl | -2.210 | 0.240 | -2.201 | 0.244 | -2.329 | 0.190 | -3.212 | 0.020 | -2.198 | 0.246 | -1.295 | 0.787 | ||||||||||||||||
Supplementary Table S6
All angular-velocity stability contrasts are retained. The table includes pelvis-VT even though its adjusted interaction in S2 is nonsignificant (p=0.109), so its caption’s description of only significant-interaction follow-ups does not fully explain selection.
| Amputated Side Foot AP | Amputated Side Upper Leg VT | Amputated Side Lower Leg ML | Pelvis VT | |||||
| Contrast | t.ratio | p.value | t.ratio | p.value | z.ratio | p.value | t.ratio | p.value |
| 1 km/h Amp - 2 km/h Amp | -6.094 | < 0.001 | -5.360 | < 0.001 | -4.790 | < 0.001 | -4.532 | < 0.001 |
| 1 km/h Amp - 3 km/h Amp | -6.728 | < 0.001 | -7.100 | < 0.001 | -5.520 | < 0.001 | -7.796 | < 0.001 |
| 1 km/h Amp - 1 km/h Ctrl | 4.243 | 0.001 | 2.083 | 0.302 | 3.693 | 0.003 | 1.864 | 0.429 |
| 1 km/h Amp - 2 km/h Ctrl | 3.068 | 0.031 | 1.744 | 0.505 | -0.826 | 0.963 | -1.811 | 0.462 |
| 1 km/h Amp - 3 km/h Ctrl | 2.115 | 0.286 | 1.131 | 0.868 | -2.535 | 0.114 | -3.359 | 0.013 |
| 2 km/h Amp - 3 km/h Amp | -0.555 | 0.994 | -1.737 | 0.510 | -0.647 | 0.987 | -3.172 | 0.023 |
| 2 km/h Amp - 1 km/h Ctrl | 7.267 | < 0.001 | 4.736 | < 0.001 | 5.901 | 0.000 | 4.142 | 0.001 |
| 2 km/h Amp - 2 km/h Ctrl | 6.095 | < 0.001 | 4.401 | < 0.001 | 1.394 | 0.731 | 0.478 | 0.997 |
| 2 km/h Amp - 3 km/h Ctrl | 5.145 | < 0.001 | 3.796 | 0.003 | -0.310 | 1.000 | -1.066 | 0.894 |
| 3 km/h Amp - 1 km/h Ctrl | 7.565 | < 0.001 | 5.531 | < 0.001 | 6.217 | < 0.001 | 5.758 | < 0.001 |
| 3 km/h Amp - 2 km/h Ctrl | 6.390 | < 0.001 | 5.196 | < 0.001 | 1.697 | 0.533 | 2.083 | 0.303 |
| 3 km/h Amp - 3 km/h Ctrl | 5.437 | < 0.001 | 4.594 | < 0.001 | -0.012 | 1.000 | 0.535 | 0.995 |
| 1 km/h Ctrl - 2 km/h Ctrl | -2.381 | 0.170 | -0.589 | 0.992 | -9.884 | < 0.001 | -7.359 | < 0.001 |
| 1 km/h Ctrl - 3 km/h Ctrl | -4.311 | < 0.001 | -1.672 | 0.553 | -13.629 | < 0.001 | -10.458 | < 0.001 |
| 2 km/h Ctrl - 3 km/h Ctrl | -1.930 | 0.389 | -1.086 | 0.886 | -3.743 | 0.003 | -3.099 | 0.028 |
Supplementary Table S7
All acceleration-entropy contrasts are retained. The source’s significance markings do not replace the full p-value column, and a stable-looking curve can still have a significant pairwise difference.
| Intact Side Shoulder ML | Intact Side Lower Leg AP | Intact Side Upper Leg VT | Amputated Side Lower Leg AP | Amputated Side Upper Leg VT | ||||||
| Contrast | z.ratio | p.value | t.ratio | p.value | t.ratio | p.value | t.ratio | p.value | t.ratio | p.value |
| 1 km/h Amp - 2 km/h Amp | -5.895 | < 0.001 | -0.562 | 0.993 | -2.317 | 0.194 | -4.606 | < 0.001 | -3.991 | 0.001 |
| 1 km/h Amp - 3 km/h Amp | -11.969 | < 0.001 | -1.863 | 0.43 | -3.679 | 0.004 | -5.463 | < 0.001 | -5.76 | < 0.001 |
| 1 km/h Amp - 1 km/h Ctrl | -2.705 | 0.074 | 3.324 | 0.014 | 3.154 | 0.024 | 1.481 | 0.677 | 0.491 | 0.996 |
| 1 km/h Amp - 2 km/h Ctrl | -4.526 | < 0.001 | 1.743 | 0.506 | 1.014 | 0.913 | -1.093 | 0.884 | -1.294 | 0.788 |
| 1 km/h Amp - 3 km/h Ctrl | -5.515 | < 0.001 | -0.093 | 1 | -0.632 | 0.988 | -3.179 | 0.022 | -2.348 | 0.183 |
| 2 km/h Amp - 3 km/h Amp | -6.399 | < 0.001 | -1.296 | 0.787 | -1.34 | 0.762 | -0.815 | 0.964 | -1.732 | 0.513 |
| 2 km/h Amp - 1 km/h Ctrl | -1.103 | 0.88 | 3.448 | 0.01 | 3.745 | 0.004 | 3.026 | 0.035 | 1.691 | 0.54 |
| 2 km/h Amp - 2 km/h Ctrl | -2.925 | 0.04 | 1.867 | 0.427 | 1.605 | 0.597 | 0.453 | 0.998 | -0.095 | 1 |
| 2 km/h Amp - 3 km/h Ctrl | -3.915 | 0.001 | 0.031 | 1 | -0.041 | 1 | -1.634 | 0.578 | -1.148 | 0.86 |
| 3 km/h Amp - 1 km/h Ctrl | 0.598 | 0.991 | 3.735 | 0.004 | 4.087 | 0.001 | 3.301 | 0.015 | 2.209 | 0.241 |
| 3 km/h Amp - 2 km/h Ctrl | -1.223 | 0.826 | 2.153 | 0.267 | 1.945 | 0.38 | 0.725 | 0.979 | 0.421 | 0.998 |
| 3 km/h Amp - 3 km/h Ctrl | -2.215 | 0.231 | 0.316 | 1 | 0.299 | 1 | -1.364 | 0.748 | -0.633 | 0.988 |
| 1 km/h Ctrl - 2 km/h Ctrl | -6.86 | < 0.001 | -7.295 | < 0.001 | -8.566 | < 0.001 | -7.834 | < 0.001 | -6.071 | < 0.001 |
| 1 km/h Ctrl - 3 km/h Ctrl | -10.442 | < 0.001 | -15.762 | < 0.001 | -15.153 | < 0.001 | -14.186 | < 0.001 | -9.651 | < 0.001 |
| 2 km/h Ctrl - 3 km/h Ctrl | -3.821 | 0.002 | -8.467 | < 0.001 | -6.587 | < 0.001 | -6.352 | < 0.001 | -3.58 | 0.006 |
Supplementary Table S8
All angular-velocity entropy contrasts are retained. None of the printed same-speed group comparisons is significant at 0.05; the claimed head-ML difference at 3 km/h in Figure 6’s caption is inconsistent with this table.
| Intact Side Shoulder AP | Intact Side Lower Leg VT | Amputated Side Lower Leg VT | Head ML | Amputated Side Upper Leg AP | ||||||
| Contrast | z.ratio | p.value | z.ratio | p.value | z.ratio | p.value | t.ratio | p.value | z.ratio | p.value |
| 1 km/h Amp - 2 km/h Amp | 1.207 | 0.834 | 0.728 | 0.979 | -0.472 | 0.997 | -5.981 | < 0.001 | 0.699 | 0.982 |
| 1 km/h Amp - 3 km/h Amp | -3.266 | 0.014 | 0.181 | 1 | -0.981 | 0.924 | -10.037 | < 0.001 | -0.93 | 0.939 |
| 1 km/h Amp - 1 km/h Ctrl | -0.549 | 0.994 | 2.412 | 0.152 | 1.031 | 0.908 | -1.219 | 0.827 | -1.273 | 0.8 |
| 1 km/h Amp - 2 km/h Ctrl | -0.85 | 0.958 | 2.012 | 0.335 | 0.467 | 0.997 | -2.505 | 0.131 | -2.552 | 0.109 |
| 1 km/h Amp - 3 km/h Ctrl | -1.634 | 0.576 | 1.666 | 0.554 | -0.236 | 1 | -3.058 | 0.032 | -2.671 | 0.081 |
| 2 km/h Amp - 3 km/h Amp | -4.61 | < 0.001 | -0.557 | 0.994 | -0.508 | 0.996 | -5.145 | < 0.001 | -1.639 | 0.572 |
| 2 km/h Amp - 1 km/h Ctrl | -0.869 | 0.954 | 2.335 | 0.18 | 1.101 | 0.881 | 1.067 | 0.894 | -1.4 | 0.727 |
| 2 km/h Amp - 2 km/h Ctrl | -1.171 | 0.851 | 1.936 | 0.38 | 0.538 | 0.995 | -0.222 | 1 | -2.679 | 0.079 |
| 2 km/h Amp - 3 km/h Ctrl | -1.955 | 0.369 | 1.59 | 0.605 | -0.165 | 1 | -0.784 | 0.97 | -2.798 | 0.058 |
| 3 km/h Amp - 1 km/h Ctrl | 0.31 | 1 | 2.393 | 0.159 | 1.176 | 0.848 | 2.408 | 0.162 | -1.103 | 0.88 |
| 3 km/h Amp - 2 km/h Ctrl | 0.009 | 1 | 1.994 | 0.346 | 0.613 | 0.99 | 1.13 | 0.868 | -2.383 | 0.162 |
| 3 km/h Amp - 3 km/h Ctrl | -0.776 | 0.972 | 1.648 | 0.567 | -0.09 | 1 | 0.569 | 0.993 | -2.502 | 0.124 |
| 1 km/h Ctrl - 2 km/h Ctrl | -1.033 | 0.907 | -3.379 | 0.009 | -3.348 | 0.011 | -3.668 | 0.005 | -6.198 | < 0.001 |
| 1 km/h Ctrl - 3 km/h Ctrl | -3.602 | 0.004 | -6.304 | < 0.001 | -7.489 | < 0.001 | -5.399 | < 0.001 | -6.759 | < 0.001 |
| 2 km/h Ctrl - 3 km/h Ctrl | -2.691 | 0.077 | -2.94 | 0.039 | -4.152 | < 0.001 | -1.936 | 0.386 | -0.577 | 0.993 |